Weslaco, TX
Weslaco Map
Weslaco Overview
40,858
TOTAL POPULATION
19,829
MALE POPULATION
21,029
FEMALE POPULATION
94.29
MALES / 100 FEMALES
106.05
FEMALES / 100 MALES
30.0
MEDIAN AGE
3.7
AVG FAMILY SIZE
3.2
AVG HOUSEHOLD SIZE
$21,672
PER CAPITA INCOME
$60,587
AVG FAMILY INCOME
$53,517
AVG HOUSEHOLD INCOME
24.5%
WAGE / INCOME GAP [ % ]
75.5¢/ $1
WAGE / INCOME GAP [ $ ]
$12,170
FAMILY INCOME DEFICIT
0.46
INEQUALITY / GINI INDEX
17,209
LABOR FORCE [ PEOPLE ]
58.9%
PERCENT IN LABOR FORCE
6.9%
UNEMPLOYMENT RATE
Weslaco Area Codes
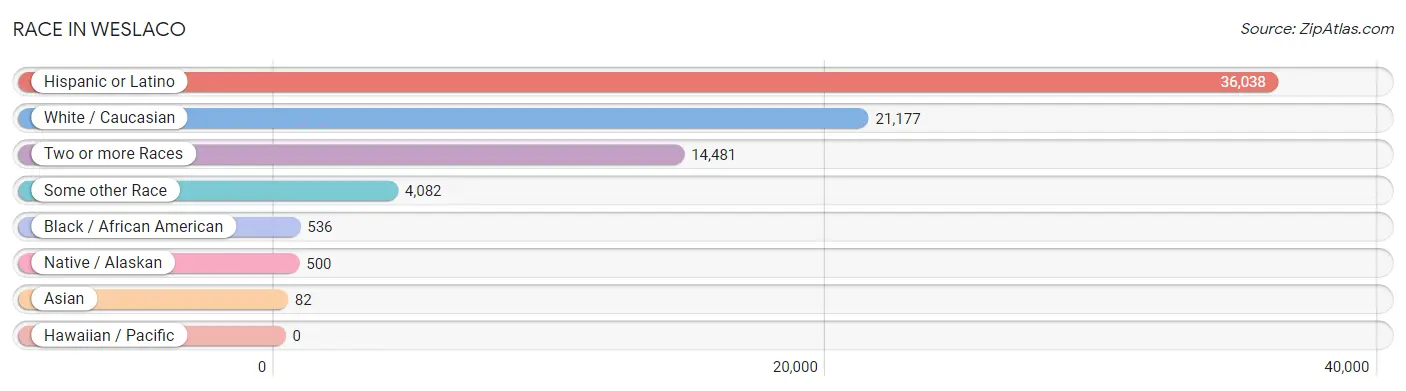
Race in Weslaco
The most populous races in Weslaco are Hispanic or Latino (36,038 | 88.2%), White / Caucasian (21,177 | 51.8%), and Two or more Races (14,481 | 35.4%).
| Race | # Population | % Population |
| Asian | 82 | 0.2% |
| Black / African American | 536 | 1.3% |
| Hawaiian / Pacific | 0 | 0.0% |
| Hispanic or Latino | 36,038 | 88.2% |
| Native / Alaskan | 500 | 1.2% |
| White / Caucasian | 21,177 | 51.8% |
| Two or more Races | 14,481 | 35.4% |
| Some other Race | 4,082 | 10.0% |
| Total | 40,858 | 100.0% |
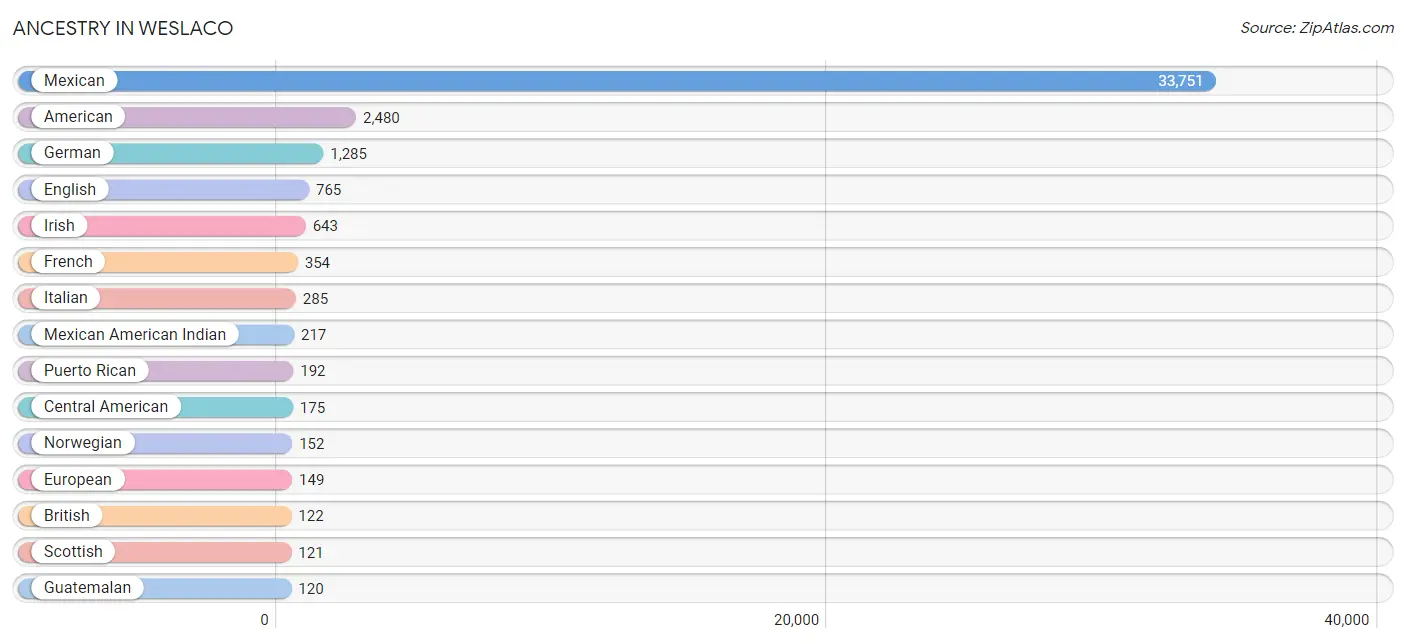
Ancestry in Weslaco
The most populous ancestries reported in Weslaco are Mexican (33,751 | 82.6%), American (2,480 | 6.1%), German (1,285 | 3.2%), English (765 | 1.9%), and Irish (643 | 1.6%), together accounting for 95.3% of all Weslaco residents.
| Ancestry | # Population | % Population |
| African | 54 | 0.1% |
| American | 2,480 | 6.1% |
| Apache | 20 | 0.1% |
| Arab | 10 | 0.0% |
| Armenian | 4 | 0.0% |
| Austrian | 18 | 0.0% |
| British | 122 | 0.3% |
| Burmese | 8 | 0.0% |
| Canadian | 71 | 0.2% |
| Central American | 175 | 0.4% |
| Central American Indian | 7 | 0.0% |
| Cherokee | 9 | 0.0% |
| Chippewa | 1 | 0.0% |
| Choctaw | 2 | 0.0% |
| Colombian | 22 | 0.1% |
| Costa Rican | 5 | 0.0% |
| Czech | 67 | 0.2% |
| Danish | 35 | 0.1% |
| Delaware | 90 | 0.2% |
| Dominican | 60 | 0.2% |
| Dutch | 84 | 0.2% |
| English | 765 | 1.9% |
| Ethiopian | 33 | 0.1% |
| European | 149 | 0.4% |
| Finnish | 42 | 0.1% |
| French | 354 | 0.9% |
| French Canadian | 15 | 0.0% |
| German | 1,285 | 3.2% |
| Greek | 9 | 0.0% |
| Guatemalan | 120 | 0.3% |
| Haitian | 34 | 0.1% |
| Honduran | 13 | 0.0% |
| Icelander | 12 | 0.0% |
| Indian (Asian) | 100 | 0.2% |
| Irish | 643 | 1.6% |
| Israeli | 16 | 0.0% |
| Italian | 285 | 0.7% |
| Kiowa | 34 | 0.1% |
| Korean | 11 | 0.0% |
| Lebanese | 10 | 0.0% |
| Mexican | 33,751 | 82.6% |
| Mexican American Indian | 217 | 0.5% |
| Northern European | 5 | 0.0% |
| Norwegian | 152 | 0.4% |
| Polish | 15 | 0.0% |
| Portuguese | 7 | 0.0% |
| Puerto Rican | 192 | 0.5% |
| Russian | 13 | 0.0% |
| Salvadoran | 37 | 0.1% |
| Scotch-Irish | 35 | 0.1% |
| Scottish | 121 | 0.3% |
| Slavic | 6 | 0.0% |
| South American | 22 | 0.1% |
| Spaniard | 9 | 0.0% |
| Spanish | 22 | 0.1% |
| Sri Lankan | 8 | 0.0% |
| Subsaharan African | 87 | 0.2% |
| Swedish | 65 | 0.2% |
| Swiss | 37 | 0.1% |
| Thai | 15 | 0.0% |
| Ukrainian | 64 | 0.2% |
| Vietnamese | 48 | 0.1% |
| Welsh | 60 | 0.2% | View All 63 Rows |
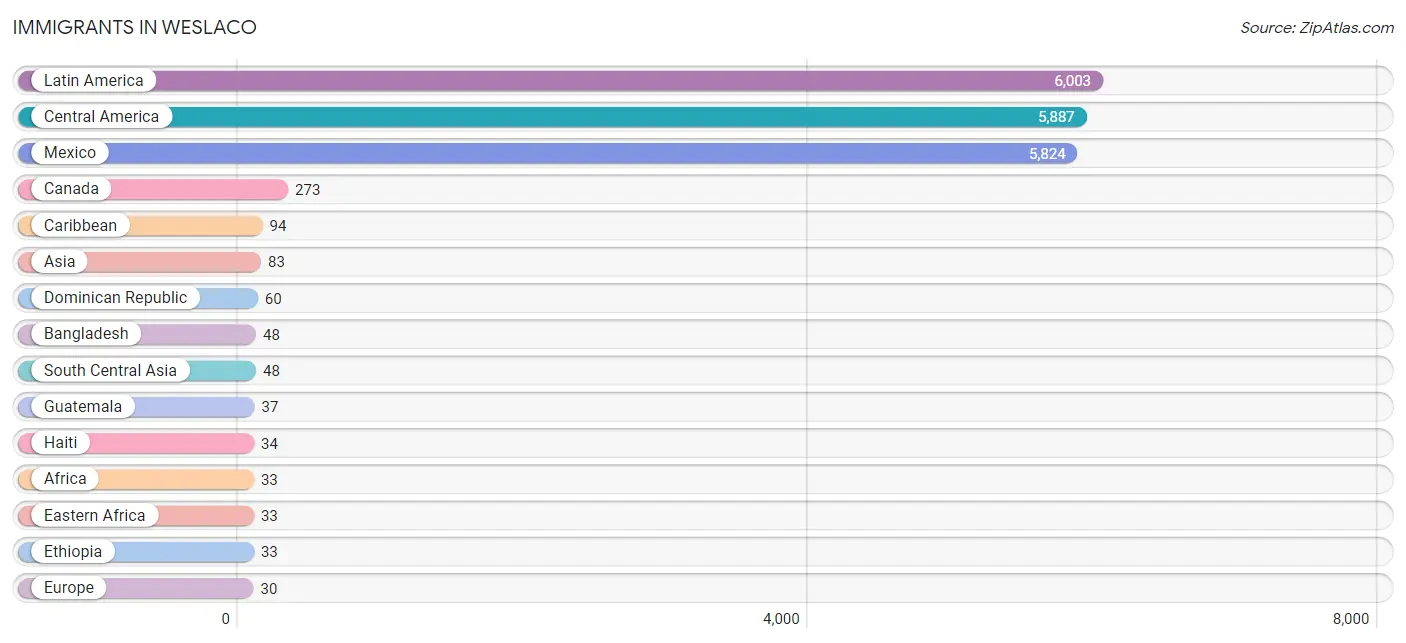
Immigrants in Weslaco
The most numerous immigrant groups reported in Weslaco came from Latin America (6,003 | 14.7%), Central America (5,887 | 14.4%), Mexico (5,824 | 14.2%), Canada (273 | 0.7%), and Caribbean (94 | 0.2%), together accounting for 44.3% of all Weslaco residents.
| Immigration Origin | # Population | % Population |
| Africa | 33 | 0.1% |
| Asia | 83 | 0.2% |
| Bangladesh | 48 | 0.1% |
| Canada | 273 | 0.7% |
| Caribbean | 94 | 0.2% |
| Central America | 5,887 | 14.4% |
| Colombia | 22 | 0.1% |
| Costa Rica | 5 | 0.0% |
| Denmark | 9 | 0.0% |
| Dominican Republic | 60 | 0.2% |
| Eastern Africa | 33 | 0.1% |
| Ethiopia | 33 | 0.1% |
| Europe | 30 | 0.1% |
| Germany | 8 | 0.0% |
| Guatemala | 37 | 0.1% |
| Haiti | 34 | 0.1% |
| Honduras | 13 | 0.0% |
| Israel | 16 | 0.0% |
| Italy | 13 | 0.0% |
| Latin America | 6,003 | 14.7% |
| Mexico | 5,824 | 14.2% |
| Northern Europe | 9 | 0.0% |
| Panama | 8 | 0.0% |
| Philippines | 11 | 0.0% |
| South America | 22 | 0.1% |
| South Central Asia | 48 | 0.1% |
| South Eastern Asia | 19 | 0.1% |
| Southern Europe | 13 | 0.0% |
| Vietnam | 8 | 0.0% |
| Western Asia | 16 | 0.0% |
| Western Europe | 8 | 0.0% | View All 31 Rows |
Sex and Age in Weslaco
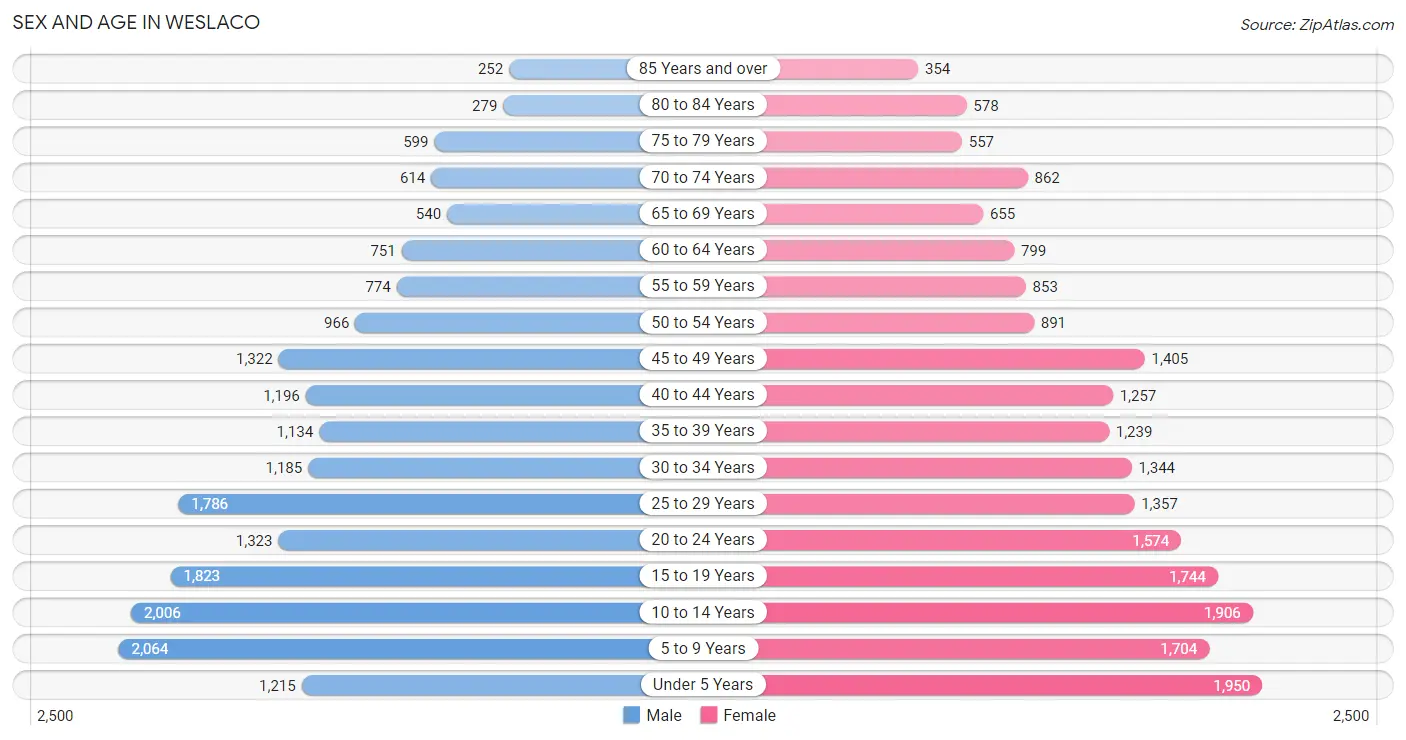
Sex and Age in Weslaco
The most populous age groups in Weslaco are 5 to 9 Years (2,064 | 10.4%) for men and Under 5 Years (1,950 | 9.3%) for women.
| Age Bracket | Male | Female |
| Under 5 Years | 1,215 (6.1%) | 1,950 (9.3%) |
| 5 to 9 Years | 2,064 (10.4%) | 1,704 (8.1%) |
| 10 to 14 Years | 2,006 (10.1%) | 1,906 (9.1%) |
| 15 to 19 Years | 1,823 (9.2%) | 1,744 (8.3%) |
| 20 to 24 Years | 1,323 (6.7%) | 1,574 (7.5%) |
| 25 to 29 Years | 1,786 (9.0%) | 1,357 (6.5%) |
| 30 to 34 Years | 1,185 (6.0%) | 1,344 (6.4%) |
| 35 to 39 Years | 1,134 (5.7%) | 1,239 (5.9%) |
| 40 to 44 Years | 1,196 (6.0%) | 1,257 (6.0%) |
| 45 to 49 Years | 1,322 (6.7%) | 1,405 (6.7%) |
| 50 to 54 Years | 966 (4.9%) | 891 (4.2%) |
| 55 to 59 Years | 774 (3.9%) | 853 (4.1%) |
| 60 to 64 Years | 751 (3.8%) | 799 (3.8%) |
| 65 to 69 Years | 540 (2.7%) | 655 (3.1%) |
| 70 to 74 Years | 614 (3.1%) | 862 (4.1%) |
| 75 to 79 Years | 599 (3.0%) | 557 (2.6%) |
| 80 to 84 Years | 279 (1.4%) | 578 (2.8%) |
| 85 Years and over | 252 (1.3%) | 354 (1.7%) |
| Total | 19,829 (100.0%) | 21,029 (100.0%) |
Families and Households in Weslaco
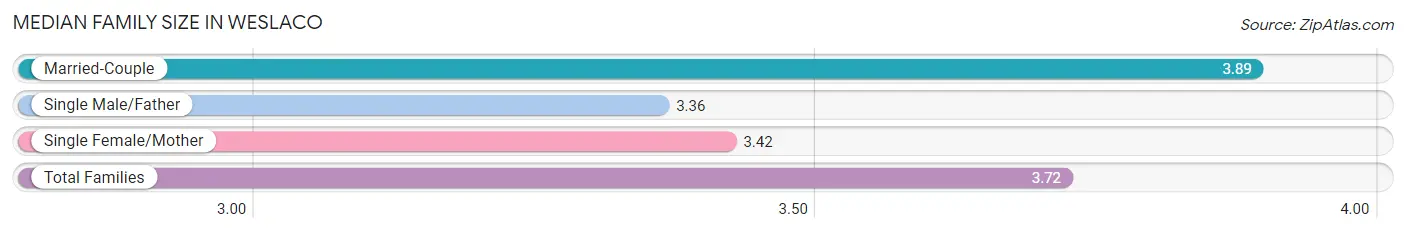
Median Family Size in Weslaco
The median family size in Weslaco is 3.72 persons per family, with married-couple families (6,383 | 64.9%) accounting for the largest median family size of 3.89 persons per family. On the other hand, single male/father families (624 | 6.3%) represent the smallest median family size with 3.36 persons per family.
| Family Type | # Families | Family Size |
| Married-Couple | 6,383 (64.9%) | 3.89 |
| Single Male/Father | 624 (6.3%) | 3.36 |
| Single Female/Mother | 2,831 (28.8%) | 3.42 |
| Total Families | 9,838 (100.0%) | 3.72 |
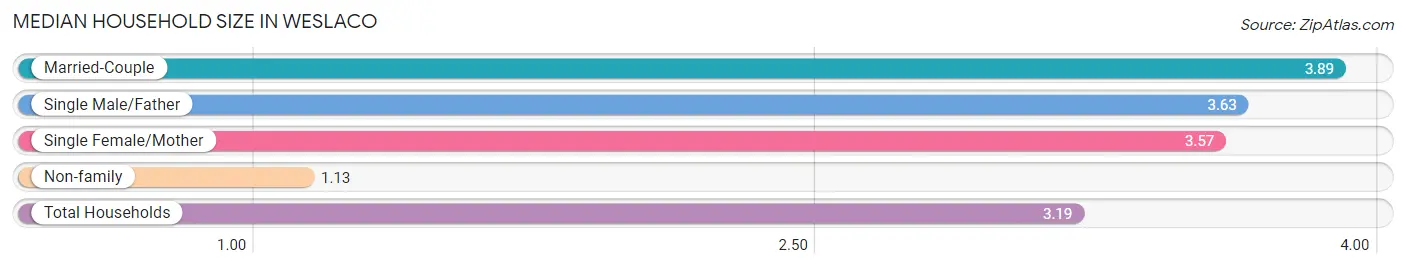
Median Household Size in Weslaco
The median household size in Weslaco is 3.19 persons per household, with married-couple households (6,383 | 50.4%) accounting for the largest median household size of 3.89 persons per household. non-family households (2,830 | 22.3%) represent the smallest median household size with 1.13 persons per household.
| Household Type | # Households | Household Size |
| Married-Couple | 6,383 (50.4%) | 3.89 |
| Single Male/Father | 624 (4.9%) | 3.63 |
| Single Female/Mother | 2,831 (22.4%) | 3.57 |
| Non-family | 2,830 (22.3%) | 1.13 |
| Total Households | 12,668 (100.0%) | 3.19 |
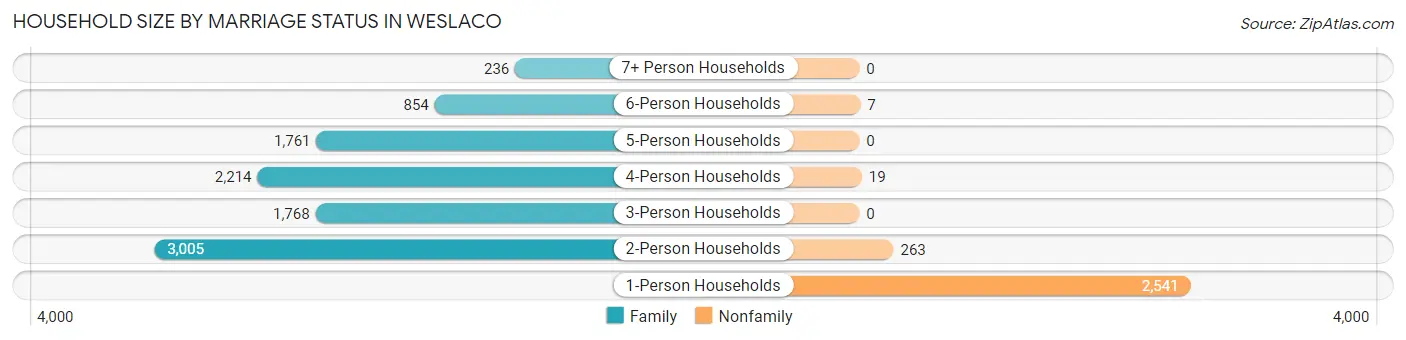
Household Size by Marriage Status in Weslaco
Out of a total of 12,668 households in Weslaco, 9,838 (77.7%) are family households, while 2,830 (22.3%) are nonfamily households. The most numerous type of family households are 2-person households, comprising 3,005, and the most common type of nonfamily households are 1-person households, comprising 2,541.
| Household Size | Family Households | Nonfamily Households |
| 1-Person Households | - | 2,541 (20.1%) |
| 2-Person Households | 3,005 (23.7%) | 263 (2.1%) |
| 3-Person Households | 1,768 (14.0%) | 0 (0.0%) |
| 4-Person Households | 2,214 (17.5%) | 19 (0.2%) |
| 5-Person Households | 1,761 (13.9%) | 0 (0.0%) |
| 6-Person Households | 854 (6.7%) | 7 (0.1%) |
| 7+ Person Households | 236 (1.9%) | 0 (0.0%) |
| Total | 9,838 (77.7%) | 2,830 (22.3%) |
Female Fertility in Weslaco
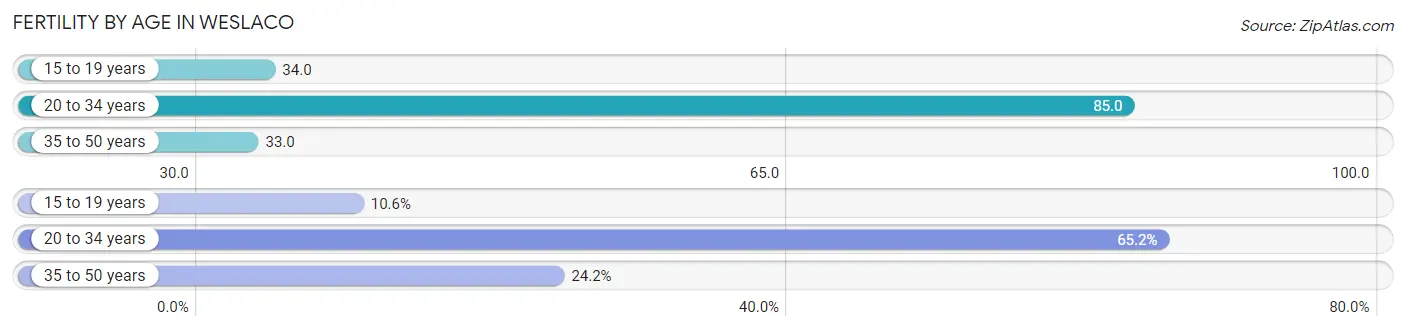
Fertility by Age in Weslaco
Average fertility rate in Weslaco is 55.0 births per 1,000 women. Women in the age bracket of 20 to 34 years have the highest fertility rate with 85.0 births per 1,000 women. Women in the age bracket of 20 to 34 years acount for 65.2% of all women with births.
| Age Bracket | Women with Births | Births / 1,000 Women |
| 15 to 19 years | 59 (10.6%) | 34.0 |
| 20 to 34 years | 364 (65.2%) | 85.0 |
| 35 to 50 years | 135 (24.2%) | 33.0 |
| Total | 558 (100.0%) | 55.0 |
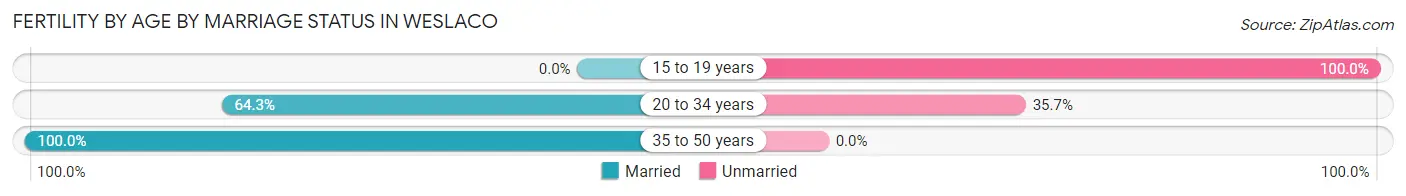
Fertility by Age by Marriage Status in Weslaco
66.1% of women with births (558) in Weslaco are married. The highest percentage of unmarried women with births falls into 15 to 19 years age bracket with 100.0% of them unmarried at the time of birth, while the lowest percentage of unmarried women with births belong to 35 to 50 years age bracket with 0.0% of them unmarried.
| Age Bracket | Married | Unmarried |
| 15 to 19 years | 0 (0.0%) | 59 (100.0%) |
| 20 to 34 years | 234 (64.3%) | 130 (35.7%) |
| 35 to 50 years | 135 (100.0%) | 0 (0.0%) |
| Total | 369 (66.1%) | 189 (33.9%) |
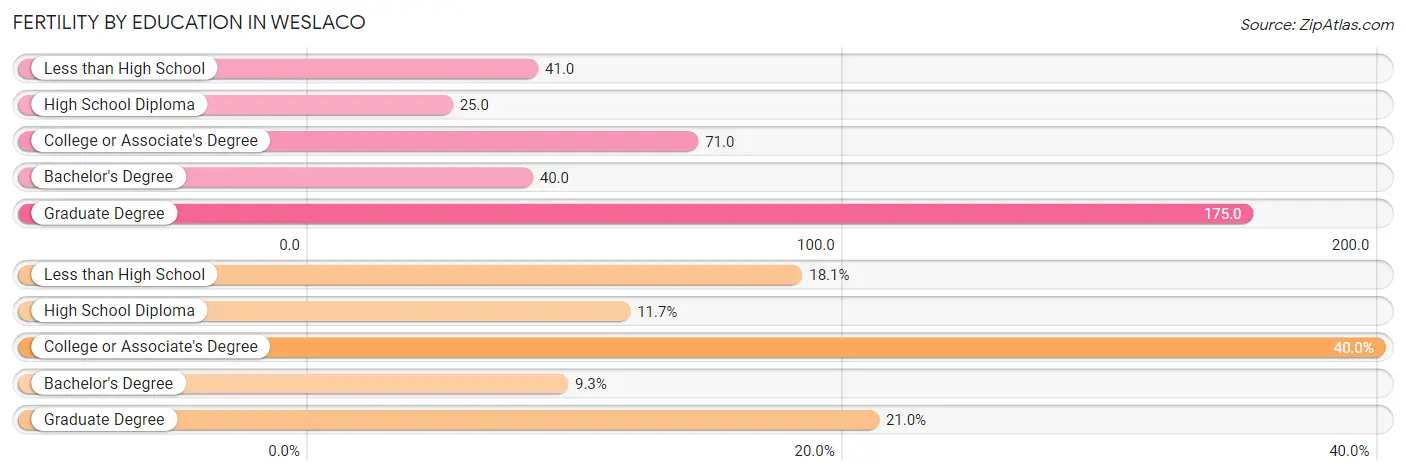
Fertility by Education in Weslaco
Average fertility rate in Weslaco is 55.0 births per 1,000 women. Women with the education attainment of graduate degree have the highest fertility rate of 175.0 births per 1,000 women, while women with the education attainment of high school diploma have the lowest fertility at 25.0 births per 1,000 women. Women with the education attainment of college or associate's degree represent 40.0% of all women with births.
| Educational Attainment | Women with Births | Births / 1,000 Women |
| Less than High School | 101 (18.1%) | 41.0 |
| High School Diploma | 65 (11.7%) | 25.0 |
| College or Associate's Degree | 223 (40.0%) | 71.0 |
| Bachelor's Degree | 52 (9.3%) | 40.0 |
| Graduate Degree | 117 (21.0%) | 175.0 |
| Total | 558 (100.0%) | 55.0 |
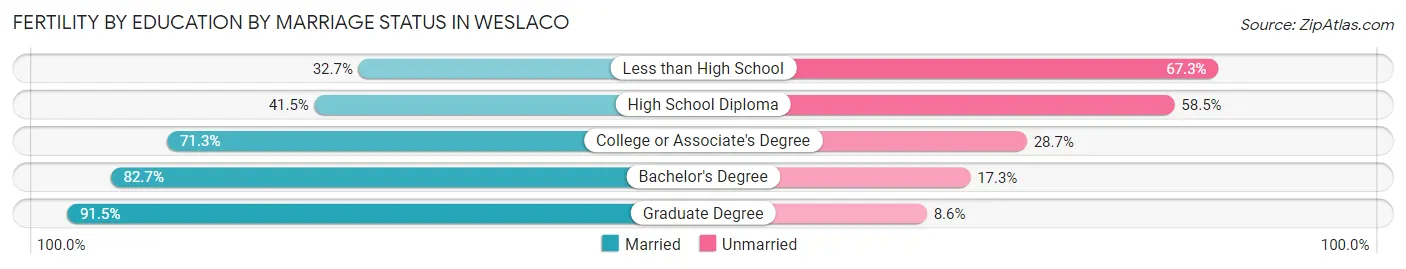
Fertility by Education by Marriage Status in Weslaco
33.9% of women with births in Weslaco are unmarried. Women with the educational attainment of graduate degree are most likely to be married with 91.4% of them married at childbirth, while women with the educational attainment of less than high school are least likely to be married with 67.3% of them unmarried at childbirth.
| Educational Attainment | Married | Unmarried |
| Less than High School | 33 (32.7%) | 68 (67.3%) |
| High School Diploma | 27 (41.5%) | 38 (58.5%) |
| College or Associate's Degree | 159 (71.3%) | 64 (28.7%) |
| Bachelor's Degree | 43 (82.7%) | 9 (17.3%) |
| Graduate Degree | 107 (91.4%) | 10 (8.6%) |
| Total | 369 (66.1%) | 189 (33.9%) |
Income in Weslaco
Income Overview in Weslaco
Per Capita Income in Weslaco is $21,672, while median incomes of families and households are $60,587 and $53,517 respectively.
| Characteristic | Number | Measure |
| Per Capita Income | 40,858 | $21,672 |
| Median Family Income | 9,838 | $60,587 |
| Mean Family Income | 9,838 | $72,992 |
| Median Household Income | 12,668 | $53,517 |
| Mean Household Income | 12,668 | $67,288 |
| Income Deficit | 9,838 | $12,170 |
| Wage / Income Gap (%) | 40,858 | 24.53% |
| Wage / Income Gap ($) | 40,858 | 75.47¢ per $1 |
| Gini / Inequality Index | 40,858 | 0.46 |
Earnings by Sex in Weslaco
Average Earnings in Weslaco are $31,391, $35,892 for men and $27,088 for women, a difference of 24.5%.
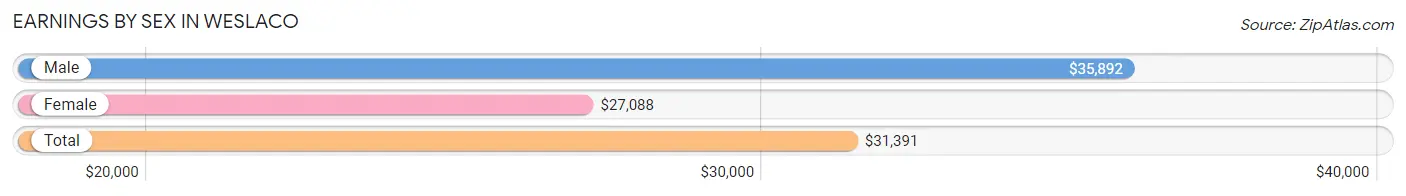
| Sex | Number | Average Earnings |
| Male | 9,538 (54.8%) | $35,892 |
| Female | 7,875 (45.2%) | $27,088 |
| Total | 17,413 (100.0%) | $31,391 |
Earnings by Sex by Income Bracket in Weslaco
The most common earnings brackets in Weslaco are $30,000 to $34,999 for men (856 | 9.0%) and $25,000 to $29,999 for women (953 | 12.1%).
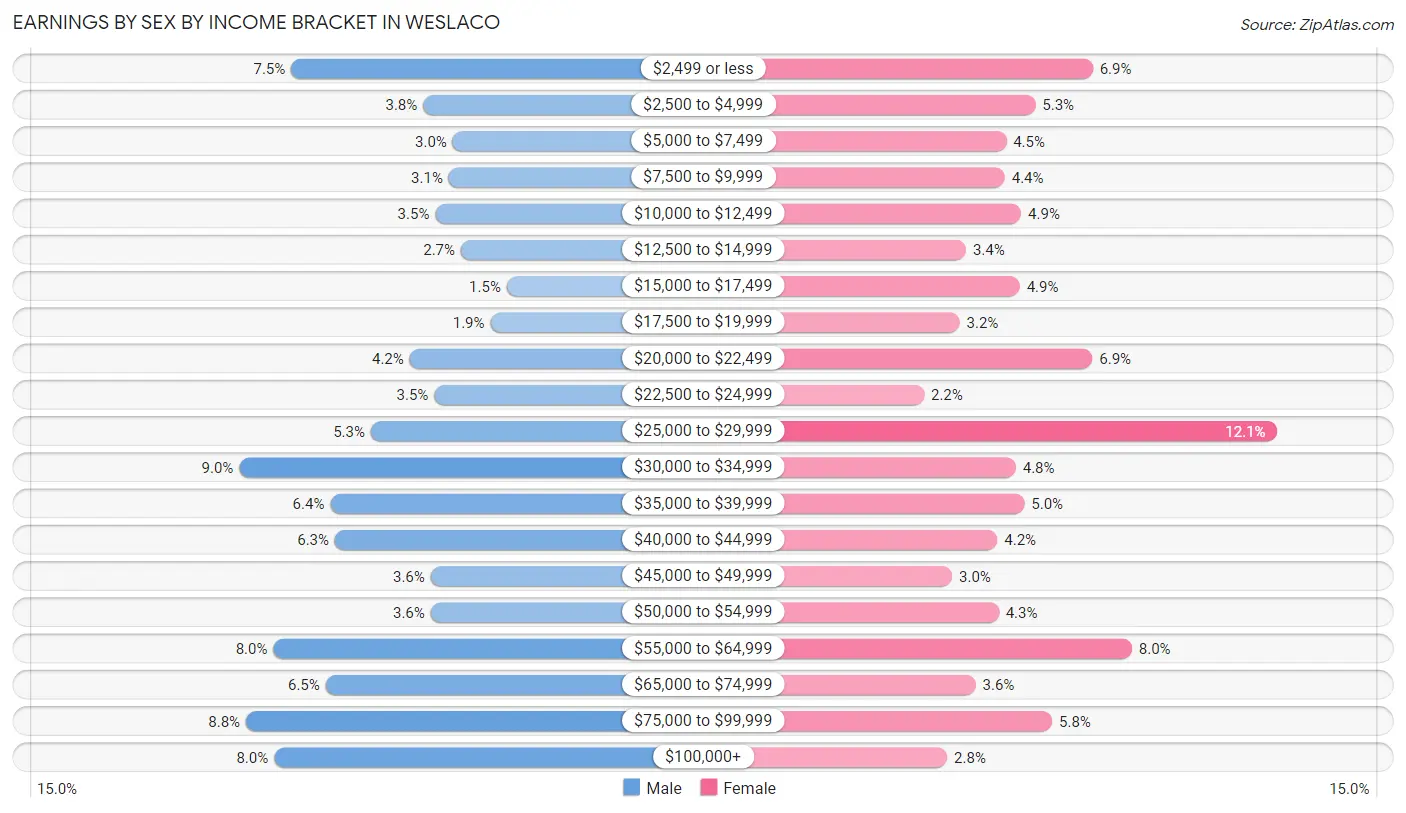
| Income | Male | Female |
| $2,499 or less | 716 (7.5%) | 544 (6.9%) |
| $2,500 to $4,999 | 362 (3.8%) | 417 (5.3%) |
| $5,000 to $7,499 | 283 (3.0%) | 353 (4.5%) |
| $7,500 to $9,999 | 294 (3.1%) | 350 (4.4%) |
| $10,000 to $12,499 | 330 (3.5%) | 386 (4.9%) |
| $12,500 to $14,999 | 261 (2.7%) | 264 (3.4%) |
| $15,000 to $17,499 | 138 (1.5%) | 383 (4.9%) |
| $17,500 to $19,999 | 182 (1.9%) | 250 (3.2%) |
| $20,000 to $22,499 | 399 (4.2%) | 543 (6.9%) |
| $22,500 to $24,999 | 333 (3.5%) | 171 (2.2%) |
| $25,000 to $29,999 | 503 (5.3%) | 953 (12.1%) |
| $30,000 to $34,999 | 856 (9.0%) | 374 (4.8%) |
| $35,000 to $39,999 | 611 (6.4%) | 393 (5.0%) |
| $40,000 to $44,999 | 599 (6.3%) | 333 (4.2%) |
| $45,000 to $49,999 | 342 (3.6%) | 233 (3.0%) |
| $50,000 to $54,999 | 342 (3.6%) | 336 (4.3%) |
| $55,000 to $64,999 | 764 (8.0%) | 631 (8.0%) |
| $65,000 to $74,999 | 624 (6.5%) | 285 (3.6%) |
| $75,000 to $99,999 | 837 (8.8%) | 454 (5.8%) |
| $100,000+ | 762 (8.0%) | 222 (2.8%) |
| Total | 9,538 (100.0%) | 7,875 (100.0%) |
Earnings by Sex by Educational Attainment in Weslaco
Average earnings in Weslaco are $41,474 for men and $29,532 for women, a difference of 28.8%. Men with an educational attainment of bachelor's degree enjoy the highest average annual earnings of $57,021, while those with less than high school education earn the least with $28,496. Women with an educational attainment of graduate degree earn the most with the average annual earnings of $67,759, while those with less than high school education have the smallest earnings of $16,503.
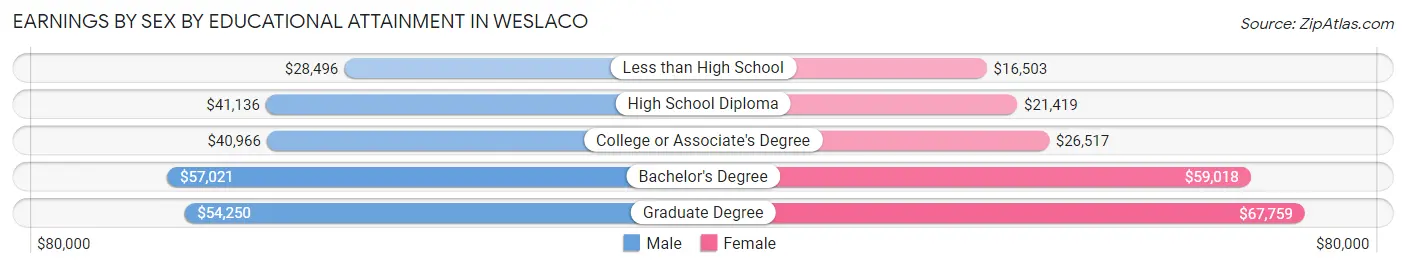
| Educational Attainment | Male Income | Female Income |
| Less than High School | $28,496 | $16,503 |
| High School Diploma | $41,136 | $21,419 |
| College or Associate's Degree | $40,966 | $26,517 |
| Bachelor's Degree | $57,021 | $59,018 |
| Graduate Degree | $54,250 | $67,759 |
| Total | $41,474 | $29,532 |
Family Income in Weslaco
Family Income Brackets in Weslaco
According to the Weslaco family income data, there are 1,958 families falling into the $50,000 to $74,999 income range, which is the most common income bracket and makes up 19.9% of all families. Conversely, the $200,000+ income bracket is the least frequent group with only 187 families (1.9%) belonging to this category.
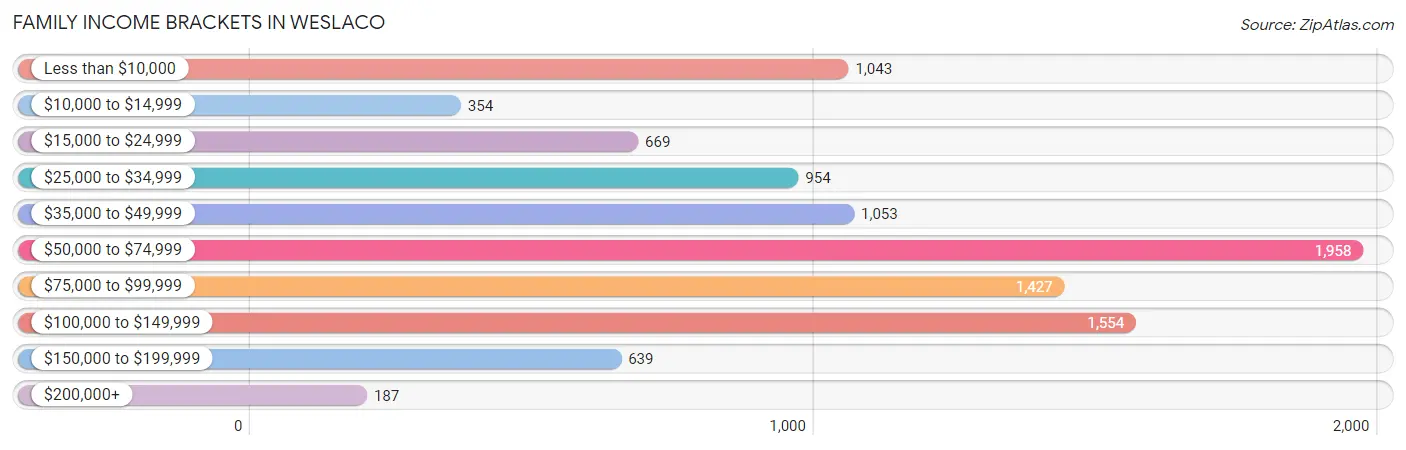
| Income Bracket | # Families | % Families |
| Less than $10,000 | 1,043 | 10.6% |
| $10,000 to $14,999 | 354 | 3.6% |
| $15,000 to $24,999 | 669 | 6.8% |
| $25,000 to $34,999 | 954 | 9.7% |
| $35,000 to $49,999 | 1,053 | 10.7% |
| $50,000 to $74,999 | 1,958 | 19.9% |
| $75,000 to $99,999 | 1,427 | 14.5% |
| $100,000 to $149,999 | 1,554 | 15.8% |
| $150,000 to $199,999 | 639 | 6.5% |
| $200,000+ | 187 | 1.9% |
Family Income by Famaliy Size in Weslaco
6-person families (810 | 8.2%) account for the highest median family income in Weslaco with $81,104 per family, while 2-person families (3,194 | 32.5%) have the highest median income of $22,112 per family member.
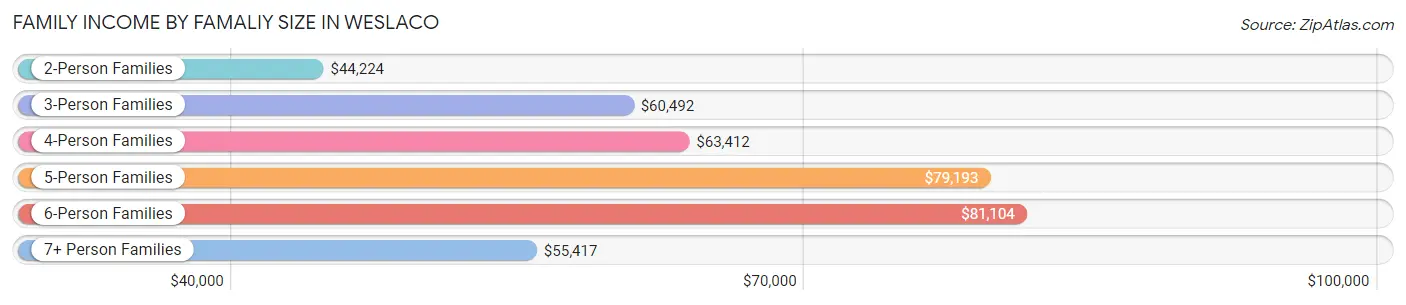
| Income Bracket | # Families | Median Income |
| 2-Person Families | 3,194 (32.5%) | $44,224 |
| 3-Person Families | 1,791 (18.2%) | $60,492 |
| 4-Person Families | 2,082 (21.2%) | $63,412 |
| 5-Person Families | 1,725 (17.5%) | $79,193 |
| 6-Person Families | 810 (8.2%) | $81,104 |
| 7+ Person Families | 236 (2.4%) | $55,417 |
| Total | 9,838 (100.0%) | $60,587 |
Family Income by Number of Earners in Weslaco
The median family income in Weslaco is $60,587, with families comprising 3+ earners (1,220) having the highest median family income of $100,893, while families with no earners (1,340) have the lowest median family income of $30,109, accounting for 12.4% and 13.6% of families, respectively.
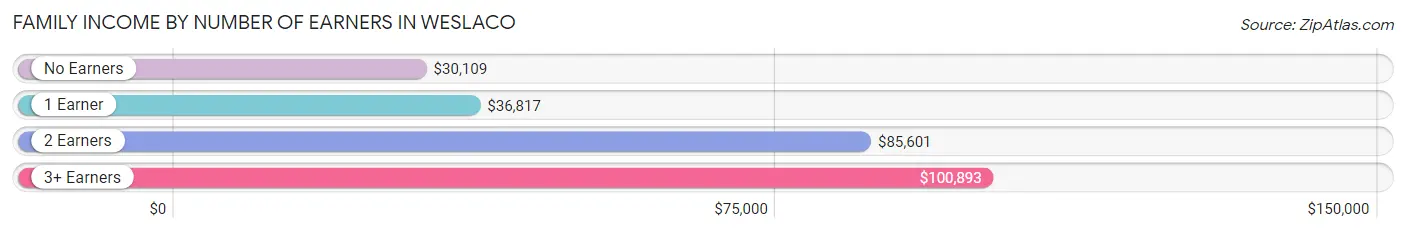
| Number of Earners | # Families | Median Income |
| No Earners | 1,340 (13.6%) | $30,109 |
| 1 Earner | 3,574 (36.3%) | $36,817 |
| 2 Earners | 3,704 (37.7%) | $85,601 |
| 3+ Earners | 1,220 (12.4%) | $100,893 |
| Total | 9,838 (100.0%) | $60,587 |
Household Income in Weslaco
Household Income Brackets in Weslaco
With 2,318 households falling in the category, the $50,000 to $74,999 income range is the most frequent in Weslaco, accounting for 18.3% of all households. In contrast, only 241 households (1.9%) fall into the $200,000+ income bracket, making it the least populous group.
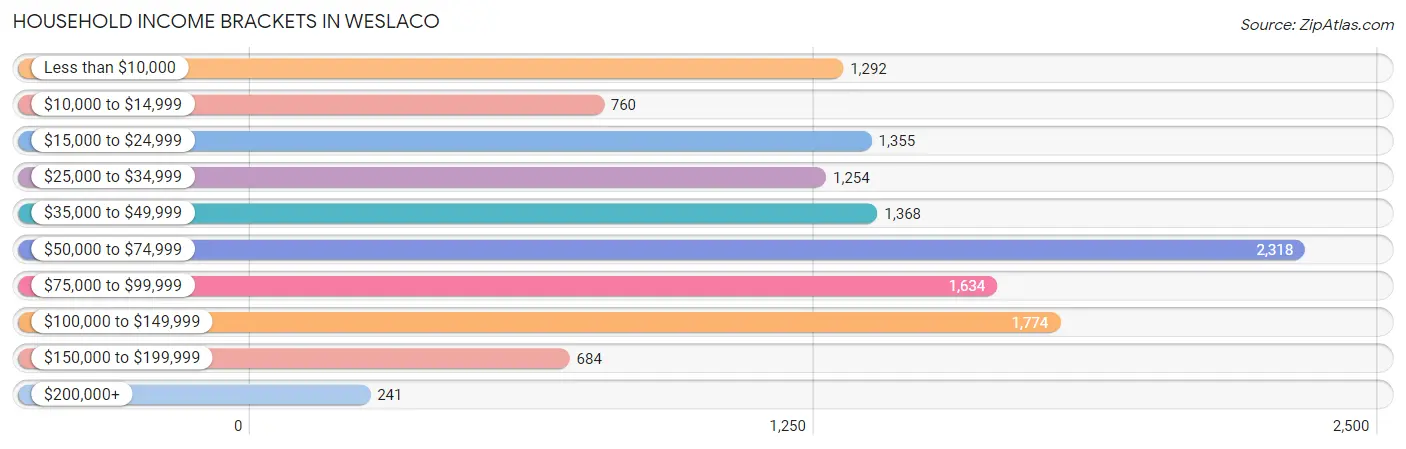
| Income Bracket | # Households | % Households |
| Less than $10,000 | 1,292 | 10.2% |
| $10,000 to $14,999 | 760 | 6.0% |
| $15,000 to $24,999 | 1,355 | 10.7% |
| $25,000 to $34,999 | 1,254 | 9.9% |
| $35,000 to $49,999 | 1,368 | 10.8% |
| $50,000 to $74,999 | 2,318 | 18.3% |
| $75,000 to $99,999 | 1,634 | 12.9% |
| $100,000 to $149,999 | 1,774 | 14.0% |
| $150,000 to $199,999 | 684 | 5.4% |
| $200,000+ | 241 | 1.9% |
Household Income by Householder Age in Weslaco
The median household income in Weslaco is $53,517, with the highest median household income of $62,142 found in the 45 to 64 years age bracket for the primary householder. A total of 4,395 households (34.7%) fall into this category. Meanwhile, the 15 to 24 years age bracket for the primary householder has the lowest median household income of $27,857, with 376 households (3.0%) in this group.
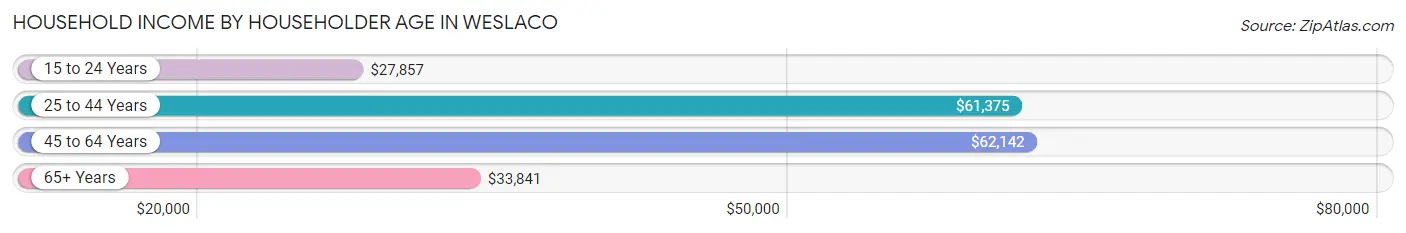
| Income Bracket | # Households | Median Income |
| 15 to 24 Years | 376 (3.0%) | $27,857 |
| 25 to 44 Years | 4,636 (36.6%) | $61,375 |
| 45 to 64 Years | 4,395 (34.7%) | $62,142 |
| 65+ Years | 3,261 (25.7%) | $33,841 |
| Total | 12,668 (100.0%) | $53,517 |
Poverty in Weslaco
Income Below Poverty by Sex and Age in Weslaco
With 21.0% poverty level for males and 28.1% for females among the residents of Weslaco, under 5 year old males and 16 and 17 year old females are the most vulnerable to poverty, with 451 males (37.4%) and 483 females (46.2%) in their respective age groups living below the poverty level.
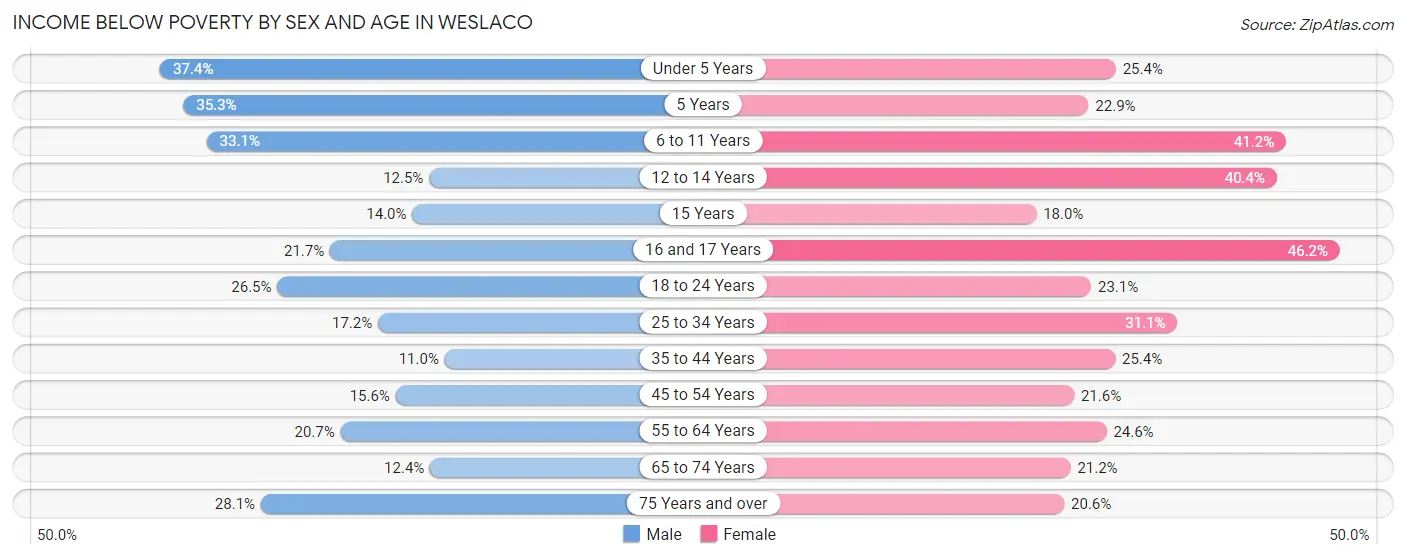
| Age Bracket | Male | Female |
| Under 5 Years | 451 (37.4%) | 486 (25.4%) |
| 5 Years | 146 (35.3%) | 84 (22.9%) |
| 6 to 11 Years | 754 (33.1%) | 886 (41.2%) |
| 12 to 14 Years | 171 (12.4%) | 432 (40.4%) |
| 15 Years | 66 (14.0%) | 57 (18.0%) |
| 16 and 17 Years | 150 (21.6%) | 483 (46.2%) |
| 18 to 24 Years | 516 (26.5%) | 449 (23.1%) |
| 25 to 34 Years | 511 (17.2%) | 841 (31.1%) |
| 35 to 44 Years | 256 (11.0%) | 633 (25.4%) |
| 45 to 54 Years | 354 (15.6%) | 494 (21.5%) |
| 55 to 64 Years | 305 (20.7%) | 403 (24.6%) |
| 65 to 74 Years | 136 (12.4%) | 312 (21.2%) |
| 75 Years and over | 295 (28.1%) | 286 (20.6%) |
| Total | 4,111 (21.0%) | 5,846 (28.1%) |
Income Above Poverty by Sex and Age in Weslaco
According to the poverty statistics in Weslaco, males aged 35 to 44 years and females aged 15 years are the age groups that are most secure financially, with 89.0% of males and 82.0% of females in these age groups living above the poverty line.
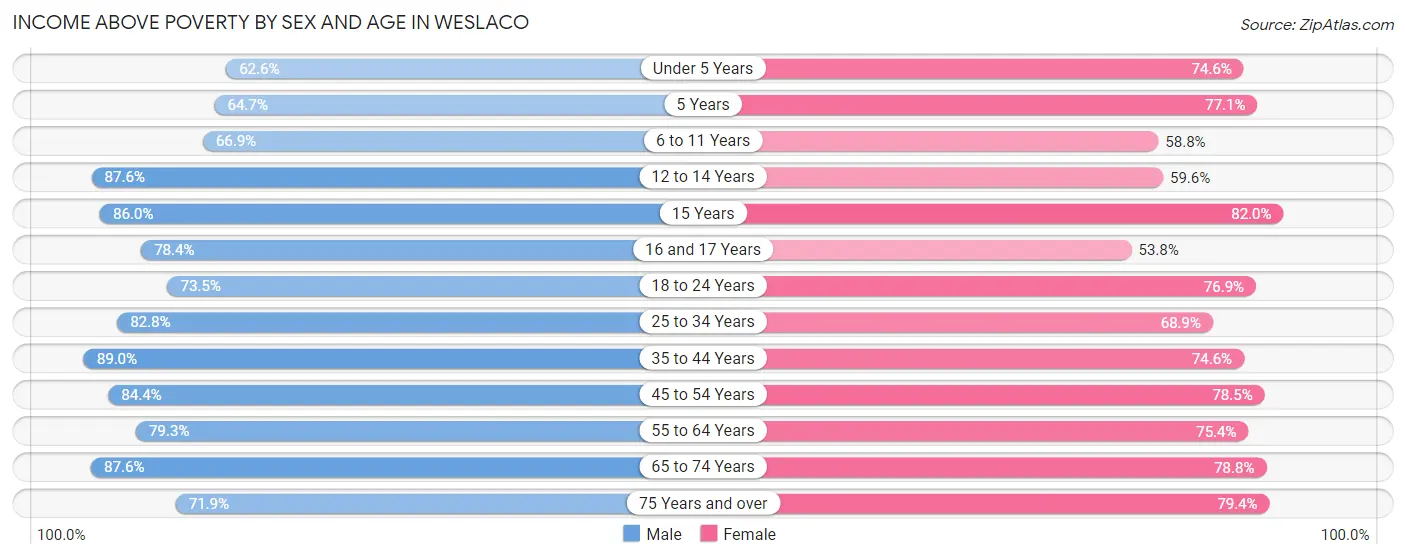
| Age Bracket | Male | Female |
| Under 5 Years | 754 (62.6%) | 1,426 (74.6%) |
| 5 Years | 268 (64.7%) | 283 (77.1%) |
| 6 to 11 Years | 1,524 (66.9%) | 1,263 (58.8%) |
| 12 to 14 Years | 1,202 (87.5%) | 638 (59.6%) |
| 15 Years | 405 (86.0%) | 259 (82.0%) |
| 16 and 17 Years | 543 (78.3%) | 562 (53.8%) |
| 18 to 24 Years | 1,428 (73.5%) | 1,492 (76.9%) |
| 25 to 34 Years | 2,460 (82.8%) | 1,860 (68.9%) |
| 35 to 44 Years | 2,070 (89.0%) | 1,863 (74.6%) |
| 45 to 54 Years | 1,921 (84.4%) | 1,798 (78.4%) |
| 55 to 64 Years | 1,170 (79.3%) | 1,238 (75.4%) |
| 65 to 74 Years | 964 (87.6%) | 1,158 (78.8%) |
| 75 Years and over | 756 (71.9%) | 1,100 (79.4%) |
| Total | 15,465 (79.0%) | 14,940 (71.9%) |
Income Below Poverty Among Married-Couple Families in Weslaco
The poverty statistics for married-couple families in Weslaco show that 14.8% or 943 of the total 6,383 families live below the poverty line. Families with 5 or more children have the highest poverty rate of 100.0%, comprising of 26 families. On the other hand, families with 1 or 2 children have the lowest poverty rate of 8.9%, which includes 197 families.
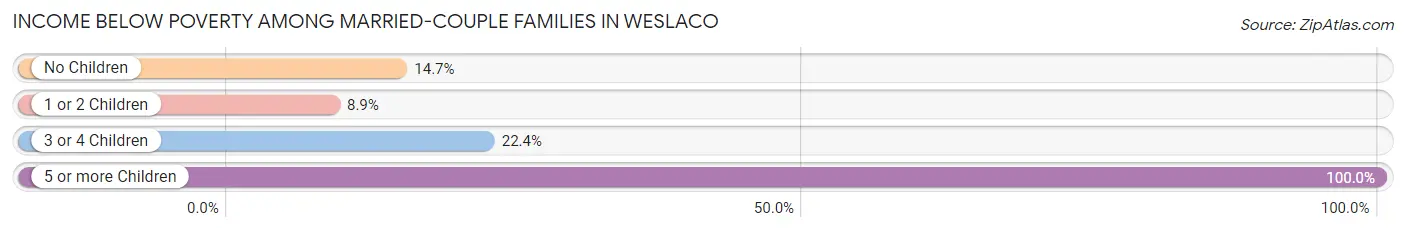
| Children | Above Poverty | Below Poverty |
| No Children | 2,296 (85.3%) | 397 (14.7%) |
| 1 or 2 Children | 2,022 (91.1%) | 197 (8.9%) |
| 3 or 4 Children | 1,122 (77.6%) | 323 (22.4%) |
| 5 or more Children | 0 (0.0%) | 26 (100.0%) |
| Total | 5,440 (85.2%) | 943 (14.8%) |
Income Below Poverty Among Single-Parent Households in Weslaco
According to the poverty data in Weslaco, 21.3% or 133 single-father households and 45.3% or 1,282 single-mother households are living below the poverty line. Among single-father households, those with 3 or 4 children have the highest poverty rate, with 21 households (58.3%) experiencing poverty. Likewise, among single-mother households, those with 5 or more children have the highest poverty rate, with 53 households (100.0%) falling below the poverty line.
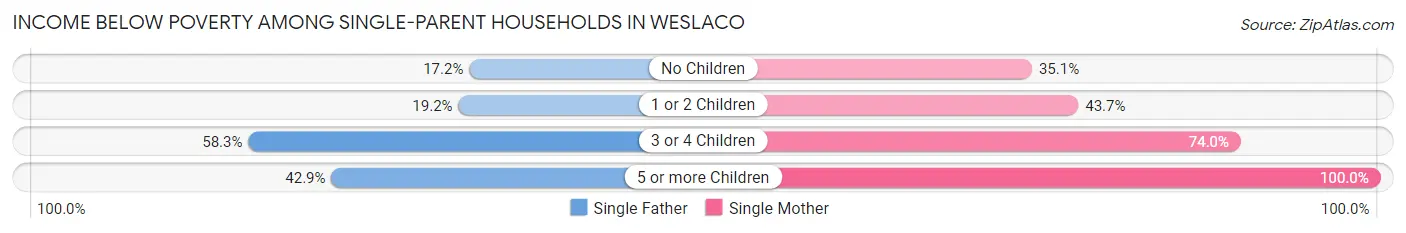
| Children | Single Father | Single Mother |
| No Children | 50 (17.2%) | 394 (35.1%) |
| 1 or 2 Children | 53 (19.2%) | 562 (43.7%) |
| 3 or 4 Children | 21 (58.3%) | 273 (74.0%) |
| 5 or more Children | 9 (42.9%) | 53 (100.0%) |
| Total | 133 (21.3%) | 1,282 (45.3%) |
Income Below Poverty Among Married-Couple vs Single-Parent Households in Weslaco
The poverty data for Weslaco shows that 943 of the married-couple family households (14.8%) and 1,415 of the single-parent households (41.0%) are living below the poverty level. Within the married-couple family households, those with 5 or more children have the highest poverty rate, with 26 households (100.0%) falling below the poverty line. Among the single-parent households, those with 5 or more children have the highest poverty rate, with 62 household (83.8%) living below poverty.
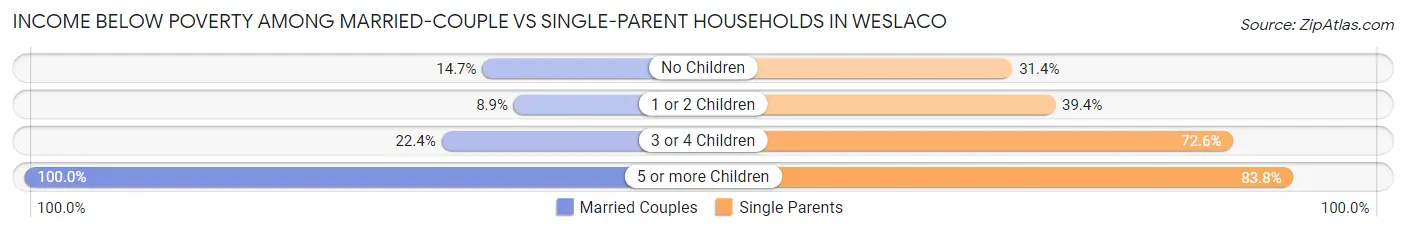
| Children | Married-Couple Families | Single-Parent Households |
| No Children | 397 (14.7%) | 444 (31.4%) |
| 1 or 2 Children | 197 (8.9%) | 615 (39.4%) |
| 3 or 4 Children | 323 (22.4%) | 294 (72.6%) |
| 5 or more Children | 26 (100.0%) | 62 (83.8%) |
| Total | 943 (14.8%) | 1,415 (41.0%) |
Employment Characteristics in Weslaco
Employment by Class of Employer in Weslaco
Among the 15,701 employed individuals in Weslaco, private company employees (9,693 | 61.7%), local government employees (1,718 | 10.9%), and state government employees (1,374 | 8.7%) make up the most common classes of employment.
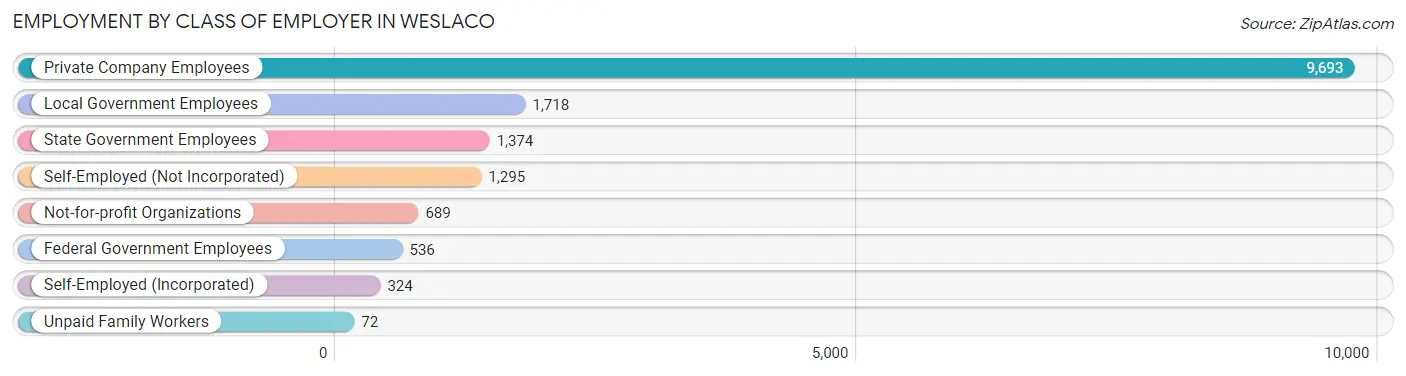
| Employer Class | # Employees | % Employees |
| Private Company Employees | 9,693 | 61.7% |
| Self-Employed (Incorporated) | 324 | 2.1% |
| Self-Employed (Not Incorporated) | 1,295 | 8.3% |
| Not-for-profit Organizations | 689 | 4.4% |
| Local Government Employees | 1,718 | 10.9% |
| State Government Employees | 1,374 | 8.7% |
| Federal Government Employees | 536 | 3.4% |
| Unpaid Family Workers | 72 | 0.5% |
| Total | 15,701 | 100.0% |
Employment Status by Age in Weslaco
According to the labor force statistics for Weslaco, out of the total population over 16 years of age (29,217), 58.9% or 17,209 individuals are in the labor force, with 6.9% or 1,187 of them unemployed. The age group with the highest labor force participation rate is 30 to 34 years, with 82.6% or 2,089 individuals in the labor force. Within the labor force, the 20 to 24 years age range has the highest percentage of unemployed individuals, with 14.8% or 305 of them being unemployed.
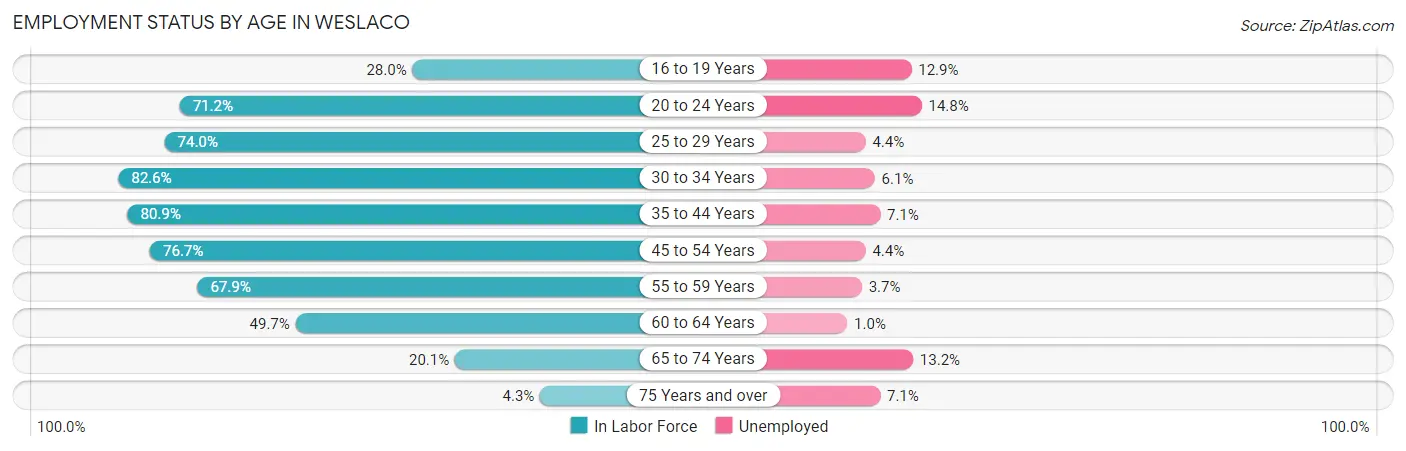
| Age Bracket | In Labor Force | Unemployed |
| 16 to 19 Years | 776 (28.0%) | 100 (12.9%) |
| 20 to 24 Years | 2,063 (71.2%) | 305 (14.8%) |
| 25 to 29 Years | 2,326 (74.0%) | 102 (4.4%) |
| 30 to 34 Years | 2,089 (82.6%) | 127 (6.1%) |
| 35 to 44 Years | 3,904 (80.9%) | 277 (7.1%) |
| 45 to 54 Years | 3,516 (76.7%) | 155 (4.4%) |
| 55 to 59 Years | 1,105 (67.9%) | 41 (3.7%) |
| 60 to 64 Years | 770 (49.7%) | 8 (1.0%) |
| 65 to 74 Years | 537 (20.1%) | 71 (13.2%) |
| 75 Years and over | 113 (4.3%) | 8 (7.1%) |
| Total | 17,209 (58.9%) | 1,187 (6.9%) |
Employment Status by Educational Attainment in Weslaco
According to labor force statistics for Weslaco, 75.1% of individuals (13,713) out of the total population between 25 and 64 years of age (18,259) are in the labor force, with 5.2% or 713 of them being unemployed. The group with the highest labor force participation rate are those with the educational attainment of bachelor's degree or higher, with 87.4% or 3,970 individuals in the labor force. Within the labor force, individuals with high school diploma education have the highest percentage of unemployment, with 10.4% or 349 of them being unemployed.
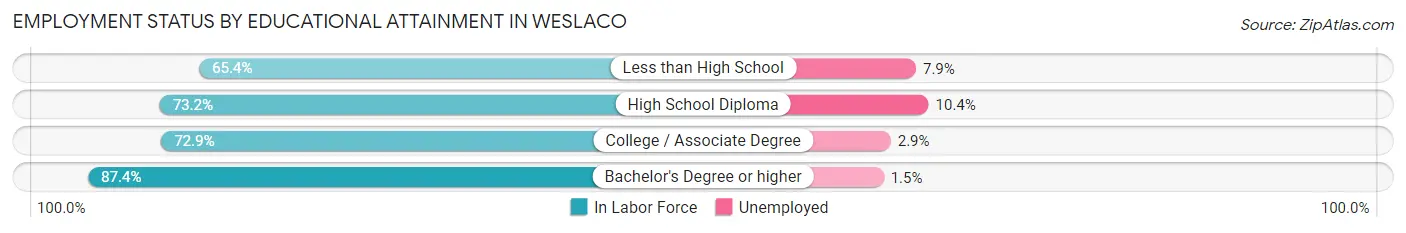
| Educational Attainment | In Labor Force | Unemployed |
| Less than High School | 2,362 (65.4%) | 285 (7.9%) |
| High School Diploma | 3,355 (73.2%) | 477 (10.4%) |
| College / Associate Degree | 4,026 (72.9%) | 160 (2.9%) |
| Bachelor's Degree or higher | 3,970 (87.4%) | 68 (1.5%) |
| Total | 13,713 (75.1%) | 949 (5.2%) |
Employment Occupations by Sex in Weslaco
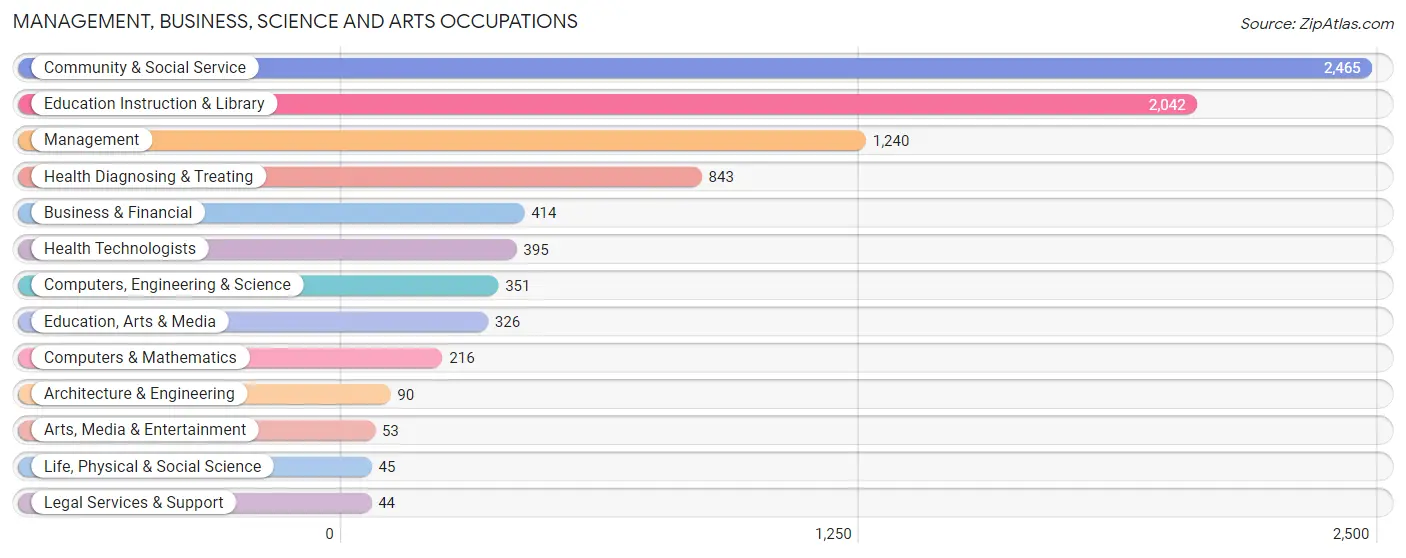
Management, Business, Science and Arts Occupations
The most common Management, Business, Science and Arts occupations in Weslaco are Community & Social Service (2,465 | 15.5%), Education Instruction & Library (2,042 | 12.9%), Management (1,240 | 7.8%), Health Diagnosing & Treating (843 | 5.3%), and Business & Financial (414 | 2.6%).
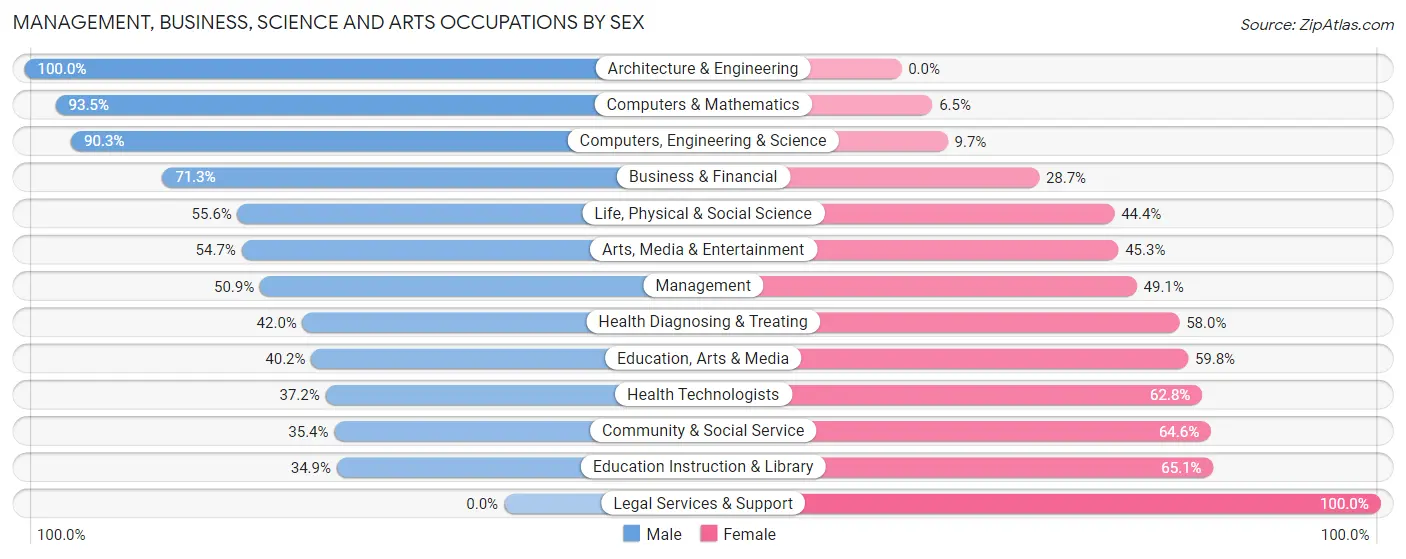
Management, Business, Science and Arts Occupations by Sex
Within the Management, Business, Science and Arts occupations in Weslaco, the most male-oriented occupations are Architecture & Engineering (100.0%), Computers & Mathematics (93.5%), and Computers, Engineering & Science (90.3%), while the most female-oriented occupations are Legal Services & Support (100.0%), Education Instruction & Library (65.1%), and Community & Social Service (64.6%).
| Occupation | Male | Female |
| Management | 631 (50.9%) | 609 (49.1%) |
| Business & Financial | 295 (71.3%) | 119 (28.7%) |
| Computers, Engineering & Science | 317 (90.3%) | 34 (9.7%) |
| Computers & Mathematics | 202 (93.5%) | 14 (6.5%) |
| Architecture & Engineering | 90 (100.0%) | 0 (0.0%) |
| Life, Physical & Social Science | 25 (55.6%) | 20 (44.4%) |
| Community & Social Service | 872 (35.4%) | 1,593 (64.6%) |
| Education, Arts & Media | 131 (40.2%) | 195 (59.8%) |
| Legal Services & Support | 0 (0.0%) | 44 (100.0%) |
| Education Instruction & Library | 712 (34.9%) | 1,330 (65.1%) |
| Arts, Media & Entertainment | 29 (54.7%) | 24 (45.3%) |
| Health Diagnosing & Treating | 354 (42.0%) | 489 (58.0%) |
| Health Technologists | 147 (37.2%) | 248 (62.8%) |
| Total (Category) | 2,469 (46.5%) | 2,844 (53.5%) |
| Total (Overall) | 8,895 (56.0%) | 6,999 (44.0%) |
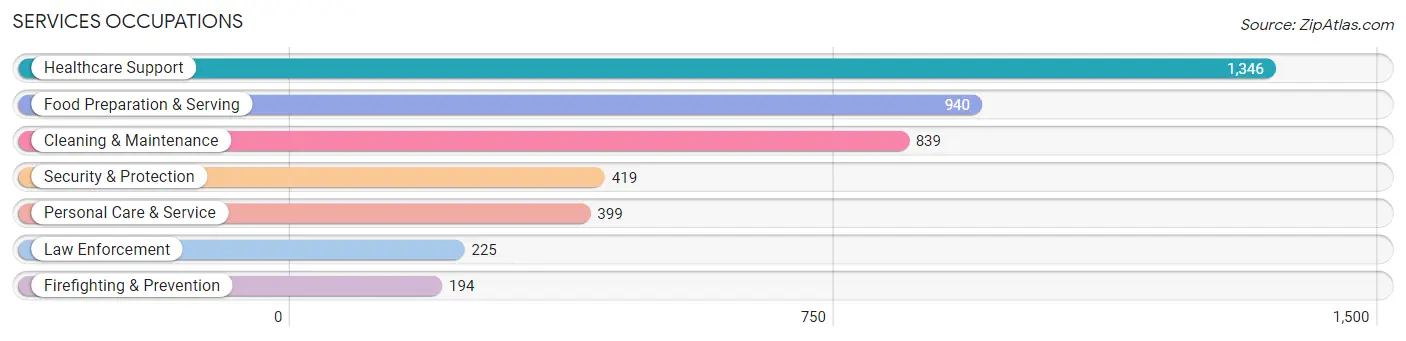
Services Occupations
The most common Services occupations in Weslaco are Healthcare Support (1,346 | 8.5%), Food Preparation & Serving (940 | 5.9%), Cleaning & Maintenance (839 | 5.3%), Security & Protection (419 | 2.6%), and Personal Care & Service (399 | 2.5%).
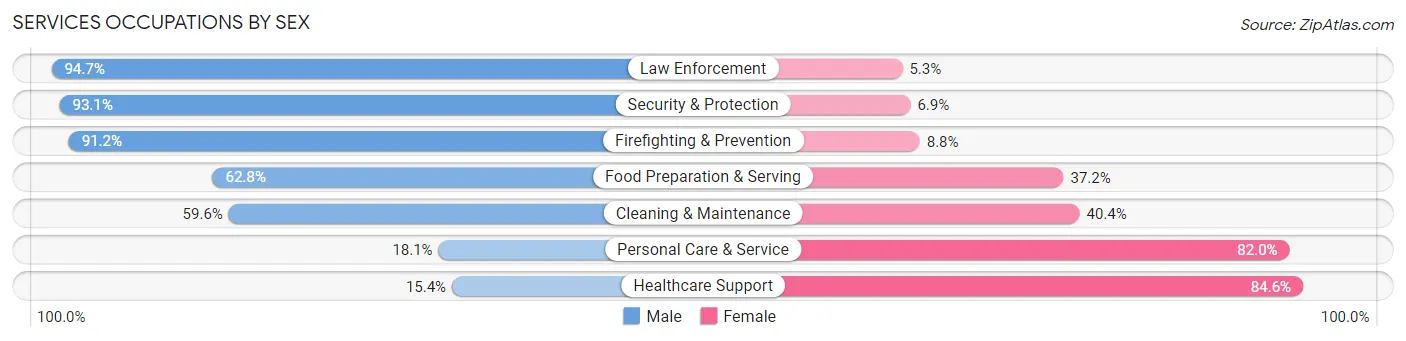
Services Occupations by Sex
Within the Services occupations in Weslaco, the most male-oriented occupations are Law Enforcement (94.7%), Security & Protection (93.1%), and Firefighting & Prevention (91.2%), while the most female-oriented occupations are Healthcare Support (84.6%), Personal Care & Service (82.0%), and Cleaning & Maintenance (40.4%).
| Occupation | Male | Female |
| Healthcare Support | 207 (15.4%) | 1,139 (84.6%) |
| Security & Protection | 390 (93.1%) | 29 (6.9%) |
| Firefighting & Prevention | 177 (91.2%) | 17 (8.8%) |
| Law Enforcement | 213 (94.7%) | 12 (5.3%) |
| Food Preparation & Serving | 590 (62.8%) | 350 (37.2%) |
| Cleaning & Maintenance | 500 (59.6%) | 339 (40.4%) |
| Personal Care & Service | 72 (18.0%) | 327 (82.0%) |
| Total (Category) | 1,759 (44.6%) | 2,184 (55.4%) |
| Total (Overall) | 8,895 (56.0%) | 6,999 (44.0%) |
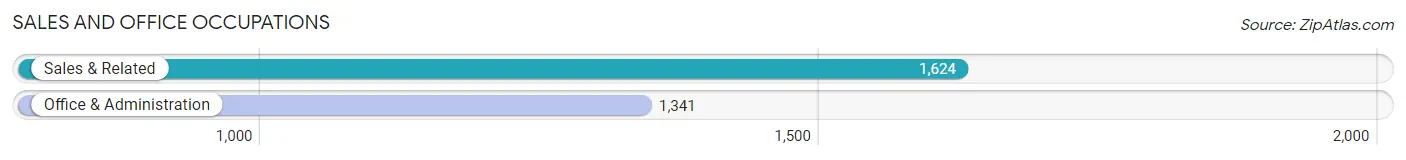
Sales and Office Occupations
The most common Sales and Office occupations in Weslaco are Sales & Related (1,624 | 10.2%), and Office & Administration (1,341 | 8.4%).
Sales and Office Occupations by Sex
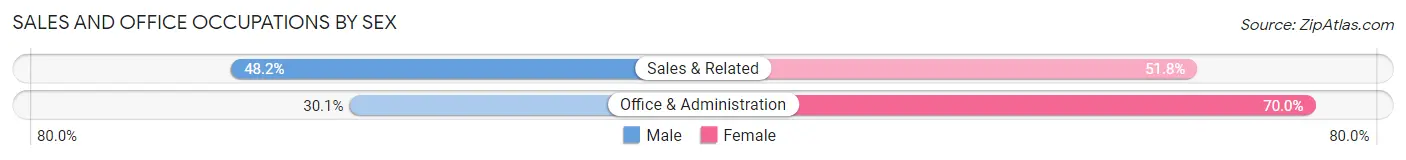
| Occupation | Male | Female |
| Sales & Related | 783 (48.2%) | 841 (51.8%) |
| Office & Administration | 403 (30.0%) | 938 (70.0%) |
| Total (Category) | 1,186 (40.0%) | 1,779 (60.0%) |
| Total (Overall) | 8,895 (56.0%) | 6,999 (44.0%) |
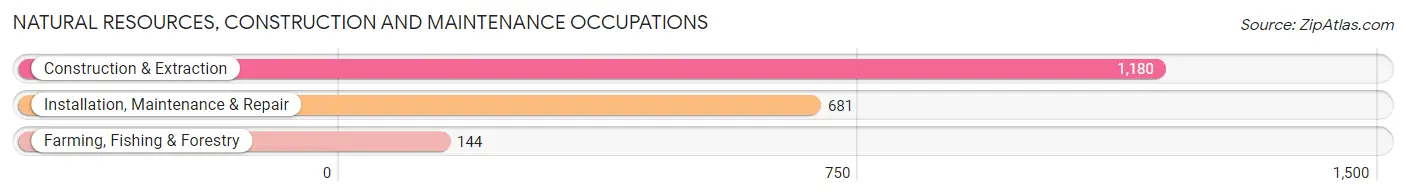
Natural Resources, Construction and Maintenance Occupations
The most common Natural Resources, Construction and Maintenance occupations in Weslaco are Construction & Extraction (1,180 | 7.4%), Installation, Maintenance & Repair (681 | 4.3%), and Farming, Fishing & Forestry (144 | 0.9%).
Natural Resources, Construction and Maintenance Occupations by Sex
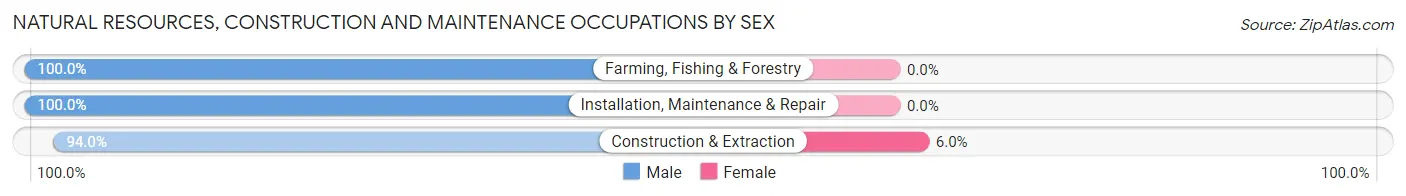
| Occupation | Male | Female |
| Farming, Fishing & Forestry | 144 (100.0%) | 0 (0.0%) |
| Construction & Extraction | 1,109 (94.0%) | 71 (6.0%) |
| Installation, Maintenance & Repair | 681 (100.0%) | 0 (0.0%) |
| Total (Category) | 1,934 (96.5%) | 71 (3.5%) |
| Total (Overall) | 8,895 (56.0%) | 6,999 (44.0%) |
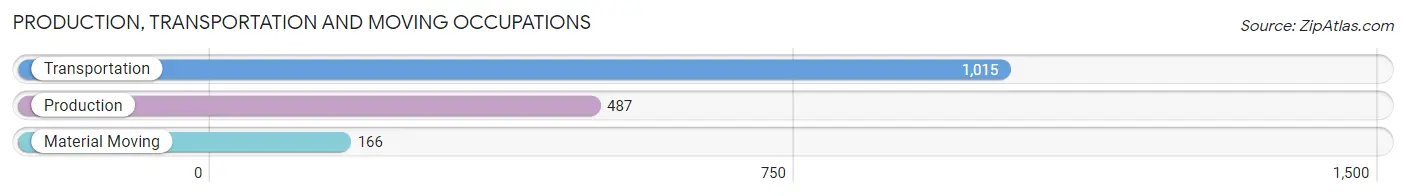
Production, Transportation and Moving Occupations
The most common Production, Transportation and Moving occupations in Weslaco are Transportation (1,015 | 6.4%), Production (487 | 3.1%), and Material Moving (166 | 1.0%).
Production, Transportation and Moving Occupations by Sex
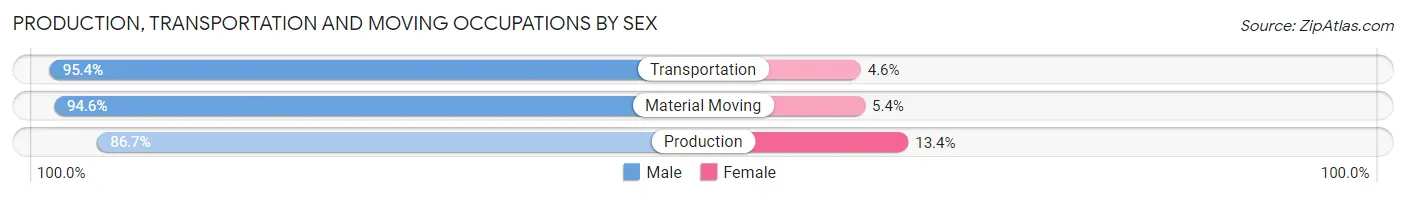
| Occupation | Male | Female |
| Production | 422 (86.7%) | 65 (13.4%) |
| Transportation | 968 (95.4%) | 47 (4.6%) |
| Material Moving | 157 (94.6%) | 9 (5.4%) |
| Total (Category) | 1,547 (92.7%) | 121 (7.2%) |
| Total (Overall) | 8,895 (56.0%) | 6,999 (44.0%) |
Employment Industries by Sex in Weslaco
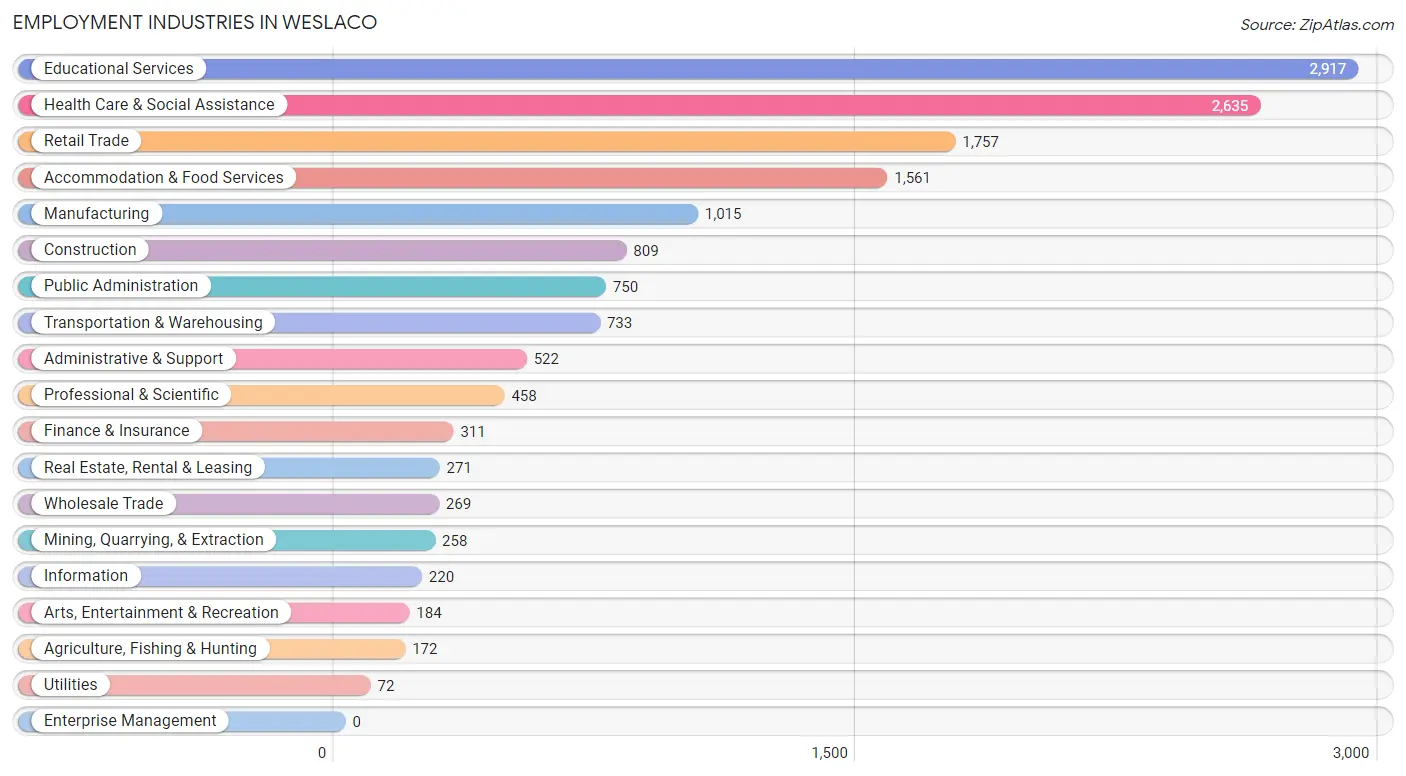
Employment Industries in Weslaco
The major employment industries in Weslaco include Educational Services (2,917 | 18.3%), Health Care & Social Assistance (2,635 | 16.6%), Retail Trade (1,757 | 11.1%), Accommodation & Food Services (1,561 | 9.8%), and Manufacturing (1,015 | 6.4%).
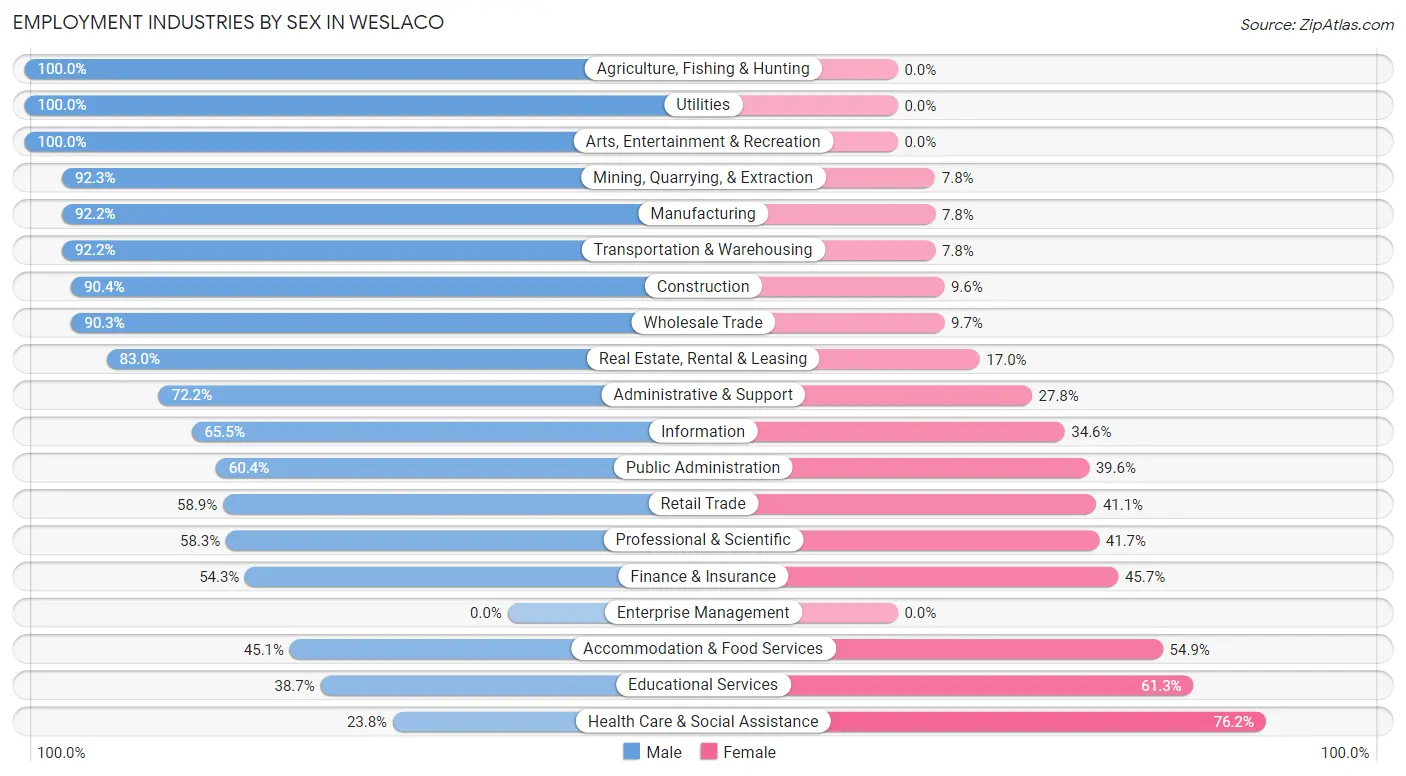
Employment Industries by Sex in Weslaco
The Weslaco industries that see more men than women are Agriculture, Fishing & Hunting (100.0%), Utilities (100.0%), and Arts, Entertainment & Recreation (100.0%), whereas the industries that tend to have a higher number of women are Health Care & Social Assistance (76.2%), Educational Services (61.3%), and Accommodation & Food Services (54.9%).
| Industry | Male | Female |
| Agriculture, Fishing & Hunting | 172 (100.0%) | 0 (0.0%) |
| Mining, Quarrying, & Extraction | 238 (92.2%) | 20 (7.7%) |
| Construction | 731 (90.4%) | 78 (9.6%) |
| Manufacturing | 936 (92.2%) | 79 (7.8%) |
| Wholesale Trade | 243 (90.3%) | 26 (9.7%) |
| Retail Trade | 1,035 (58.9%) | 722 (41.1%) |
| Transportation & Warehousing | 676 (92.2%) | 57 (7.8%) |
| Utilities | 72 (100.0%) | 0 (0.0%) |
| Information | 144 (65.4%) | 76 (34.5%) |
| Finance & Insurance | 169 (54.3%) | 142 (45.7%) |
| Real Estate, Rental & Leasing | 225 (83.0%) | 46 (17.0%) |
| Professional & Scientific | 267 (58.3%) | 191 (41.7%) |
| Enterprise Management | 0 (0.0%) | 0 (0.0%) |
| Administrative & Support | 377 (72.2%) | 145 (27.8%) |
| Educational Services | 1,130 (38.7%) | 1,787 (61.3%) |
| Health Care & Social Assistance | 626 (23.8%) | 2,009 (76.2%) |
| Arts, Entertainment & Recreation | 184 (100.0%) | 0 (0.0%) |
| Accommodation & Food Services | 704 (45.1%) | 857 (54.9%) |
| Public Administration | 453 (60.4%) | 297 (39.6%) |
| Total | 8,895 (56.0%) | 6,999 (44.0%) |
Education in Weslaco
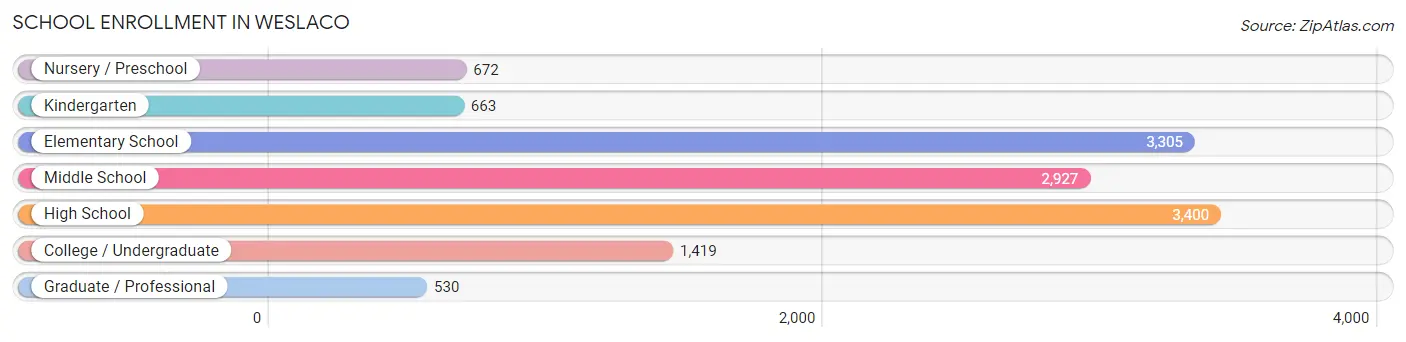
School Enrollment in Weslaco
The most common levels of schooling among the 12,916 students in Weslaco are high school (3,400 | 26.3%), elementary school (3,305 | 25.6%), and middle school (2,927 | 22.7%).
| School Level | # Students | % Students |
| Nursery / Preschool | 672 | 5.2% |
| Kindergarten | 663 | 5.1% |
| Elementary School | 3,305 | 25.6% |
| Middle School | 2,927 | 22.7% |
| High School | 3,400 | 26.3% |
| College / Undergraduate | 1,419 | 11.0% |
| Graduate / Professional | 530 | 4.1% |
| Total | 12,916 | 100.0% |
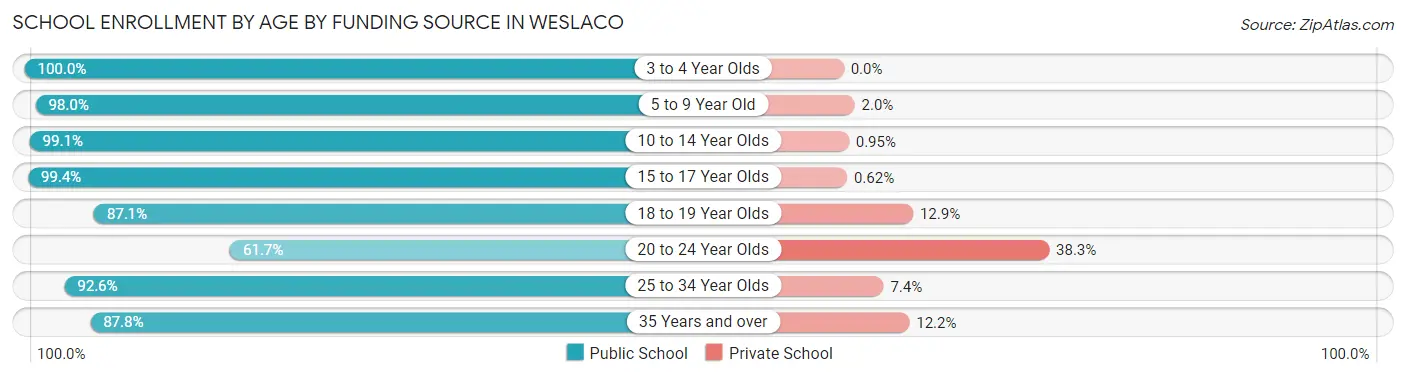
School Enrollment by Age by Funding Source in Weslaco
Out of a total of 12,916 students who are enrolled in schools in Weslaco, 594 (4.6%) attend a private institution, while the remaining 12,322 (95.4%) are enrolled in public schools. The age group of 20 to 24 year olds has the highest likelihood of being enrolled in private schools, with 274 (38.3% in the age bracket) enrolled. Conversely, the age group of 3 to 4 year olds has the lowest likelihood of being enrolled in a private school, with 502 (100.0% in the age bracket) attending a public institution.
| Age Bracket | Public School | Private School |
| 3 to 4 Year Olds | 502 (100.0%) | 0 (0.0%) |
| 5 to 9 Year Old | 3,517 (98.0%) | 73 (2.0%) |
| 10 to 14 Year Olds | 3,860 (99.1%) | 37 (0.9%) |
| 15 to 17 Year Olds | 2,414 (99.4%) | 15 (0.6%) |
| 18 to 19 Year Olds | 769 (87.1%) | 114 (12.9%) |
| 20 to 24 Year Olds | 442 (61.7%) | 274 (38.3%) |
| 25 to 34 Year Olds | 575 (92.6%) | 46 (7.4%) |
| 35 Years and over | 244 (87.8%) | 34 (12.2%) |
| Total | 12,322 (95.4%) | 594 (4.6%) |
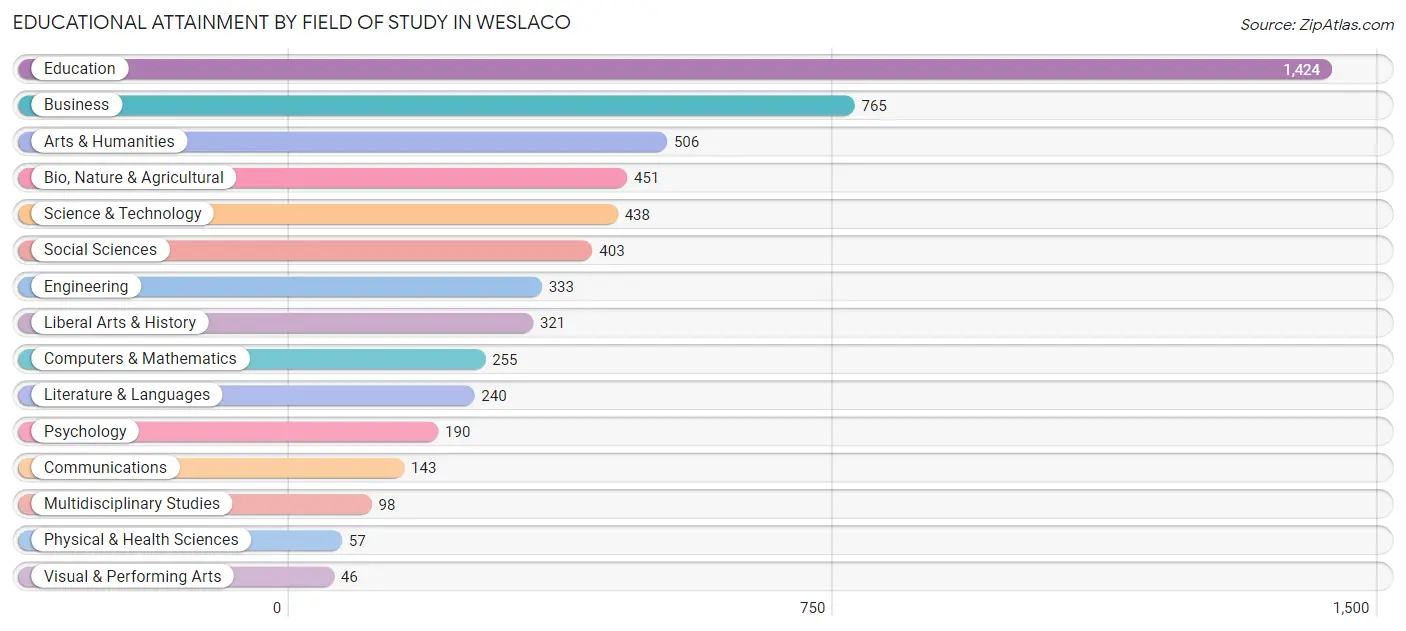
Educational Attainment by Field of Study in Weslaco
Education (1,424 | 25.1%), business (765 | 13.5%), arts & humanities (506 | 8.9%), bio, nature & agricultural (451 | 8.0%), and science & technology (438 | 7.7%) are the most common fields of study among 5,670 individuals in Weslaco who have obtained a bachelor's degree or higher.
| Field of Study | # Graduates | % Graduates |
| Computers & Mathematics | 255 | 4.5% |
| Bio, Nature & Agricultural | 451 | 8.0% |
| Physical & Health Sciences | 57 | 1.0% |
| Psychology | 190 | 3.4% |
| Social Sciences | 403 | 7.1% |
| Engineering | 333 | 5.9% |
| Multidisciplinary Studies | 98 | 1.7% |
| Science & Technology | 438 | 7.7% |
| Business | 765 | 13.5% |
| Education | 1,424 | 25.1% |
| Literature & Languages | 240 | 4.2% |
| Liberal Arts & History | 321 | 5.7% |
| Visual & Performing Arts | 46 | 0.8% |
| Communications | 143 | 2.5% |
| Arts & Humanities | 506 | 8.9% |
| Total | 5,670 | 100.0% |
Transportation & Commute in Weslaco
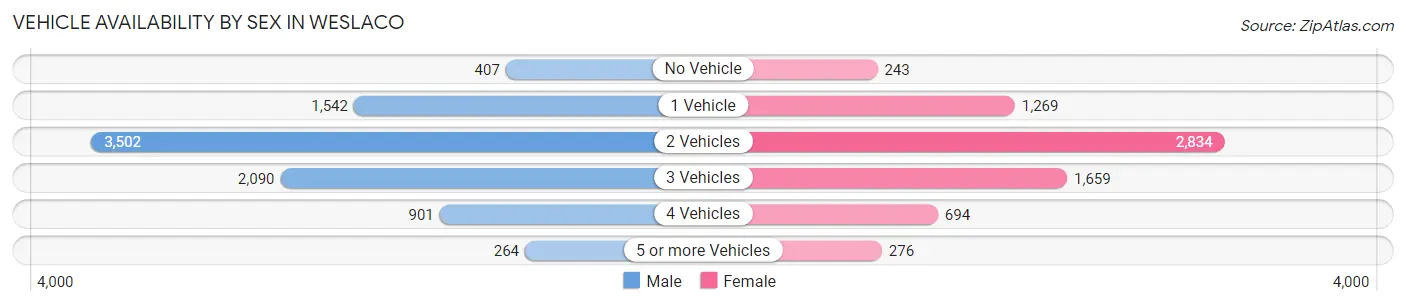
Vehicle Availability by Sex in Weslaco
The most prevalent vehicle ownership categories in Weslaco are males with 2 vehicles (3,502, accounting for 40.2%) and females with 2 vehicles (2,834, making up 50.2%).
| Vehicles Available | Male | Female |
| No Vehicle | 407 (4.7%) | 243 (3.5%) |
| 1 Vehicle | 1,542 (17.7%) | 1,269 (18.2%) |
| 2 Vehicles | 3,502 (40.2%) | 2,834 (40.6%) |
| 3 Vehicles | 2,090 (24.0%) | 1,659 (23.8%) |
| 4 Vehicles | 901 (10.3%) | 694 (10.0%) |
| 5 or more Vehicles | 264 (3.0%) | 276 (4.0%) |
| Total | 8,706 (100.0%) | 6,975 (100.0%) |
Commute Time in Weslaco
The most frequently occuring commute durations in Weslaco are 10 to 14 minutes (3,013 commuters, 20.6%), 15 to 19 minutes (2,653 commuters, 18.2%), and 5 to 9 minutes (2,350 commuters, 16.1%).
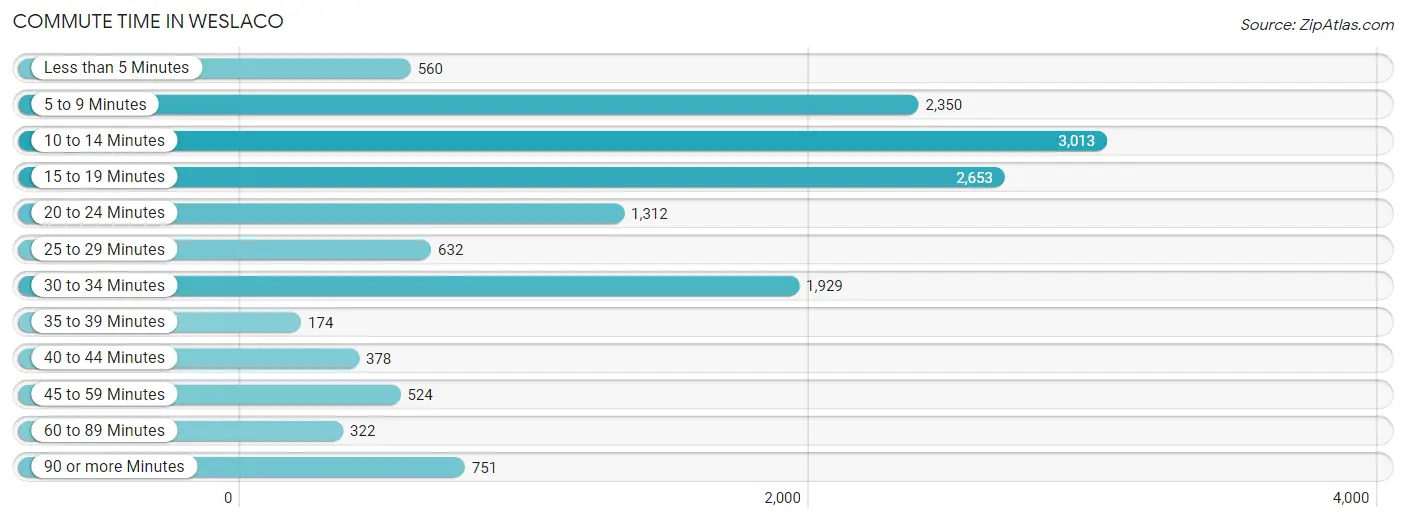
| Commute Time | # Commuters | % Commuters |
| Less than 5 Minutes | 560 | 3.8% |
| 5 to 9 Minutes | 2,350 | 16.1% |
| 10 to 14 Minutes | 3,013 | 20.6% |
| 15 to 19 Minutes | 2,653 | 18.2% |
| 20 to 24 Minutes | 1,312 | 9.0% |
| 25 to 29 Minutes | 632 | 4.3% |
| 30 to 34 Minutes | 1,929 | 13.2% |
| 35 to 39 Minutes | 174 | 1.2% |
| 40 to 44 Minutes | 378 | 2.6% |
| 45 to 59 Minutes | 524 | 3.6% |
| 60 to 89 Minutes | 322 | 2.2% |
| 90 or more Minutes | 751 | 5.1% |
Commute Time by Sex in Weslaco
The most common commute times in Weslaco are 15 to 19 minutes (1,606 commuters, 19.7%) for males and 10 to 14 minutes (1,557 commuters, 24.1%) for females.
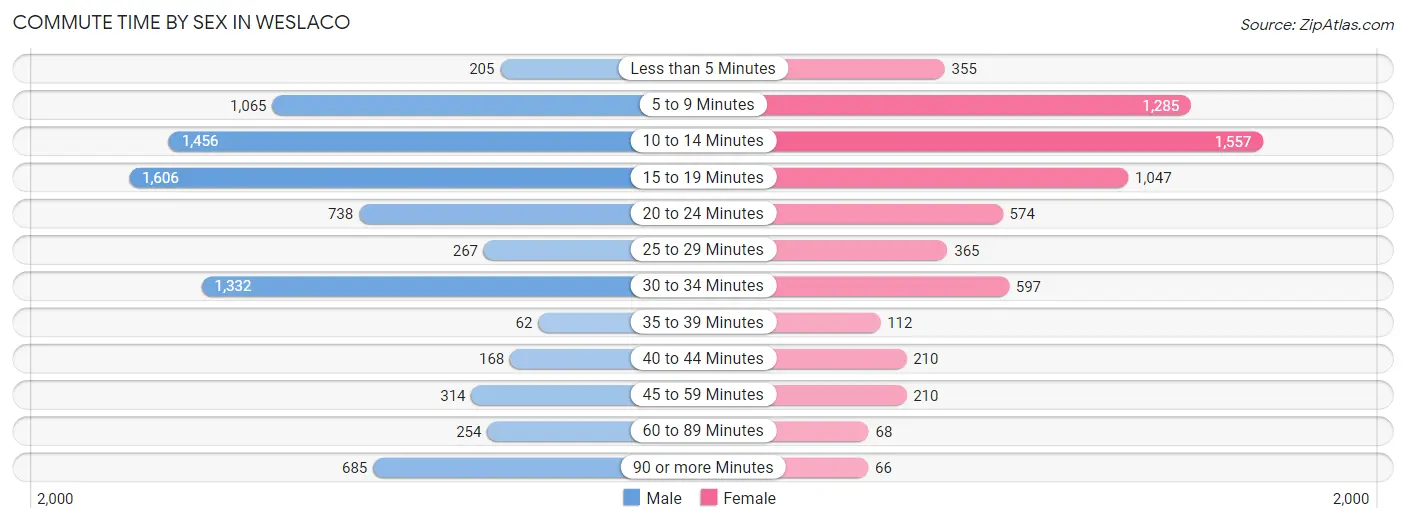
| Commute Time | Male | Female |
| Less than 5 Minutes | 205 (2.5%) | 355 (5.5%) |
| 5 to 9 Minutes | 1,065 (13.1%) | 1,285 (19.9%) |
| 10 to 14 Minutes | 1,456 (17.9%) | 1,557 (24.1%) |
| 15 to 19 Minutes | 1,606 (19.7%) | 1,047 (16.2%) |
| 20 to 24 Minutes | 738 (9.0%) | 574 (8.9%) |
| 25 to 29 Minutes | 267 (3.3%) | 365 (5.7%) |
| 30 to 34 Minutes | 1,332 (16.3%) | 597 (9.3%) |
| 35 to 39 Minutes | 62 (0.8%) | 112 (1.7%) |
| 40 to 44 Minutes | 168 (2.1%) | 210 (3.3%) |
| 45 to 59 Minutes | 314 (3.8%) | 210 (3.3%) |
| 60 to 89 Minutes | 254 (3.1%) | 68 (1.1%) |
| 90 or more Minutes | 685 (8.4%) | 66 (1.0%) |
Time of Departure to Work by Sex in Weslaco
The most frequent times of departure to work in Weslaco are 8:00 AM to 8:29 AM (1,149, 14.1%) for males and 7:00 AM to 7:29 AM (1,429, 22.2%) for females.
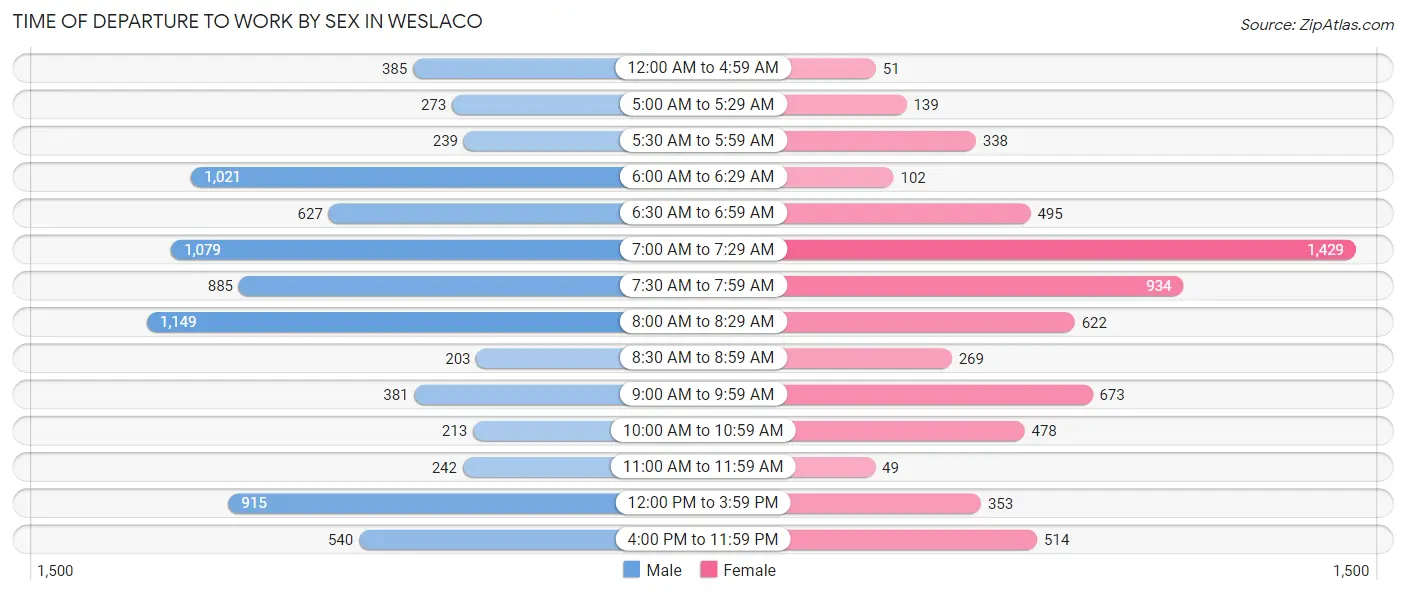
| Time of Departure | Male | Female |
| 12:00 AM to 4:59 AM | 385 (4.7%) | 51 (0.8%) |
| 5:00 AM to 5:29 AM | 273 (3.4%) | 139 (2.2%) |
| 5:30 AM to 5:59 AM | 239 (2.9%) | 338 (5.2%) |
| 6:00 AM to 6:29 AM | 1,021 (12.5%) | 102 (1.6%) |
| 6:30 AM to 6:59 AM | 627 (7.7%) | 495 (7.7%) |
| 7:00 AM to 7:29 AM | 1,079 (13.2%) | 1,429 (22.2%) |
| 7:30 AM to 7:59 AM | 885 (10.9%) | 934 (14.5%) |
| 8:00 AM to 8:29 AM | 1,149 (14.1%) | 622 (9.7%) |
| 8:30 AM to 8:59 AM | 203 (2.5%) | 269 (4.2%) |
| 9:00 AM to 9:59 AM | 381 (4.7%) | 673 (10.4%) |
| 10:00 AM to 10:59 AM | 213 (2.6%) | 478 (7.4%) |
| 11:00 AM to 11:59 AM | 242 (3.0%) | 49 (0.8%) |
| 12:00 PM to 3:59 PM | 915 (11.2%) | 353 (5.5%) |
| 4:00 PM to 11:59 PM | 540 (6.6%) | 514 (8.0%) |
| Total | 8,152 (100.0%) | 6,446 (100.0%) |
Housing Occupancy in Weslaco
Occupancy by Ownership in Weslaco
Of the total 12,668 dwellings in Weslaco, owner-occupied units account for 7,541 (59.5%), while renter-occupied units make up 5,127 (40.5%).
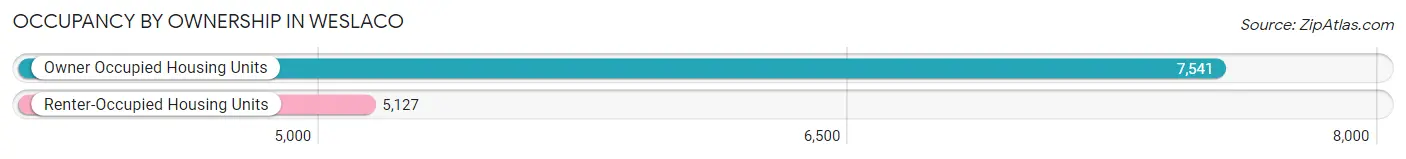
| Occupancy | # Housing Units | % Housing Units |
| Owner Occupied Housing Units | 7,541 | 59.5% |
| Renter-Occupied Housing Units | 5,127 | 40.5% |
| Total Occupied Housing Units | 12,668 | 100.0% |
Occupancy by Household Size in Weslaco
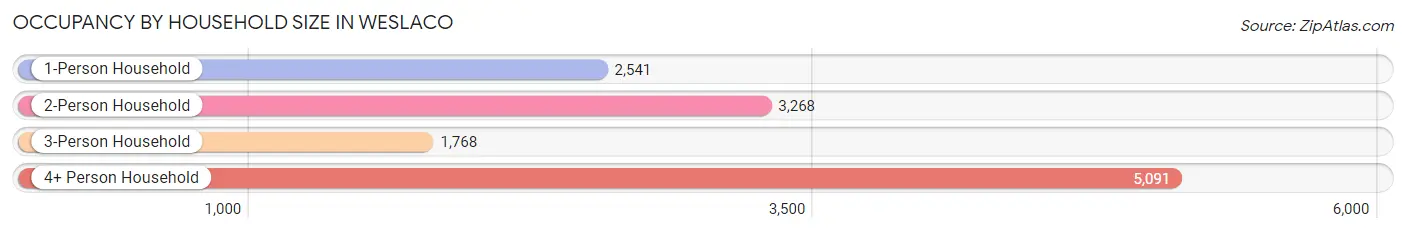
| Household Size | # Housing Units | % Housing Units |
| 1-Person Household | 2,541 | 20.1% |
| 2-Person Household | 3,268 | 25.8% |
| 3-Person Household | 1,768 | 14.0% |
| 4+ Person Household | 5,091 | 40.2% |
| Total Housing Units | 12,668 | 100.0% |
Occupancy by Ownership by Household Size in Weslaco
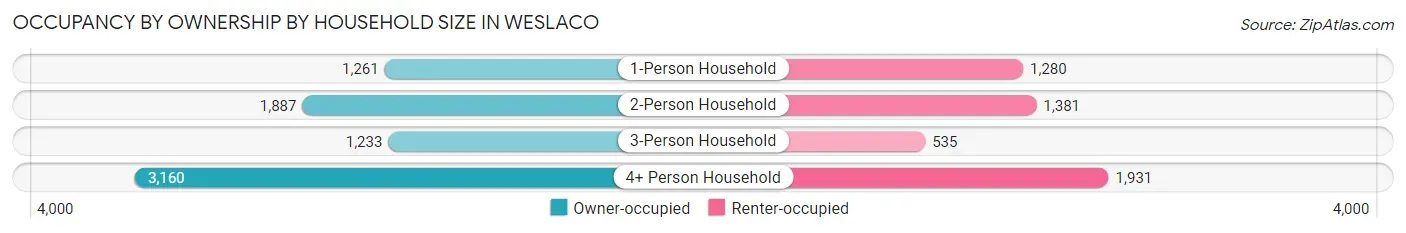
| Household Size | Owner-occupied | Renter-occupied |
| 1-Person Household | 1,261 (49.6%) | 1,280 (50.4%) |
| 2-Person Household | 1,887 (57.7%) | 1,381 (42.3%) |
| 3-Person Household | 1,233 (69.7%) | 535 (30.3%) |
| 4+ Person Household | 3,160 (62.1%) | 1,931 (37.9%) |
| Total Housing Units | 7,541 (59.5%) | 5,127 (40.5%) |
Occupancy by Educational Attainment in Weslaco
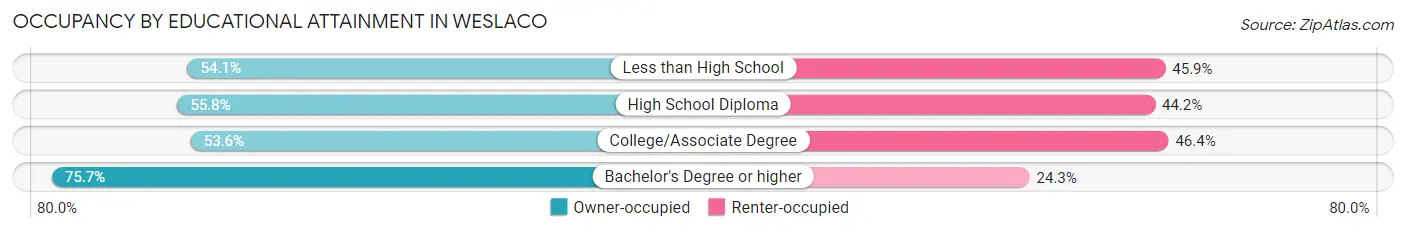
| Household Size | Owner-occupied | Renter-occupied |
| Less than High School | 1,651 (54.1%) | 1,399 (45.9%) |
| High School Diploma | 1,676 (55.8%) | 1,329 (44.2%) |
| College/Associate Degree | 1,923 (53.6%) | 1,662 (46.4%) |
| Bachelor's Degree or higher | 2,291 (75.7%) | 737 (24.3%) |
Occupancy by Age of Householder in Weslaco
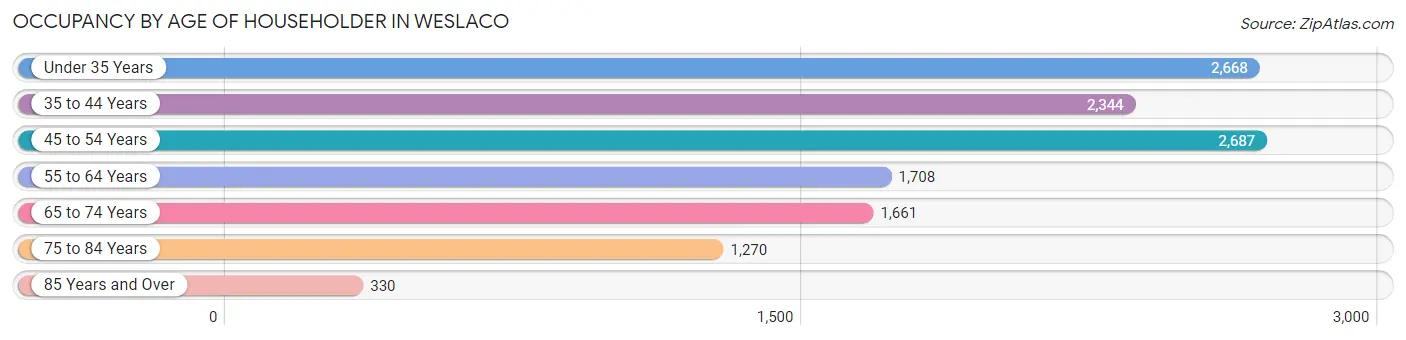
| Age Bracket | # Households | % Households |
| Under 35 Years | 2,668 | 21.1% |
| 35 to 44 Years | 2,344 | 18.5% |
| 45 to 54 Years | 2,687 | 21.2% |
| 55 to 64 Years | 1,708 | 13.5% |
| 65 to 74 Years | 1,661 | 13.1% |
| 75 to 84 Years | 1,270 | 10.0% |
| 85 Years and Over | 330 | 2.6% |
| Total | 12,668 | 100.0% |
Housing Finances in Weslaco
Median Income by Occupancy in Weslaco
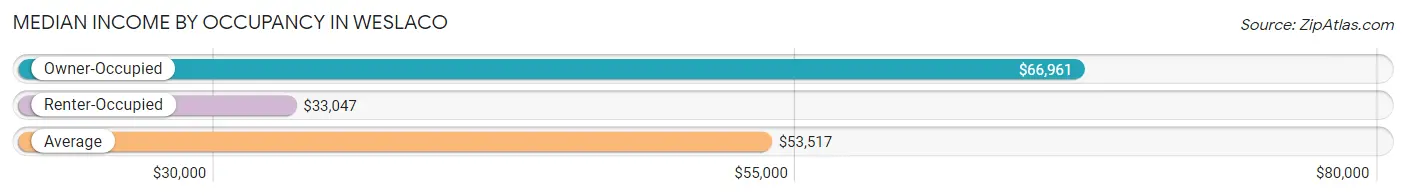
| Occupancy Type | # Households | Median Income |
| Owner-Occupied | 7,541 (59.5%) | $66,961 |
| Renter-Occupied | 5,127 (40.5%) | $33,047 |
| Average | 12,668 (100.0%) | $53,517 |
Occupancy by Householder Income Bracket in Weslaco
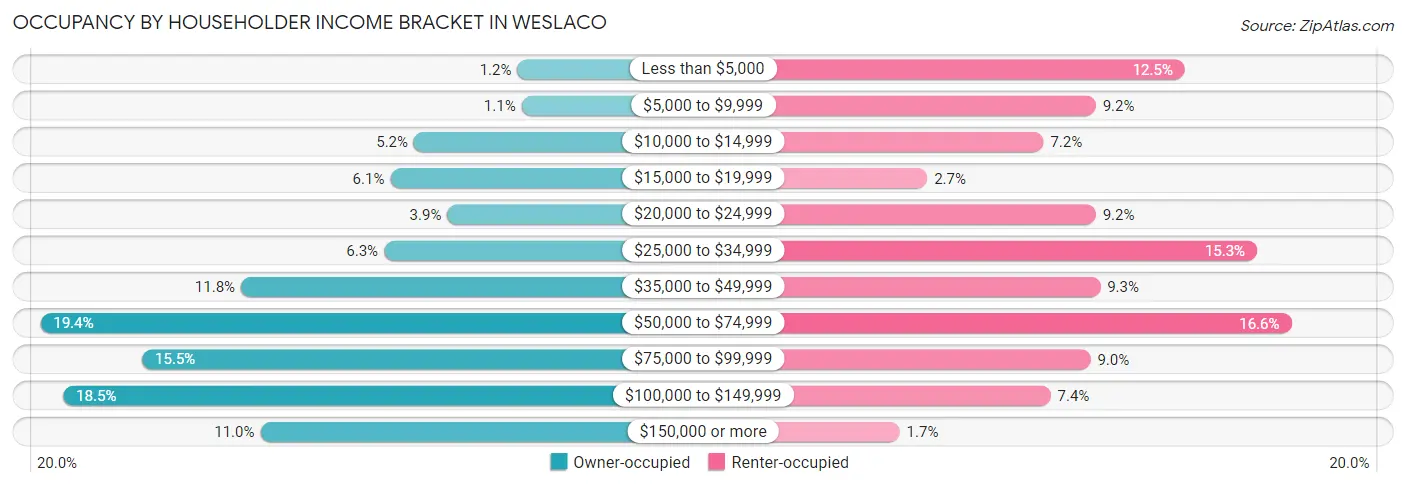
| Income Bracket | Owner-occupied | Renter-occupied |
| Less than $5,000 | 93 (1.2%) | 643 (12.5%) |
| $5,000 to $9,999 | 81 (1.1%) | 469 (9.1%) |
| $10,000 to $14,999 | 390 (5.2%) | 367 (7.2%) |
| $15,000 to $19,999 | 458 (6.1%) | 140 (2.7%) |
| $20,000 to $24,999 | 294 (3.9%) | 469 (9.1%) |
| $25,000 to $34,999 | 476 (6.3%) | 784 (15.3%) |
| $35,000 to $49,999 | 887 (11.8%) | 478 (9.3%) |
| $50,000 to $74,999 | 1,463 (19.4%) | 851 (16.6%) |
| $75,000 to $99,999 | 1,171 (15.5%) | 459 (8.9%) |
| $100,000 to $149,999 | 1,397 (18.5%) | 381 (7.4%) |
| $150,000 or more | 831 (11.0%) | 86 (1.7%) |
| Total | 7,541 (100.0%) | 5,127 (100.0%) |
Monthly Housing Cost Tiers in Weslaco
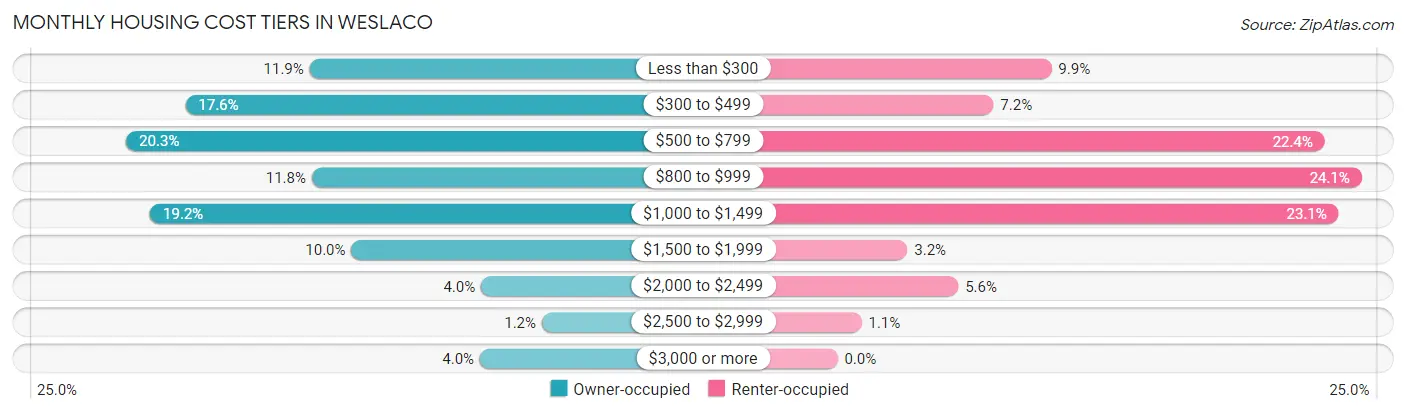
| Monthly Cost | Owner-occupied | Renter-occupied |
| Less than $300 | 896 (11.9%) | 505 (9.9%) |
| $300 to $499 | 1,327 (17.6%) | 368 (7.2%) |
| $500 to $799 | 1,533 (20.3%) | 1,150 (22.4%) |
| $800 to $999 | 888 (11.8%) | 1,237 (24.1%) |
| $1,000 to $1,499 | 1,450 (19.2%) | 1,183 (23.1%) |
| $1,500 to $1,999 | 751 (10.0%) | 165 (3.2%) |
| $2,000 to $2,499 | 301 (4.0%) | 285 (5.6%) |
| $2,500 to $2,999 | 90 (1.2%) | 57 (1.1%) |
| $3,000 or more | 305 (4.0%) | 0 (0.0%) |
| Total | 7,541 (100.0%) | 5,127 (100.0%) |
Physical Housing Characteristics in Weslaco
Housing Structures in Weslaco
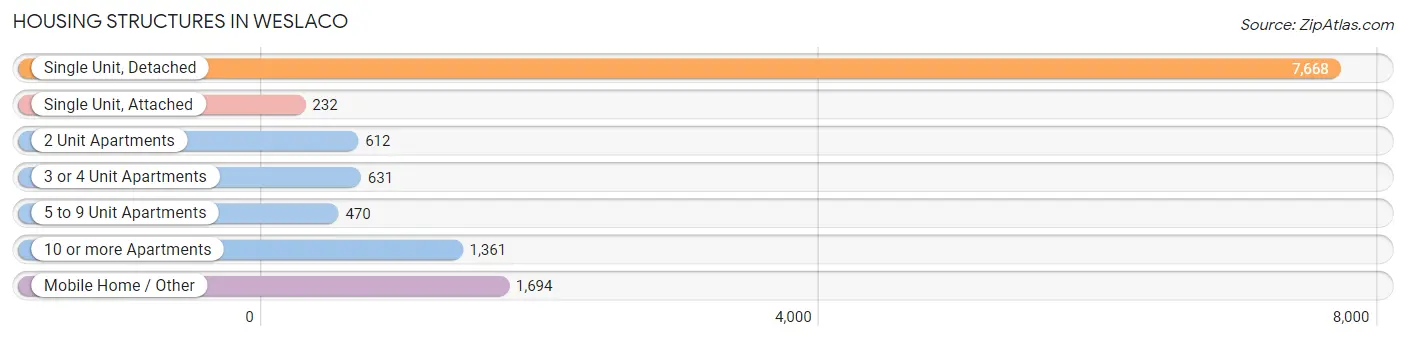
| Structure Type | # Housing Units | % Housing Units |
| Single Unit, Detached | 7,668 | 60.5% |
| Single Unit, Attached | 232 | 1.8% |
| 2 Unit Apartments | 612 | 4.8% |
| 3 or 4 Unit Apartments | 631 | 5.0% |
| 5 to 9 Unit Apartments | 470 | 3.7% |
| 10 or more Apartments | 1,361 | 10.7% |
| Mobile Home / Other | 1,694 | 13.4% |
| Total | 12,668 | 100.0% |
Housing Structures by Occupancy in Weslaco
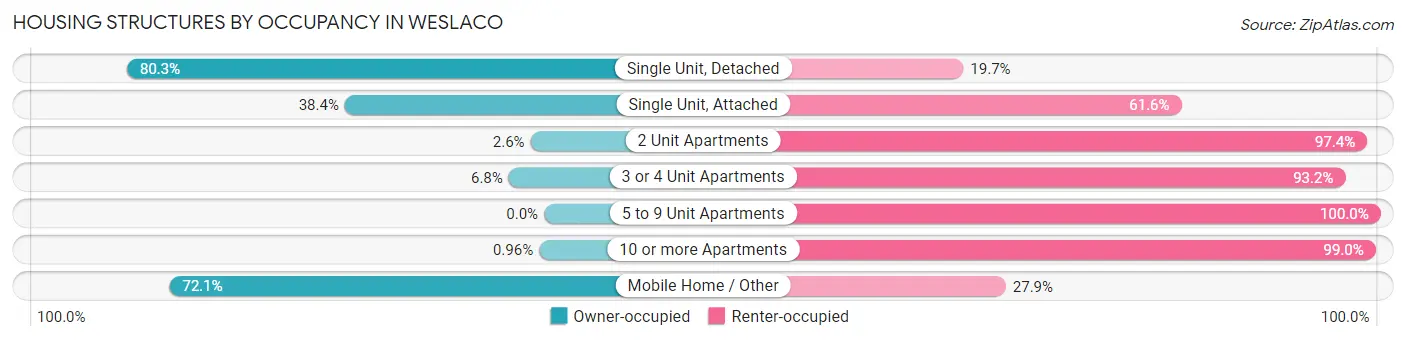
| Structure Type | Owner-occupied | Renter-occupied |
| Single Unit, Detached | 6,158 (80.3%) | 1,510 (19.7%) |
| Single Unit, Attached | 89 (38.4%) | 143 (61.6%) |
| 2 Unit Apartments | 16 (2.6%) | 596 (97.4%) |
| 3 or 4 Unit Apartments | 43 (6.8%) | 588 (93.2%) |
| 5 to 9 Unit Apartments | 0 (0.0%) | 470 (100.0%) |
| 10 or more Apartments | 13 (1.0%) | 1,348 (99.0%) |
| Mobile Home / Other | 1,222 (72.1%) | 472 (27.9%) |
| Total | 7,541 (59.5%) | 5,127 (40.5%) |
Housing Structures by Number of Rooms in Weslaco
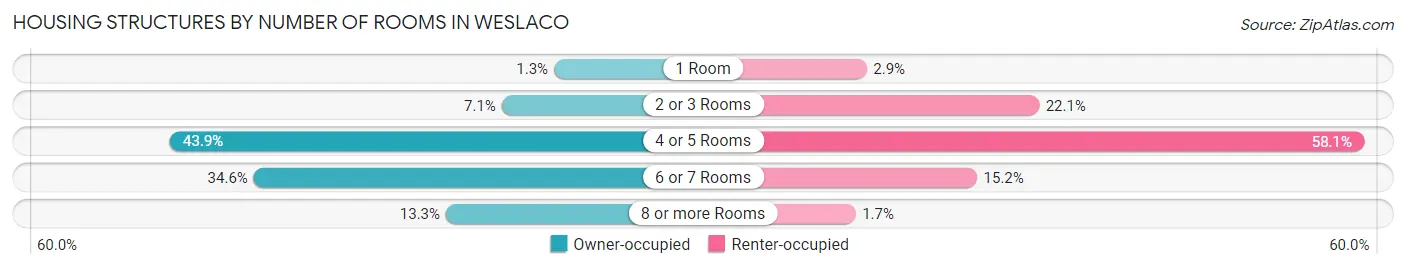
| Number of Rooms | Owner-occupied | Renter-occupied |
| 1 Room | 94 (1.3%) | 150 (2.9%) |
| 2 or 3 Rooms | 532 (7.0%) | 1,131 (22.1%) |
| 4 or 5 Rooms | 3,308 (43.9%) | 2,981 (58.1%) |
| 6 or 7 Rooms | 2,608 (34.6%) | 778 (15.2%) |
| 8 or more Rooms | 999 (13.3%) | 87 (1.7%) |
| Total | 7,541 (100.0%) | 5,127 (100.0%) |
Housing Structure by Heating Type in Weslaco
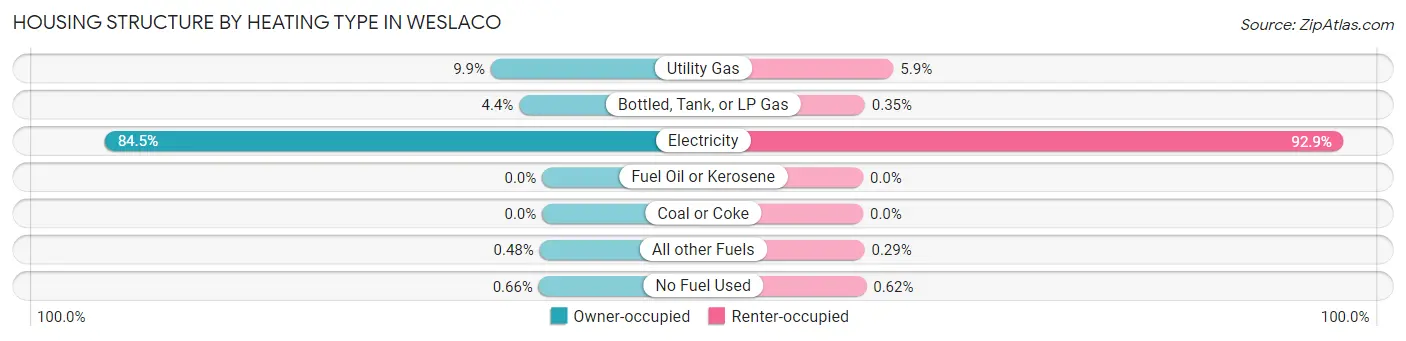
| Heating Type | Owner-occupied | Renter-occupied |
| Utility Gas | 747 (9.9%) | 301 (5.9%) |
| Bottled, Tank, or LP Gas | 335 (4.4%) | 18 (0.4%) |
| Electricity | 6,373 (84.5%) | 4,761 (92.9%) |
| Fuel Oil or Kerosene | 0 (0.0%) | 0 (0.0%) |
| Coal or Coke | 0 (0.0%) | 0 (0.0%) |
| All other Fuels | 36 (0.5%) | 15 (0.3%) |
| No Fuel Used | 50 (0.7%) | 32 (0.6%) |
| Total | 7,541 (100.0%) | 5,127 (100.0%) |
Household Vehicle Usage in Weslaco
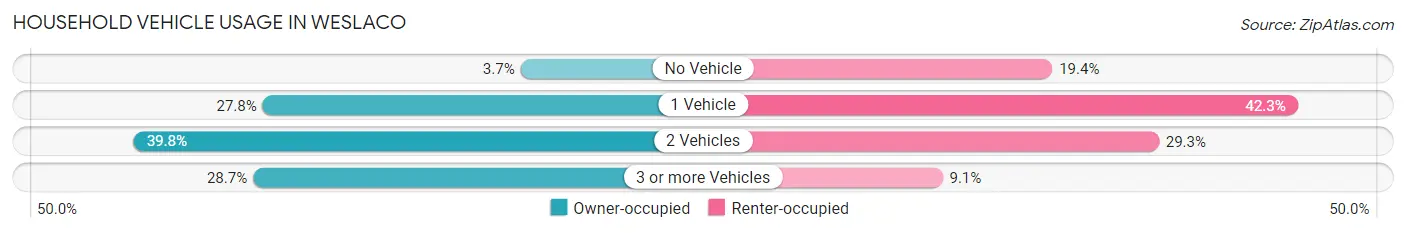
| Vehicles per Household | Owner-occupied | Renter-occupied |
| No Vehicle | 280 (3.7%) | 992 (19.4%) |
| 1 Vehicle | 2,096 (27.8%) | 2,166 (42.2%) |
| 2 Vehicles | 3,002 (39.8%) | 1,502 (29.3%) |
| 3 or more Vehicles | 2,163 (28.7%) | 467 (9.1%) |
| Total | 7,541 (100.0%) | 5,127 (100.0%) |
Real Estate & Mortgages in Weslaco
Real Estate and Mortgage Overview in Weslaco
| Characteristic | Without Mortgage | With Mortgage |
| Housing Units | 4,003 | 3,538 |
| Median Property Value | $66,900 | $143,600 |
| Median Household Income | $56,506 | $630 |
| Monthly Housing Costs | $480 | $305 |
| Real Estate Taxes | $1,203 | $150 |
Property Value by Mortgage Status in Weslaco
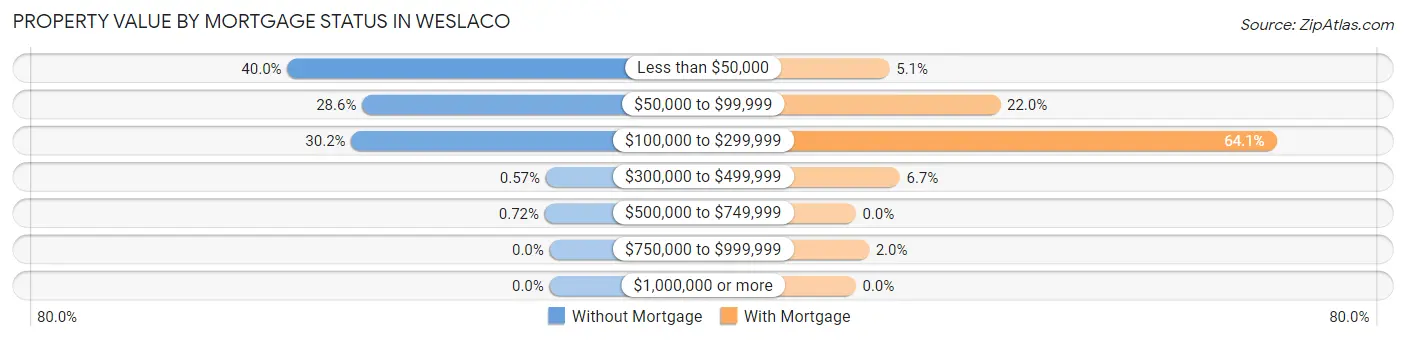
| Property Value | Without Mortgage | With Mortgage |
| Less than $50,000 | 1,599 (40.0%) | 182 (5.1%) |
| $50,000 to $99,999 | 1,143 (28.5%) | 779 (22.0%) |
| $100,000 to $299,999 | 1,209 (30.2%) | 2,269 (64.1%) |
| $300,000 to $499,999 | 23 (0.6%) | 237 (6.7%) |
| $500,000 to $749,999 | 29 (0.7%) | 0 (0.0%) |
| $750,000 to $999,999 | 0 (0.0%) | 71 (2.0%) |
| $1,000,000 or more | 0 (0.0%) | 0 (0.0%) |
| Total | 4,003 (100.0%) | 3,538 (100.0%) |
Household Income by Mortgage Status in Weslaco
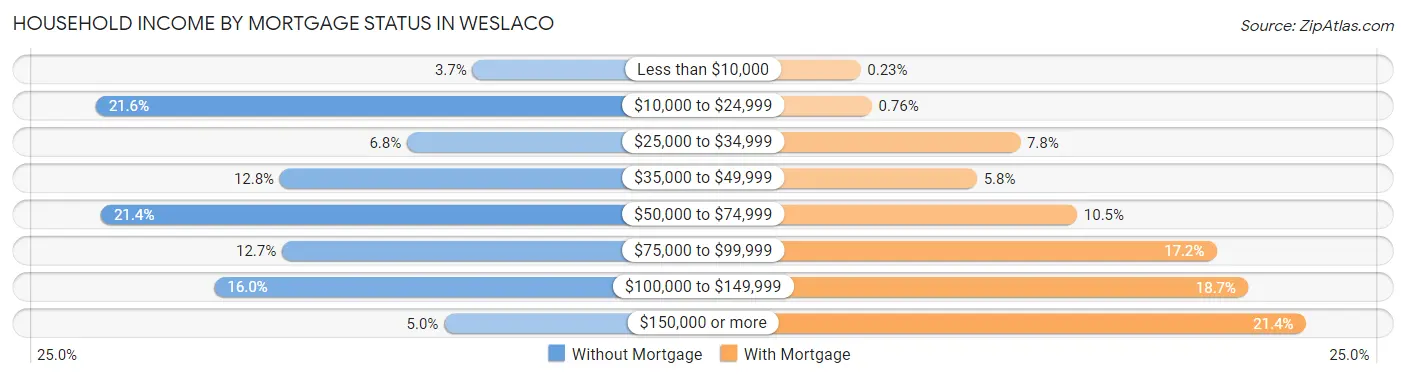
| Household Income | Without Mortgage | With Mortgage |
| Less than $10,000 | 147 (3.7%) | 8 (0.2%) |
| $10,000 to $24,999 | 865 (21.6%) | 27 (0.8%) |
| $25,000 to $34,999 | 272 (6.8%) | 277 (7.8%) |
| $35,000 to $49,999 | 514 (12.8%) | 204 (5.8%) |
| $50,000 to $74,999 | 855 (21.4%) | 373 (10.5%) |
| $75,000 to $99,999 | 510 (12.7%) | 608 (17.2%) |
| $100,000 to $149,999 | 639 (16.0%) | 661 (18.7%) |
| $150,000 or more | 201 (5.0%) | 758 (21.4%) |
| Total | 4,003 (100.0%) | 3,538 (100.0%) |
Property Value to Household Income Ratio in Weslaco
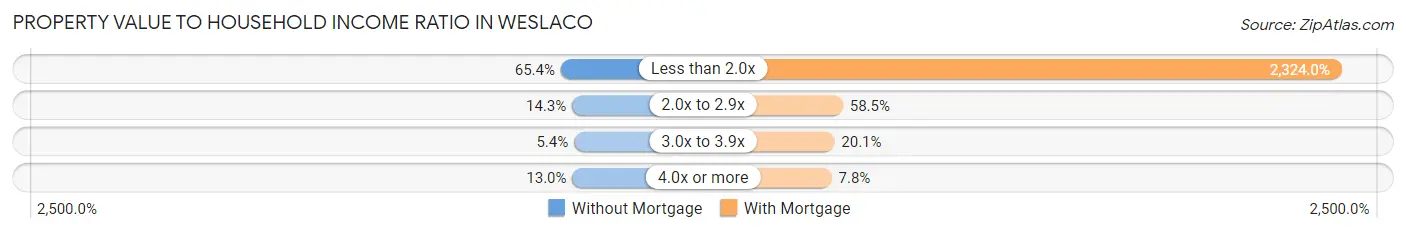
| Value-to-Income Ratio | Without Mortgage | With Mortgage |
| Less than 2.0x | 2,617 (65.4%) | 82,222 (2,324.0%) |
| 2.0x to 2.9x | 573 (14.3%) | 2,070 (58.5%) |
| 3.0x to 3.9x | 217 (5.4%) | 711 (20.1%) |
| 4.0x or more | 519 (13.0%) | 276 (7.8%) |
| Total | 4,003 (100.0%) | 3,538 (100.0%) |
Real Estate Taxes by Mortgage Status in Weslaco
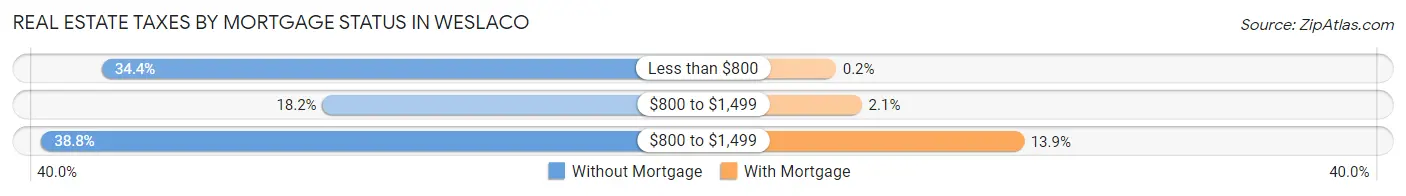
| Property Taxes | Without Mortgage | With Mortgage |
| Less than $800 | 1,375 (34.4%) | 7 (0.2%) |
| $800 to $1,499 | 730 (18.2%) | 74 (2.1%) |
| $800 to $1,499 | 1,552 (38.8%) | 493 (13.9%) |
| Total | 4,003 (100.0%) | 3,538 (100.0%) |
Health & Disability in Weslaco
Health Insurance Coverage by Age in Weslaco
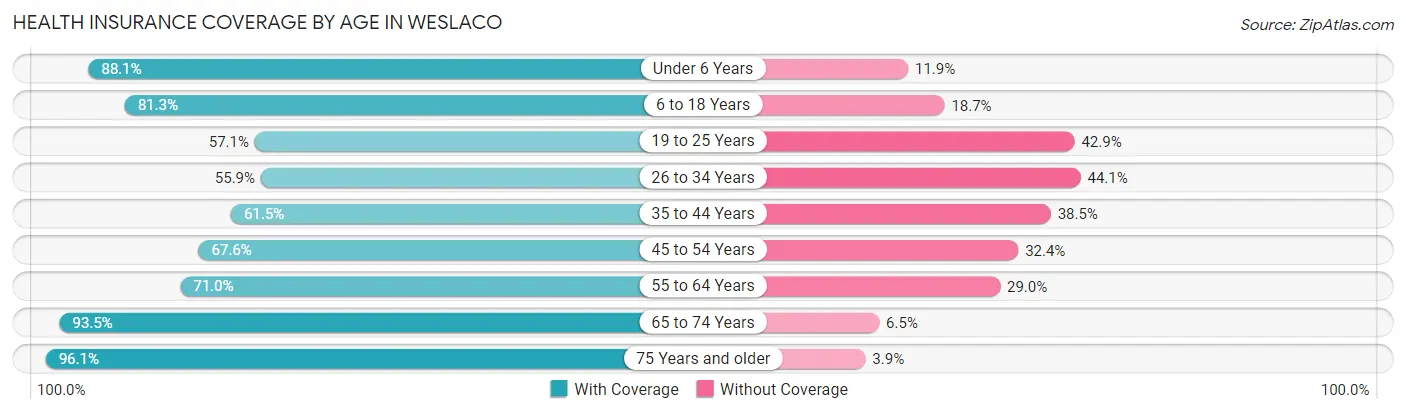
| Age Bracket | With Coverage | Without Coverage |
| Under 6 Years | 3,477 (88.1%) | 469 (11.9%) |
| 6 to 18 Years | 8,212 (81.3%) | 1,886 (18.7%) |
| 19 to 25 Years | 2,380 (57.1%) | 1,790 (42.9%) |
| 26 to 34 Years | 2,582 (55.9%) | 2,034 (44.1%) |
| 35 to 44 Years | 2,966 (61.5%) | 1,856 (38.5%) |
| 45 to 54 Years | 3,086 (67.6%) | 1,481 (32.4%) |
| 55 to 64 Years | 2,211 (71.0%) | 905 (29.0%) |
| 65 to 74 Years | 2,403 (93.5%) | 167 (6.5%) |
| 75 Years and older | 2,341 (96.1%) | 96 (3.9%) |
| Total | 29,658 (73.5%) | 10,684 (26.5%) |
Health Insurance Coverage by Citizenship Status in Weslaco
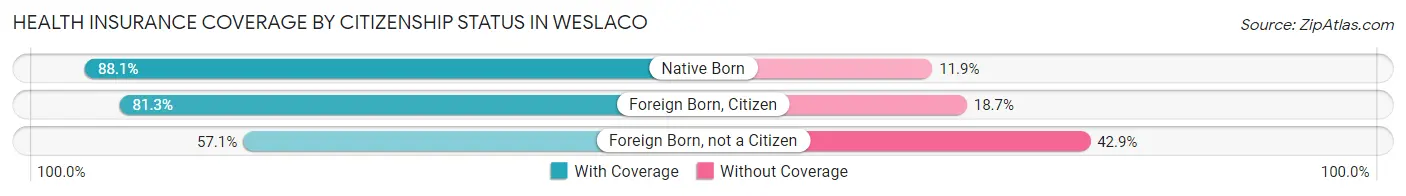
| Citizenship Status | With Coverage | Without Coverage |
| Native Born | 3,477 (88.1%) | 469 (11.9%) |
| Foreign Born, Citizen | 8,212 (81.3%) | 1,886 (18.7%) |
| Foreign Born, not a Citizen | 2,380 (57.1%) | 1,790 (42.9%) |
Health Insurance Coverage by Household Income in Weslaco
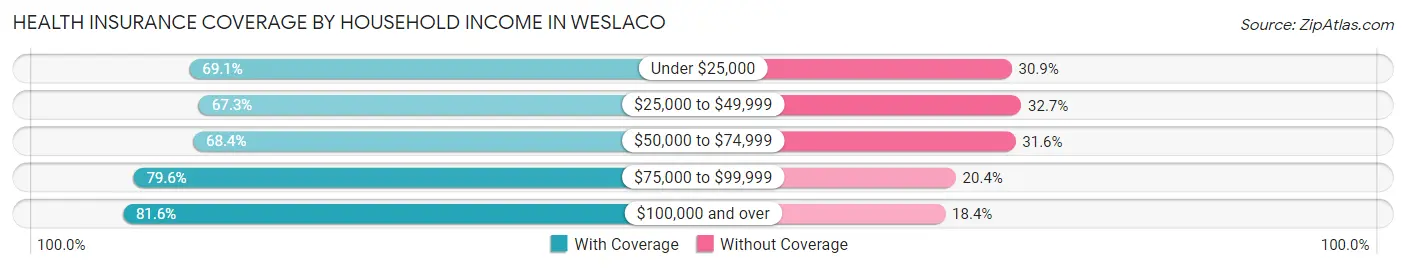
| Household Income | With Coverage | Without Coverage |
| Under $25,000 | 5,419 (69.1%) | 2,420 (30.9%) |
| $25,000 to $49,999 | 5,435 (67.3%) | 2,636 (32.7%) |
| $50,000 to $74,999 | 5,157 (68.4%) | 2,380 (31.6%) |
| $75,000 to $99,999 | 4,885 (79.6%) | 1,252 (20.4%) |
| $100,000 and over | 8,734 (81.6%) | 1,974 (18.4%) |
Public vs Private Health Insurance Coverage by Age in Weslaco
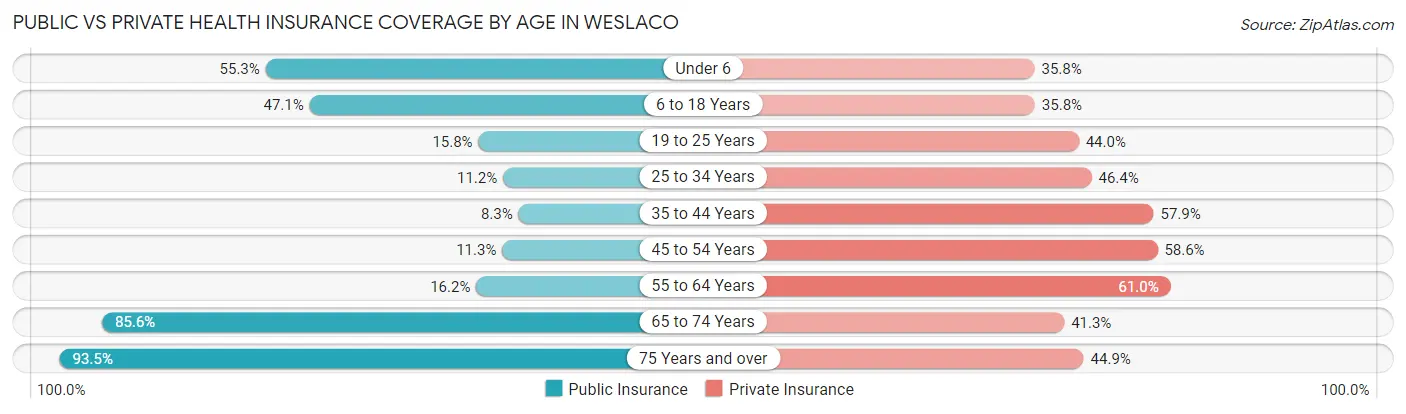
| Age Bracket | Public Insurance | Private Insurance |
| Under 6 | 2,181 (55.3%) | 1,412 (35.8%) |
| 6 to 18 Years | 4,757 (47.1%) | 3,619 (35.8%) |
| 19 to 25 Years | 657 (15.8%) | 1,834 (44.0%) |
| 25 to 34 Years | 517 (11.2%) | 2,140 (46.4%) |
| 35 to 44 Years | 401 (8.3%) | 2,790 (57.9%) |
| 45 to 54 Years | 518 (11.3%) | 2,676 (58.6%) |
| 55 to 64 Years | 504 (16.2%) | 1,901 (61.0%) |
| 65 to 74 Years | 2,201 (85.6%) | 1,061 (41.3%) |
| 75 Years and over | 2,279 (93.5%) | 1,094 (44.9%) |
| Total | 14,015 (34.7%) | 18,527 (45.9%) |
Disability Status by Sex by Age in Weslaco
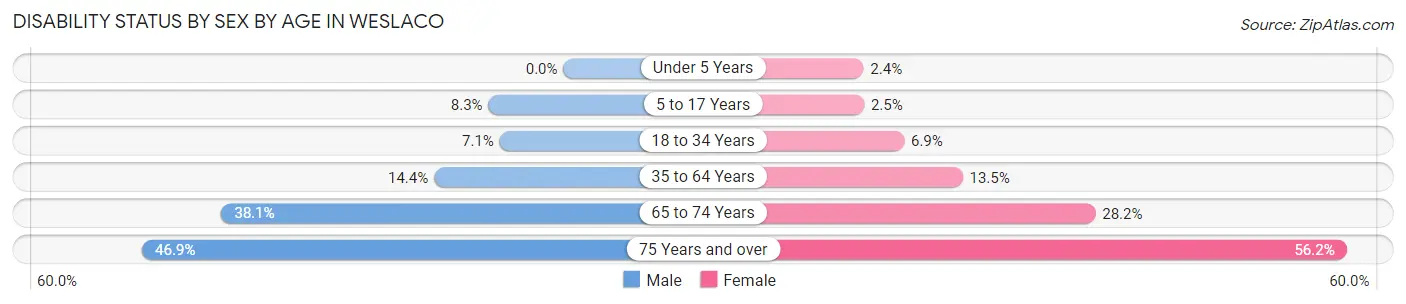
| Age Bracket | Male | Female |
| Under 5 Years | 0 (0.0%) | 47 (2.4%) |
| 5 to 17 Years | 436 (8.3%) | 123 (2.5%) |
| 18 to 34 Years | 347 (7.1%) | 317 (6.9%) |
| 35 to 64 Years | 875 (14.4%) | 865 (13.5%) |
| 65 to 74 Years | 419 (38.1%) | 415 (28.2%) |
| 75 Years and over | 493 (46.9%) | 779 (56.2%) |
Disability Class by Sex by Age in Weslaco
Disability Class: Hearing Difficulty
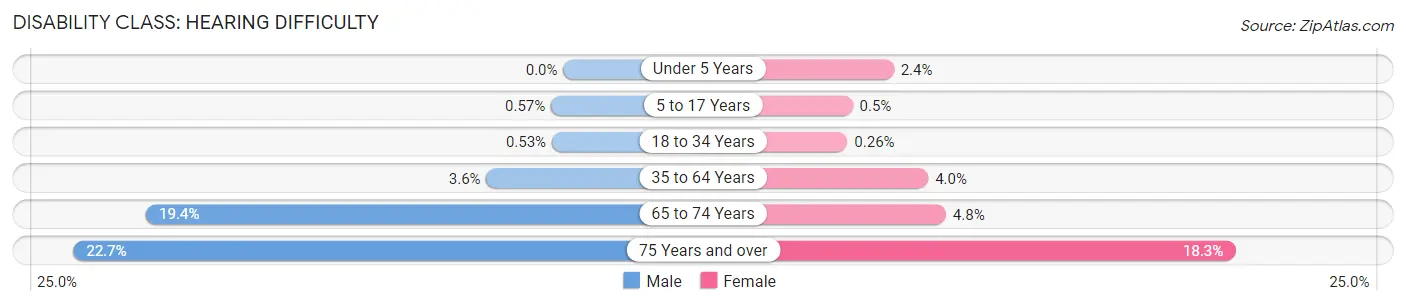
| Age Bracket | Male | Female |
| Under 5 Years | 0 (0.0%) | 47 (2.4%) |
| 5 to 17 Years | 30 (0.6%) | 25 (0.5%) |
| 18 to 34 Years | 26 (0.5%) | 12 (0.3%) |
| 35 to 64 Years | 217 (3.6%) | 258 (4.0%) |
| 65 to 74 Years | 213 (19.4%) | 71 (4.8%) |
| 75 Years and over | 239 (22.7%) | 253 (18.2%) |
Disability Class: Vision Difficulty
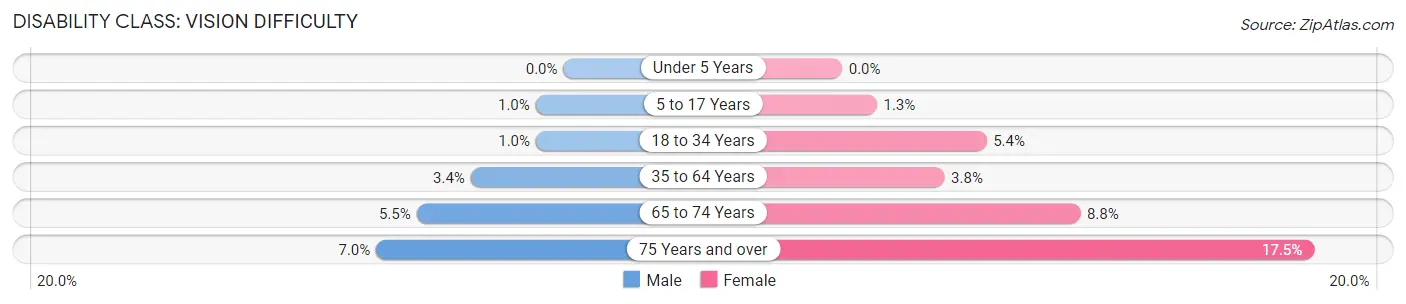
| Age Bracket | Male | Female |
| Under 5 Years | 0 (0.0%) | 0 (0.0%) |
| 5 to 17 Years | 54 (1.0%) | 64 (1.3%) |
| 18 to 34 Years | 50 (1.0%) | 245 (5.4%) |
| 35 to 64 Years | 209 (3.4%) | 244 (3.8%) |
| 65 to 74 Years | 60 (5.4%) | 130 (8.8%) |
| 75 Years and over | 73 (7.0%) | 243 (17.5%) |
Disability Class: Cognitive Difficulty
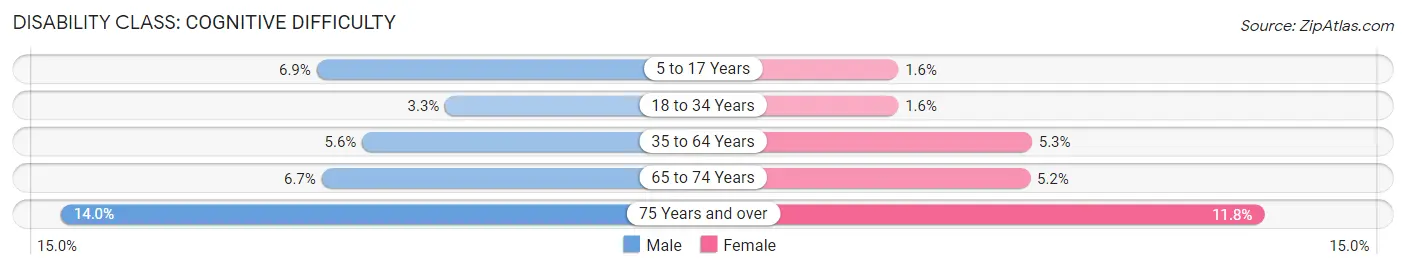
| Age Bracket | Male | Female |
| 5 to 17 Years | 359 (6.9%) | 78 (1.6%) |
| 18 to 34 Years | 161 (3.3%) | 72 (1.6%) |
| 35 to 64 Years | 340 (5.6%) | 340 (5.3%) |
| 65 to 74 Years | 74 (6.7%) | 77 (5.2%) |
| 75 Years and over | 147 (14.0%) | 163 (11.8%) |
Disability Class: Ambulatory Difficulty
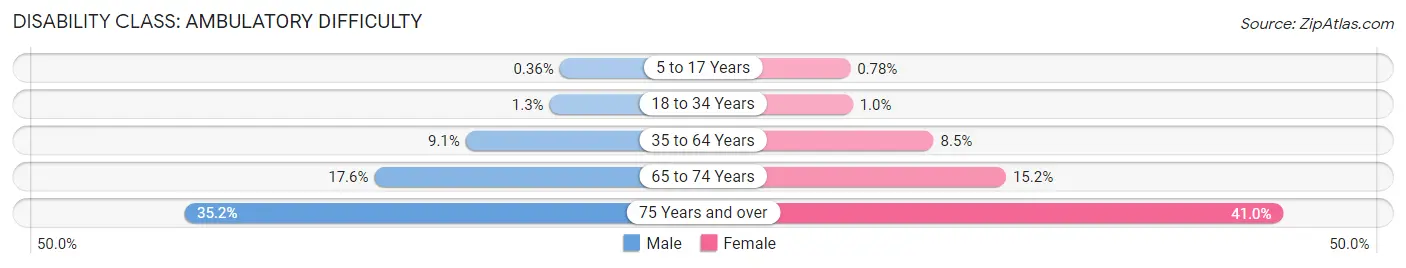
| Age Bracket | Male | Female |
| 5 to 17 Years | 19 (0.4%) | 39 (0.8%) |
| 18 to 34 Years | 63 (1.3%) | 46 (1.0%) |
| 35 to 64 Years | 551 (9.1%) | 548 (8.5%) |
| 65 to 74 Years | 193 (17.5%) | 224 (15.2%) |
| 75 Years and over | 370 (35.2%) | 568 (41.0%) |
Disability Class: Self-Care Difficulty
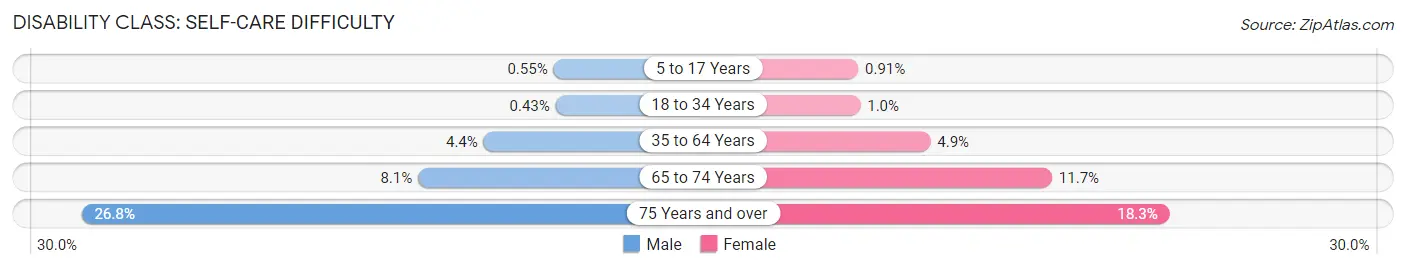
| Age Bracket | Male | Female |
| 5 to 17 Years | 29 (0.5%) | 45 (0.9%) |
| 18 to 34 Years | 21 (0.4%) | 47 (1.0%) |
| 35 to 64 Years | 270 (4.4%) | 317 (4.9%) |
| 65 to 74 Years | 89 (8.1%) | 172 (11.7%) |
| 75 Years and over | 282 (26.8%) | 253 (18.2%) |
Technology Access in Weslaco
Computing Device Access in Weslaco
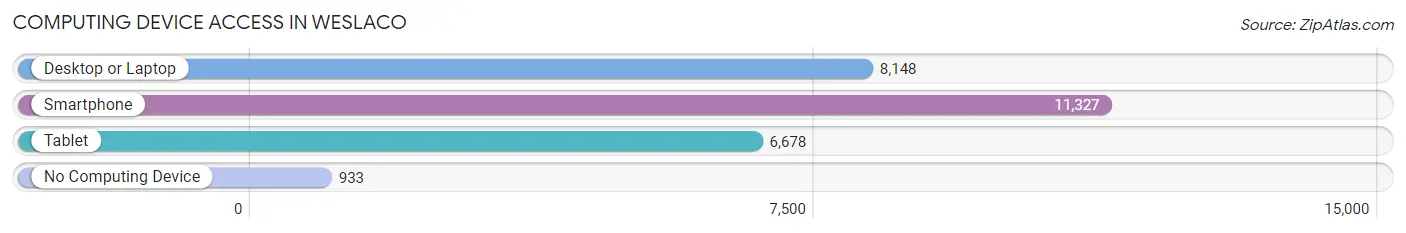
| Device Type | # Households | % Households |
| Desktop or Laptop | 8,148 | 64.3% |
| Smartphone | 11,327 | 89.4% |
| Tablet | 6,678 | 52.7% |
| No Computing Device | 933 | 7.4% |
| Total | 12,668 | 100.0% |
Internet Access in Weslaco
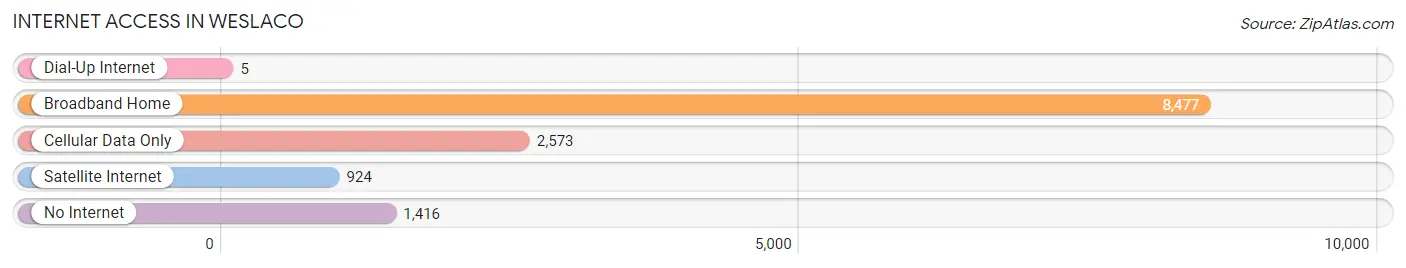
| Internet Type | # Households | % Households |
| Dial-Up Internet | 5 | 0.0% |
| Broadband Home | 8,477 | 66.9% |
| Cellular Data Only | 2,573 | 20.3% |
| Satellite Internet | 924 | 7.3% |
| No Internet | 1,416 | 11.2% |
| Total | 12,668 | 100.0% |
Weslaco Summary
Weslaco is a city located in Hidalgo County, Texas, United States. It is part of the McAllen–Edinburg–Mission and Reynosa–McAllen metropolitan areas. The population was estimated to be 37,601 as of 2019.
History
Weslaco was founded in 1919 by John Closner, a land developer from Missouri. Closner named the city after his initials, W.E.S. The city was incorporated in 1925.
In the early 20th century, Weslaco was a small farming community. The economy was based on cotton, corn, and sorghum. The city was also home to a large number of Mexican immigrants who worked in the fields.
In the 1950s, the economy shifted to manufacturing and retail. The city was home to a number of factories, including a garment factory, a shoe factory, and a furniture factory.
Geography
Weslaco is located in the Rio Grande Valley of South Texas, about 20 miles (32 km) west of McAllen and about 30 miles (48 km) east of Brownsville. The city is situated at the intersection of U.S. Route 83 and State Highway 107.
The city has a total area of 8.3 square miles (21.5 km2), all of which is land. The terrain is flat and the soil is sandy. The climate is subtropical and semi-arid, with hot summers and mild winters.
Economy
Weslaco's economy is largely based on agriculture and manufacturing. The city is home to a number of factories, including a garment factory, a shoe factory, and a furniture factory.
The city is also home to a number of retail stores, including a Walmart Supercenter, a Target, and a Lowe's.
Demographics
As of the 2010 census, there were 35,670 people, 10,717 households, and 8,541 families residing in the city. The population density was 4,286.3 people per square mile (1,651.2/km2). The racial makeup of the city was 77.2% White, 0.7% African American, 0.4% Native American, 0.3% Asian, 0.1% Pacific Islander, 19.3% from other races, and 2.1% from two or more races. Hispanic or Latino of any race were 97.2% of the population.
The median income for a household in the city was $30,945, and the median income for a family was $35,945. The per capita income for the city was $13,845. About 24.2% of families and 28.2% of the population were below the poverty line, including 37.2% of those under age 18 and 24.2% of those age 65 or over.
Common Questions
What is the Total Population of Weslaco?
Total Population of Weslaco is 40,858.
What is the Total Male Population of Weslaco?
Total Male Population of Weslaco is 19,829.
What is the Total Female Population of Weslaco?
Total Female Population of Weslaco is 21,029.
What is the Ratio of Males per 100 Females in Weslaco?
There are 94.29 Males per 100 Females in Weslaco.
What is the Ratio of Females per 100 Males in Weslaco?
There are 106.05 Females per 100 Males in Weslaco.
What is the Median Population Age in Weslaco?
Median Population Age in Weslaco is 30.0 Years.
What is the Average Family Size in Weslaco
Average Family Size in Weslaco is 3.7 People.
What is the Average Household Size in Weslaco
Average Household Size in Weslaco is 3.2 People.
What is Per Capita Income in Weslaco?
Per Capita income in Weslaco is $21,672.
What is the Median Family Income in Weslaco?
Median Family Income in Weslaco is $60,587.
What is the Median Household income in Weslaco?
Median Household Income in Weslaco is $53,517.
What is Income or Wage Gap in Weslaco?
Income or Wage Gap in Weslaco is 24.5%.
Women in Weslaco earn 75.5 cents for every dollar earned by a man.
What is Family Income Deficit in Weslaco?
Family Income Deficit in Weslaco is $12,170.
Families that are below poverty line in Weslaco earn $12,170 less on average than the poverty threshold level.
What is Inequality or Gini Index in Weslaco?
Inequality or Gini Index in Weslaco is 0.46.
How Large is the Labor Force in Weslaco?
There are 17,209 People in the Labor Forcein in Weslaco.
What is the Percentage of People in the Labor Force in Weslaco?
58.9% of People are in the Labor Force in Weslaco.
What is the Unemployment Rate in Weslaco?
Unemployment Rate in Weslaco is 6.9%.