Alton, TX
Alton Map
Alton Overview
18,493
TOTAL POPULATION
9,357
MALE POPULATION
9,136
FEMALE POPULATION
102.42
MALES / 100 FEMALES
97.64
FEMALES / 100 MALES
25.9
MEDIAN AGE
4.1
AVG FAMILY SIZE
3.7
AVG HOUSEHOLD SIZE
$15,656
PER CAPITA INCOME
$45,230
AVG FAMILY INCOME
$44,317
AVG HOUSEHOLD INCOME
10.7%
WAGE / INCOME GAP [ % ]
89.3¢/ $1
WAGE / INCOME GAP [ $ ]
$12,888
FAMILY INCOME DEFICIT
0.42
INEQUALITY / GINI INDEX
7,889
LABOR FORCE [ PEOPLE ]
63.3%
PERCENT IN LABOR FORCE
9.3%
UNEMPLOYMENT RATE
Alton Area Codes
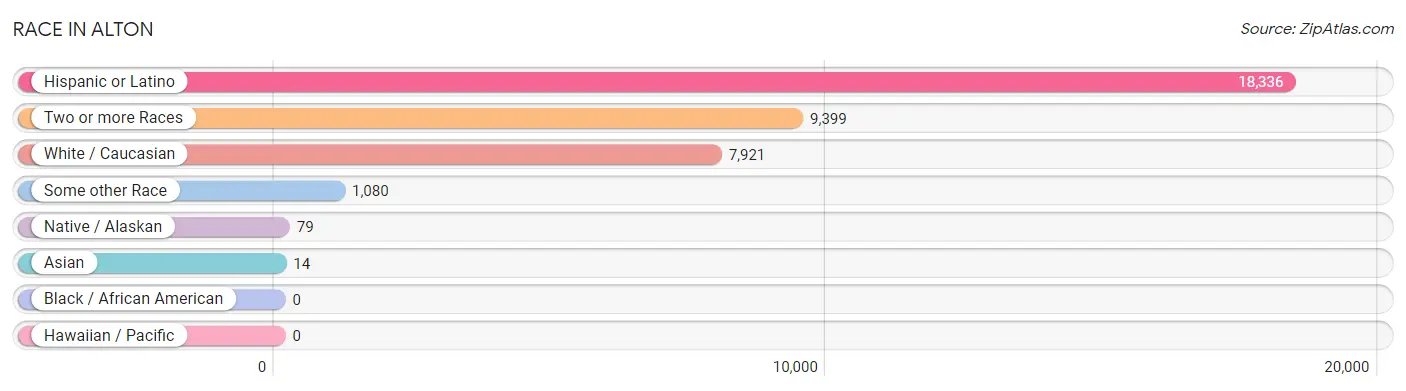
Race in Alton
The most populous races in Alton are Hispanic or Latino (18,336 | 99.2%), Two or more Races (9,399 | 50.8%), and White / Caucasian (7,921 | 42.8%).
| Race | # Population | % Population |
| Asian | 14 | 0.1% |
| Black / African American | 0 | 0.0% |
| Hawaiian / Pacific | 0 | 0.0% |
| Hispanic or Latino | 18,336 | 99.2% |
| Native / Alaskan | 79 | 0.4% |
| White / Caucasian | 7,921 | 42.8% |
| Two or more Races | 9,399 | 50.8% |
| Some other Race | 1,080 | 5.8% |
| Total | 18,493 | 100.0% |
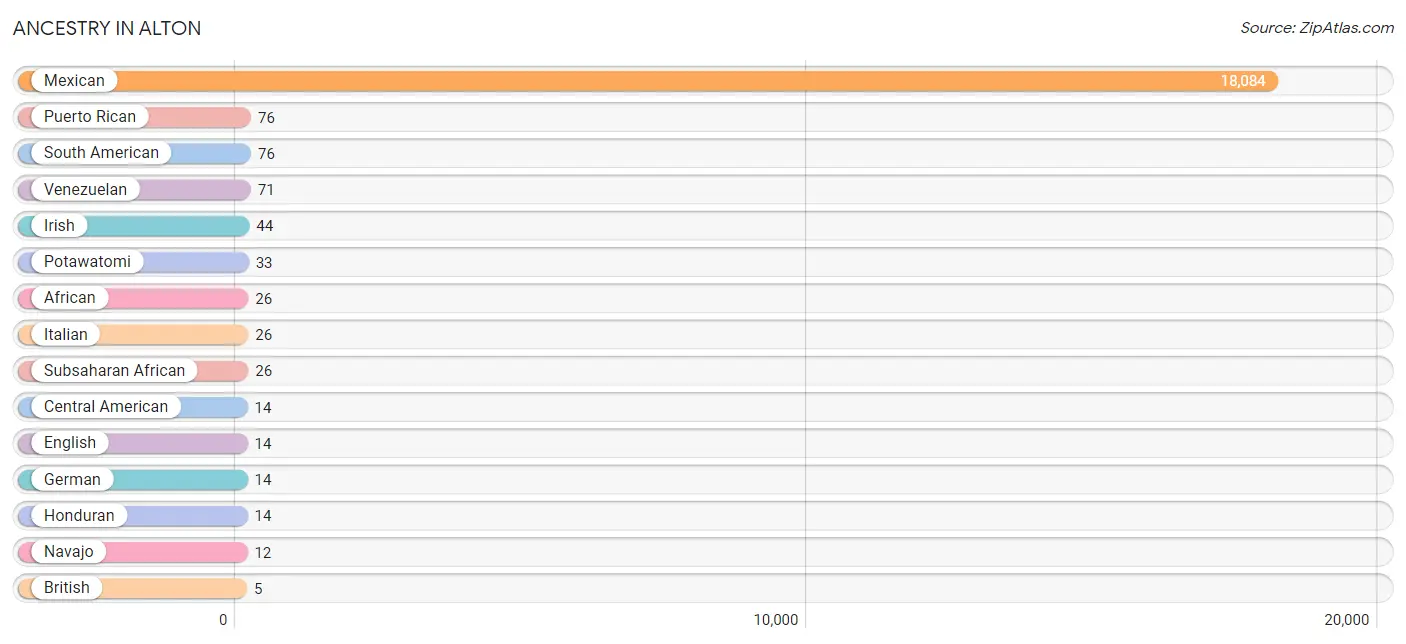
Ancestry in Alton
The most populous ancestries reported in Alton are Mexican (18,084 | 97.8%), Puerto Rican (76 | 0.4%), South American (76 | 0.4%), Venezuelan (71 | 0.4%), and Irish (44 | 0.2%), together accounting for 99.2% of all Alton residents.
| Ancestry | # Population | % Population |
| African | 26 | 0.1% |
| American | 4 | 0.0% |
| British | 5 | 0.0% |
| Central American | 14 | 0.1% |
| Colombian | 5 | 0.0% |
| English | 14 | 0.1% |
| German | 14 | 0.1% |
| Honduran | 14 | 0.1% |
| Irish | 44 | 0.2% |
| Italian | 26 | 0.1% |
| Mexican | 18,084 | 97.8% |
| Navajo | 12 | 0.1% |
| Potawatomi | 33 | 0.2% |
| Puerto Rican | 76 | 0.4% |
| South American | 76 | 0.4% |
| Subsaharan African | 26 | 0.1% |
| Venezuelan | 71 | 0.4% | View All 17 Rows |
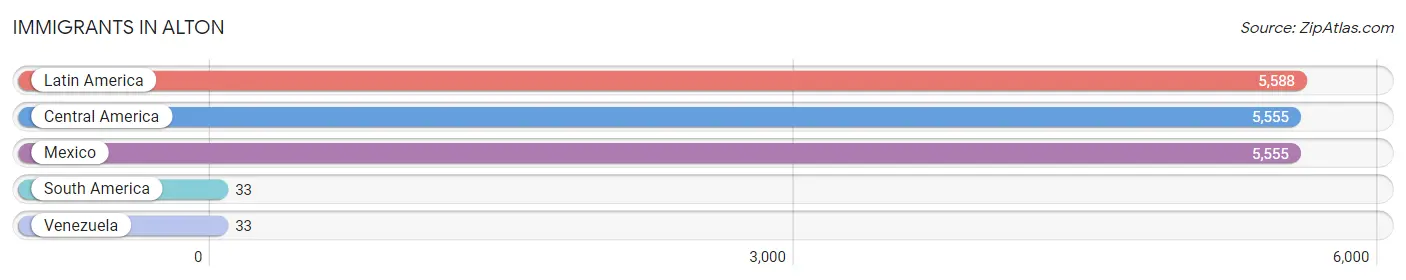
Immigrants in Alton
The most numerous immigrant groups reported in Alton came from Latin America (5,588 | 30.2%), Central America (5,555 | 30.0%), Mexico (5,555 | 30.0%), South America (33 | 0.2%), and Venezuela (33 | 0.2%), together accounting for 90.7% of all Alton residents.
| Immigration Origin | # Population | % Population |
| Central America | 5,555 | 30.0% |
| Latin America | 5,588 | 30.2% |
| Mexico | 5,555 | 30.0% |
| South America | 33 | 0.2% |
| Venezuela | 33 | 0.2% | View All 5 Rows |
Sex and Age in Alton
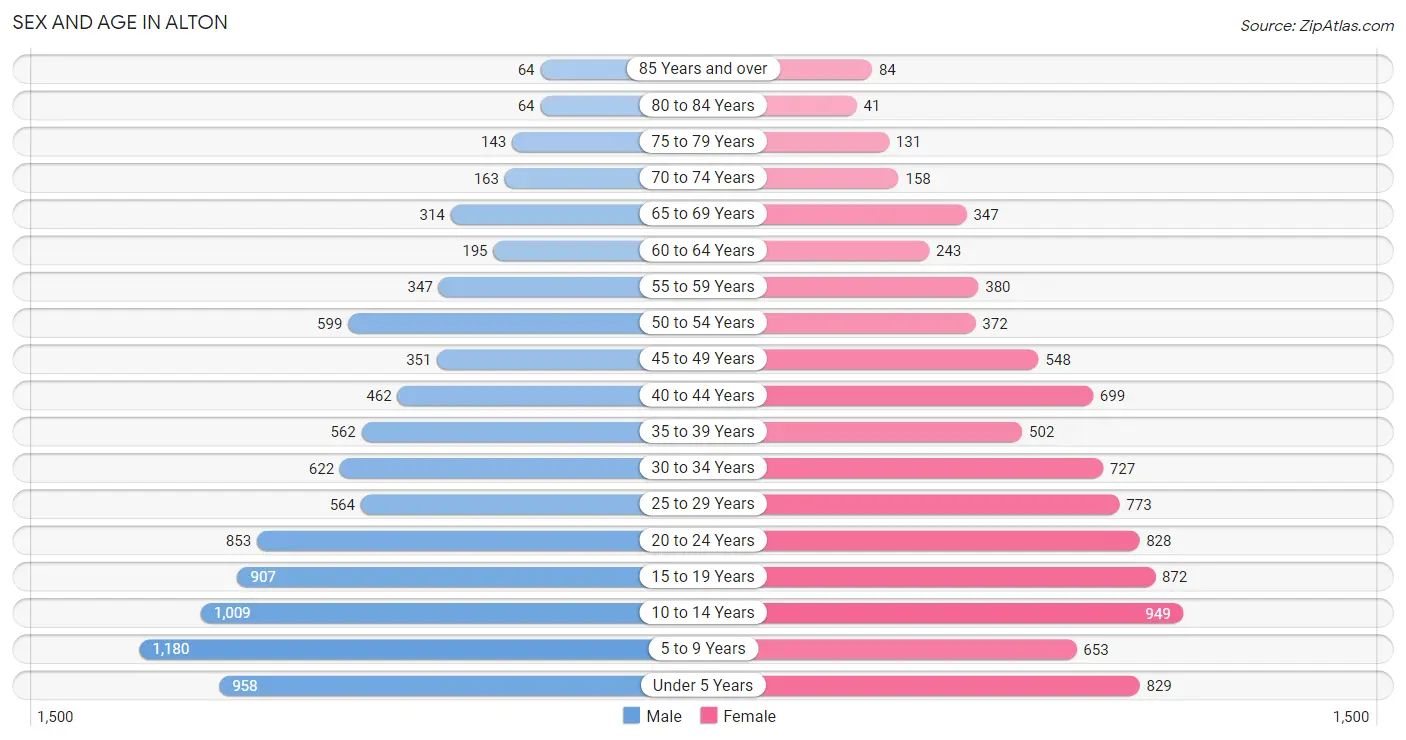
Sex and Age in Alton
The most populous age groups in Alton are 5 to 9 Years (1,180 | 12.6%) for men and 10 to 14 Years (949 | 10.4%) for women.
| Age Bracket | Male | Female |
| Under 5 Years | 958 (10.2%) | 829 (9.1%) |
| 5 to 9 Years | 1,180 (12.6%) | 653 (7.1%) |
| 10 to 14 Years | 1,009 (10.8%) | 949 (10.4%) |
| 15 to 19 Years | 907 (9.7%) | 872 (9.5%) |
| 20 to 24 Years | 853 (9.1%) | 828 (9.1%) |
| 25 to 29 Years | 564 (6.0%) | 773 (8.5%) |
| 30 to 34 Years | 622 (6.7%) | 727 (8.0%) |
| 35 to 39 Years | 562 (6.0%) | 502 (5.5%) |
| 40 to 44 Years | 462 (4.9%) | 699 (7.6%) |
| 45 to 49 Years | 351 (3.7%) | 548 (6.0%) |
| 50 to 54 Years | 599 (6.4%) | 372 (4.1%) |
| 55 to 59 Years | 347 (3.7%) | 380 (4.2%) |
| 60 to 64 Years | 195 (2.1%) | 243 (2.7%) |
| 65 to 69 Years | 314 (3.4%) | 347 (3.8%) |
| 70 to 74 Years | 163 (1.7%) | 158 (1.7%) |
| 75 to 79 Years | 143 (1.5%) | 131 (1.4%) |
| 80 to 84 Years | 64 (0.7%) | 41 (0.4%) |
| 85 Years and over | 64 (0.7%) | 84 (0.9%) |
| Total | 9,357 (100.0%) | 9,136 (100.0%) |
Families and Households in Alton
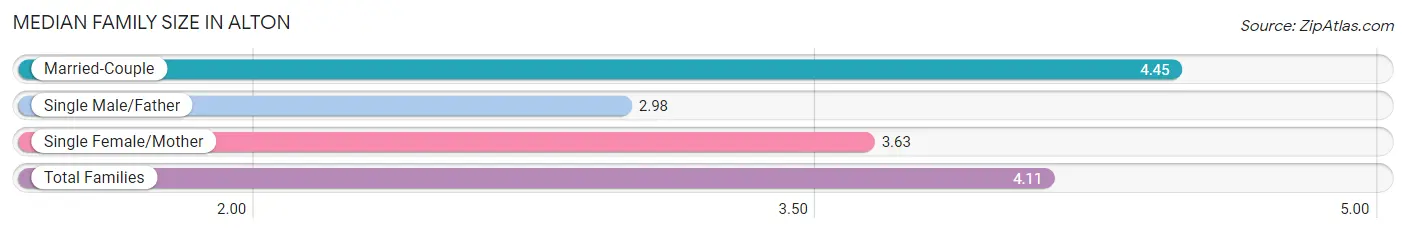
Median Family Size in Alton
The median family size in Alton is 4.11 persons per family, with married-couple families (2,557 | 61.8%) accounting for the largest median family size of 4.45 persons per family. On the other hand, single male/father families (212 | 5.1%) represent the smallest median family size with 2.98 persons per family.
| Family Type | # Families | Family Size |
| Married-Couple | 2,557 (61.8%) | 4.45 |
| Single Male/Father | 212 (5.1%) | 2.98 |
| Single Female/Mother | 1,366 (33.0%) | 3.63 |
| Total Families | 4,135 (100.0%) | 4.11 |
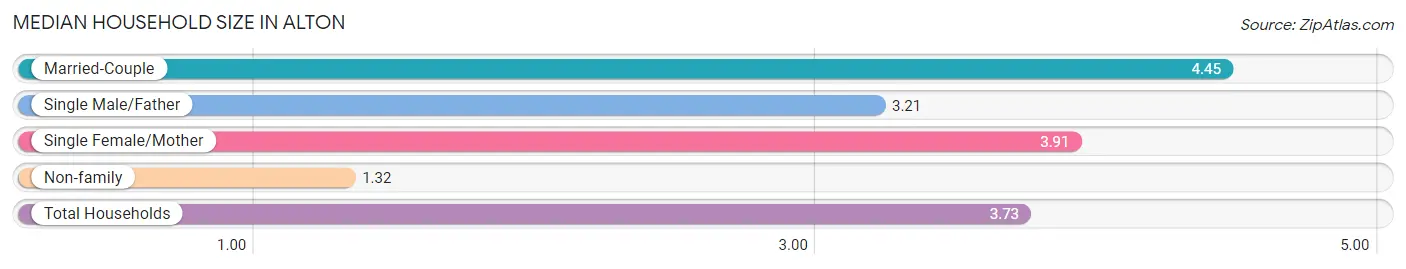
Median Household Size in Alton
The median household size in Alton is 3.73 persons per household, with married-couple households (2,557 | 51.6%) accounting for the largest median household size of 4.45 persons per household. non-family households (823 | 16.6%) represent the smallest median household size with 1.32 persons per household.
| Household Type | # Households | Household Size |
| Married-Couple | 2,557 (51.6%) | 4.45 |
| Single Male/Father | 212 (4.3%) | 3.21 |
| Single Female/Mother | 1,366 (27.6%) | 3.91 |
| Non-family | 823 (16.6%) | 1.32 |
| Total Households | 4,958 (100.0%) | 3.73 |
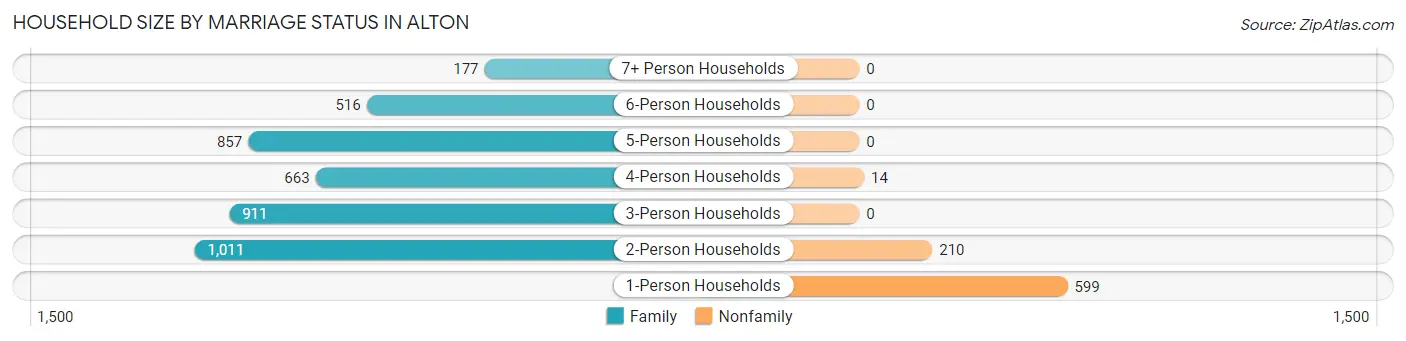
Household Size by Marriage Status in Alton
Out of a total of 4,958 households in Alton, 4,135 (83.4%) are family households, while 823 (16.6%) are nonfamily households. The most numerous type of family households are 2-person households, comprising 1,011, and the most common type of nonfamily households are 1-person households, comprising 599.
| Household Size | Family Households | Nonfamily Households |
| 1-Person Households | - | 599 (12.1%) |
| 2-Person Households | 1,011 (20.4%) | 210 (4.2%) |
| 3-Person Households | 911 (18.4%) | 0 (0.0%) |
| 4-Person Households | 663 (13.4%) | 14 (0.3%) |
| 5-Person Households | 857 (17.3%) | 0 (0.0%) |
| 6-Person Households | 516 (10.4%) | 0 (0.0%) |
| 7+ Person Households | 177 (3.6%) | 0 (0.0%) |
| Total | 4,135 (83.4%) | 823 (16.6%) |
Female Fertility in Alton
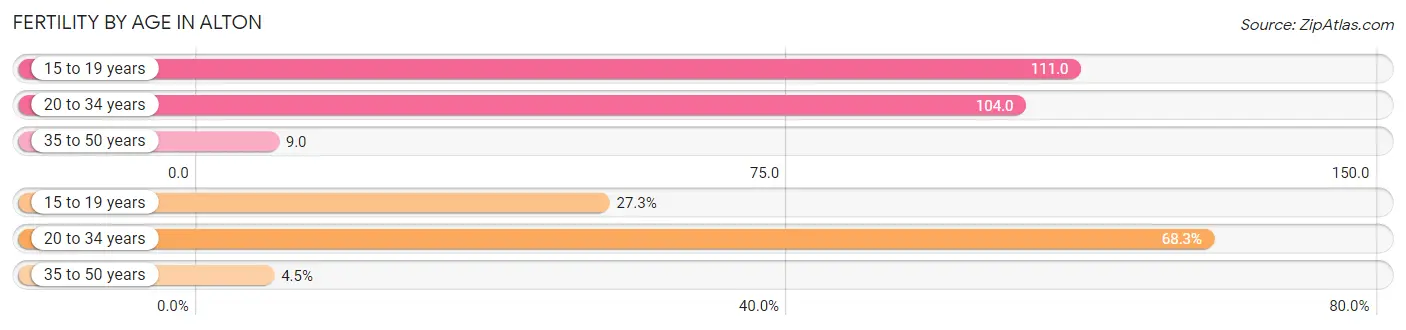
Fertility by Age in Alton
Average fertility rate in Alton is 71.0 births per 1,000 women. Women in the age bracket of 15 to 19 years have the highest fertility rate with 111.0 births per 1,000 women. Women in the age bracket of 20 to 34 years acount for 68.3% of all women with births.
| Age Bracket | Women with Births | Births / 1,000 Women |
| 15 to 19 years | 97 (27.3%) | 111.0 |
| 20 to 34 years | 243 (68.3%) | 104.0 |
| 35 to 50 years | 16 (4.5%) | 9.0 |
| Total | 356 (100.0%) | 71.0 |
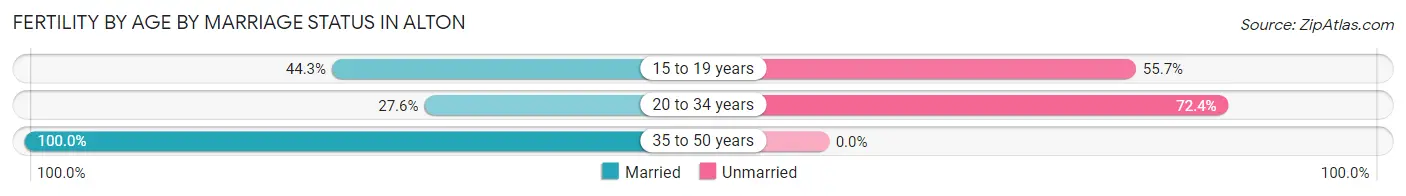
Fertility by Age by Marriage Status in Alton
35.4% of women with births (356) in Alton are married. The highest percentage of unmarried women with births falls into 20 to 34 years age bracket with 72.4% of them unmarried at the time of birth, while the lowest percentage of unmarried women with births belong to 35 to 50 years age bracket with 0.0% of them unmarried.
| Age Bracket | Married | Unmarried |
| 15 to 19 years | 43 (44.3%) | 54 (55.7%) |
| 20 to 34 years | 67 (27.6%) | 176 (72.4%) |
| 35 to 50 years | 16 (100.0%) | 0 (0.0%) |
| Total | 126 (35.4%) | 230 (64.6%) |
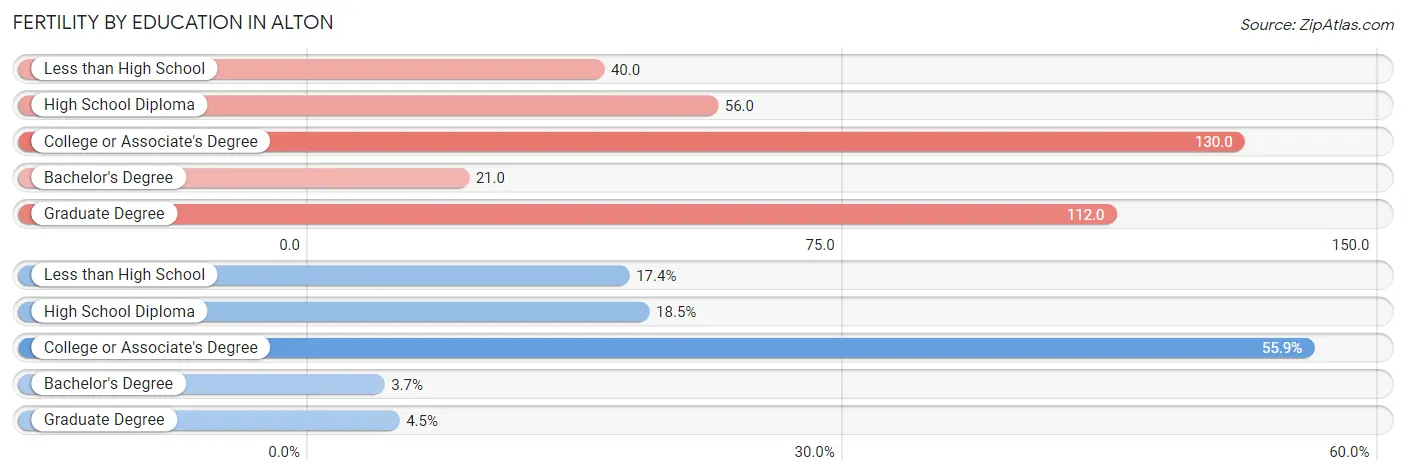
Fertility by Education in Alton
Average fertility rate in Alton is 71.0 births per 1,000 women. Women with the education attainment of college or associate's degree have the highest fertility rate of 130.0 births per 1,000 women, while women with the education attainment of bachelor's degree have the lowest fertility at 21.0 births per 1,000 women. Women with the education attainment of college or associate's degree represent 55.9% of all women with births.
| Educational Attainment | Women with Births | Births / 1,000 Women |
| Less than High School | 62 (17.4%) | 40.0 |
| High School Diploma | 66 (18.5%) | 56.0 |
| College or Associate's Degree | 199 (55.9%) | 130.0 |
| Bachelor's Degree | 13 (3.6%) | 21.0 |
| Graduate Degree | 16 (4.5%) | 112.0 |
| Total | 356 (100.0%) | 71.0 |
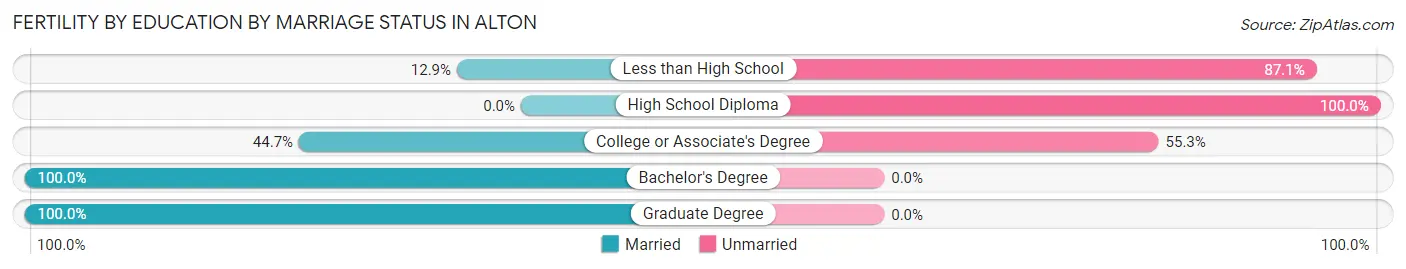
Fertility by Education by Marriage Status in Alton
64.6% of women with births in Alton are unmarried. Women with the educational attainment of bachelor's degree are most likely to be married with 100.0% of them married at childbirth, while women with the educational attainment of high school diploma are least likely to be married with 100.0% of them unmarried at childbirth.
| Educational Attainment | Married | Unmarried |
| Less than High School | 8 (12.9%) | 54 (87.1%) |
| High School Diploma | 0 (0.0%) | 66 (100.0%) |
| College or Associate's Degree | 89 (44.7%) | 110 (55.3%) |
| Bachelor's Degree | 13 (100.0%) | 0 (0.0%) |
| Graduate Degree | 16 (100.0%) | 0 (0.0%) |
| Total | 126 (35.4%) | 230 (64.6%) |
Income in Alton
Income Overview in Alton
Per Capita Income in Alton is $15,656, while median incomes of families and households are $45,230 and $44,317 respectively.
| Characteristic | Number | Measure |
| Per Capita Income | 18,493 | $15,656 |
| Median Family Income | 4,135 | $45,230 |
| Mean Family Income | 4,135 | $57,403 |
| Median Household Income | 4,958 | $44,317 |
| Mean Household Income | 4,958 | $56,071 |
| Income Deficit | 4,135 | $12,888 |
| Wage / Income Gap (%) | 18,493 | 10.69% |
| Wage / Income Gap ($) | 18,493 | 89.31¢ per $1 |
| Gini / Inequality Index | 18,493 | 0.42 |
Earnings by Sex in Alton
Average Earnings in Alton are $24,761, $25,938 for men and $23,164 for women, a difference of 10.7%.
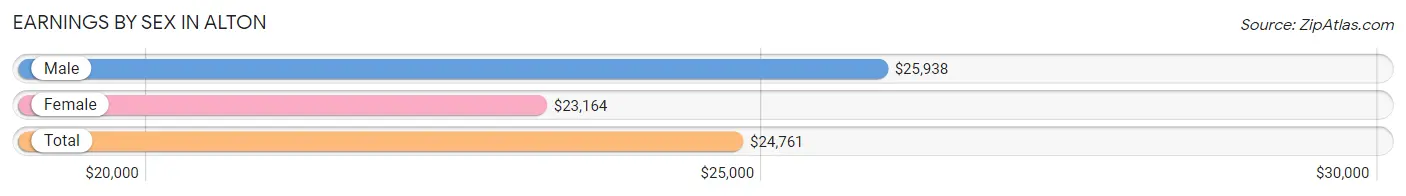
| Sex | Number | Average Earnings |
| Male | 4,337 (52.7%) | $25,938 |
| Female | 3,893 (47.3%) | $23,164 |
| Total | 8,230 (100.0%) | $24,761 |
Earnings by Sex by Income Bracket in Alton
The most common earnings brackets in Alton are $2,499 or less for men (432 | 10.0%) and $10,000 to $12,499 for women (362 | 9.3%).
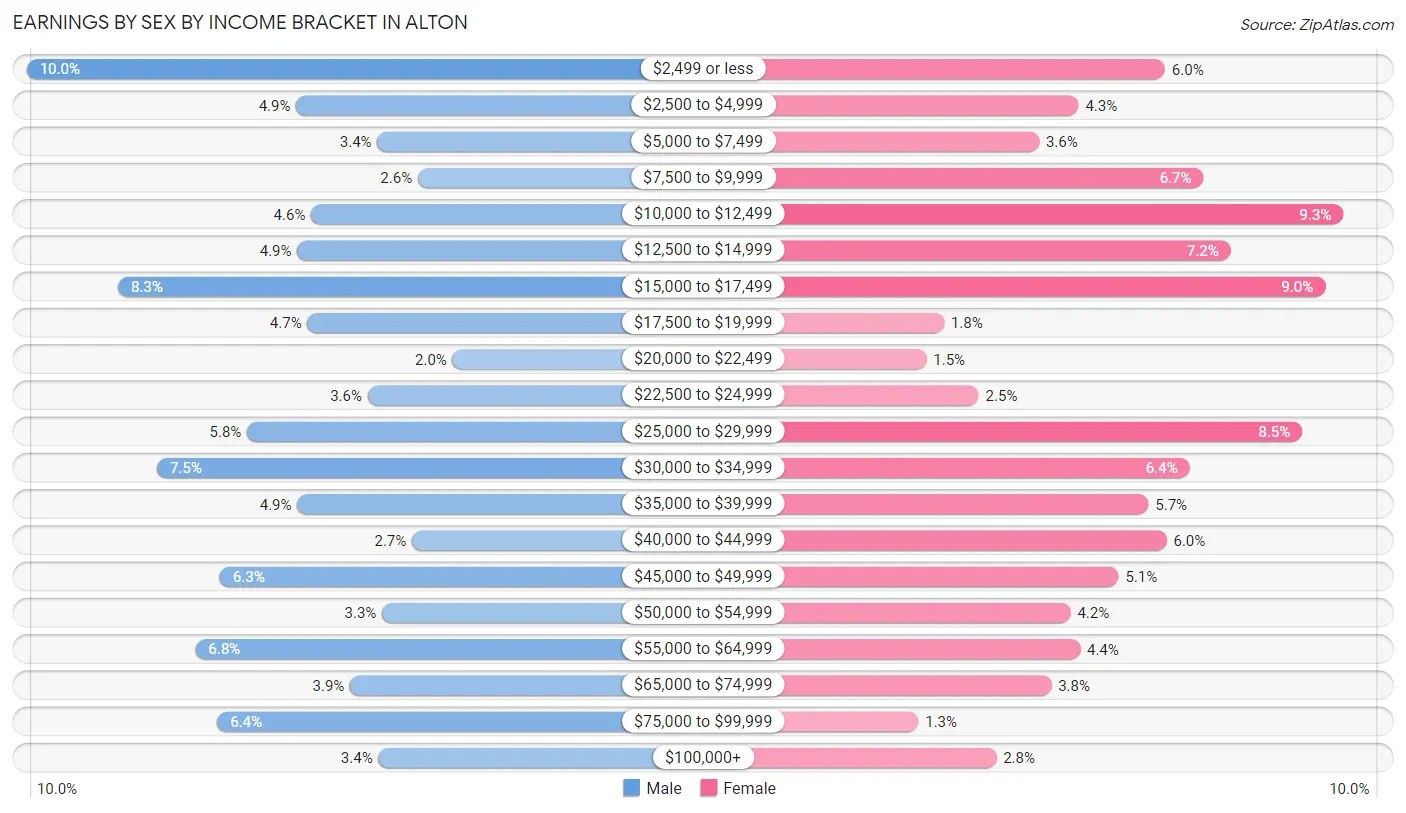
| Income | Male | Female |
| $2,499 or less | 432 (10.0%) | 232 (6.0%) |
| $2,500 to $4,999 | 213 (4.9%) | 169 (4.3%) |
| $5,000 to $7,499 | 147 (3.4%) | 140 (3.6%) |
| $7,500 to $9,999 | 114 (2.6%) | 260 (6.7%) |
| $10,000 to $12,499 | 201 (4.6%) | 362 (9.3%) |
| $12,500 to $14,999 | 212 (4.9%) | 280 (7.2%) |
| $15,000 to $17,499 | 358 (8.3%) | 349 (9.0%) |
| $17,500 to $19,999 | 204 (4.7%) | 71 (1.8%) |
| $20,000 to $22,499 | 86 (2.0%) | 58 (1.5%) |
| $22,500 to $24,999 | 155 (3.6%) | 96 (2.5%) |
| $25,000 to $29,999 | 253 (5.8%) | 332 (8.5%) |
| $30,000 to $34,999 | 326 (7.5%) | 250 (6.4%) |
| $35,000 to $39,999 | 212 (4.9%) | 220 (5.7%) |
| $40,000 to $44,999 | 119 (2.7%) | 233 (6.0%) |
| $45,000 to $49,999 | 275 (6.3%) | 198 (5.1%) |
| $50,000 to $54,999 | 143 (3.3%) | 163 (4.2%) |
| $55,000 to $64,999 | 295 (6.8%) | 170 (4.4%) |
| $65,000 to $74,999 | 169 (3.9%) | 149 (3.8%) |
| $75,000 to $99,999 | 277 (6.4%) | 52 (1.3%) |
| $100,000+ | 146 (3.4%) | 109 (2.8%) |
| Total | 4,337 (100.0%) | 3,893 (100.0%) |
Earnings by Sex by Educational Attainment in Alton
Average earnings in Alton are $29,977 for men and $28,286 for women, a difference of 5.6%. Men with an educational attainment of bachelor's degree enjoy the highest average annual earnings of $58,672, while those with less than high school education earn the least with $19,932. Women with an educational attainment of graduate degree earn the most with the average annual earnings of $44,716, while those with less than high school education have the smallest earnings of $13,633.
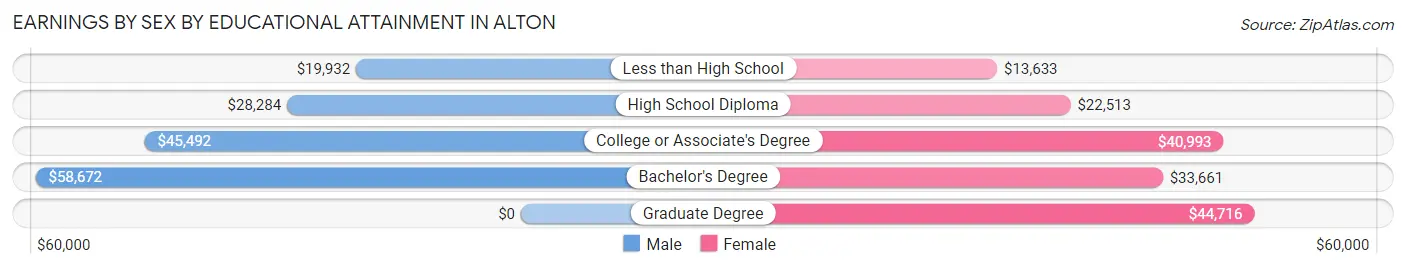
| Educational Attainment | Male Income | Female Income |
| Less than High School | $19,932 | $13,633 |
| High School Diploma | $28,284 | $22,513 |
| College or Associate's Degree | $45,492 | $40,993 |
| Bachelor's Degree | $58,672 | $33,661 |
| Graduate Degree | - | - |
| Total | $29,977 | $28,286 |
Family Income in Alton
Family Income Brackets in Alton
According to the Alton family income data, there are 707 families falling into the $35,000 to $49,999 income range, which is the most common income bracket and makes up 17.1% of all families. Conversely, the $150,000 to $199,999 income bracket is the least frequent group with only 95 families (2.3%) belonging to this category.
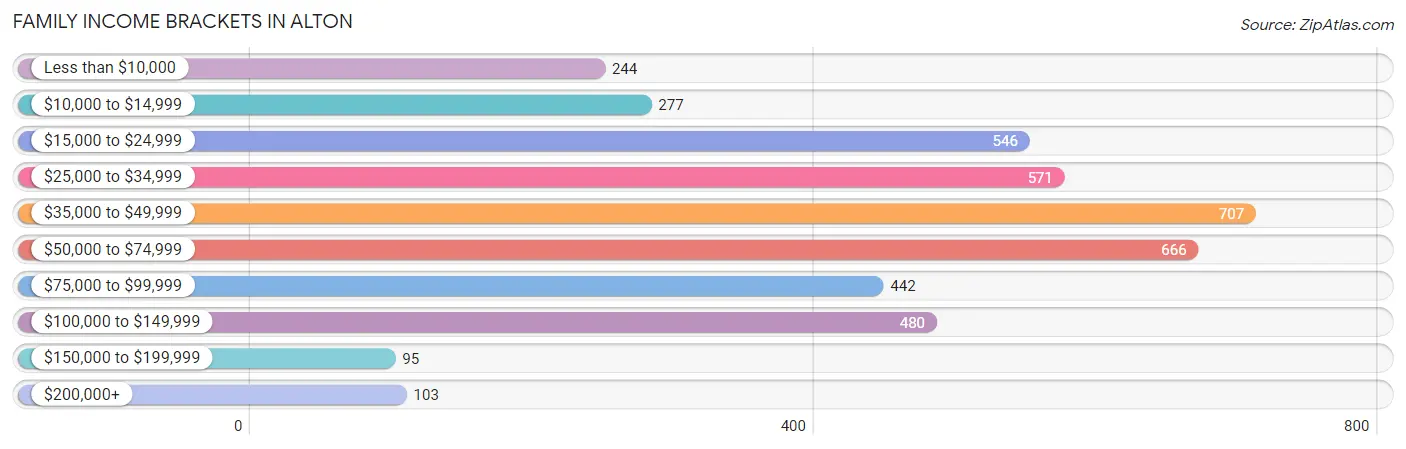
| Income Bracket | # Families | % Families |
| Less than $10,000 | 244 | 5.9% |
| $10,000 to $14,999 | 277 | 6.7% |
| $15,000 to $24,999 | 546 | 13.2% |
| $25,000 to $34,999 | 571 | 13.8% |
| $35,000 to $49,999 | 707 | 17.1% |
| $50,000 to $74,999 | 666 | 16.1% |
| $75,000 to $99,999 | 442 | 10.7% |
| $100,000 to $149,999 | 480 | 11.6% |
| $150,000 to $199,999 | 95 | 2.3% |
| $200,000+ | 103 | 2.5% |
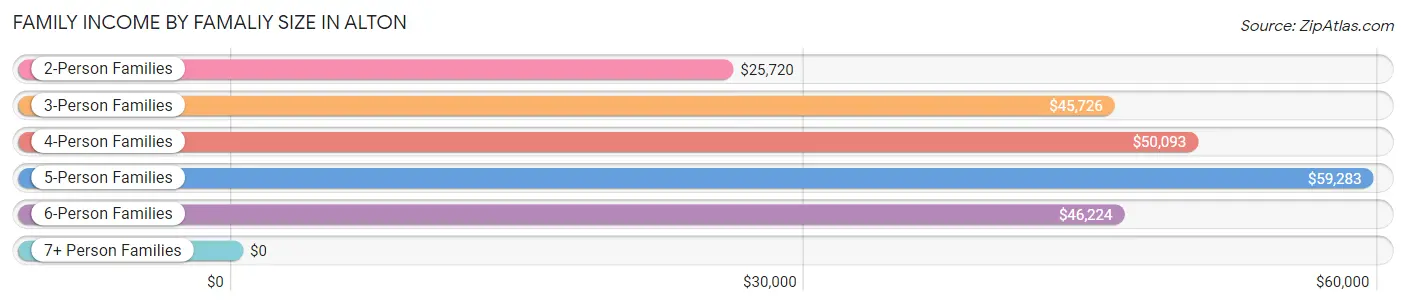
Family Income by Famaliy Size in Alton
5-person families (901 | 21.8%) account for the highest median family income in Alton with $59,283 per family, while 3-person families (778 | 18.8%) have the highest median income of $15,242 per family member.
| Income Bracket | # Families | Median Income |
| 2-Person Families | 1,213 (29.3%) | $25,720 |
| 3-Person Families | 778 (18.8%) | $45,726 |
| 4-Person Families | 632 (15.3%) | $50,093 |
| 5-Person Families | 901 (21.8%) | $59,283 |
| 6-Person Families | 434 (10.5%) | $46,224 |
| 7+ Person Families | 177 (4.3%) | $0 |
| Total | 4,135 (100.0%) | $45,230 |
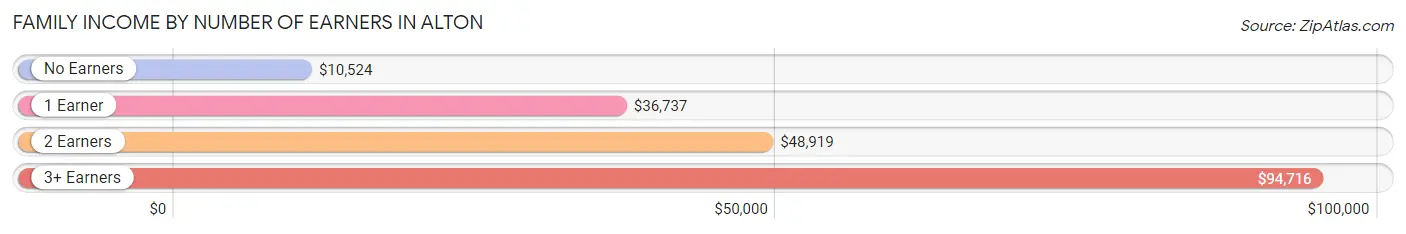
Family Income by Number of Earners in Alton
The median family income in Alton is $45,230, with families comprising 3+ earners (643) having the highest median family income of $94,716, while families with no earners (414) have the lowest median family income of $10,524, accounting for 15.5% and 10.0% of families, respectively.
| Number of Earners | # Families | Median Income |
| No Earners | 414 (10.0%) | $10,524 |
| 1 Earner | 1,680 (40.6%) | $36,737 |
| 2 Earners | 1,398 (33.8%) | $48,919 |
| 3+ Earners | 643 (15.5%) | $94,716 |
| Total | 4,135 (100.0%) | $45,230 |
Household Income in Alton
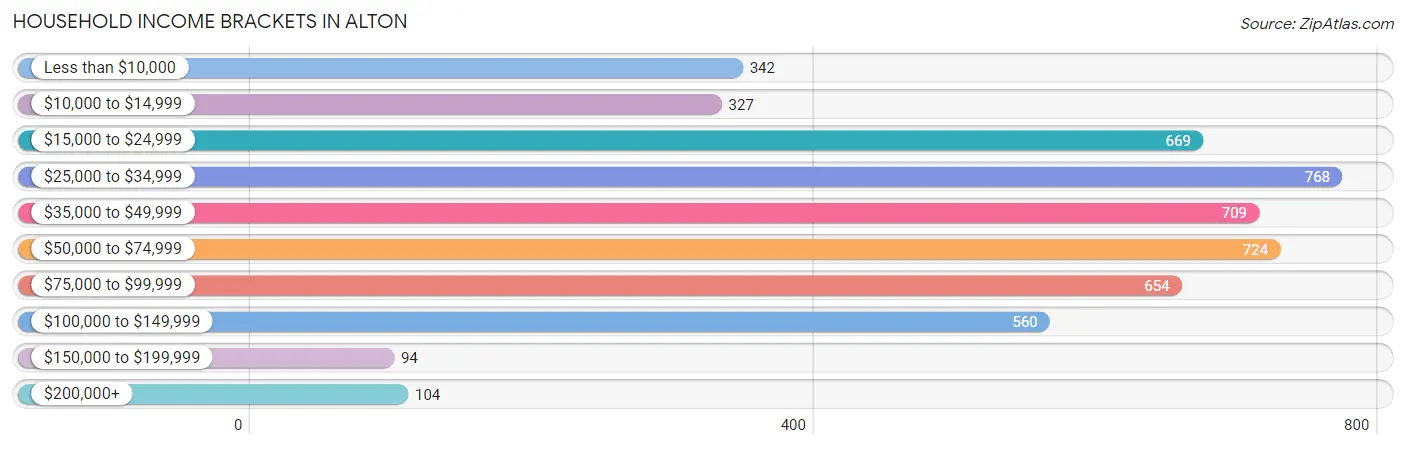
Household Income Brackets in Alton
With 768 households falling in the category, the $25,000 to $34,999 income range is the most frequent in Alton, accounting for 15.5% of all households. In contrast, only 94 households (1.9%) fall into the $150,000 to $199,999 income bracket, making it the least populous group.
| Income Bracket | # Households | % Households |
| Less than $10,000 | 342 | 6.9% |
| $10,000 to $14,999 | 327 | 6.6% |
| $15,000 to $24,999 | 669 | 13.5% |
| $25,000 to $34,999 | 768 | 15.5% |
| $35,000 to $49,999 | 709 | 14.3% |
| $50,000 to $74,999 | 724 | 14.6% |
| $75,000 to $99,999 | 654 | 13.2% |
| $100,000 to $149,999 | 560 | 11.3% |
| $150,000 to $199,999 | 94 | 1.9% |
| $200,000+ | 104 | 2.1% |
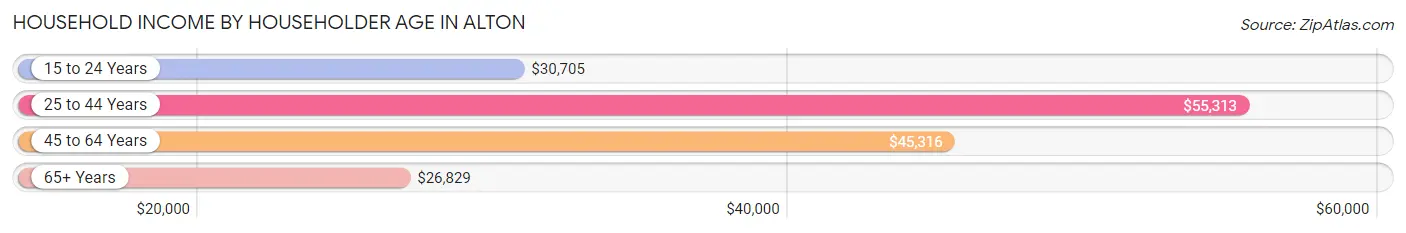
Household Income by Householder Age in Alton
The median household income in Alton is $44,317, with the highest median household income of $55,313 found in the 25 to 44 years age bracket for the primary householder. A total of 2,161 households (43.6%) fall into this category. Meanwhile, the 65+ years age bracket for the primary householder has the lowest median household income of $26,829, with 692 households (14.0%) in this group.
| Income Bracket | # Households | Median Income |
| 15 to 24 Years | 325 (6.6%) | $30,705 |
| 25 to 44 Years | 2,161 (43.6%) | $55,313 |
| 45 to 64 Years | 1,780 (35.9%) | $45,316 |
| 65+ Years | 692 (14.0%) | $26,829 |
| Total | 4,958 (100.0%) | $44,317 |
Poverty in Alton
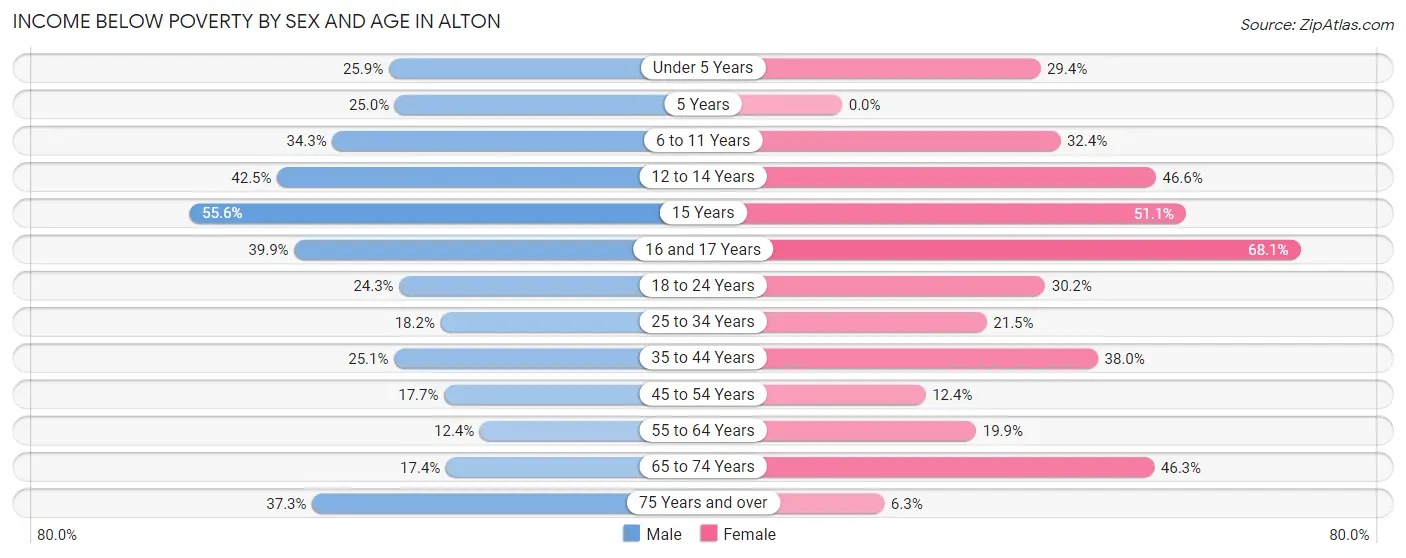
Income Below Poverty by Sex and Age in Alton
With 26.2% poverty level for males and 30.0% for females among the residents of Alton, 15 year old males and 16 and 17 year old females are the most vulnerable to poverty, with 100 males (55.6%) and 175 females (68.1%) in their respective age groups living below the poverty level.
| Age Bracket | Male | Female |
| Under 5 Years | 248 (25.9%) | 244 (29.4%) |
| 5 Years | 35 (25.0%) | 0 (0.0%) |
| 6 to 11 Years | 511 (34.3%) | 302 (32.4%) |
| 12 to 14 Years | 237 (42.5%) | 260 (46.6%) |
| 15 Years | 100 (55.6%) | 139 (51.1%) |
| 16 and 17 Years | 119 (39.9%) | 175 (68.1%) |
| 18 to 24 Years | 312 (24.3%) | 353 (30.1%) |
| 25 to 34 Years | 216 (18.2%) | 322 (21.5%) |
| 35 to 44 Years | 257 (25.1%) | 456 (38.0%) |
| 45 to 54 Years | 168 (17.7%) | 114 (12.4%) |
| 55 to 64 Years | 67 (12.4%) | 124 (19.9%) |
| 65 to 74 Years | 83 (17.4%) | 234 (46.3%) |
| 75 Years and over | 101 (37.3%) | 16 (6.2%) |
| Total | 2,454 (26.2%) | 2,739 (30.0%) |
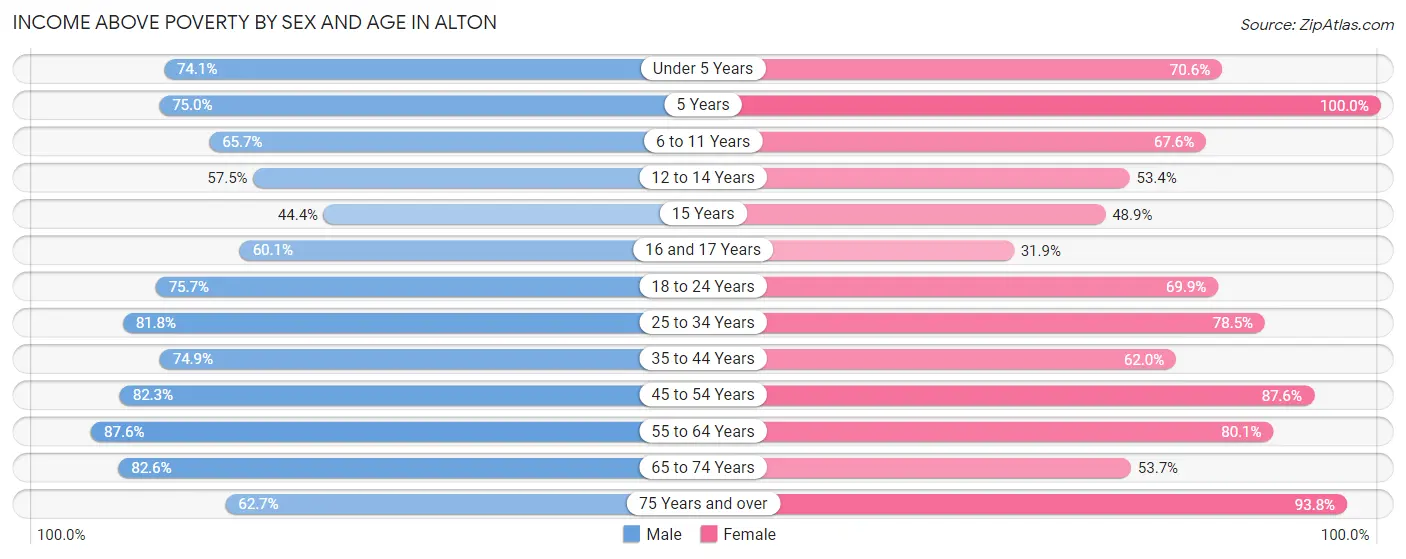
Income Above Poverty by Sex and Age in Alton
According to the poverty statistics in Alton, males aged 55 to 64 years and females aged 5 years are the age groups that are most secure financially, with 87.6% of males and 100.0% of females in these age groups living above the poverty line.
| Age Bracket | Male | Female |
| Under 5 Years | 710 (74.1%) | 585 (70.6%) |
| 5 Years | 105 (75.0%) | 94 (100.0%) |
| 6 to 11 Years | 980 (65.7%) | 630 (67.6%) |
| 12 to 14 Years | 321 (57.5%) | 298 (53.4%) |
| 15 Years | 80 (44.4%) | 133 (48.9%) |
| 16 and 17 Years | 179 (60.1%) | 82 (31.9%) |
| 18 to 24 Years | 970 (75.7%) | 818 (69.9%) |
| 25 to 34 Years | 970 (81.8%) | 1,178 (78.5%) |
| 35 to 44 Years | 767 (74.9%) | 745 (62.0%) |
| 45 to 54 Years | 782 (82.3%) | 806 (87.6%) |
| 55 to 64 Years | 475 (87.6%) | 499 (80.1%) |
| 65 to 74 Years | 394 (82.6%) | 271 (53.7%) |
| 75 Years and over | 170 (62.7%) | 240 (93.8%) |
| Total | 6,903 (73.8%) | 6,379 (70.0%) |
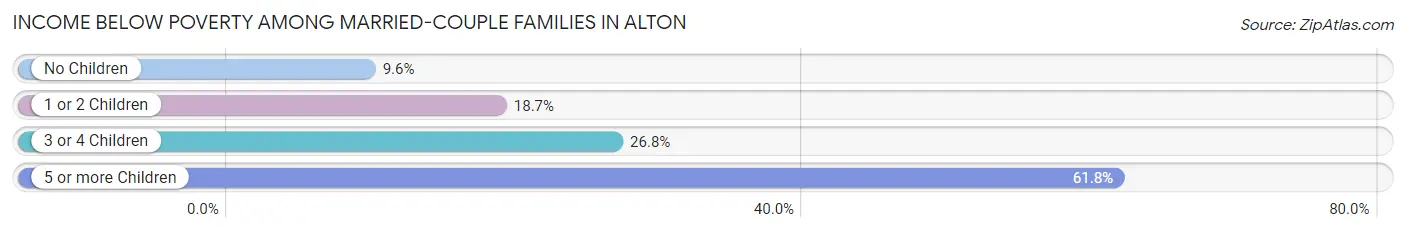
Income Below Poverty Among Married-Couple Families in Alton
The poverty statistics for married-couple families in Alton show that 18.8% or 480 of the total 2,557 families live below the poverty line. Families with 5 or more children have the highest poverty rate of 61.8%, comprising of 42 families. On the other hand, families with no children have the lowest poverty rate of 9.6%, which includes 82 families.
| Children | Above Poverty | Below Poverty |
| No Children | 773 (90.4%) | 82 (9.6%) |
| 1 or 2 Children | 825 (81.3%) | 190 (18.7%) |
| 3 or 4 Children | 453 (73.2%) | 166 (26.8%) |
| 5 or more Children | 26 (38.2%) | 42 (61.8%) |
| Total | 2,077 (81.2%) | 480 (18.8%) |
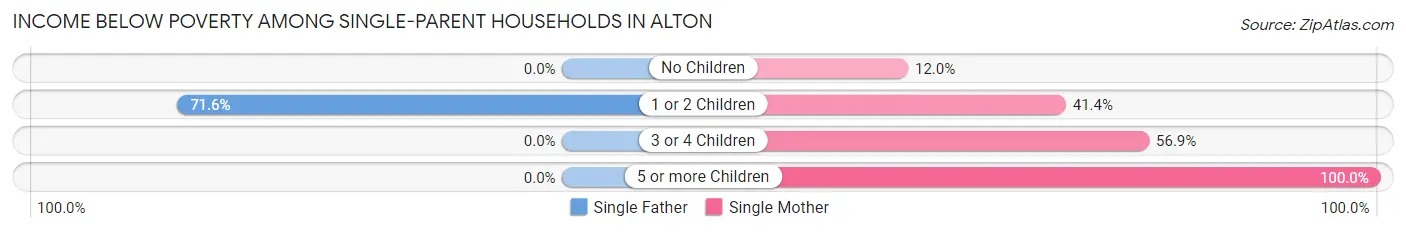
Income Below Poverty Among Single-Parent Households in Alton
According to the poverty data in Alton, 34.4% or 73 single-father households and 37.8% or 516 single-mother households are living below the poverty line. Among single-father households, those with 1 or 2 children have the highest poverty rate, with 73 households (71.6%) experiencing poverty. Likewise, among single-mother households, those with 5 or more children have the highest poverty rate, with 28 households (100.0%) falling below the poverty line.
| Children | Single Father | Single Mother |
| No Children | 0 (0.0%) | 41 (12.0%) |
| 1 or 2 Children | 73 (71.6%) | 319 (41.4%) |
| 3 or 4 Children | 0 (0.0%) | 128 (56.9%) |
| 5 or more Children | 0 (0.0%) | 28 (100.0%) |
| Total | 73 (34.4%) | 516 (37.8%) |
Income Below Poverty Among Married-Couple vs Single-Parent Households in Alton
The poverty data for Alton shows that 480 of the married-couple family households (18.8%) and 589 of the single-parent households (37.3%) are living below the poverty level. Within the married-couple family households, those with 5 or more children have the highest poverty rate, with 42 households (61.8%) falling below the poverty line. Among the single-parent households, those with 5 or more children have the highest poverty rate, with 28 household (100.0%) living below poverty.
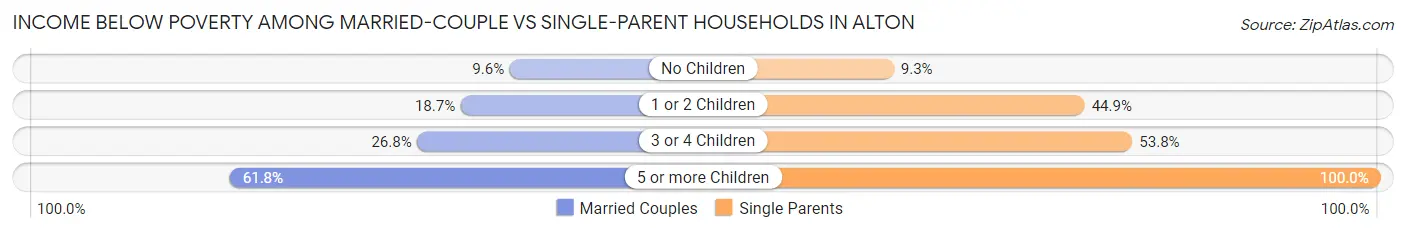
| Children | Married-Couple Families | Single-Parent Households |
| No Children | 82 (9.6%) | 41 (9.3%) |
| 1 or 2 Children | 190 (18.7%) | 392 (44.9%) |
| 3 or 4 Children | 166 (26.8%) | 128 (53.8%) |
| 5 or more Children | 42 (61.8%) | 28 (100.0%) |
| Total | 480 (18.8%) | 589 (37.3%) |
Employment Characteristics in Alton
Employment by Class of Employer in Alton
Among the 6,825 employed individuals in Alton, private company employees (4,823 | 70.7%), self-employed (not incorporated) (768 | 11.3%), and state government employees (385 | 5.6%) make up the most common classes of employment.
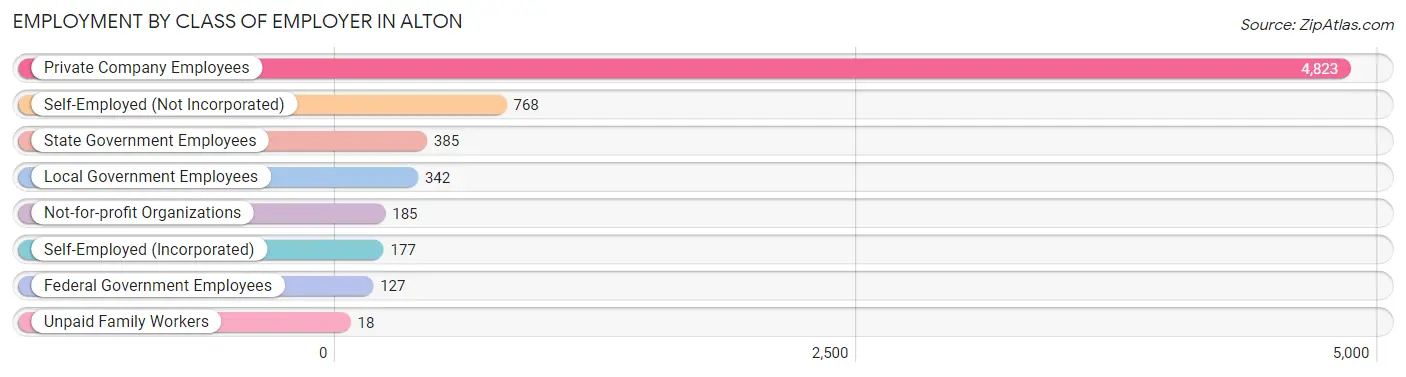
| Employer Class | # Employees | % Employees |
| Private Company Employees | 4,823 | 70.7% |
| Self-Employed (Incorporated) | 177 | 2.6% |
| Self-Employed (Not Incorporated) | 768 | 11.3% |
| Not-for-profit Organizations | 185 | 2.7% |
| Local Government Employees | 342 | 5.0% |
| State Government Employees | 385 | 5.6% |
| Federal Government Employees | 127 | 1.9% |
| Unpaid Family Workers | 18 | 0.3% |
| Total | 6,825 | 100.0% |
Employment Status by Age in Alton
According to the labor force statistics for Alton, out of the total population over 16 years of age (12,463), 63.3% or 7,889 individuals are in the labor force, with 9.3% or 734 of them unemployed. The age group with the highest labor force participation rate is 25 to 29 years, with 86.4% or 1,155 individuals in the labor force. Within the labor force, the 16 to 19 years age range has the highest percentage of unemployed individuals, with 59.4% or 129 of them being unemployed.
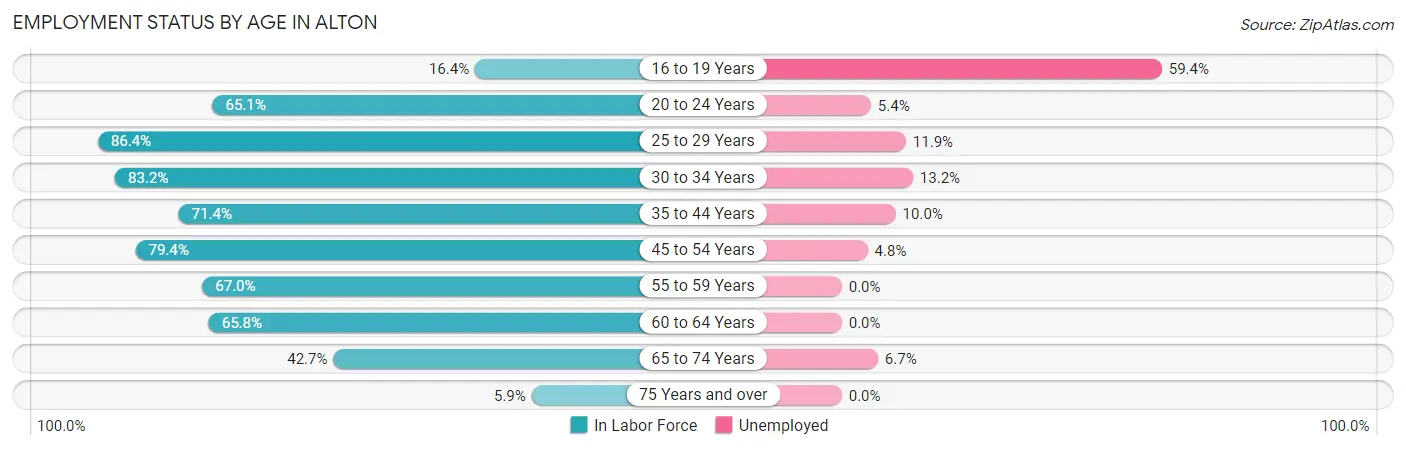
| Age Bracket | In Labor Force | Unemployed |
| 16 to 19 Years | 218 (16.4%) | 129 (59.4%) |
| 20 to 24 Years | 1,094 (65.1%) | 59 (5.4%) |
| 25 to 29 Years | 1,155 (86.4%) | 137 (11.9%) |
| 30 to 34 Years | 1,122 (83.2%) | 148 (13.2%) |
| 35 to 44 Years | 1,589 (71.4%) | 159 (10.0%) |
| 45 to 54 Years | 1,485 (79.4%) | 71 (4.8%) |
| 55 to 59 Years | 487 (67.0%) | 0 (0.0%) |
| 60 to 64 Years | 288 (65.8%) | 0 (0.0%) |
| 65 to 74 Years | 419 (42.7%) | 28 (6.7%) |
| 75 Years and over | 31 (5.9%) | 0 (0.0%) |
| Total | 7,889 (63.3%) | 734 (9.3%) |
Employment Status by Educational Attainment in Alton
According to labor force statistics for Alton, 77.1% of individuals (6,126) out of the total population between 25 and 64 years of age (7,946) are in the labor force, with 8.4% or 515 of them being unemployed. The group with the highest labor force participation rate are those with the educational attainment of bachelor's degree or higher, with 95.6% or 905 individuals in the labor force. Within the labor force, individuals with less than high school education have the highest percentage of unemployment, with 12.2% or 227 of them being unemployed.
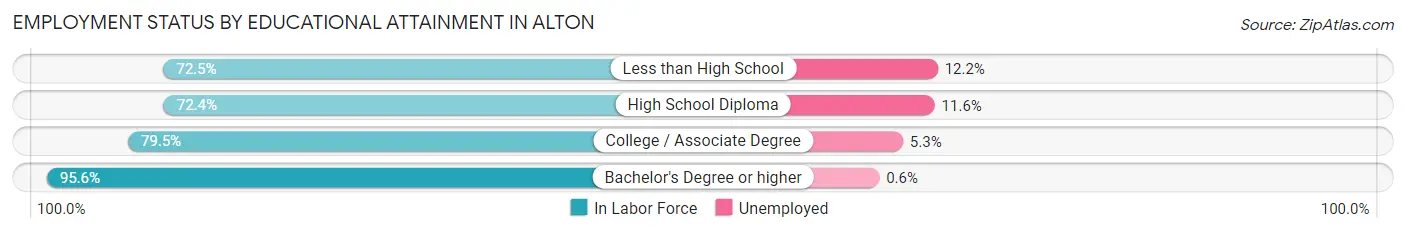
| Educational Attainment | In Labor Force | Unemployed |
| Less than High School | 1,860 (72.5%) | 313 (12.2%) |
| High School Diploma | 1,667 (72.4%) | 267 (11.6%) |
| College / Associate Degree | 1,693 (79.5%) | 113 (5.3%) |
| Bachelor's Degree or higher | 905 (95.6%) | 6 (0.6%) |
| Total | 6,126 (77.1%) | 667 (8.4%) |
Employment Occupations by Sex in Alton
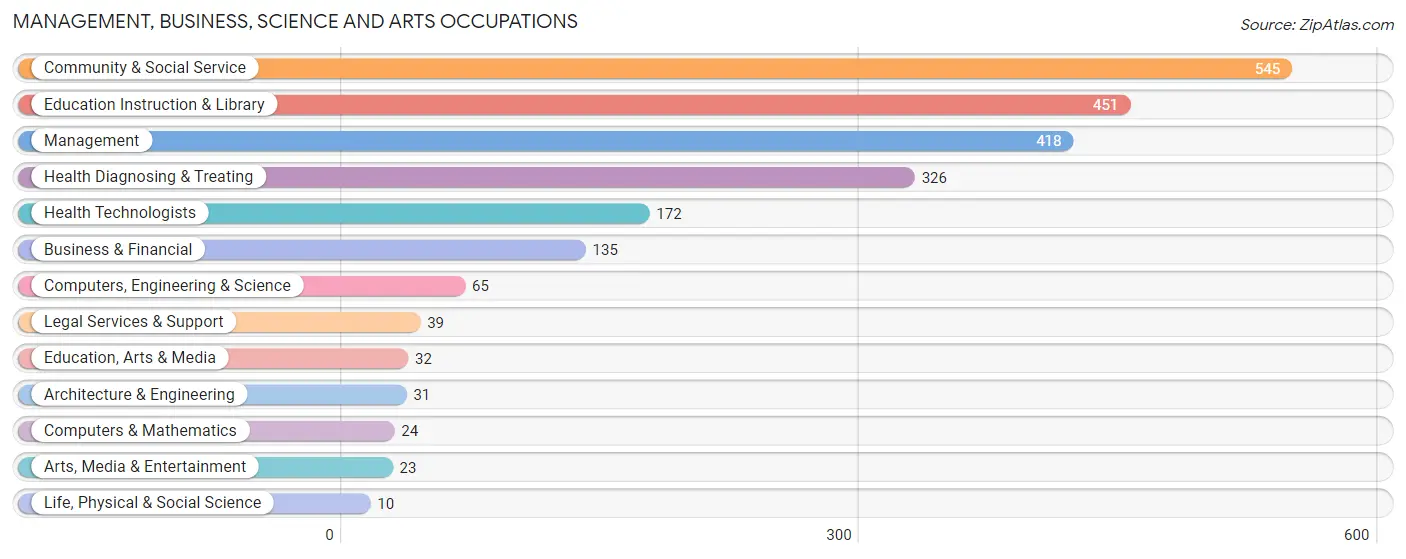
Management, Business, Science and Arts Occupations
The most common Management, Business, Science and Arts occupations in Alton are Community & Social Service (545 | 7.6%), Education Instruction & Library (451 | 6.3%), Management (418 | 5.9%), Health Diagnosing & Treating (326 | 4.6%), and Health Technologists (172 | 2.4%).
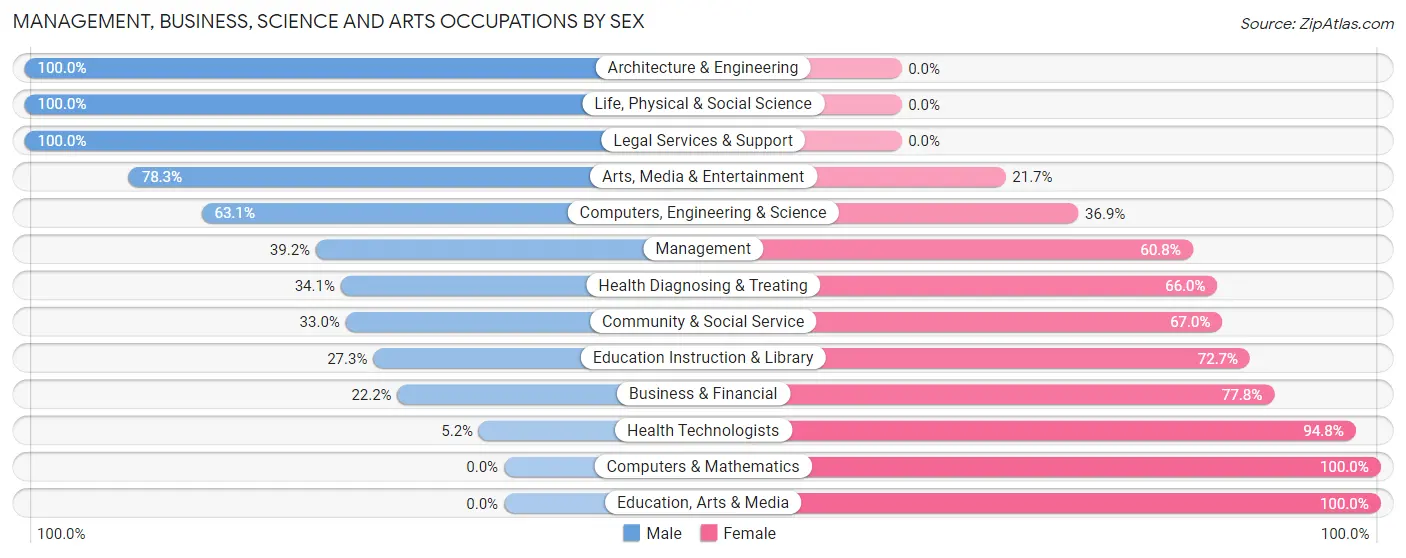
Management, Business, Science and Arts Occupations by Sex
Within the Management, Business, Science and Arts occupations in Alton, the most male-oriented occupations are Architecture & Engineering (100.0%), Life, Physical & Social Science (100.0%), and Legal Services & Support (100.0%), while the most female-oriented occupations are Computers & Mathematics (100.0%), Education, Arts & Media (100.0%), and Health Technologists (94.8%).
| Occupation | Male | Female |
| Management | 164 (39.2%) | 254 (60.8%) |
| Business & Financial | 30 (22.2%) | 105 (77.8%) |
| Computers, Engineering & Science | 41 (63.1%) | 24 (36.9%) |
| Computers & Mathematics | 0 (0.0%) | 24 (100.0%) |
| Architecture & Engineering | 31 (100.0%) | 0 (0.0%) |
| Life, Physical & Social Science | 10 (100.0%) | 0 (0.0%) |
| Community & Social Service | 180 (33.0%) | 365 (67.0%) |
| Education, Arts & Media | 0 (0.0%) | 32 (100.0%) |
| Legal Services & Support | 39 (100.0%) | 0 (0.0%) |
| Education Instruction & Library | 123 (27.3%) | 328 (72.7%) |
| Arts, Media & Entertainment | 18 (78.3%) | 5 (21.7%) |
| Health Diagnosing & Treating | 111 (34.1%) | 215 (65.9%) |
| Health Technologists | 9 (5.2%) | 163 (94.8%) |
| Total (Category) | 526 (35.3%) | 963 (64.7%) |
| Total (Overall) | 3,916 (54.8%) | 3,234 (45.2%) |
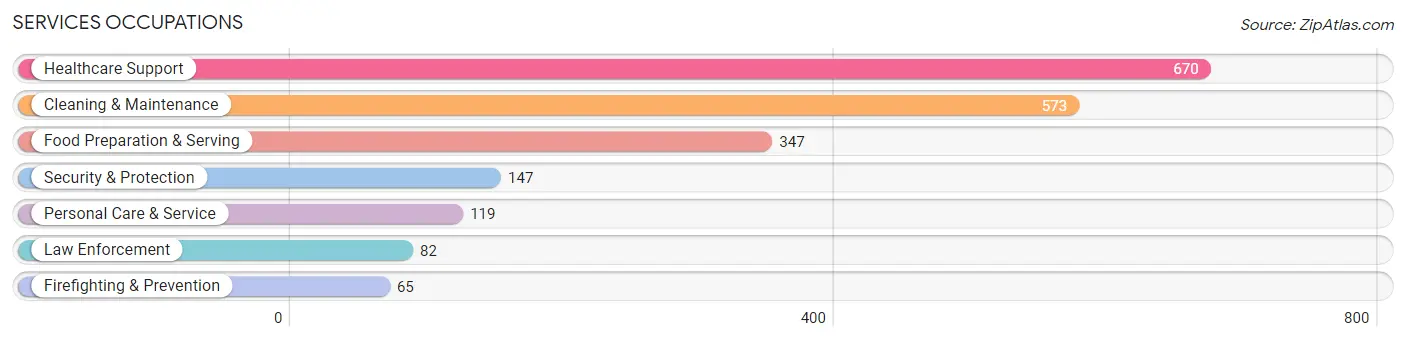
Services Occupations
The most common Services occupations in Alton are Healthcare Support (670 | 9.4%), Cleaning & Maintenance (573 | 8.0%), Food Preparation & Serving (347 | 4.9%), Security & Protection (147 | 2.1%), and Personal Care & Service (119 | 1.7%).
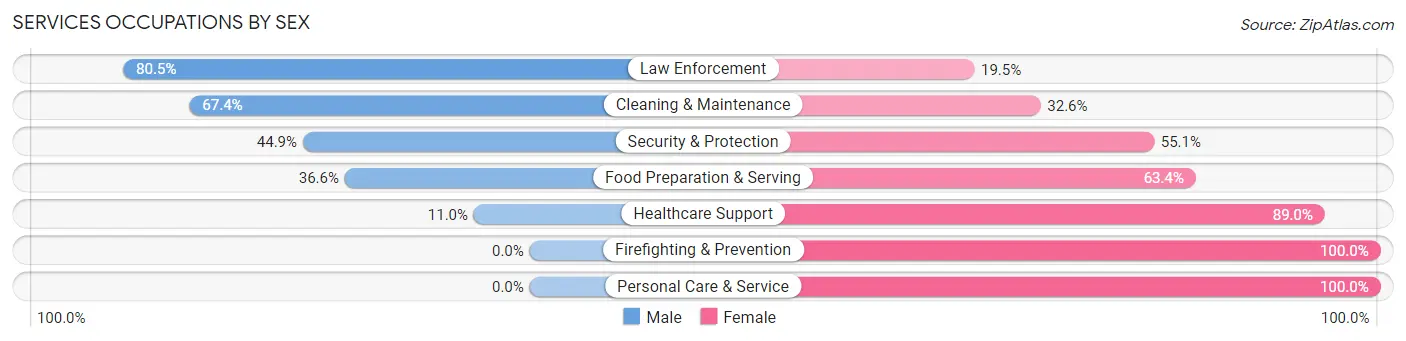
Services Occupations by Sex
Within the Services occupations in Alton, the most male-oriented occupations are Law Enforcement (80.5%), Cleaning & Maintenance (67.4%), and Security & Protection (44.9%), while the most female-oriented occupations are Firefighting & Prevention (100.0%), Personal Care & Service (100.0%), and Healthcare Support (89.0%).
| Occupation | Male | Female |
| Healthcare Support | 74 (11.0%) | 596 (89.0%) |
| Security & Protection | 66 (44.9%) | 81 (55.1%) |
| Firefighting & Prevention | 0 (0.0%) | 65 (100.0%) |
| Law Enforcement | 66 (80.5%) | 16 (19.5%) |
| Food Preparation & Serving | 127 (36.6%) | 220 (63.4%) |
| Cleaning & Maintenance | 386 (67.4%) | 187 (32.6%) |
| Personal Care & Service | 0 (0.0%) | 119 (100.0%) |
| Total (Category) | 653 (35.2%) | 1,203 (64.8%) |
| Total (Overall) | 3,916 (54.8%) | 3,234 (45.2%) |
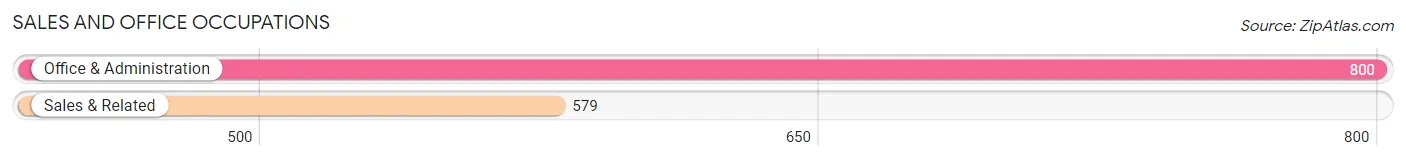
Sales and Office Occupations
The most common Sales and Office occupations in Alton are Office & Administration (800 | 11.2%), and Sales & Related (579 | 8.1%).
Sales and Office Occupations by Sex
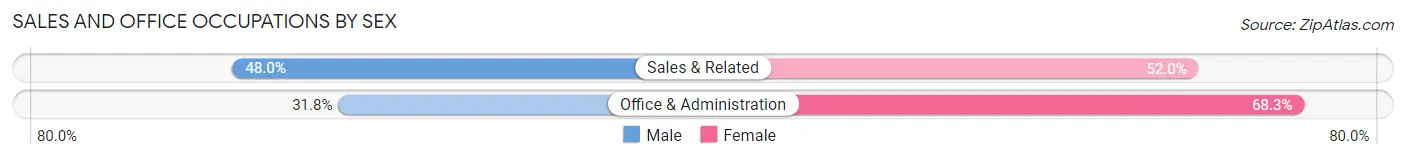
| Occupation | Male | Female |
| Sales & Related | 278 (48.0%) | 301 (52.0%) |
| Office & Administration | 254 (31.8%) | 546 (68.2%) |
| Total (Category) | 532 (38.6%) | 847 (61.4%) |
| Total (Overall) | 3,916 (54.8%) | 3,234 (45.2%) |
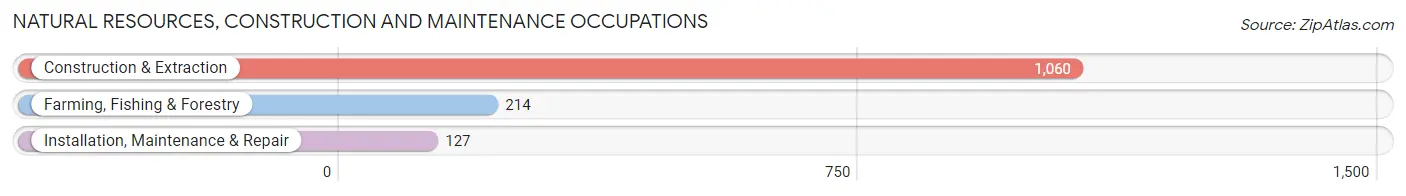
Natural Resources, Construction and Maintenance Occupations
The most common Natural Resources, Construction and Maintenance occupations in Alton are Construction & Extraction (1,060 | 14.8%), Farming, Fishing & Forestry (214 | 3.0%), and Installation, Maintenance & Repair (127 | 1.8%).
Natural Resources, Construction and Maintenance Occupations by Sex
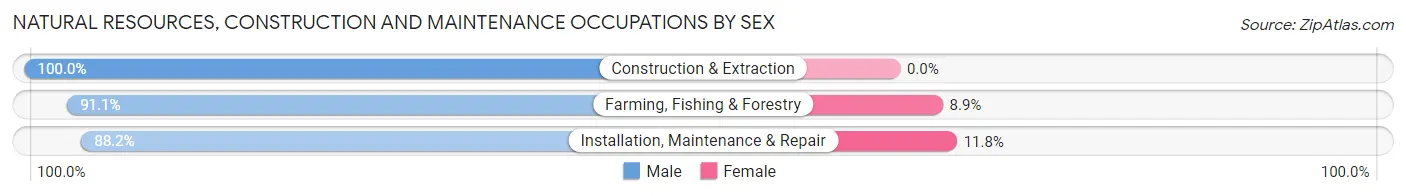
| Occupation | Male | Female |
| Farming, Fishing & Forestry | 195 (91.1%) | 19 (8.9%) |
| Construction & Extraction | 1,060 (100.0%) | 0 (0.0%) |
| Installation, Maintenance & Repair | 112 (88.2%) | 15 (11.8%) |
| Total (Category) | 1,367 (97.6%) | 34 (2.4%) |
| Total (Overall) | 3,916 (54.8%) | 3,234 (45.2%) |
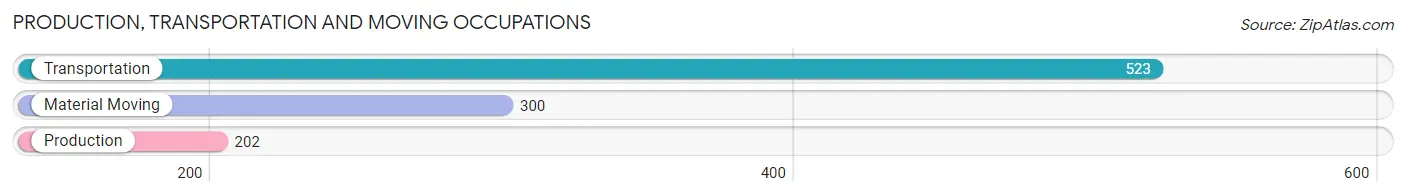
Production, Transportation and Moving Occupations
The most common Production, Transportation and Moving occupations in Alton are Transportation (523 | 7.3%), Material Moving (300 | 4.2%), and Production (202 | 2.8%).
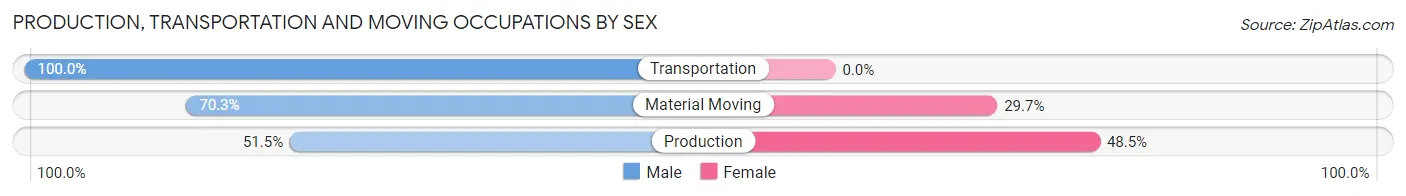
Production, Transportation and Moving Occupations by Sex
| Occupation | Male | Female |
| Production | 104 (51.5%) | 98 (48.5%) |
| Transportation | 523 (100.0%) | 0 (0.0%) |
| Material Moving | 211 (70.3%) | 89 (29.7%) |
| Total (Category) | 838 (81.8%) | 187 (18.2%) |
| Total (Overall) | 3,916 (54.8%) | 3,234 (45.2%) |
Employment Industries by Sex in Alton
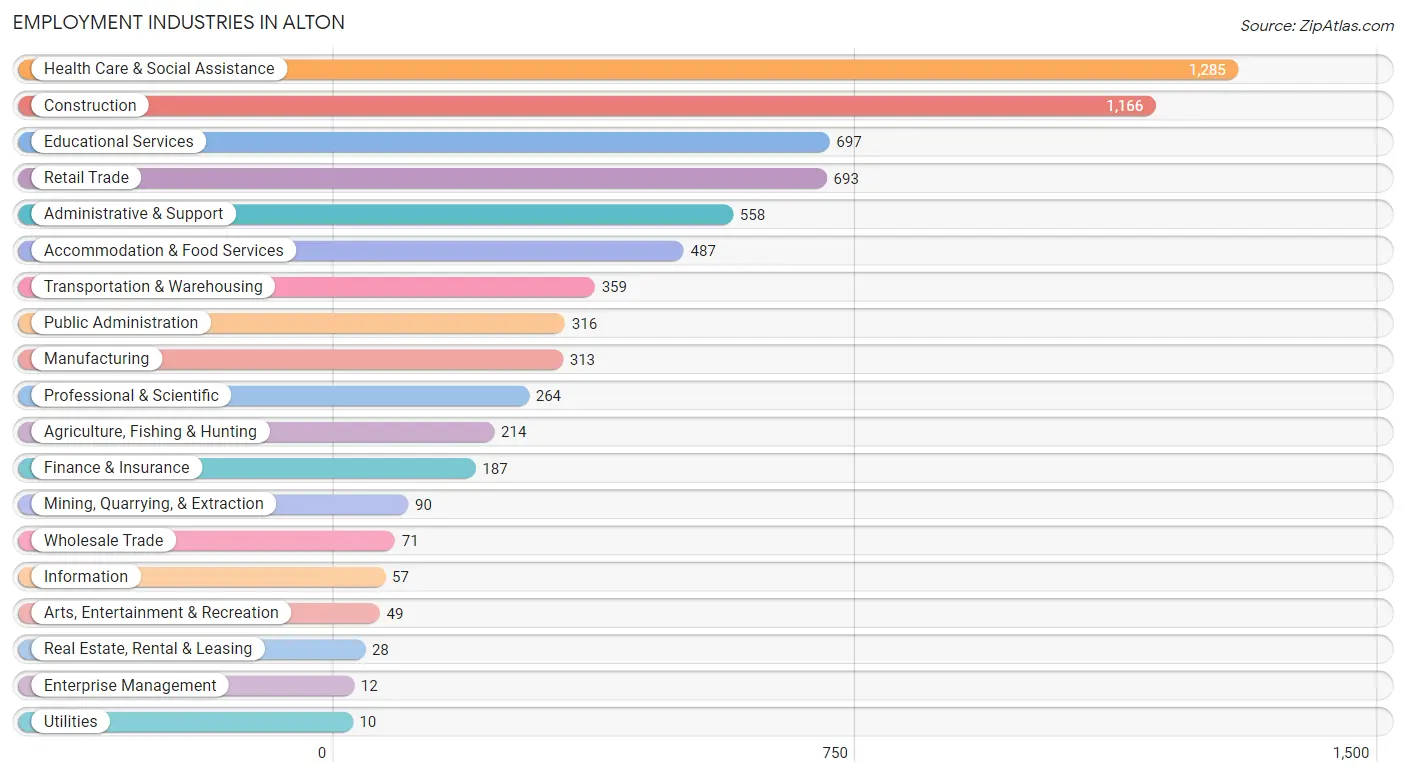
Employment Industries in Alton
The major employment industries in Alton include Health Care & Social Assistance (1,285 | 18.0%), Construction (1,166 | 16.3%), Educational Services (697 | 9.8%), Retail Trade (693 | 9.7%), and Administrative & Support (558 | 7.8%).
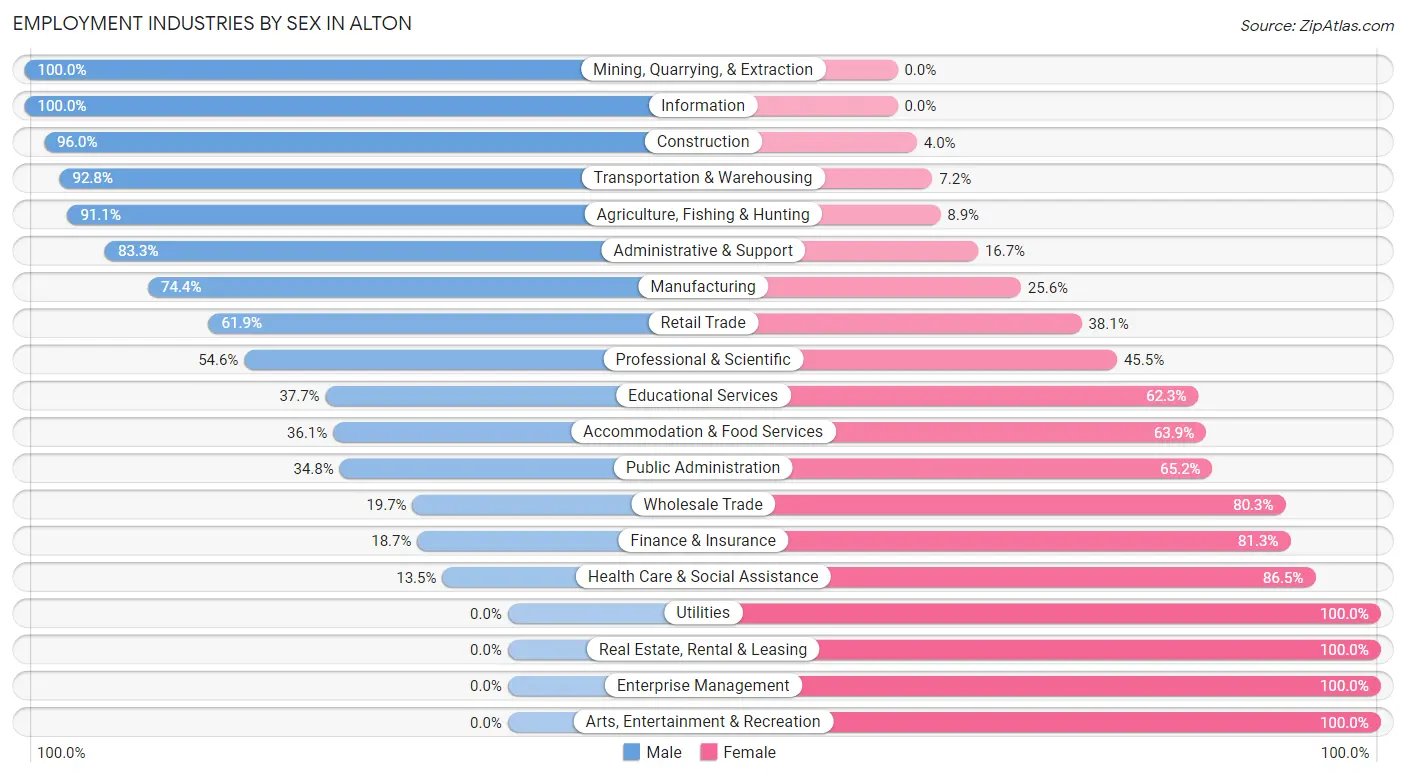
Employment Industries by Sex in Alton
The Alton industries that see more men than women are Mining, Quarrying, & Extraction (100.0%), Information (100.0%), and Construction (96.0%), whereas the industries that tend to have a higher number of women are Utilities (100.0%), Real Estate, Rental & Leasing (100.0%), and Enterprise Management (100.0%).
| Industry | Male | Female |
| Agriculture, Fishing & Hunting | 195 (91.1%) | 19 (8.9%) |
| Mining, Quarrying, & Extraction | 90 (100.0%) | 0 (0.0%) |
| Construction | 1,119 (96.0%) | 47 (4.0%) |
| Manufacturing | 233 (74.4%) | 80 (25.6%) |
| Wholesale Trade | 14 (19.7%) | 57 (80.3%) |
| Retail Trade | 429 (61.9%) | 264 (38.1%) |
| Transportation & Warehousing | 333 (92.8%) | 26 (7.2%) |
| Utilities | 0 (0.0%) | 10 (100.0%) |
| Information | 57 (100.0%) | 0 (0.0%) |
| Finance & Insurance | 35 (18.7%) | 152 (81.3%) |
| Real Estate, Rental & Leasing | 0 (0.0%) | 28 (100.0%) |
| Professional & Scientific | 144 (54.5%) | 120 (45.5%) |
| Enterprise Management | 0 (0.0%) | 12 (100.0%) |
| Administrative & Support | 465 (83.3%) | 93 (16.7%) |
| Educational Services | 263 (37.7%) | 434 (62.3%) |
| Health Care & Social Assistance | 174 (13.5%) | 1,111 (86.5%) |
| Arts, Entertainment & Recreation | 0 (0.0%) | 49 (100.0%) |
| Accommodation & Food Services | 176 (36.1%) | 311 (63.9%) |
| Public Administration | 110 (34.8%) | 206 (65.2%) |
| Total | 3,916 (54.8%) | 3,234 (45.2%) |
Education in Alton
School Enrollment in Alton
The most common levels of schooling among the 6,167 students in Alton are elementary school (1,736 | 28.1%), middle school (1,687 | 27.4%), and high school (1,388 | 22.5%).
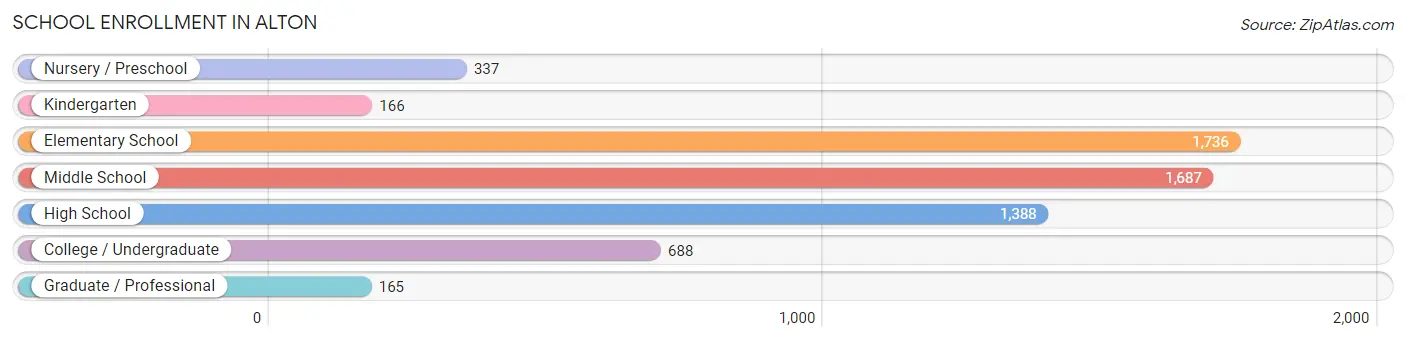
| School Level | # Students | % Students |
| Nursery / Preschool | 337 | 5.5% |
| Kindergarten | 166 | 2.7% |
| Elementary School | 1,736 | 28.1% |
| Middle School | 1,687 | 27.4% |
| High School | 1,388 | 22.5% |
| College / Undergraduate | 688 | 11.2% |
| Graduate / Professional | 165 | 2.7% |
| Total | 6,167 | 100.0% |
School Enrollment by Age by Funding Source in Alton
Out of a total of 6,167 students who are enrolled in schools in Alton, 93 (1.5%) attend a private institution, while the remaining 6,074 (98.5%) are enrolled in public schools. The age group of 35 years and over has the highest likelihood of being enrolled in private schools, with 19 (11.2% in the age bracket) enrolled. Conversely, the age group of 3 to 4 year olds has the lowest likelihood of being enrolled in a private school, with 195 (100.0% in the age bracket) attending a public institution.
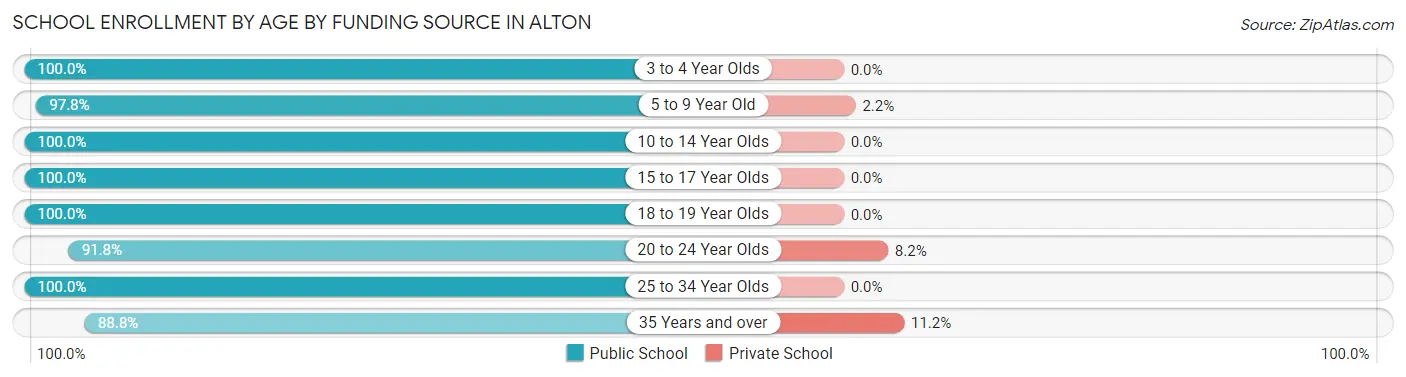
| Age Bracket | Public School | Private School |
| 3 to 4 Year Olds | 195 (100.0%) | 0 (0.0%) |
| 5 to 9 Year Old | 1,734 (97.8%) | 39 (2.2%) |
| 10 to 14 Year Olds | 1,869 (100.0%) | 0 (0.0%) |
| 15 to 17 Year Olds | 901 (100.0%) | 0 (0.0%) |
| 18 to 19 Year Olds | 595 (100.0%) | 0 (0.0%) |
| 20 to 24 Year Olds | 412 (91.8%) | 37 (8.2%) |
| 25 to 34 Year Olds | 216 (100.0%) | 0 (0.0%) |
| 35 Years and over | 150 (88.8%) | 19 (11.2%) |
| Total | 6,074 (98.5%) | 93 (1.5%) |
Educational Attainment by Field of Study in Alton
Business (264 | 26.1%), education (172 | 17.0%), psychology (105 | 10.4%), bio, nature & agricultural (89 | 8.8%), and computers & mathematics (74 | 7.3%) are the most common fields of study among 1,010 individuals in Alton who have obtained a bachelor's degree or higher.
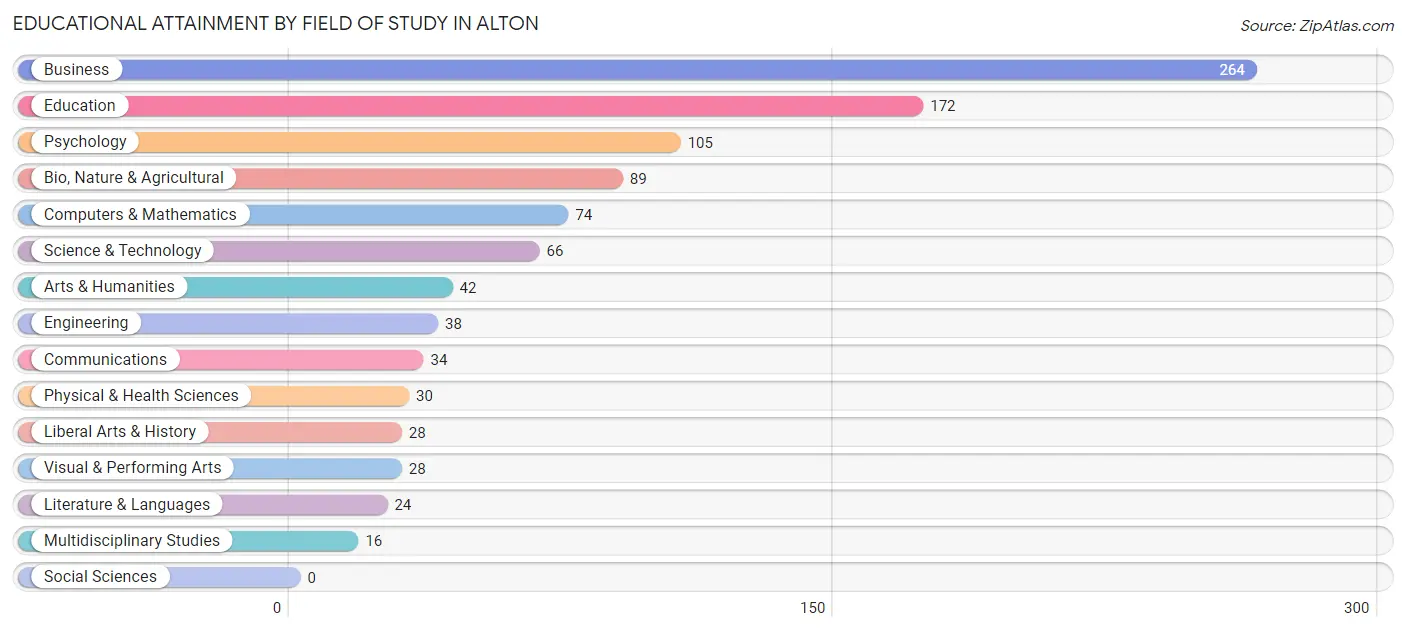
| Field of Study | # Graduates | % Graduates |
| Computers & Mathematics | 74 | 7.3% |
| Bio, Nature & Agricultural | 89 | 8.8% |
| Physical & Health Sciences | 30 | 3.0% |
| Psychology | 105 | 10.4% |
| Social Sciences | 0 | 0.0% |
| Engineering | 38 | 3.8% |
| Multidisciplinary Studies | 16 | 1.6% |
| Science & Technology | 66 | 6.5% |
| Business | 264 | 26.1% |
| Education | 172 | 17.0% |
| Literature & Languages | 24 | 2.4% |
| Liberal Arts & History | 28 | 2.8% |
| Visual & Performing Arts | 28 | 2.8% |
| Communications | 34 | 3.4% |
| Arts & Humanities | 42 | 4.2% |
| Total | 1,010 | 100.0% |
Transportation & Commute in Alton
Vehicle Availability by Sex in Alton
The most prevalent vehicle ownership categories in Alton are males with 2 vehicles (1,452, accounting for 39.1%) and females with 2 vehicles (1,241, making up 46.7%).
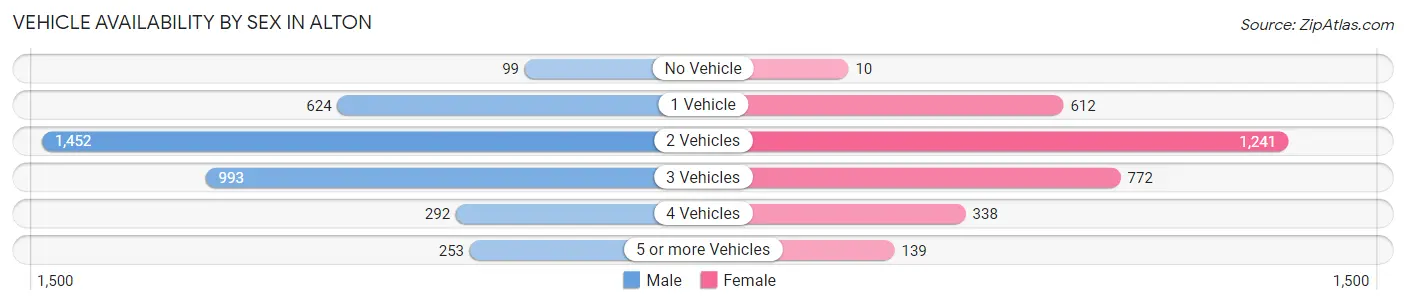
| Vehicles Available | Male | Female |
| No Vehicle | 99 (2.7%) | 10 (0.3%) |
| 1 Vehicle | 624 (16.8%) | 612 (19.7%) |
| 2 Vehicles | 1,452 (39.1%) | 1,241 (39.9%) |
| 3 Vehicles | 993 (26.7%) | 772 (24.8%) |
| 4 Vehicles | 292 (7.9%) | 338 (10.9%) |
| 5 or more Vehicles | 253 (6.8%) | 139 (4.5%) |
| Total | 3,713 (100.0%) | 3,112 (100.0%) |
Commute Time in Alton
The most frequently occuring commute durations in Alton are 30 to 34 minutes (1,437 commuters, 23.0%), 20 to 24 minutes (1,134 commuters, 18.1%), and 15 to 19 minutes (953 commuters, 15.2%).
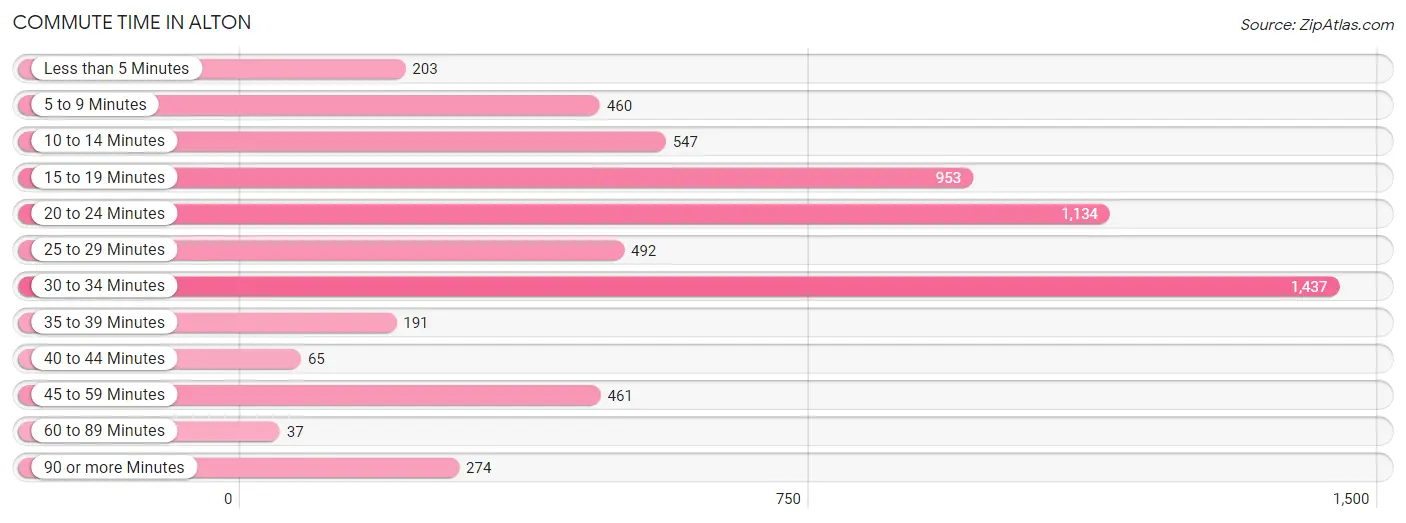
| Commute Time | # Commuters | % Commuters |
| Less than 5 Minutes | 203 | 3.3% |
| 5 to 9 Minutes | 460 | 7.4% |
| 10 to 14 Minutes | 547 | 8.7% |
| 15 to 19 Minutes | 953 | 15.2% |
| 20 to 24 Minutes | 1,134 | 18.1% |
| 25 to 29 Minutes | 492 | 7.9% |
| 30 to 34 Minutes | 1,437 | 23.0% |
| 35 to 39 Minutes | 191 | 3.0% |
| 40 to 44 Minutes | 65 | 1.0% |
| 45 to 59 Minutes | 461 | 7.4% |
| 60 to 89 Minutes | 37 | 0.6% |
| 90 or more Minutes | 274 | 4.4% |
Commute Time by Sex in Alton
The most common commute times in Alton are 30 to 34 minutes (874 commuters, 25.7%) for males and 20 to 24 minutes (589 commuters, 20.6%) for females.
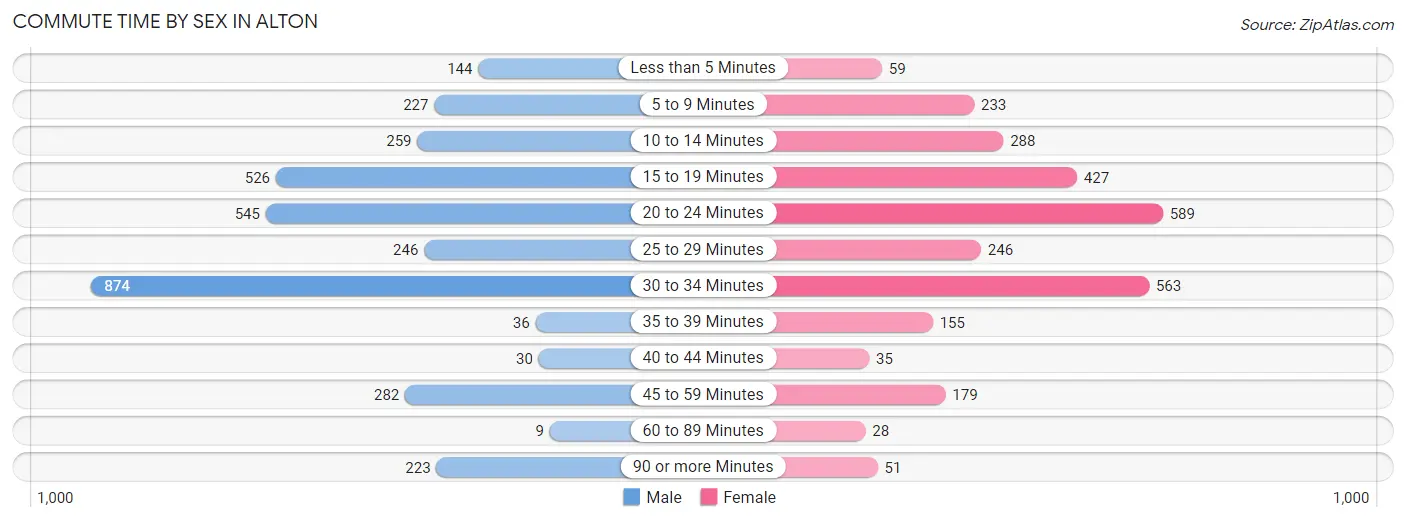
| Commute Time | Male | Female |
| Less than 5 Minutes | 144 (4.2%) | 59 (2.1%) |
| 5 to 9 Minutes | 227 (6.7%) | 233 (8.2%) |
| 10 to 14 Minutes | 259 (7.6%) | 288 (10.1%) |
| 15 to 19 Minutes | 526 (15.5%) | 427 (15.0%) |
| 20 to 24 Minutes | 545 (16.0%) | 589 (20.6%) |
| 25 to 29 Minutes | 246 (7.2%) | 246 (8.6%) |
| 30 to 34 Minutes | 874 (25.7%) | 563 (19.7%) |
| 35 to 39 Minutes | 36 (1.1%) | 155 (5.4%) |
| 40 to 44 Minutes | 30 (0.9%) | 35 (1.2%) |
| 45 to 59 Minutes | 282 (8.3%) | 179 (6.3%) |
| 60 to 89 Minutes | 9 (0.3%) | 28 (1.0%) |
| 90 or more Minutes | 223 (6.6%) | 51 (1.8%) |
Time of Departure to Work by Sex in Alton
The most frequent times of departure to work in Alton are 7:00 AM to 7:29 AM (943, 27.7%) for males and 7:00 AM to 7:29 AM (650, 22.8%) for females.
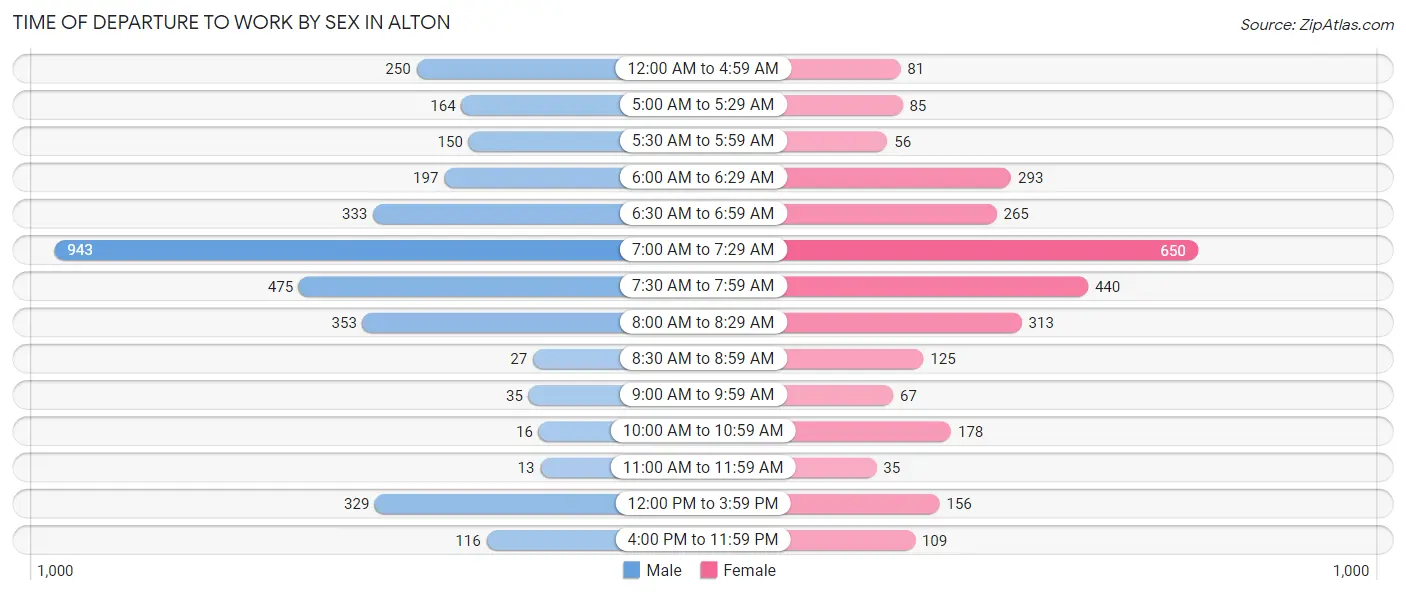
| Time of Departure | Male | Female |
| 12:00 AM to 4:59 AM | 250 (7.3%) | 81 (2.8%) |
| 5:00 AM to 5:29 AM | 164 (4.8%) | 85 (3.0%) |
| 5:30 AM to 5:59 AM | 150 (4.4%) | 56 (2.0%) |
| 6:00 AM to 6:29 AM | 197 (5.8%) | 293 (10.3%) |
| 6:30 AM to 6:59 AM | 333 (9.8%) | 265 (9.3%) |
| 7:00 AM to 7:29 AM | 943 (27.7%) | 650 (22.8%) |
| 7:30 AM to 7:59 AM | 475 (14.0%) | 440 (15.4%) |
| 8:00 AM to 8:29 AM | 353 (10.4%) | 313 (11.0%) |
| 8:30 AM to 8:59 AM | 27 (0.8%) | 125 (4.4%) |
| 9:00 AM to 9:59 AM | 35 (1.0%) | 67 (2.4%) |
| 10:00 AM to 10:59 AM | 16 (0.5%) | 178 (6.2%) |
| 11:00 AM to 11:59 AM | 13 (0.4%) | 35 (1.2%) |
| 12:00 PM to 3:59 PM | 329 (9.7%) | 156 (5.5%) |
| 4:00 PM to 11:59 PM | 116 (3.4%) | 109 (3.8%) |
| Total | 3,401 (100.0%) | 2,853 (100.0%) |
Housing Occupancy in Alton
Occupancy by Ownership in Alton
Of the total 4,958 dwellings in Alton, owner-occupied units account for 3,026 (61.0%), while renter-occupied units make up 1,932 (39.0%).
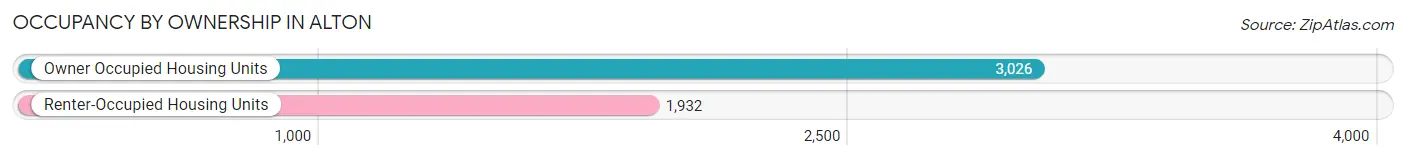
| Occupancy | # Housing Units | % Housing Units |
| Owner Occupied Housing Units | 3,026 | 61.0% |
| Renter-Occupied Housing Units | 1,932 | 39.0% |
| Total Occupied Housing Units | 4,958 | 100.0% |
Occupancy by Household Size in Alton
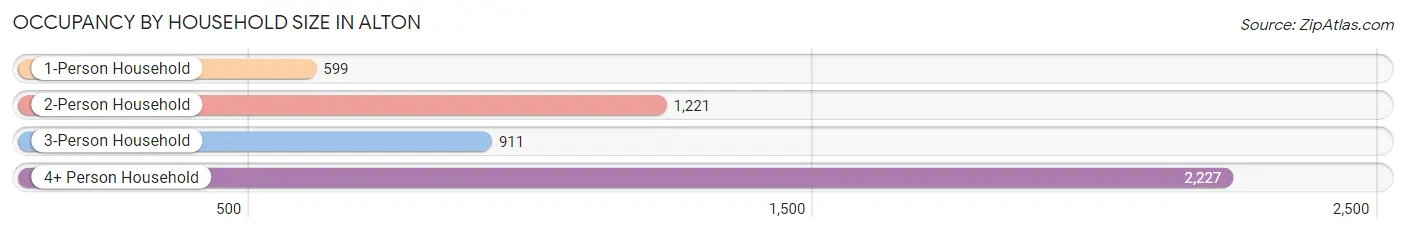
| Household Size | # Housing Units | % Housing Units |
| 1-Person Household | 599 | 12.1% |
| 2-Person Household | 1,221 | 24.6% |
| 3-Person Household | 911 | 18.4% |
| 4+ Person Household | 2,227 | 44.9% |
| Total Housing Units | 4,958 | 100.0% |
Occupancy by Ownership by Household Size in Alton
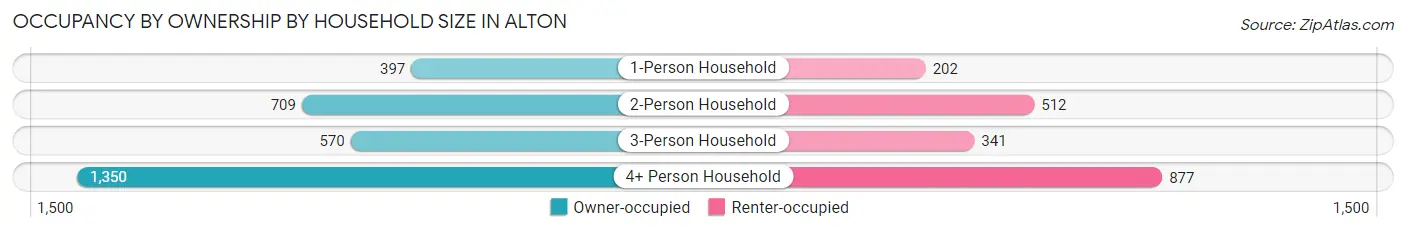
| Household Size | Owner-occupied | Renter-occupied |
| 1-Person Household | 397 (66.3%) | 202 (33.7%) |
| 2-Person Household | 709 (58.1%) | 512 (41.9%) |
| 3-Person Household | 570 (62.6%) | 341 (37.4%) |
| 4+ Person Household | 1,350 (60.6%) | 877 (39.4%) |
| Total Housing Units | 3,026 (61.0%) | 1,932 (39.0%) |
Occupancy by Educational Attainment in Alton
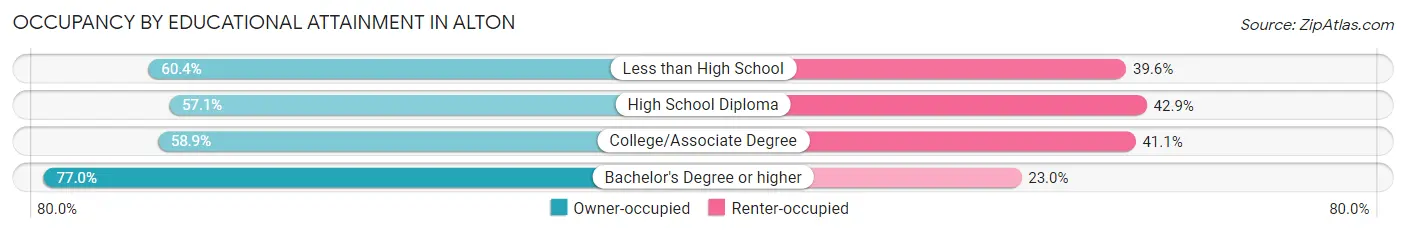
| Household Size | Owner-occupied | Renter-occupied |
| Less than High School | 1,154 (60.4%) | 758 (39.6%) |
| High School Diploma | 631 (57.1%) | 474 (42.9%) |
| College/Associate Degree | 823 (58.9%) | 575 (41.1%) |
| Bachelor's Degree or higher | 418 (77.0%) | 125 (23.0%) |
Occupancy by Age of Householder in Alton
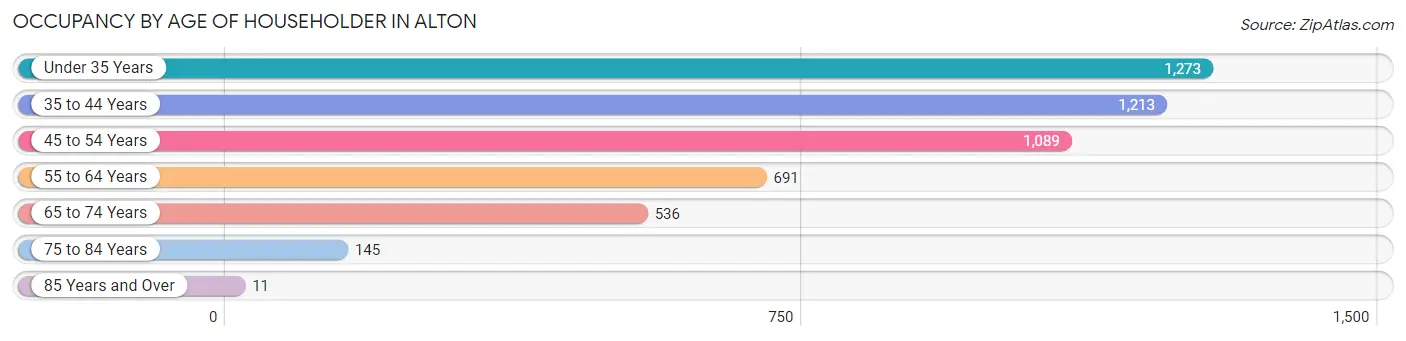
| Age Bracket | # Households | % Households |
| Under 35 Years | 1,273 | 25.7% |
| 35 to 44 Years | 1,213 | 24.5% |
| 45 to 54 Years | 1,089 | 22.0% |
| 55 to 64 Years | 691 | 13.9% |
| 65 to 74 Years | 536 | 10.8% |
| 75 to 84 Years | 145 | 2.9% |
| 85 Years and Over | 11 | 0.2% |
| Total | 4,958 | 100.0% |
Housing Finances in Alton
Median Income by Occupancy in Alton
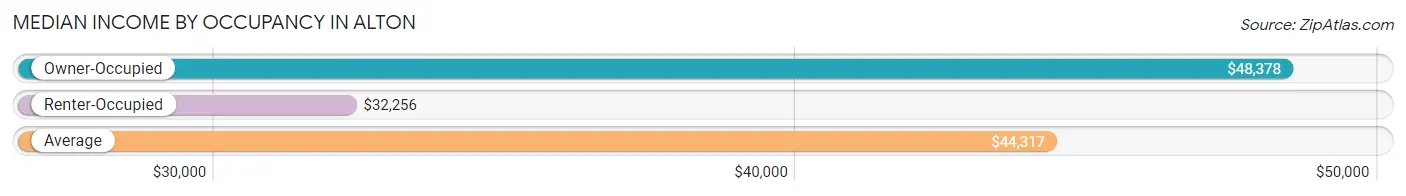
| Occupancy Type | # Households | Median Income |
| Owner-Occupied | 3,026 (61.0%) | $48,378 |
| Renter-Occupied | 1,932 (39.0%) | $32,256 |
| Average | 4,958 (100.0%) | $44,317 |
Occupancy by Householder Income Bracket in Alton
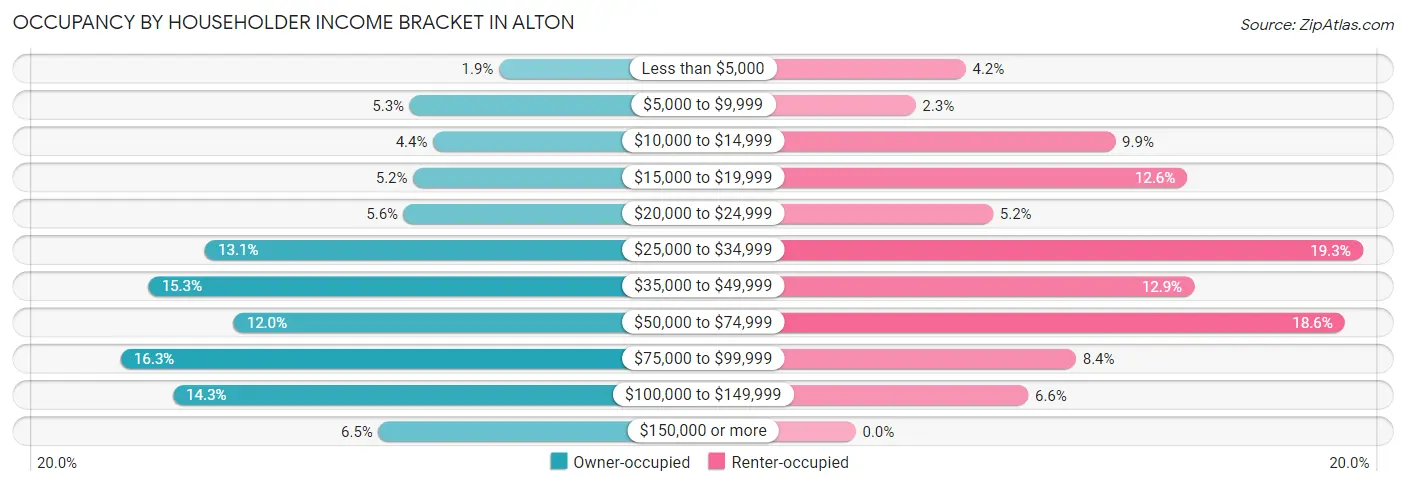
| Income Bracket | Owner-occupied | Renter-occupied |
| Less than $5,000 | 58 (1.9%) | 81 (4.2%) |
| $5,000 to $9,999 | 161 (5.3%) | 44 (2.3%) |
| $10,000 to $14,999 | 134 (4.4%) | 191 (9.9%) |
| $15,000 to $19,999 | 157 (5.2%) | 244 (12.6%) |
| $20,000 to $24,999 | 168 (5.6%) | 101 (5.2%) |
| $25,000 to $34,999 | 397 (13.1%) | 373 (19.3%) |
| $35,000 to $49,999 | 462 (15.3%) | 249 (12.9%) |
| $50,000 to $74,999 | 364 (12.0%) | 360 (18.6%) |
| $75,000 to $99,999 | 494 (16.3%) | 162 (8.4%) |
| $100,000 to $149,999 | 434 (14.3%) | 127 (6.6%) |
| $150,000 or more | 197 (6.5%) | 0 (0.0%) |
| Total | 3,026 (100.0%) | 1,932 (100.0%) |
Monthly Housing Cost Tiers in Alton
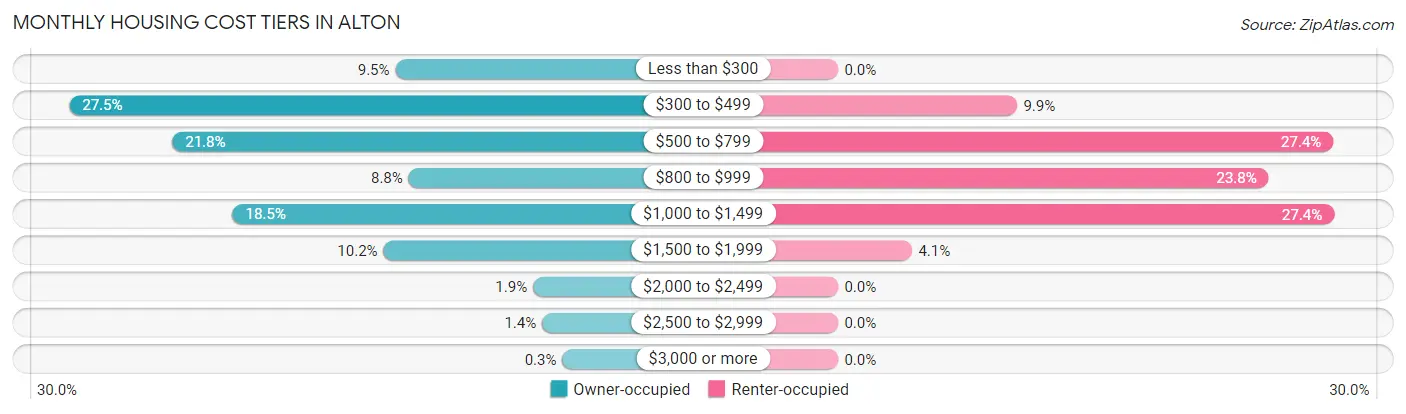
| Monthly Cost | Owner-occupied | Renter-occupied |
| Less than $300 | 288 (9.5%) | 0 (0.0%) |
| $300 to $499 | 833 (27.5%) | 191 (9.9%) |
| $500 to $799 | 661 (21.8%) | 529 (27.4%) |
| $800 to $999 | 266 (8.8%) | 460 (23.8%) |
| $1,000 to $1,499 | 560 (18.5%) | 530 (27.4%) |
| $1,500 to $1,999 | 308 (10.2%) | 79 (4.1%) |
| $2,000 to $2,499 | 58 (1.9%) | 0 (0.0%) |
| $2,500 to $2,999 | 43 (1.4%) | 0 (0.0%) |
| $3,000 or more | 9 (0.3%) | 0 (0.0%) |
| Total | 3,026 (100.0%) | 1,932 (100.0%) |
Physical Housing Characteristics in Alton
Housing Structures in Alton
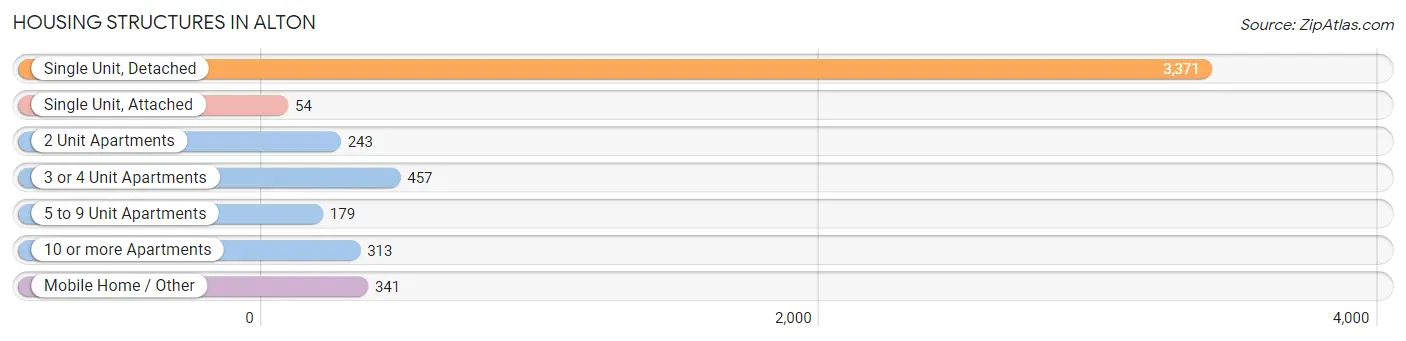
| Structure Type | # Housing Units | % Housing Units |
| Single Unit, Detached | 3,371 | 68.0% |
| Single Unit, Attached | 54 | 1.1% |
| 2 Unit Apartments | 243 | 4.9% |
| 3 or 4 Unit Apartments | 457 | 9.2% |
| 5 to 9 Unit Apartments | 179 | 3.6% |
| 10 or more Apartments | 313 | 6.3% |
| Mobile Home / Other | 341 | 6.9% |
| Total | 4,958 | 100.0% |
Housing Structures by Occupancy in Alton
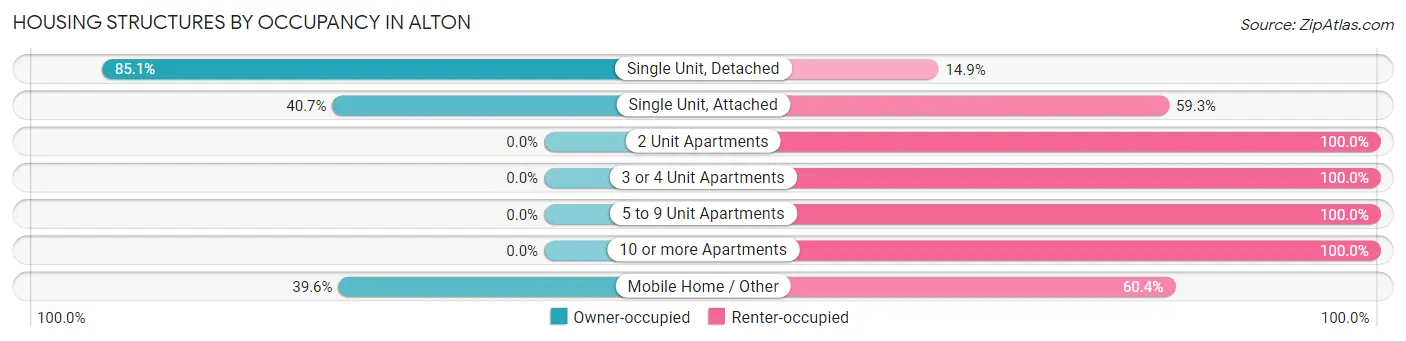
| Structure Type | Owner-occupied | Renter-occupied |
| Single Unit, Detached | 2,869 (85.1%) | 502 (14.9%) |
| Single Unit, Attached | 22 (40.7%) | 32 (59.3%) |
| 2 Unit Apartments | 0 (0.0%) | 243 (100.0%) |
| 3 or 4 Unit Apartments | 0 (0.0%) | 457 (100.0%) |
| 5 to 9 Unit Apartments | 0 (0.0%) | 179 (100.0%) |
| 10 or more Apartments | 0 (0.0%) | 313 (100.0%) |
| Mobile Home / Other | 135 (39.6%) | 206 (60.4%) |
| Total | 3,026 (61.0%) | 1,932 (39.0%) |
Housing Structures by Number of Rooms in Alton
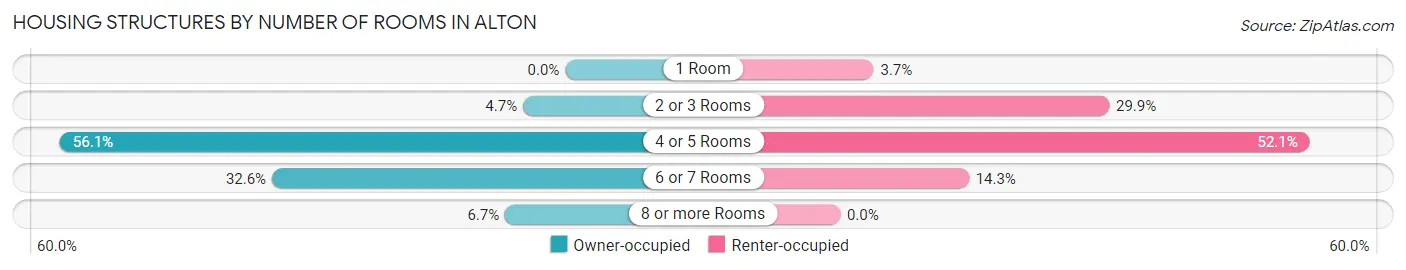
| Number of Rooms | Owner-occupied | Renter-occupied |
| 1 Room | 0 (0.0%) | 72 (3.7%) |
| 2 or 3 Rooms | 142 (4.7%) | 577 (29.9%) |
| 4 or 5 Rooms | 1,697 (56.1%) | 1,007 (52.1%) |
| 6 or 7 Rooms | 985 (32.6%) | 276 (14.3%) |
| 8 or more Rooms | 202 (6.7%) | 0 (0.0%) |
| Total | 3,026 (100.0%) | 1,932 (100.0%) |
Housing Structure by Heating Type in Alton
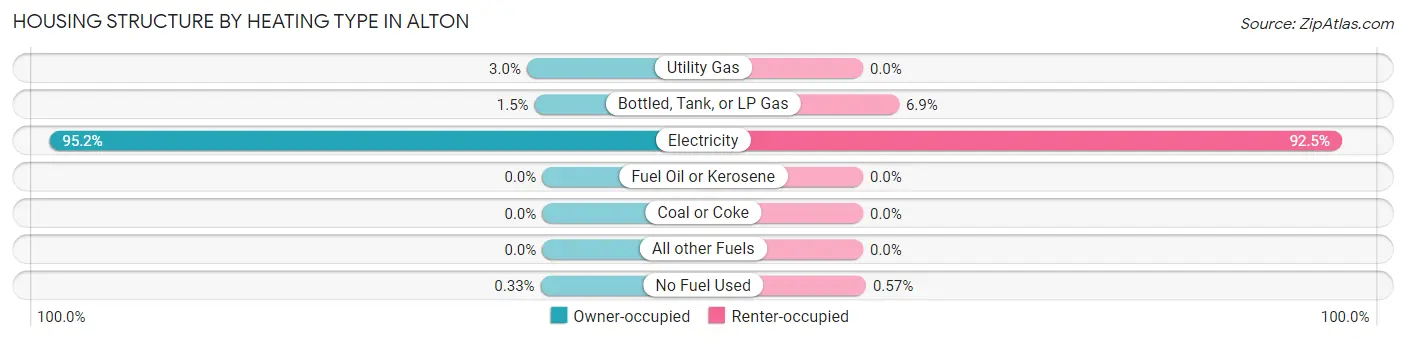
| Heating Type | Owner-occupied | Renter-occupied |
| Utility Gas | 90 (3.0%) | 0 (0.0%) |
| Bottled, Tank, or LP Gas | 45 (1.5%) | 134 (6.9%) |
| Electricity | 2,881 (95.2%) | 1,787 (92.5%) |
| Fuel Oil or Kerosene | 0 (0.0%) | 0 (0.0%) |
| Coal or Coke | 0 (0.0%) | 0 (0.0%) |
| All other Fuels | 0 (0.0%) | 0 (0.0%) |
| No Fuel Used | 10 (0.3%) | 11 (0.6%) |
| Total | 3,026 (100.0%) | 1,932 (100.0%) |
Household Vehicle Usage in Alton
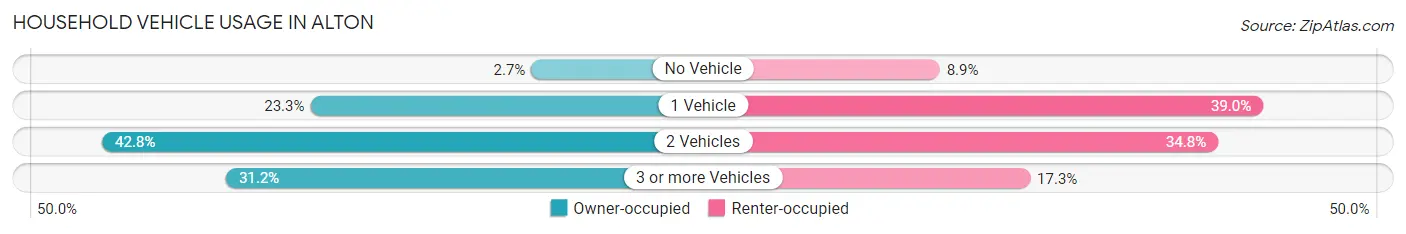
| Vehicles per Household | Owner-occupied | Renter-occupied |
| No Vehicle | 82 (2.7%) | 171 (8.8%) |
| 1 Vehicle | 706 (23.3%) | 754 (39.0%) |
| 2 Vehicles | 1,294 (42.8%) | 673 (34.8%) |
| 3 or more Vehicles | 944 (31.2%) | 334 (17.3%) |
| Total | 3,026 (100.0%) | 1,932 (100.0%) |
Real Estate & Mortgages in Alton
Real Estate and Mortgage Overview in Alton
| Characteristic | Without Mortgage | With Mortgage |
| Housing Units | 1,738 | 1,288 |
| Median Property Value | $73,500 | $138,200 |
| Median Household Income | $36,418 | $96 |
| Monthly Housing Costs | $418 | $9 |
| Real Estate Taxes | $1,362 | $51 |
Property Value by Mortgage Status in Alton
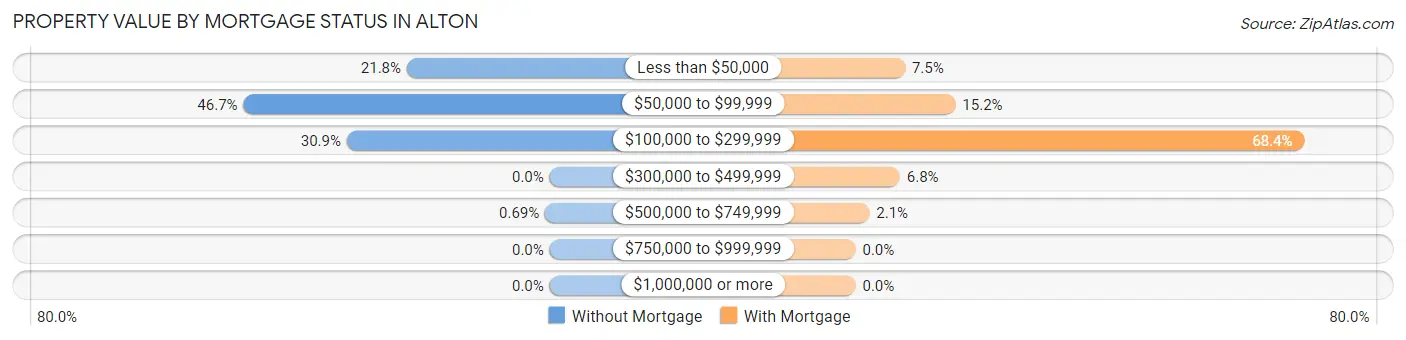
| Property Value | Without Mortgage | With Mortgage |
| Less than $50,000 | 378 (21.7%) | 97 (7.5%) |
| $50,000 to $99,999 | 811 (46.7%) | 196 (15.2%) |
| $100,000 to $299,999 | 537 (30.9%) | 881 (68.4%) |
| $300,000 to $499,999 | 0 (0.0%) | 87 (6.8%) |
| $500,000 to $749,999 | 12 (0.7%) | 27 (2.1%) |
| $750,000 to $999,999 | 0 (0.0%) | 0 (0.0%) |
| $1,000,000 or more | 0 (0.0%) | 0 (0.0%) |
| Total | 1,738 (100.0%) | 1,288 (100.0%) |
Household Income by Mortgage Status in Alton
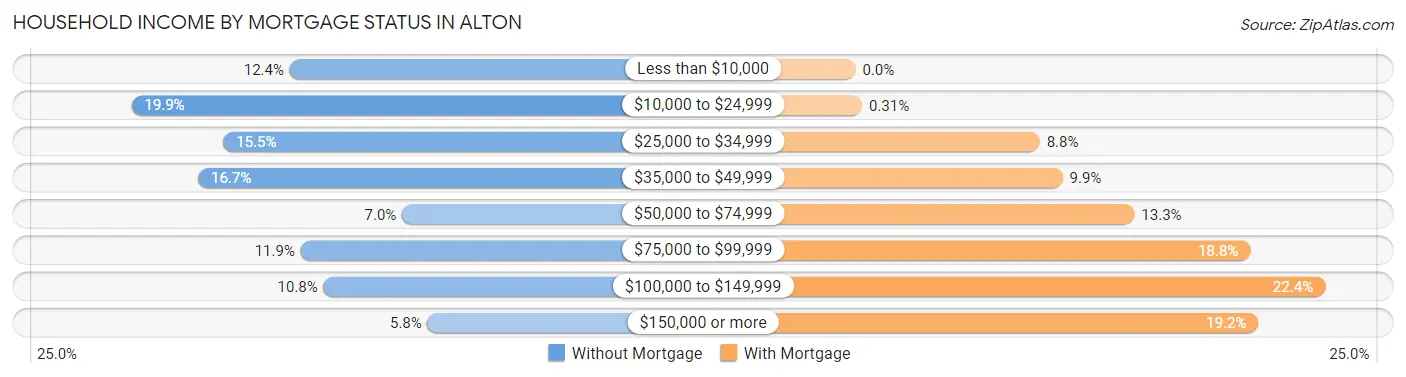
| Household Income | Without Mortgage | With Mortgage |
| Less than $10,000 | 215 (12.4%) | 0 (0.0%) |
| $10,000 to $24,999 | 346 (19.9%) | 4 (0.3%) |
| $25,000 to $34,999 | 270 (15.5%) | 113 (8.8%) |
| $35,000 to $49,999 | 291 (16.7%) | 127 (9.9%) |
| $50,000 to $74,999 | 122 (7.0%) | 171 (13.3%) |
| $75,000 to $99,999 | 206 (11.8%) | 242 (18.8%) |
| $100,000 to $149,999 | 187 (10.8%) | 288 (22.4%) |
| $150,000 or more | 101 (5.8%) | 247 (19.2%) |
| Total | 1,738 (100.0%) | 1,288 (100.0%) |
Property Value to Household Income Ratio in Alton
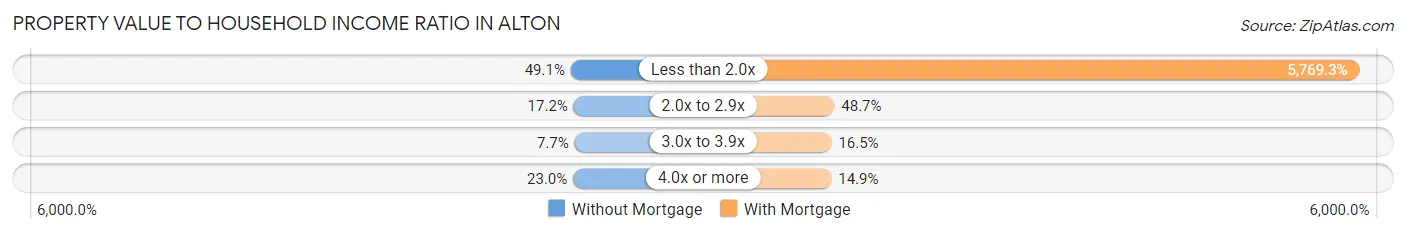
| Value-to-Income Ratio | Without Mortgage | With Mortgage |
| Less than 2.0x | 853 (49.1%) | 74,309 (5,769.3%) |
| 2.0x to 2.9x | 298 (17.2%) | 627 (48.7%) |
| 3.0x to 3.9x | 133 (7.6%) | 213 (16.5%) |
| 4.0x or more | 400 (23.0%) | 192 (14.9%) |
| Total | 1,738 (100.0%) | 1,288 (100.0%) |
Real Estate Taxes by Mortgage Status in Alton
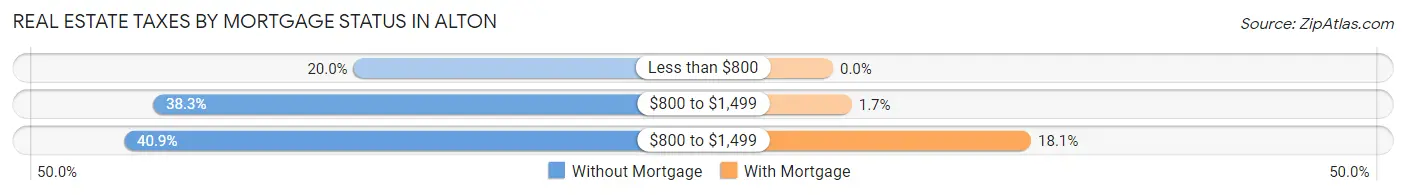
| Property Taxes | Without Mortgage | With Mortgage |
| Less than $800 | 347 (20.0%) | 0 (0.0%) |
| $800 to $1,499 | 665 (38.3%) | 22 (1.7%) |
| $800 to $1,499 | 711 (40.9%) | 233 (18.1%) |
| Total | 1,738 (100.0%) | 1,288 (100.0%) |
Health & Disability in Alton
Health Insurance Coverage by Age in Alton
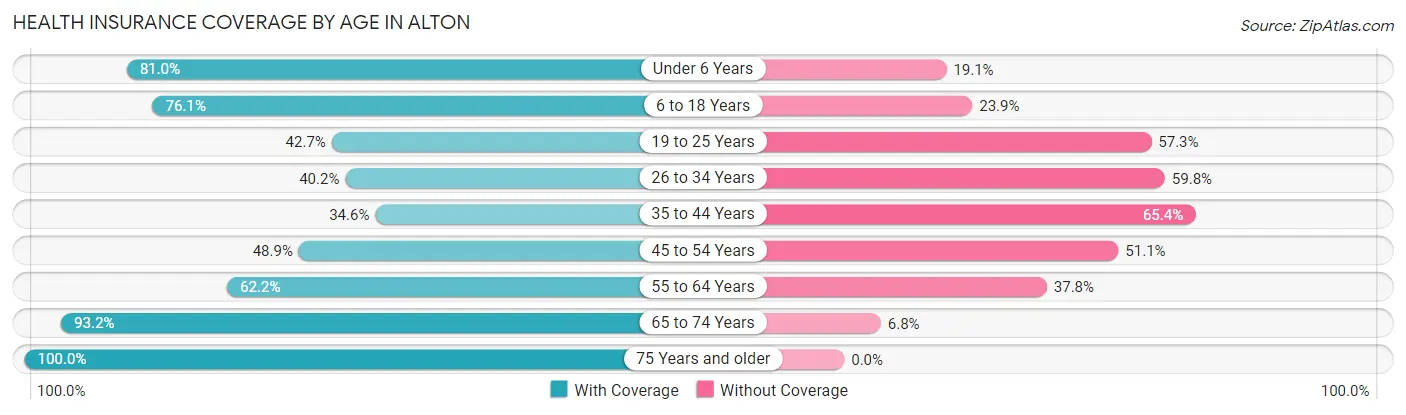
| Age Bracket | With Coverage | Without Coverage |
| Under 6 Years | 1,636 (80.9%) | 385 (19.1%) |
| 6 to 18 Years | 3,897 (76.1%) | 1,222 (23.9%) |
| 19 to 25 Years | 906 (42.7%) | 1,214 (57.3%) |
| 26 to 34 Years | 988 (40.2%) | 1,469 (59.8%) |
| 35 to 44 Years | 770 (34.6%) | 1,455 (65.4%) |
| 45 to 54 Years | 914 (48.9%) | 956 (51.1%) |
| 55 to 64 Years | 725 (62.2%) | 440 (37.8%) |
| 65 to 74 Years | 915 (93.2%) | 67 (6.8%) |
| 75 Years and older | 527 (100.0%) | 0 (0.0%) |
| Total | 11,278 (61.0%) | 7,208 (39.0%) |
Health Insurance Coverage by Citizenship Status in Alton
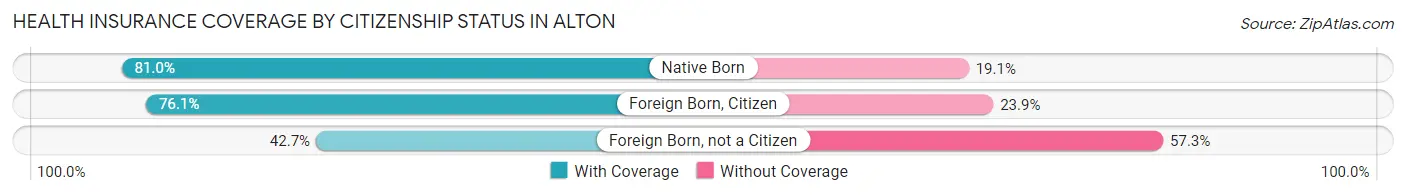
| Citizenship Status | With Coverage | Without Coverage |
| Native Born | 1,636 (80.9%) | 385 (19.1%) |
| Foreign Born, Citizen | 3,897 (76.1%) | 1,222 (23.9%) |
| Foreign Born, not a Citizen | 906 (42.7%) | 1,214 (57.3%) |
Health Insurance Coverage by Household Income in Alton
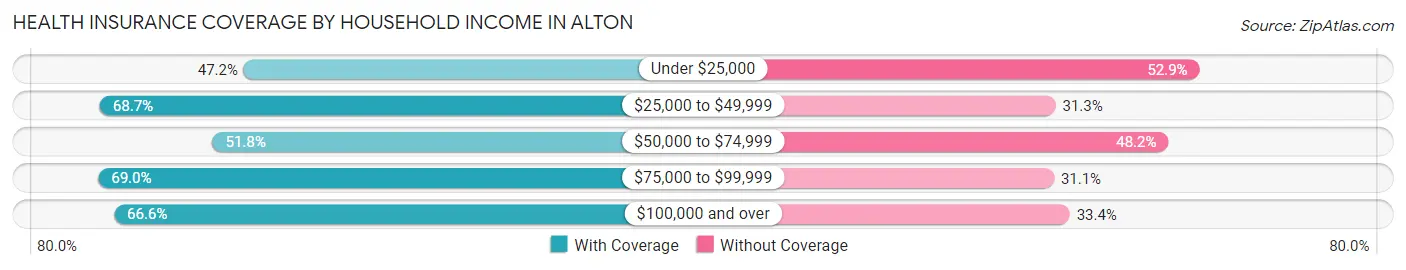
| Household Income | With Coverage | Without Coverage |
| Under $25,000 | 1,870 (47.1%) | 2,096 (52.8%) |
| $25,000 to $49,999 | 3,810 (68.7%) | 1,735 (31.3%) |
| $50,000 to $74,999 | 1,526 (51.8%) | 1,419 (48.2%) |
| $75,000 to $99,999 | 1,648 (69.0%) | 742 (31.0%) |
| $100,000 and over | 2,424 (66.6%) | 1,216 (33.4%) |
Public vs Private Health Insurance Coverage by Age in Alton
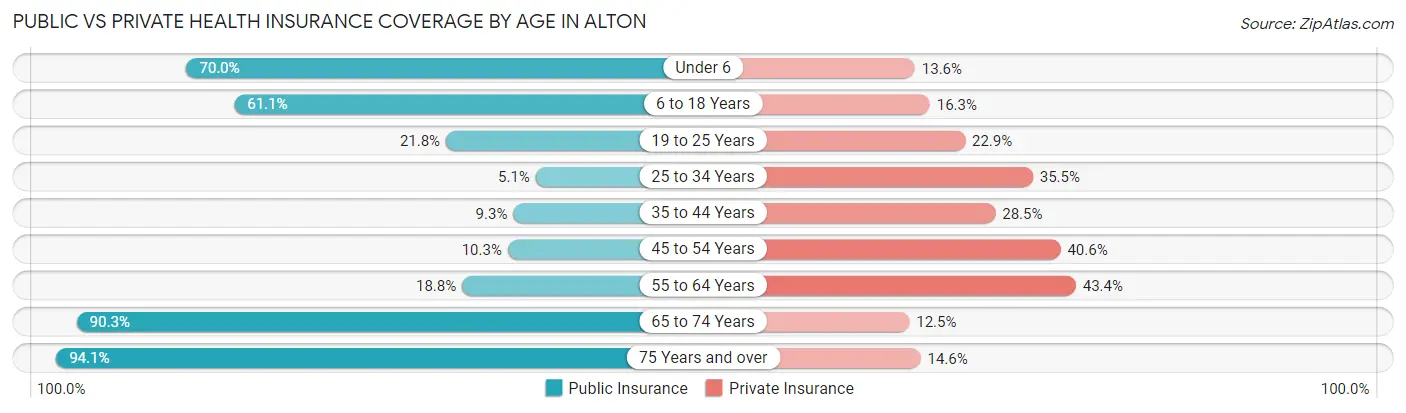
| Age Bracket | Public Insurance | Private Insurance |
| Under 6 | 1,414 (70.0%) | 274 (13.6%) |
| 6 to 18 Years | 3,126 (61.1%) | 836 (16.3%) |
| 19 to 25 Years | 462 (21.8%) | 485 (22.9%) |
| 25 to 34 Years | 126 (5.1%) | 871 (35.4%) |
| 35 to 44 Years | 207 (9.3%) | 634 (28.5%) |
| 45 to 54 Years | 193 (10.3%) | 759 (40.6%) |
| 55 to 64 Years | 219 (18.8%) | 506 (43.4%) |
| 65 to 74 Years | 887 (90.3%) | 123 (12.5%) |
| 75 Years and over | 496 (94.1%) | 77 (14.6%) |
| Total | 7,130 (38.6%) | 4,565 (24.7%) |
Disability Status by Sex by Age in Alton
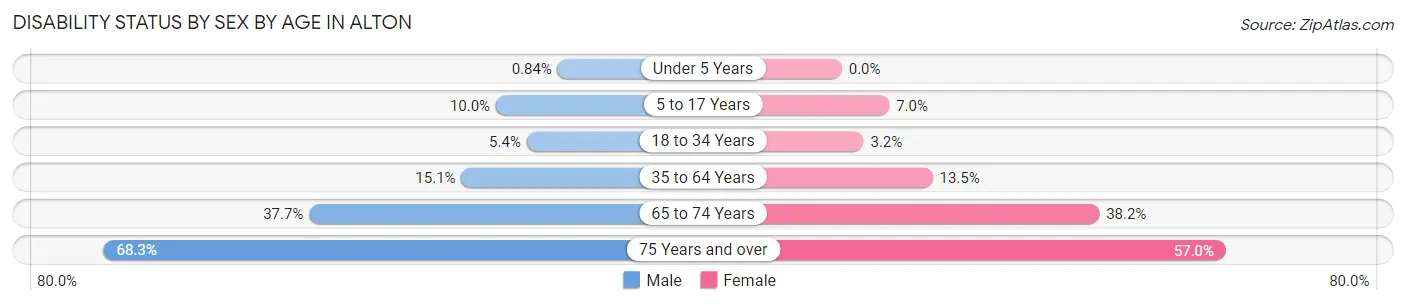
| Age Bracket | Male | Female |
| Under 5 Years | 8 (0.8%) | 0 (0.0%) |
| 5 to 17 Years | 267 (10.0%) | 150 (7.0%) |
| 18 to 34 Years | 134 (5.4%) | 86 (3.2%) |
| 35 to 64 Years | 381 (15.1%) | 370 (13.5%) |
| 65 to 74 Years | 180 (37.7%) | 193 (38.2%) |
| 75 Years and over | 185 (68.3%) | 146 (57.0%) |
Disability Class by Sex by Age in Alton
Disability Class: Hearing Difficulty
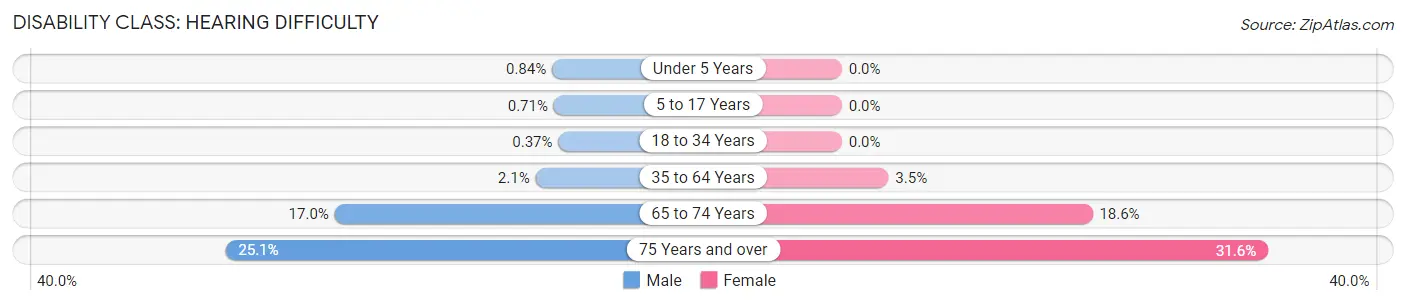
| Age Bracket | Male | Female |
| Under 5 Years | 8 (0.8%) | 0 (0.0%) |
| 5 to 17 Years | 19 (0.7%) | 0 (0.0%) |
| 18 to 34 Years | 9 (0.4%) | 0 (0.0%) |
| 35 to 64 Years | 52 (2.1%) | 95 (3.5%) |
| 65 to 74 Years | 81 (17.0%) | 94 (18.6%) |
| 75 Years and over | 68 (25.1%) | 81 (31.6%) |
Disability Class: Vision Difficulty
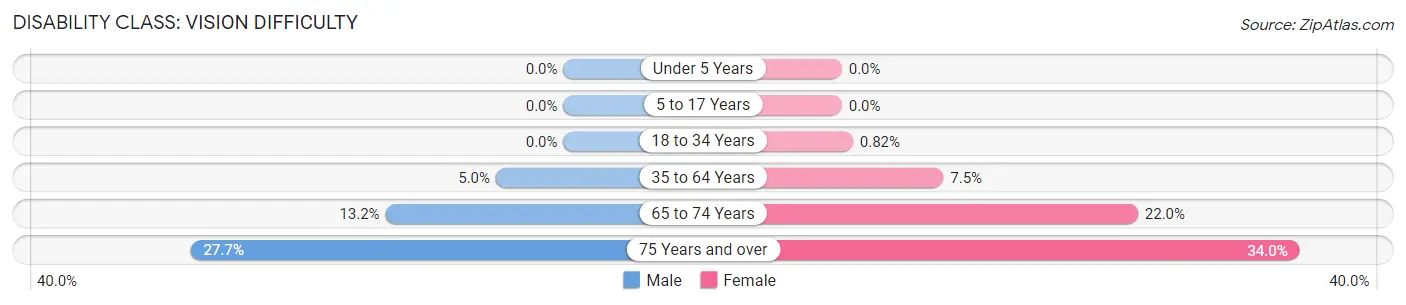
| Age Bracket | Male | Female |
| Under 5 Years | 0 (0.0%) | 0 (0.0%) |
| 5 to 17 Years | 0 (0.0%) | 0 (0.0%) |
| 18 to 34 Years | 0 (0.0%) | 22 (0.8%) |
| 35 to 64 Years | 126 (5.0%) | 207 (7.5%) |
| 65 to 74 Years | 63 (13.2%) | 111 (22.0%) |
| 75 Years and over | 75 (27.7%) | 87 (34.0%) |
Disability Class: Cognitive Difficulty
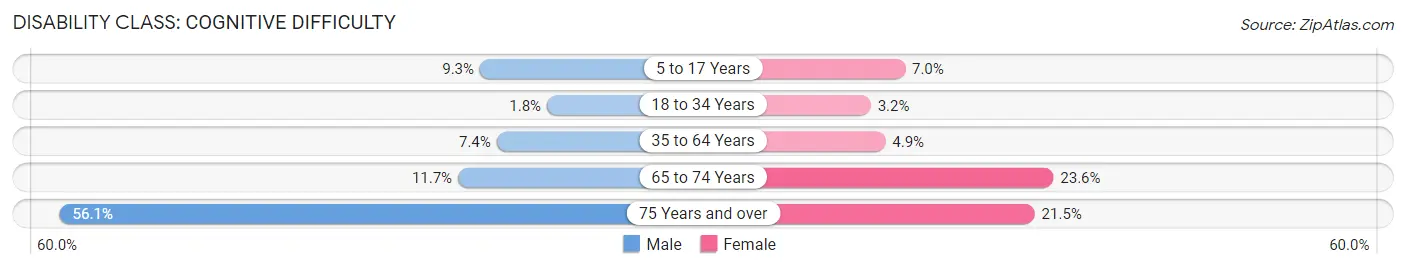
| Age Bracket | Male | Female |
| 5 to 17 Years | 248 (9.3%) | 150 (7.0%) |
| 18 to 34 Years | 45 (1.8%) | 86 (3.2%) |
| 35 to 64 Years | 187 (7.4%) | 133 (4.9%) |
| 65 to 74 Years | 56 (11.7%) | 119 (23.6%) |
| 75 Years and over | 152 (56.1%) | 55 (21.5%) |
Disability Class: Ambulatory Difficulty
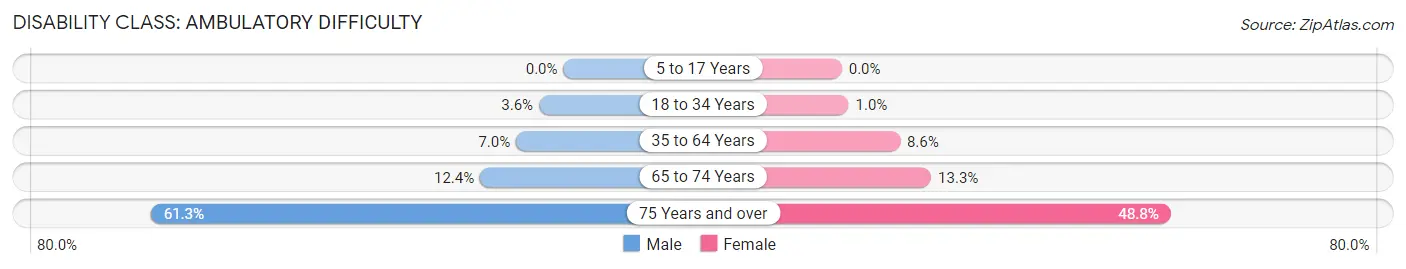
| Age Bracket | Male | Female |
| 5 to 17 Years | 0 (0.0%) | 0 (0.0%) |
| 18 to 34 Years | 89 (3.6%) | 27 (1.0%) |
| 35 to 64 Years | 177 (7.0%) | 237 (8.6%) |
| 65 to 74 Years | 59 (12.4%) | 67 (13.3%) |
| 75 Years and over | 166 (61.3%) | 125 (48.8%) |
Disability Class: Self-Care Difficulty
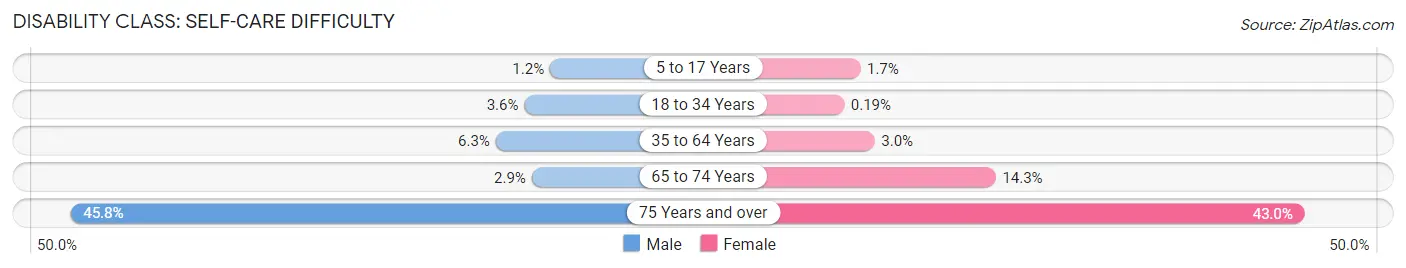
| Age Bracket | Male | Female |
| 5 to 17 Years | 33 (1.2%) | 36 (1.7%) |
| 18 to 34 Years | 89 (3.6%) | 5 (0.2%) |
| 35 to 64 Years | 158 (6.3%) | 83 (3.0%) |
| 65 to 74 Years | 14 (2.9%) | 72 (14.3%) |
| 75 Years and over | 124 (45.8%) | 110 (43.0%) |
Technology Access in Alton
Computing Device Access in Alton
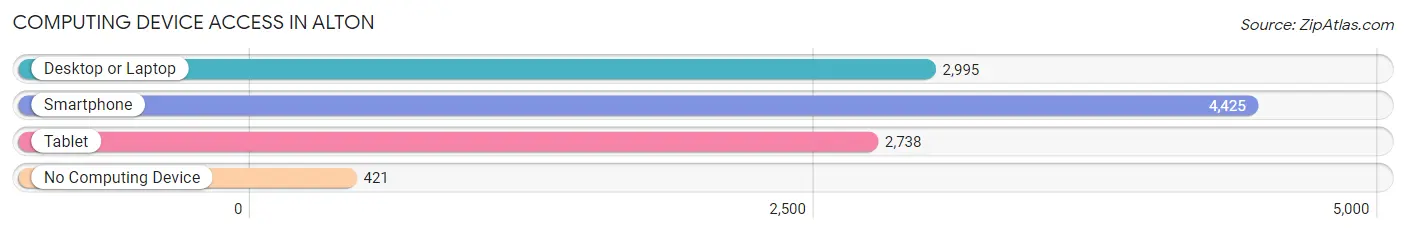
| Device Type | # Households | % Households |
| Desktop or Laptop | 2,995 | 60.4% |
| Smartphone | 4,425 | 89.2% |
| Tablet | 2,738 | 55.2% |
| No Computing Device | 421 | 8.5% |
| Total | 4,958 | 100.0% |
Internet Access in Alton
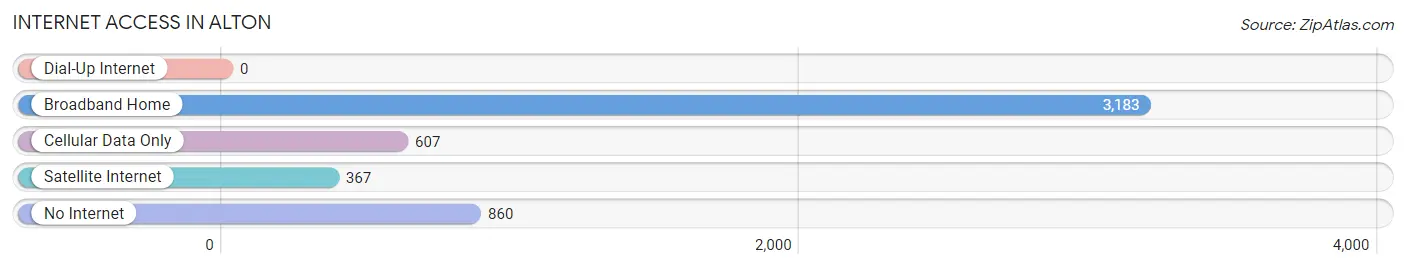
| Internet Type | # Households | % Households |
| Dial-Up Internet | 0 | 0.0% |
| Broadband Home | 3,183 | 64.2% |
| Cellular Data Only | 607 | 12.2% |
| Satellite Internet | 367 | 7.4% |
| No Internet | 860 | 17.3% |
| Total | 4,958 | 100.0% |
Alton Summary
Alton, Texas is a small town located in Hidalgo County, Texas, United States. It is situated on the Rio Grande, just south of the city of McAllen. The population of Alton was estimated to be 8,845 in 2019.
History
Alton was founded in the late 19th century by a group of settlers from the United States. The town was named after Alton, Illinois, the hometown of one of the settlers. The town was incorporated in 1910 and has since grown to become a small but vibrant community.
Geography
Alton is located in the Rio Grande Valley of South Texas, approximately 10 miles south of McAllen. The town is situated on the banks of the Rio Grande, which forms the border between the United States and Mexico. The terrain of the area is mostly flat, with some rolling hills. The climate is subtropical, with hot summers and mild winters.
Economy
Alton’s economy is largely based on agriculture and tourism. The town is home to several large farms, which produce a variety of crops, including cotton, corn, and sorghum. The town is also a popular destination for birdwatchers, as the area is home to a variety of species. In addition, Alton is home to several small businesses, including restaurants, shops, and services.
Demographics
As of the 2019 census, Alton had a population of 8,845. The racial makeup of the town was 79.2% Hispanic or Latino, 16.2% White, 1.2% African American, 0.7% Native American, 0.3% Asian, and 2.6% from other races. The median household income was $30,945, and the median age was 33.
Conclusion
Alton, Texas is a small town located in Hidalgo County, Texas, United States. It is situated on the Rio Grande, just south of the city of McAllen. The town was founded in the late 19th century by a group of settlers from the United States and has since grown to become a small but vibrant community. The economy of Alton is largely based on agriculture and tourism, and the town is home to a diverse population. Alton is a great place to visit and live, and its unique history and culture make it a great destination for travelers.
Common Questions
What is the Total Population of Alton?
Total Population of Alton is 18,493.
What is the Total Male Population of Alton?
Total Male Population of Alton is 9,357.
What is the Total Female Population of Alton?
Total Female Population of Alton is 9,136.
What is the Ratio of Males per 100 Females in Alton?
There are 102.42 Males per 100 Females in Alton.
What is the Ratio of Females per 100 Males in Alton?
There are 97.64 Females per 100 Males in Alton.
What is the Median Population Age in Alton?
Median Population Age in Alton is 25.9 Years.
What is the Average Family Size in Alton
Average Family Size in Alton is 4.1 People.
What is the Average Household Size in Alton
Average Household Size in Alton is 3.7 People.
What is Per Capita Income in Alton?
Per Capita income in Alton is $15,656.
What is the Median Family Income in Alton?
Median Family Income in Alton is $45,230.
What is the Median Household income in Alton?
Median Household Income in Alton is $44,317.
What is Income or Wage Gap in Alton?
Income or Wage Gap in Alton is 10.7%.
Women in Alton earn 89.3 cents for every dollar earned by a man.
What is Family Income Deficit in Alton?
Family Income Deficit in Alton is $12,888.
Families that are below poverty line in Alton earn $12,888 less on average than the poverty threshold level.
What is Inequality or Gini Index in Alton?
Inequality or Gini Index in Alton is 0.42.
How Large is the Labor Force in Alton?
There are 7,889 People in the Labor Forcein in Alton.
What is the Percentage of People in the Labor Force in Alton?
63.3% of People are in the Labor Force in Alton.
What is the Unemployment Rate in Alton?
Unemployment Rate in Alton is 9.3%.