Laredo, TX
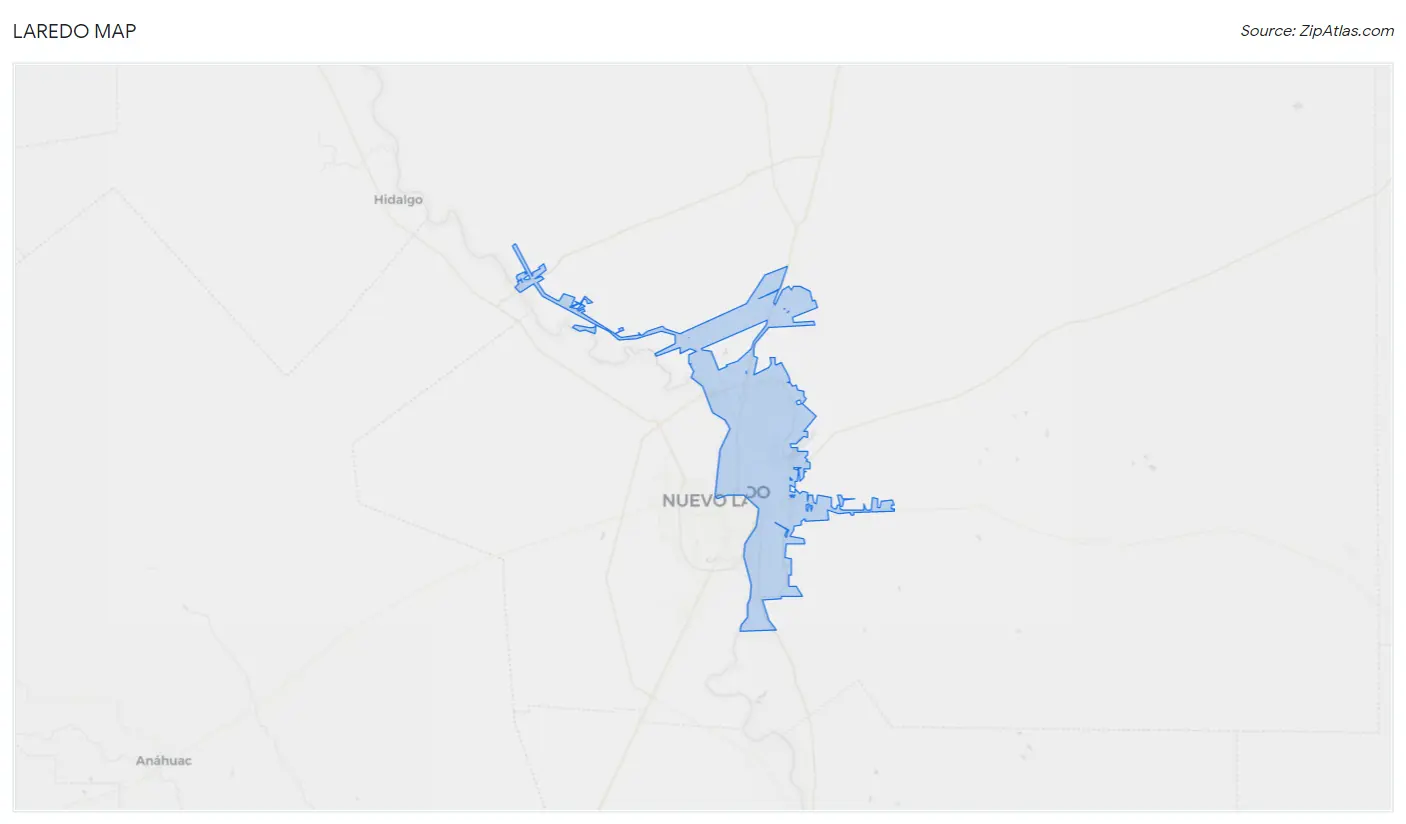
Laredo Map
Laredo Overview
255,293
TOTAL POPULATION
126,431
MALE POPULATION
128,862
FEMALE POPULATION
98.11
MALES / 100 FEMALES
101.92
FEMALES / 100 MALES
29.3
MEDIAN AGE
3.9
AVG FAMILY SIZE
3.4
AVG HOUSEHOLD SIZE
$23,669
PER CAPITA INCOME
$66,315
AVG FAMILY INCOME
$60,928
AVG HOUSEHOLD INCOME
39.3%
WAGE / INCOME GAP [ % ]
60.7¢/ $1
WAGE / INCOME GAP [ $ ]
$11,121
FAMILY INCOME DEFICIT
0.46
INEQUALITY / GINI INDEX
114,004
LABOR FORCE [ PEOPLE ]
62.3%
PERCENT IN LABOR FORCE
5.9%
UNEMPLOYMENT RATE
Laredo Area Codes
Race in Laredo
The most populous races in Laredo are Hispanic or Latino (243,858 | 95.5%), White / Caucasian (136,450 | 53.4%), and Two or more Races (100,715 | 39.5%).
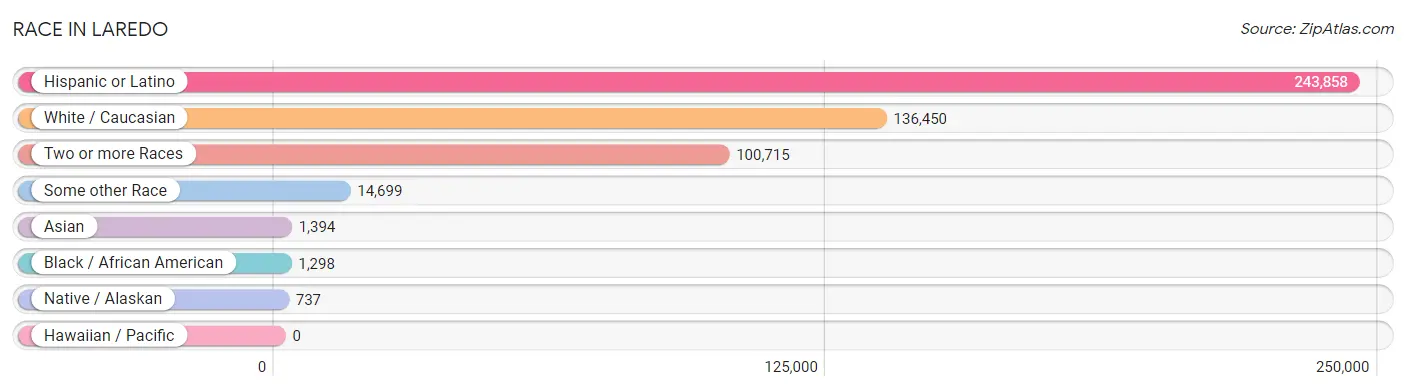
| Race | # Population | % Population |
| Asian | 1,394 | 0.5% |
| Black / African American | 1,298 | 0.5% |
| Hawaiian / Pacific | 0 | 0.0% |
| Hispanic or Latino | 243,858 | 95.5% |
| Native / Alaskan | 737 | 0.3% |
| White / Caucasian | 136,450 | 53.4% |
| Two or more Races | 100,715 | 39.5% |
| Some other Race | 14,699 | 5.8% |
| Total | 255,293 | 100.0% |
Ancestry in Laredo
The most populous ancestries reported in Laredo are Mexican (230,180 | 90.2%), American (3,011 | 1.2%), German (2,333 | 0.9%), Irish (1,311 | 0.5%), and Central American (1,283 | 0.5%), together accounting for 93.3% of all Laredo residents.
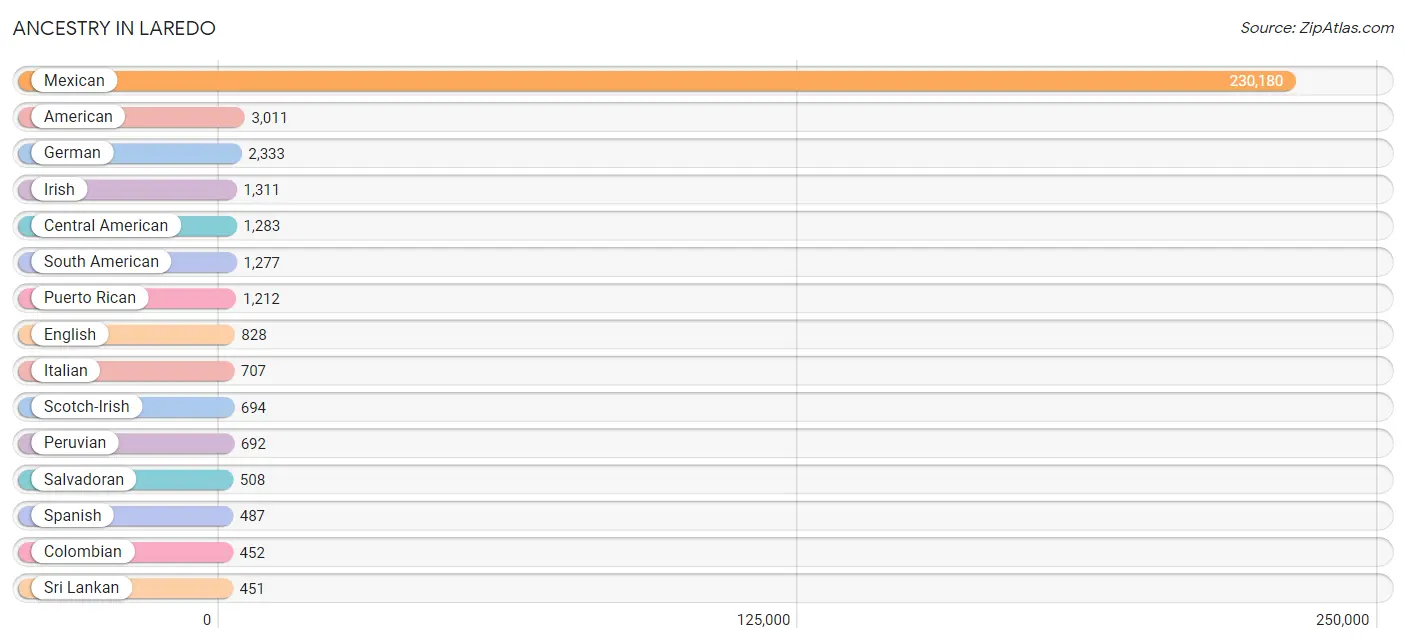
| Ancestry | # Population | % Population |
| African | 181 | 0.1% |
| Albanian | 6 | 0.0% |
| American | 3,011 | 1.2% |
| Apache | 17 | 0.0% |
| Arab | 78 | 0.0% |
| Argentinean | 37 | 0.0% |
| Austrian | 40 | 0.0% |
| Bhutanese | 131 | 0.1% |
| Brazilian | 15 | 0.0% |
| British | 36 | 0.0% |
| Bulgarian | 149 | 0.1% |
| Burmese | 190 | 0.1% |
| Canadian | 11 | 0.0% |
| Central American | 1,283 | 0.5% |
| Central American Indian | 51 | 0.0% |
| Cherokee | 290 | 0.1% |
| Chickasaw | 29 | 0.0% |
| Colombian | 452 | 0.2% |
| Comanche | 17 | 0.0% |
| Creek | 31 | 0.0% |
| Cuban | 385 | 0.2% |
| Czech | 28 | 0.0% |
| Danish | 99 | 0.0% |
| Dominican | 90 | 0.0% |
| Dutch | 217 | 0.1% |
| Eastern European | 4 | 0.0% |
| Ecuadorian | 61 | 0.0% |
| Egyptian | 17 | 0.0% |
| English | 828 | 0.3% |
| Ethiopian | 6 | 0.0% |
| European | 194 | 0.1% |
| Filipino | 1 | 0.0% |
| French | 403 | 0.2% |
| French American Indian | 3 | 0.0% |
| French Canadian | 71 | 0.0% |
| German | 2,333 | 0.9% |
| Greek | 32 | 0.0% |
| Guamanian / Chamorro | 7 | 0.0% |
| Guatemalan | 334 | 0.1% |
| Honduran | 225 | 0.1% |
| Hungarian | 23 | 0.0% |
| Indian (Asian) | 314 | 0.1% |
| Iranian | 11 | 0.0% |
| Iraqi | 44 | 0.0% |
| Irish | 1,311 | 0.5% |
| Iroquois | 18 | 0.0% |
| Italian | 707 | 0.3% |
| Jamaican | 8 | 0.0% |
| Kenyan | 3 | 0.0% |
| Korean | 324 | 0.1% |
| Laotian | 8 | 0.0% |
| Lithuanian | 29 | 0.0% |
| Lumbee | 4 | 0.0% |
| Mexican | 230,180 | 90.2% |
| Mexican American Indian | 432 | 0.2% |
| Navajo | 8 | 0.0% |
| Nicaraguan | 118 | 0.1% |
| Nigerian | 37 | 0.0% |
| Norwegian | 45 | 0.0% |
| Pakistani | 29 | 0.0% |
| Panamanian | 98 | 0.0% |
| Peruvian | 692 | 0.3% |
| Polish | 309 | 0.1% |
| Portuguese | 15 | 0.0% |
| Pueblo | 6 | 0.0% |
| Puerto Rican | 1,212 | 0.5% |
| Russian | 156 | 0.1% |
| Salvadoran | 508 | 0.2% |
| Samoan | 35 | 0.0% |
| Scandinavian | 16 | 0.0% |
| Scotch-Irish | 694 | 0.3% |
| Scottish | 109 | 0.0% |
| Sioux | 5 | 0.0% |
| Slovak | 23 | 0.0% |
| Slovene | 40 | 0.0% |
| South American | 1,277 | 0.5% |
| Spaniard | 405 | 0.2% |
| Spanish | 487 | 0.2% |
| Spanish American | 23 | 0.0% |
| Spanish American Indian | 6 | 0.0% |
| Sri Lankan | 451 | 0.2% |
| Subsaharan African | 301 | 0.1% |
| Swedish | 35 | 0.0% |
| Swiss | 61 | 0.0% |
| Syrian | 17 | 0.0% |
| Thai | 101 | 0.0% |
| Ukrainian | 26 | 0.0% |
| Venezuelan | 35 | 0.0% |
| Welsh | 30 | 0.0% |
| West Indian | 19 | 0.0% |
| Yugoslavian | 57 | 0.0% | View All 91 Rows |
Immigrants in Laredo
The most numerous immigrant groups reported in Laredo came from Latin America (62,523 | 24.5%), Central America (61,180 | 24.0%), Mexico (59,934 | 23.5%), Asia (888 | 0.4%), and South America (758 | 0.3%), together accounting for 72.6% of all Laredo residents.
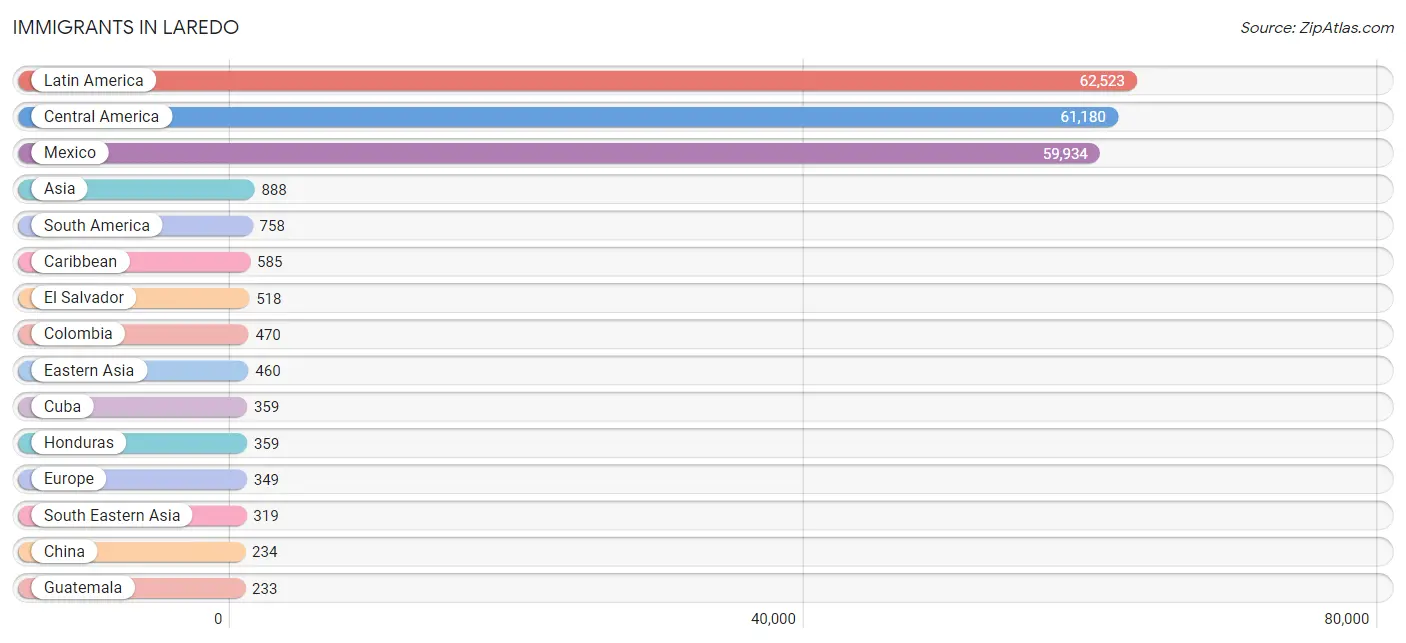
| Immigration Origin | # Population | % Population |
| Africa | 224 | 0.1% |
| Albania | 6 | 0.0% |
| Argentina | 32 | 0.0% |
| Asia | 888 | 0.4% |
| Bangladesh | 11 | 0.0% |
| Brazil | 16 | 0.0% |
| Bulgaria | 86 | 0.0% |
| Cameroon | 74 | 0.0% |
| Canada | 85 | 0.0% |
| Caribbean | 585 | 0.2% |
| Central America | 61,180 | 24.0% |
| China | 234 | 0.1% |
| Colombia | 470 | 0.2% |
| Cuba | 359 | 0.1% |
| Denmark | 35 | 0.0% |
| Dominican Republic | 75 | 0.0% |
| Eastern Africa | 113 | 0.0% |
| Eastern Asia | 460 | 0.2% |
| Eastern Europe | 198 | 0.1% |
| Ecuador | 72 | 0.0% |
| El Salvador | 518 | 0.2% |
| Eritrea | 6 | 0.0% |
| Ethiopia | 104 | 0.0% |
| Europe | 349 | 0.1% |
| Germany | 16 | 0.0% |
| Guatemala | 233 | 0.1% |
| Honduras | 359 | 0.1% |
| Hong Kong | 12 | 0.0% |
| India | 27 | 0.0% |
| Iraq | 44 | 0.0% |
| Ireland | 22 | 0.0% |
| Jamaica | 8 | 0.0% |
| Japan | 112 | 0.0% |
| Kenya | 3 | 0.0% |
| Korea | 114 | 0.0% |
| Latin America | 62,523 | 24.5% |
| Mexico | 59,934 | 23.5% |
| Middle Africa | 74 | 0.0% |
| Nicaragua | 127 | 0.1% |
| Nigeria | 34 | 0.0% |
| Northern Europe | 72 | 0.0% |
| Pakistan | 10 | 0.0% |
| Panama | 9 | 0.0% |
| Peru | 133 | 0.1% |
| Philippines | 142 | 0.1% |
| Russia | 56 | 0.0% |
| Serbia | 24 | 0.0% |
| South America | 758 | 0.3% |
| South Central Asia | 48 | 0.0% |
| South Eastern Asia | 319 | 0.1% |
| Southern Europe | 63 | 0.0% |
| Spain | 63 | 0.0% |
| Sweden | 6 | 0.0% |
| Syria | 17 | 0.0% |
| Taiwan | 1 | 0.0% |
| Thailand | 29 | 0.0% |
| Trinidad and Tobago | 11 | 0.0% |
| Ukraine | 26 | 0.0% |
| Venezuela | 35 | 0.0% |
| Vietnam | 148 | 0.1% |
| Western Africa | 37 | 0.0% |
| Western Asia | 61 | 0.0% |
| Western Europe | 16 | 0.0% | View All 63 Rows |
Sex and Age in Laredo
Sex and Age in Laredo
The most populous age groups in Laredo are 5 to 9 Years (11,896 | 9.4%) for men and 10 to 14 Years (12,385 | 9.6%) for women.
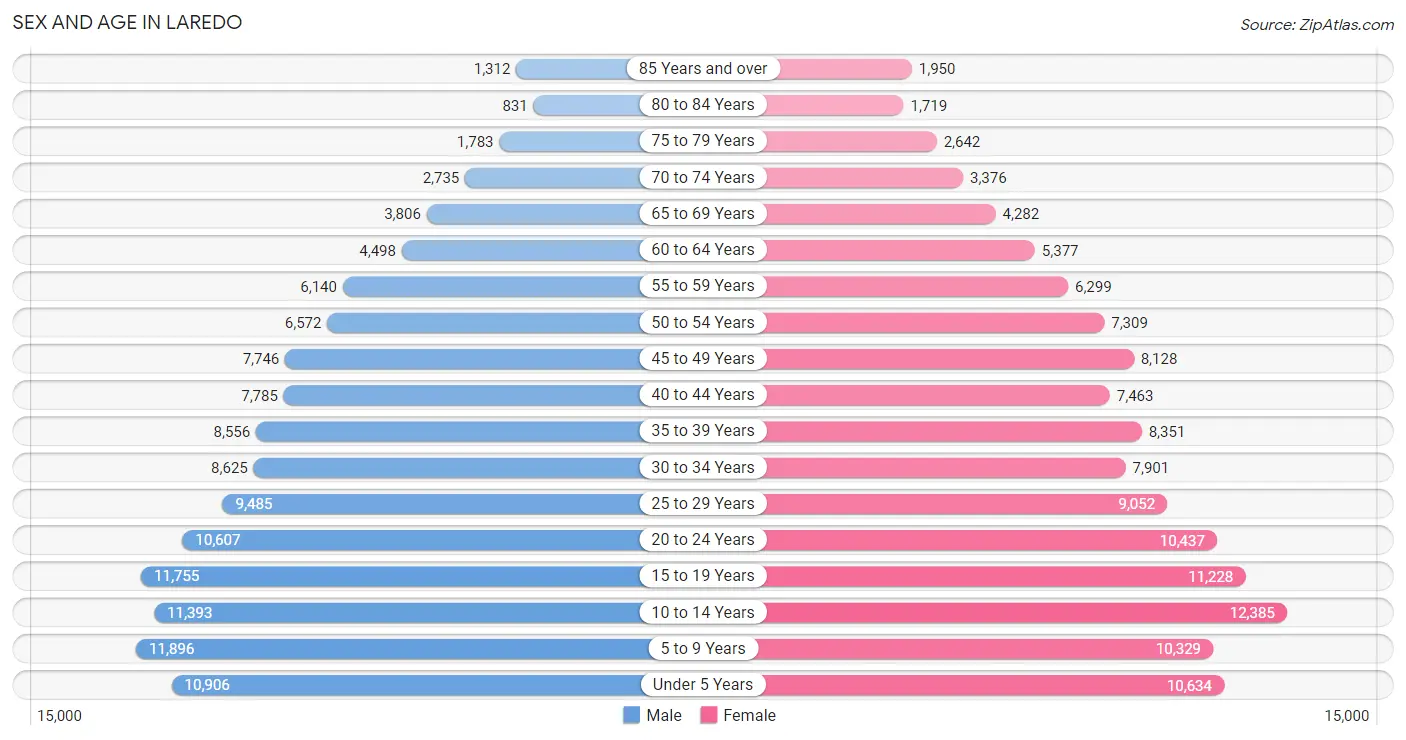
| Age Bracket | Male | Female |
| Under 5 Years | 10,906 (8.6%) | 10,634 (8.3%) |
| 5 to 9 Years | 11,896 (9.4%) | 10,329 (8.0%) |
| 10 to 14 Years | 11,393 (9.0%) | 12,385 (9.6%) |
| 15 to 19 Years | 11,755 (9.3%) | 11,228 (8.7%) |
| 20 to 24 Years | 10,607 (8.4%) | 10,437 (8.1%) |
| 25 to 29 Years | 9,485 (7.5%) | 9,052 (7.0%) |
| 30 to 34 Years | 8,625 (6.8%) | 7,901 (6.1%) |
| 35 to 39 Years | 8,556 (6.8%) | 8,351 (6.5%) |
| 40 to 44 Years | 7,785 (6.2%) | 7,463 (5.8%) |
| 45 to 49 Years | 7,746 (6.1%) | 8,128 (6.3%) |
| 50 to 54 Years | 6,572 (5.2%) | 7,309 (5.7%) |
| 55 to 59 Years | 6,140 (4.9%) | 6,299 (4.9%) |
| 60 to 64 Years | 4,498 (3.6%) | 5,377 (4.2%) |
| 65 to 69 Years | 3,806 (3.0%) | 4,282 (3.3%) |
| 70 to 74 Years | 2,735 (2.2%) | 3,376 (2.6%) |
| 75 to 79 Years | 1,783 (1.4%) | 2,642 (2.1%) |
| 80 to 84 Years | 831 (0.7%) | 1,719 (1.3%) |
| 85 Years and over | 1,312 (1.0%) | 1,950 (1.5%) |
| Total | 126,431 (100.0%) | 128,862 (100.0%) |
Families and Households in Laredo
Median Family Size in Laredo
The median family size in Laredo is 3.85 persons per family, with married-couple families (38,319 | 64.2%) accounting for the largest median family size of 4 persons per family. On the other hand, single male/father families (5,030 | 8.4%) represent the smallest median family size with 3.18 persons per family.
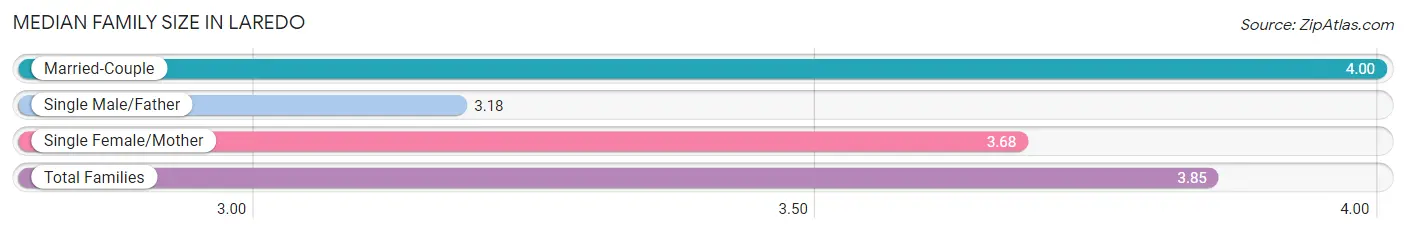
| Family Type | # Families | Family Size |
| Married-Couple | 38,319 (64.2%) | 4.00 |
| Single Male/Father | 5,030 (8.4%) | 3.18 |
| Single Female/Mother | 16,331 (27.4%) | 3.68 |
| Total Families | 59,680 (100.0%) | 3.85 |
Median Household Size in Laredo
The median household size in Laredo is 3.39 persons per household, with married-couple households (38,319 | 51.5%) accounting for the largest median household size of 4.02 persons per household. non-family households (14,700 | 19.8%) represent the smallest median household size with 1.17 persons per household.
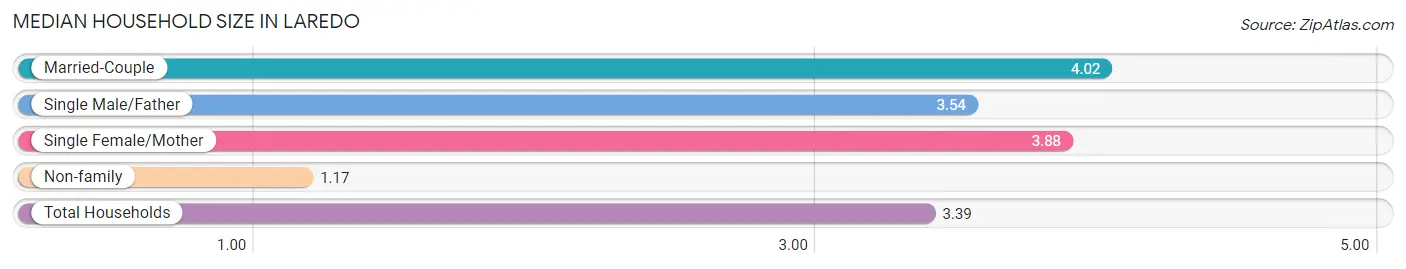
| Household Type | # Households | Household Size |
| Married-Couple | 38,319 (51.5%) | 4.02 |
| Single Male/Father | 5,030 (6.8%) | 3.54 |
| Single Female/Mother | 16,331 (22.0%) | 3.88 |
| Non-family | 14,700 (19.8%) | 1.17 |
| Total Households | 74,380 (100.0%) | 3.39 |
Household Size by Marriage Status in Laredo
Out of a total of 74,380 households in Laredo, 59,680 (80.2%) are family households, while 14,700 (19.8%) are nonfamily households. The most numerous type of family households are 4-person households, comprising 14,552, and the most common type of nonfamily households are 1-person households, comprising 12,519.
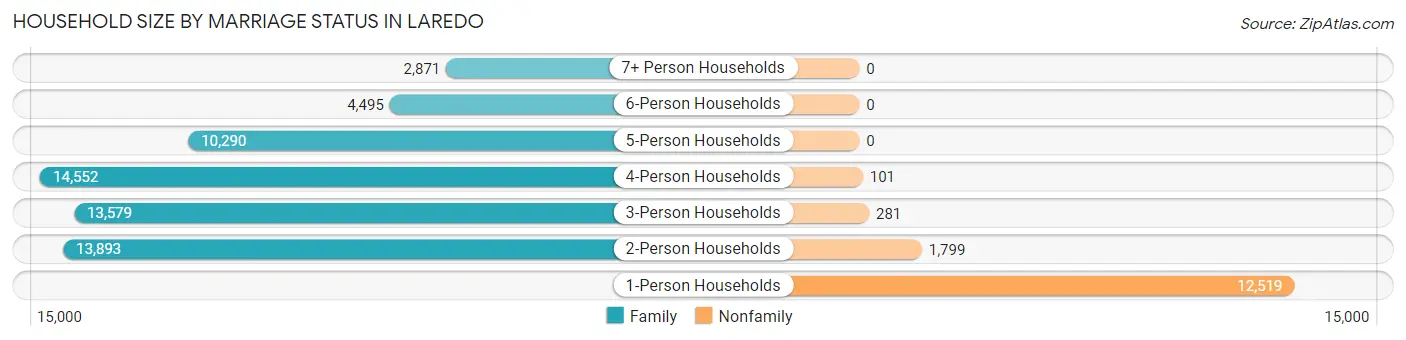
| Household Size | Family Households | Nonfamily Households |
| 1-Person Households | - | 12,519 (16.8%) |
| 2-Person Households | 13,893 (18.7%) | 1,799 (2.4%) |
| 3-Person Households | 13,579 (18.3%) | 281 (0.4%) |
| 4-Person Households | 14,552 (19.6%) | 101 (0.1%) |
| 5-Person Households | 10,290 (13.8%) | 0 (0.0%) |
| 6-Person Households | 4,495 (6.0%) | 0 (0.0%) |
| 7+ Person Households | 2,871 (3.9%) | 0 (0.0%) |
| Total | 59,680 (80.2%) | 14,700 (19.8%) |
Female Fertility in Laredo
Fertility by Age in Laredo
Average fertility rate in Laredo is 66.0 births per 1,000 women. Women in the age bracket of 20 to 34 years have the highest fertility rate with 121.0 births per 1,000 women. Women in the age bracket of 20 to 34 years acount for 78.0% of all women with births.
| Age Bracket | Women with Births | Births / 1,000 Women |
| 15 to 19 years | 174 (4.1%) | 15.0 |
| 20 to 34 years | 3,311 (78.0%) | 121.0 |
| 35 to 50 years | 760 (17.9%) | 30.0 |
| Total | 4,245 (100.0%) | 66.0 |
Fertility by Age by Marriage Status in Laredo
57.6% of women with births (4,245) in Laredo are married. The highest percentage of unmarried women with births falls into 15 to 19 years age bracket with 85.1% of them unmarried at the time of birth, while the lowest percentage of unmarried women with births belong to 20 to 34 years age bracket with 39.7% of them unmarried.
| Age Bracket | Married | Unmarried |
| 15 to 19 years | 26 (14.9%) | 148 (85.1%) |
| 20 to 34 years | 1,997 (60.3%) | 1,314 (39.7%) |
| 35 to 50 years | 425 (55.9%) | 335 (44.1%) |
| Total | 2,445 (57.6%) | 1,800 (42.4%) |
Fertility by Education in Laredo
Average fertility rate in Laredo is 66.0 births per 1,000 women. Women with the education attainment of graduate degree have the highest fertility rate of 91.0 births per 1,000 women, while women with the education attainment of less than high school have the lowest fertility at 42.0 births per 1,000 women. Women with the education attainment of college or associate's degree represent 36.5% of all women with births.
| Educational Attainment | Women with Births | Births / 1,000 Women |
| Less than High School | 767 (18.1%) | 42.0 |
| High School Diploma | 1,098 (25.9%) | 80.0 |
| College or Associate's Degree | 1,549 (36.5%) | 78.0 |
| Bachelor's Degree | 540 (12.7%) | 59.0 |
| Graduate Degree | 291 (6.9%) | 91.0 |
| Total | 4,245 (100.0%) | 66.0 |
Fertility by Education by Marriage Status in Laredo
42.4% of women with births in Laredo are unmarried. Women with the educational attainment of graduate degree are most likely to be married with 94.9% of them married at childbirth, while women with the educational attainment of less than high school are least likely to be married with 66.2% of them unmarried at childbirth.
| Educational Attainment | Married | Unmarried |
| Less than High School | 259 (33.8%) | 508 (66.2%) |
| High School Diploma | 640 (58.3%) | 458 (41.7%) |
| College or Associate's Degree | 880 (56.8%) | 669 (43.2%) |
| Bachelor's Degree | 391 (72.4%) | 149 (27.6%) |
| Graduate Degree | 276 (94.9%) | 15 (5.1%) |
| Total | 2,445 (57.6%) | 1,800 (42.4%) |
Income in Laredo
Income Overview in Laredo
Per Capita Income in Laredo is $23,669, while median incomes of families and households are $66,315 and $60,928 respectively.
| Characteristic | Number | Measure |
| Per Capita Income | 255,293 | $23,669 |
| Median Family Income | 59,680 | $66,315 |
| Mean Family Income | 59,680 | $84,217 |
| Median Household Income | 74,380 | $60,928 |
| Mean Household Income | 74,380 | $79,486 |
| Income Deficit | 59,680 | $11,121 |
| Wage / Income Gap (%) | 255,293 | 39.29% |
| Wage / Income Gap ($) | 255,293 | 60.71¢ per $1 |
| Gini / Inequality Index | 255,293 | 0.46 |
Earnings by Sex in Laredo
Average Earnings in Laredo are $30,019, $39,057 for men and $23,711 for women, a difference of 39.3%.
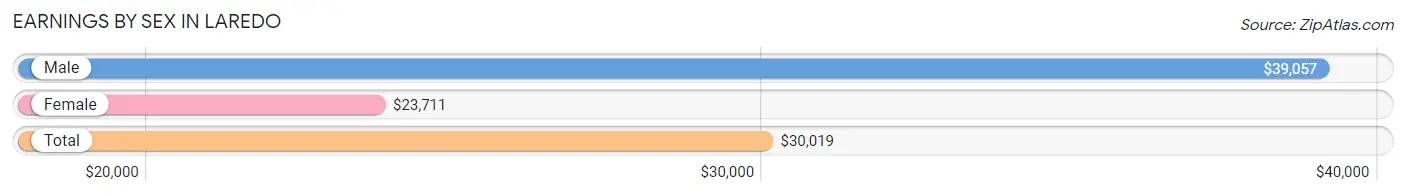
| Sex | Number | Average Earnings |
| Male | 65,251 (55.6%) | $39,057 |
| Female | 52,185 (44.4%) | $23,711 |
| Total | 117,436 (100.0%) | $30,019 |
Earnings by Sex by Income Bracket in Laredo
The most common earnings brackets in Laredo are $100,000+ for men (7,748 | 11.9%) and $25,000 to $29,999 for women (4,889 | 9.4%).
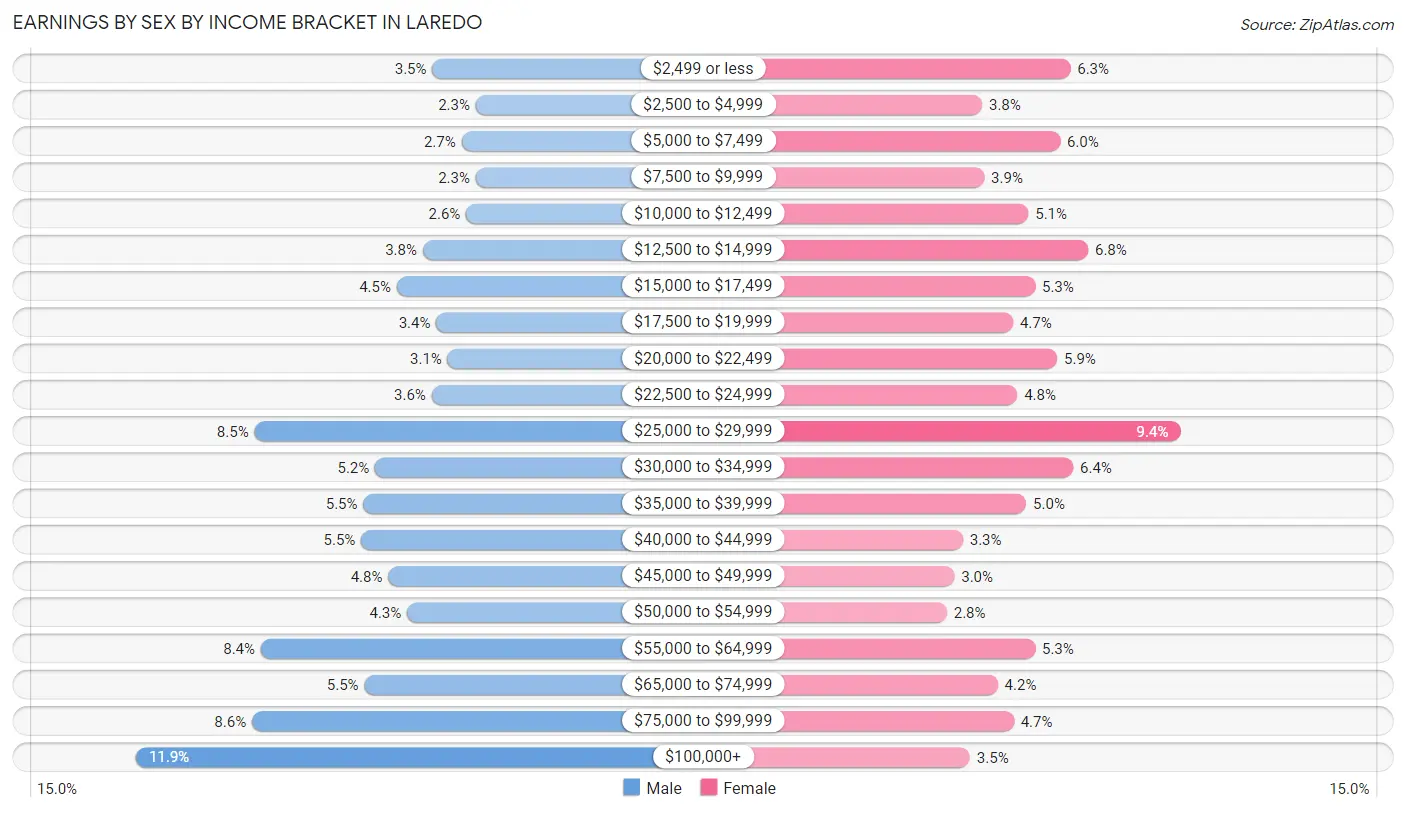
| Income | Male | Female |
| $2,499 or less | 2,310 (3.5%) | 3,275 (6.3%) |
| $2,500 to $4,999 | 1,514 (2.3%) | 1,981 (3.8%) |
| $5,000 to $7,499 | 1,772 (2.7%) | 3,128 (6.0%) |
| $7,500 to $9,999 | 1,516 (2.3%) | 2,015 (3.9%) |
| $10,000 to $12,499 | 1,692 (2.6%) | 2,662 (5.1%) |
| $12,500 to $14,999 | 2,487 (3.8%) | 3,537 (6.8%) |
| $15,000 to $17,499 | 2,964 (4.5%) | 2,763 (5.3%) |
| $17,500 to $19,999 | 2,241 (3.4%) | 2,439 (4.7%) |
| $20,000 to $22,499 | 2,030 (3.1%) | 3,082 (5.9%) |
| $22,500 to $24,999 | 2,325 (3.6%) | 2,500 (4.8%) |
| $25,000 to $29,999 | 5,571 (8.5%) | 4,889 (9.4%) |
| $30,000 to $34,999 | 3,359 (5.1%) | 3,318 (6.4%) |
| $35,000 to $39,999 | 3,579 (5.5%) | 2,632 (5.0%) |
| $40,000 to $44,999 | 3,617 (5.5%) | 1,699 (3.3%) |
| $45,000 to $49,999 | 3,122 (4.8%) | 1,574 (3.0%) |
| $50,000 to $54,999 | 2,774 (4.3%) | 1,469 (2.8%) |
| $55,000 to $64,999 | 5,454 (8.4%) | 2,759 (5.3%) |
| $65,000 to $74,999 | 3,556 (5.4%) | 2,211 (4.2%) |
| $75,000 to $99,999 | 5,620 (8.6%) | 2,447 (4.7%) |
| $100,000+ | 7,748 (11.9%) | 1,805 (3.5%) |
| Total | 65,251 (100.0%) | 52,185 (100.0%) |
Earnings by Sex by Educational Attainment in Laredo
Average earnings in Laredo are $45,623 for men and $27,256 for women, a difference of 40.3%. Men with an educational attainment of graduate degree enjoy the highest average annual earnings of $87,632, while those with less than high school education earn the least with $32,314. Women with an educational attainment of graduate degree earn the most with the average annual earnings of $64,916, while those with less than high school education have the smallest earnings of $17,268.
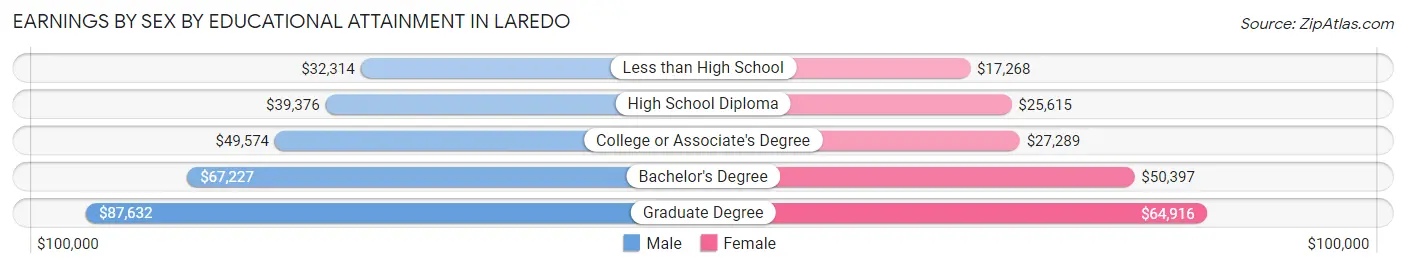
| Educational Attainment | Male Income | Female Income |
| Less than High School | $32,314 | $17,268 |
| High School Diploma | $39,376 | $25,615 |
| College or Associate's Degree | $49,574 | $27,289 |
| Bachelor's Degree | $67,227 | $50,397 |
| Graduate Degree | $87,632 | $64,916 |
| Total | $45,623 | $27,256 |
Family Income in Laredo
Family Income Brackets in Laredo
According to the Laredo family income data, there are 10,265 families falling into the $100,000 to $149,999 income range, which is the most common income bracket and makes up 17.2% of all families. Conversely, the $10,000 to $14,999 income bracket is the least frequent group with only 1,910 families (3.2%) belonging to this category.
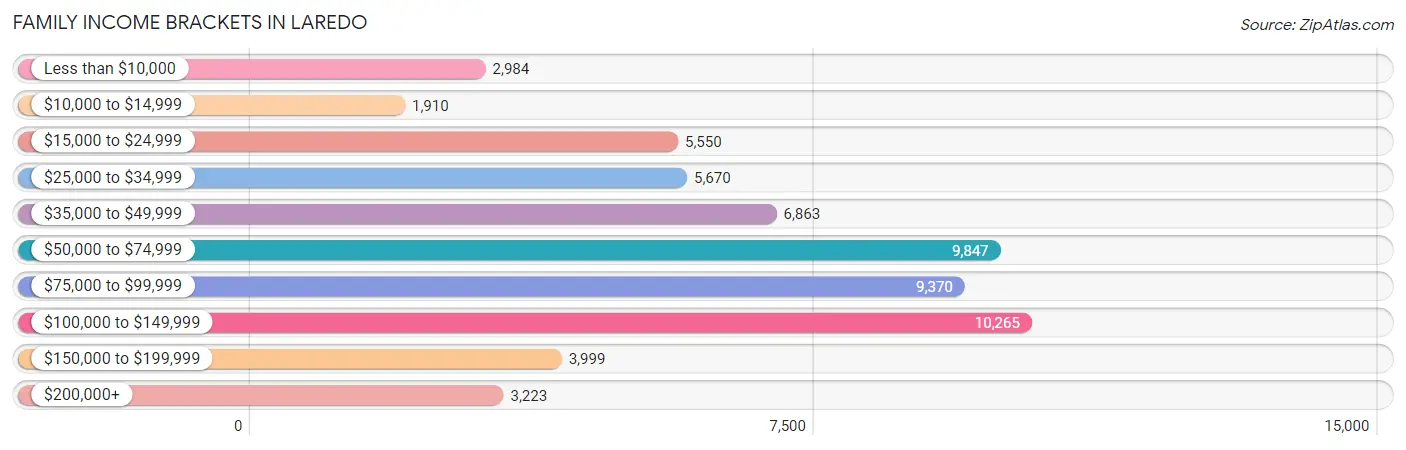
| Income Bracket | # Families | % Families |
| Less than $10,000 | 2,984 | 5.0% |
| $10,000 to $14,999 | 1,910 | 3.2% |
| $15,000 to $24,999 | 5,550 | 9.3% |
| $25,000 to $34,999 | 5,670 | 9.5% |
| $35,000 to $49,999 | 6,863 | 11.5% |
| $50,000 to $74,999 | 9,847 | 16.5% |
| $75,000 to $99,999 | 9,370 | 15.7% |
| $100,000 to $149,999 | 10,265 | 17.2% |
| $150,000 to $199,999 | 3,999 | 6.7% |
| $200,000+ | 3,223 | 5.4% |
Family Income by Famaliy Size in Laredo
7+ person families (2,542 | 4.3%) account for the highest median family income in Laredo with $94,265 per family, while 2-person families (15,239 | 25.5%) have the highest median income of $24,752 per family member.
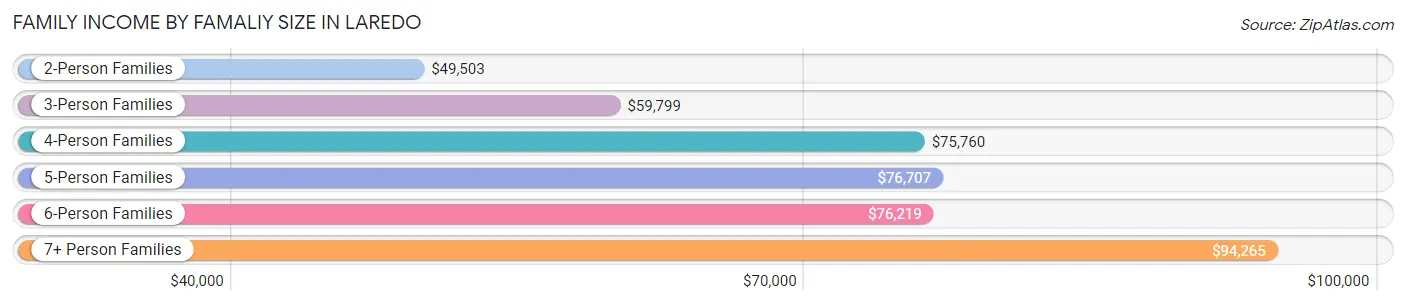
| Income Bracket | # Families | Median Income |
| 2-Person Families | 15,239 (25.5%) | $49,503 |
| 3-Person Families | 13,759 (23.1%) | $59,799 |
| 4-Person Families | 14,397 (24.1%) | $75,760 |
| 5-Person Families | 9,487 (15.9%) | $76,707 |
| 6-Person Families | 4,256 (7.1%) | $76,219 |
| 7+ Person Families | 2,542 (4.3%) | $94,265 |
| Total | 59,680 (100.0%) | $66,315 |
Family Income by Number of Earners in Laredo
The median family income in Laredo is $66,315, with families comprising 3+ earners (9,418) having the highest median family income of $105,000, while families with no earners (6,261) have the lowest median family income of $21,378, accounting for 15.8% and 10.5% of families, respectively.
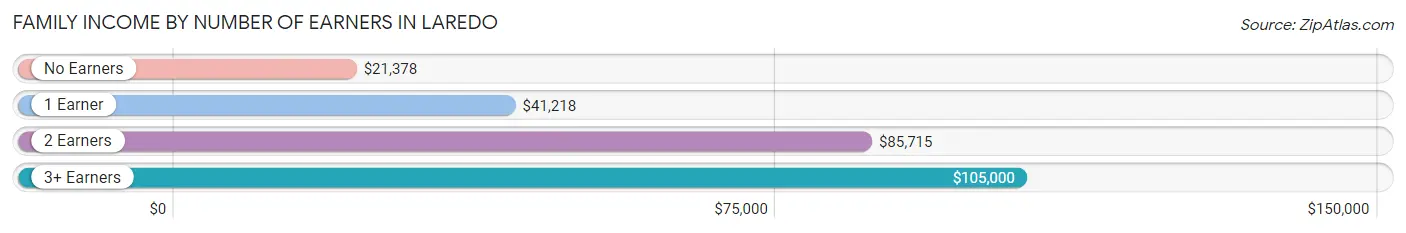
| Number of Earners | # Families | Median Income |
| No Earners | 6,261 (10.5%) | $21,378 |
| 1 Earner | 20,911 (35.0%) | $41,218 |
| 2 Earners | 23,090 (38.7%) | $85,715 |
| 3+ Earners | 9,418 (15.8%) | $105,000 |
| Total | 59,680 (100.0%) | $66,315 |
Household Income in Laredo
Household Income Brackets in Laredo
With 12,570 households falling in the category, the $50,000 to $74,999 income range is the most frequent in Laredo, accounting for 16.9% of all households. In contrast, only 3,719 households (5.0%) fall into the $200,000+ income bracket, making it the least populous group.
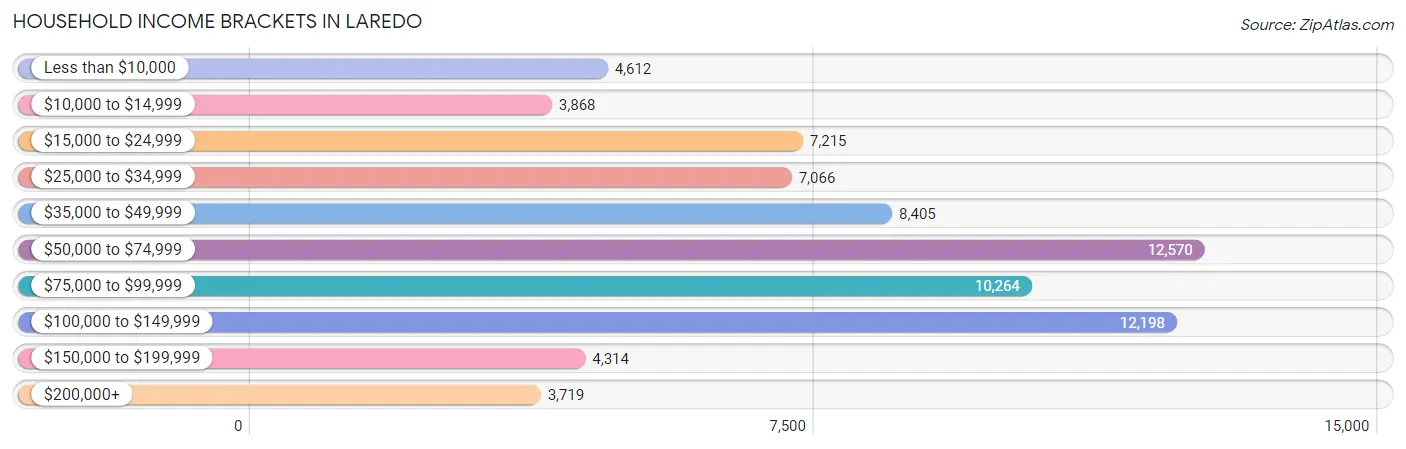
| Income Bracket | # Households | % Households |
| Less than $10,000 | 4,612 | 6.2% |
| $10,000 to $14,999 | 3,868 | 5.2% |
| $15,000 to $24,999 | 7,215 | 9.7% |
| $25,000 to $34,999 | 7,066 | 9.5% |
| $35,000 to $49,999 | 8,405 | 11.3% |
| $50,000 to $74,999 | 12,570 | 16.9% |
| $75,000 to $99,999 | 10,264 | 13.8% |
| $100,000 to $149,999 | 12,198 | 16.4% |
| $150,000 to $199,999 | 4,314 | 5.8% |
| $200,000+ | 3,719 | 5.0% |
Household Income by Householder Age in Laredo
The median household income in Laredo is $60,928, with the highest median household income of $70,932 found in the 45 to 64 years age bracket for the primary householder. A total of 29,198 households (39.3%) fall into this category. Meanwhile, the 15 to 24 years age bracket for the primary householder has the lowest median household income of $27,080, with 2,711 households (3.6%) in this group.
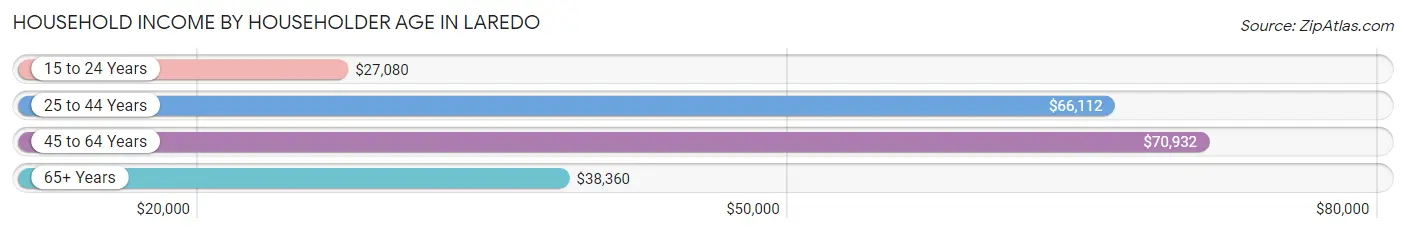
| Income Bracket | # Households | Median Income |
| 15 to 24 Years | 2,711 (3.6%) | $27,080 |
| 25 to 44 Years | 27,928 (37.6%) | $66,112 |
| 45 to 64 Years | 29,198 (39.3%) | $70,932 |
| 65+ Years | 14,543 (19.6%) | $38,360 |
| Total | 74,380 (100.0%) | $60,928 |
Poverty in Laredo
Income Below Poverty by Sex and Age in Laredo
With 18.9% poverty level for males and 23.0% for females among the residents of Laredo, 5 year old males and 5 year old females are the most vulnerable to poverty, with 676 males (38.4%) and 735 females (31.9%) in their respective age groups living below the poverty level.
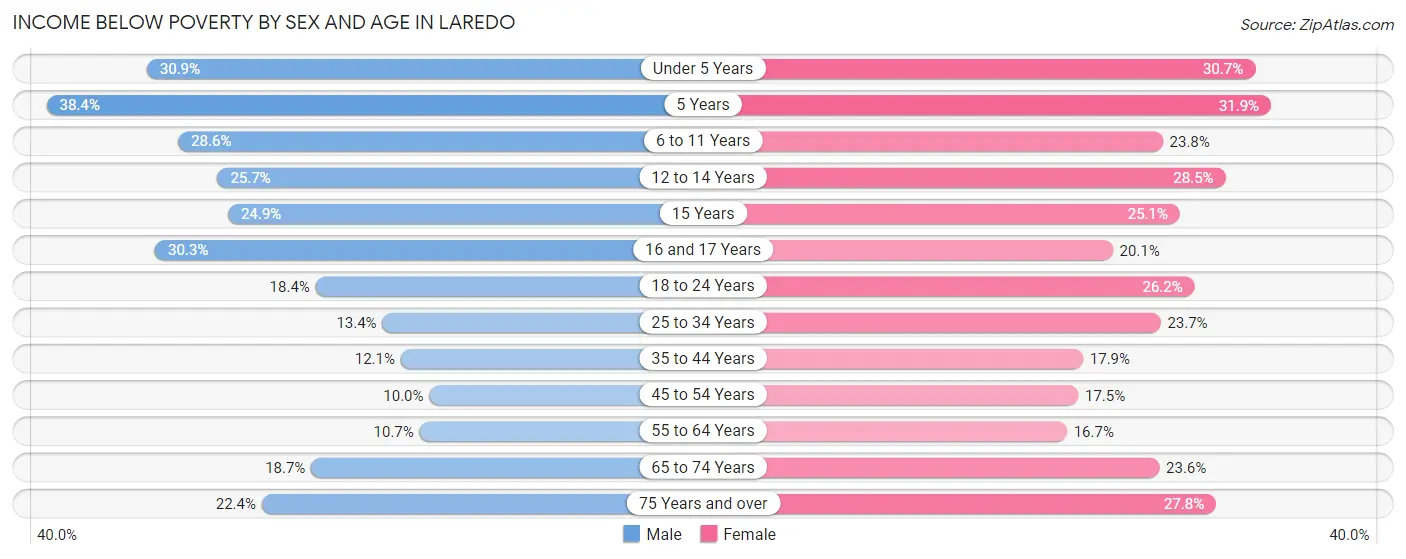
| Age Bracket | Male | Female |
| Under 5 Years | 3,305 (30.9%) | 3,198 (30.7%) |
| 5 Years | 676 (38.4%) | 735 (31.9%) |
| 6 to 11 Years | 4,238 (28.6%) | 3,101 (23.8%) |
| 12 to 14 Years | 1,689 (25.7%) | 2,068 (28.5%) |
| 15 Years | 606 (24.9%) | 581 (25.1%) |
| 16 and 17 Years | 1,353 (30.3%) | 878 (20.1%) |
| 18 to 24 Years | 2,746 (18.4%) | 3,782 (26.2%) |
| 25 to 34 Years | 2,361 (13.4%) | 4,004 (23.7%) |
| 35 to 44 Years | 1,944 (12.1%) | 2,821 (17.9%) |
| 45 to 54 Years | 1,413 (10.0%) | 2,700 (17.5%) |
| 55 to 64 Years | 1,130 (10.7%) | 1,949 (16.7%) |
| 65 to 74 Years | 1,208 (18.7%) | 1,791 (23.6%) |
| 75 Years and over | 857 (22.4%) | 1,711 (27.8%) |
| Total | 23,526 (18.9%) | 29,319 (23.0%) |
Income Above Poverty by Sex and Age in Laredo
According to the poverty statistics in Laredo, males aged 45 to 54 years and females aged 55 to 64 years are the age groups that are most secure financially, with 90.0% of males and 83.3% of females in these age groups living above the poverty line.
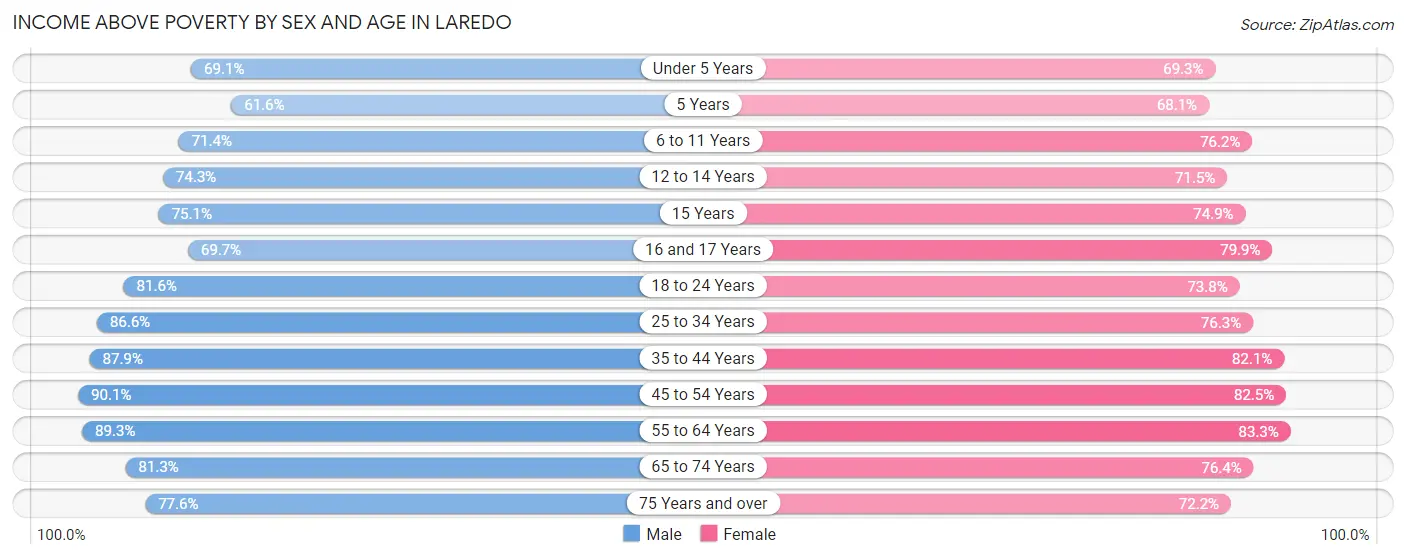
| Age Bracket | Male | Female |
| Under 5 Years | 7,385 (69.1%) | 7,227 (69.3%) |
| 5 Years | 1,086 (61.6%) | 1,572 (68.1%) |
| 6 to 11 Years | 10,582 (71.4%) | 9,917 (76.2%) |
| 12 to 14 Years | 4,888 (74.3%) | 5,192 (71.5%) |
| 15 Years | 1,828 (75.1%) | 1,735 (74.9%) |
| 16 and 17 Years | 3,111 (69.7%) | 3,490 (79.9%) |
| 18 to 24 Years | 12,183 (81.6%) | 10,658 (73.8%) |
| 25 to 34 Years | 15,222 (86.6%) | 12,922 (76.3%) |
| 35 to 44 Years | 14,159 (87.9%) | 12,943 (82.1%) |
| 45 to 54 Years | 12,783 (90.0%) | 12,689 (82.5%) |
| 55 to 64 Years | 9,464 (89.3%) | 9,724 (83.3%) |
| 65 to 74 Years | 5,246 (81.3%) | 5,811 (76.4%) |
| 75 Years and over | 2,971 (77.6%) | 4,449 (72.2%) |
| Total | 100,908 (81.1%) | 98,329 (77.0%) |
Income Below Poverty Among Married-Couple Families in Laredo
The poverty statistics for married-couple families in Laredo show that 11.2% or 4,295 of the total 38,319 families live below the poverty line. Families with 5 or more children have the highest poverty rate of 34.9%, comprising of 166 families. On the other hand, families with no children have the lowest poverty rate of 7.7%, which includes 1,165 families.
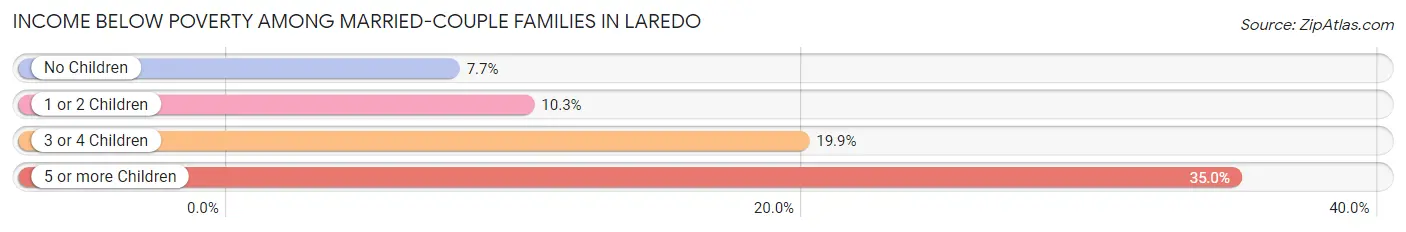
| Children | Above Poverty | Below Poverty |
| No Children | 13,923 (92.3%) | 1,165 (7.7%) |
| 1 or 2 Children | 14,644 (89.7%) | 1,686 (10.3%) |
| 3 or 4 Children | 5,148 (80.1%) | 1,278 (19.9%) |
| 5 or more Children | 309 (65.0%) | 166 (34.9%) |
| Total | 34,024 (88.8%) | 4,295 (11.2%) |
Income Below Poverty Among Single-Parent Households in Laredo
According to the poverty data in Laredo, 19.7% or 991 single-father households and 36.8% or 6,004 single-mother households are living below the poverty line. Among single-father households, those with 5 or more children have the highest poverty rate, with 16 households (100.0%) experiencing poverty. Likewise, among single-mother households, those with 5 or more children have the highest poverty rate, with 326 households (76.5%) falling below the poverty line.
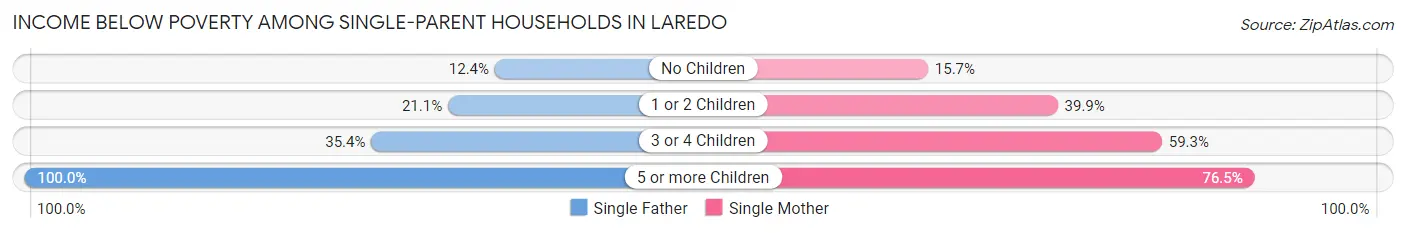
| Children | Single Father | Single Mother |
| No Children | 283 (12.4%) | 778 (15.7%) |
| 1 or 2 Children | 409 (21.1%) | 3,256 (39.9%) |
| 3 or 4 Children | 283 (35.4%) | 1,644 (59.3%) |
| 5 or more Children | 16 (100.0%) | 326 (76.5%) |
| Total | 991 (19.7%) | 6,004 (36.8%) |
Income Below Poverty Among Married-Couple vs Single-Parent Households in Laredo
The poverty data for Laredo shows that 4,295 of the married-couple family households (11.2%) and 6,995 of the single-parent households (32.8%) are living below the poverty level. Within the married-couple family households, those with 5 or more children have the highest poverty rate, with 166 households (34.9%) falling below the poverty line. Among the single-parent households, those with 5 or more children have the highest poverty rate, with 342 household (77.4%) living below poverty.
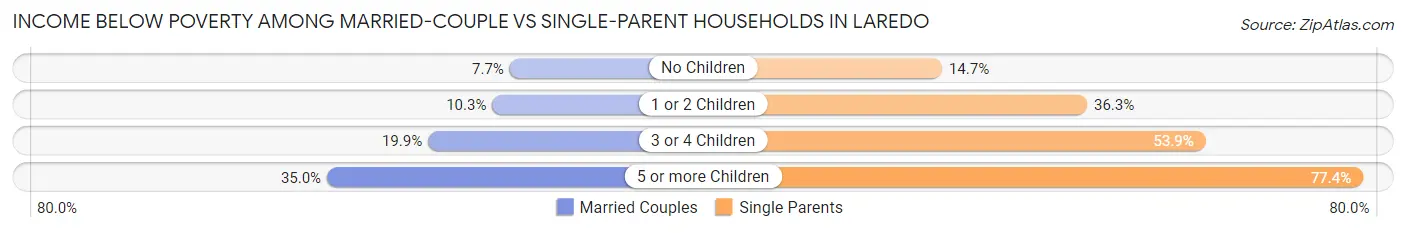
| Children | Married-Couple Families | Single-Parent Households |
| No Children | 1,165 (7.7%) | 1,061 (14.6%) |
| 1 or 2 Children | 1,686 (10.3%) | 3,665 (36.3%) |
| 3 or 4 Children | 1,278 (19.9%) | 1,927 (53.9%) |
| 5 or more Children | 166 (34.9%) | 342 (77.4%) |
| Total | 4,295 (11.2%) | 6,995 (32.8%) |
Employment Characteristics in Laredo
Employment by Class of Employer in Laredo
Among the 106,260 employed individuals in Laredo, private company employees (73,784 | 69.4%), local government employees (10,173 | 9.6%), and self-employed (not incorporated) (7,321 | 6.9%) make up the most common classes of employment.
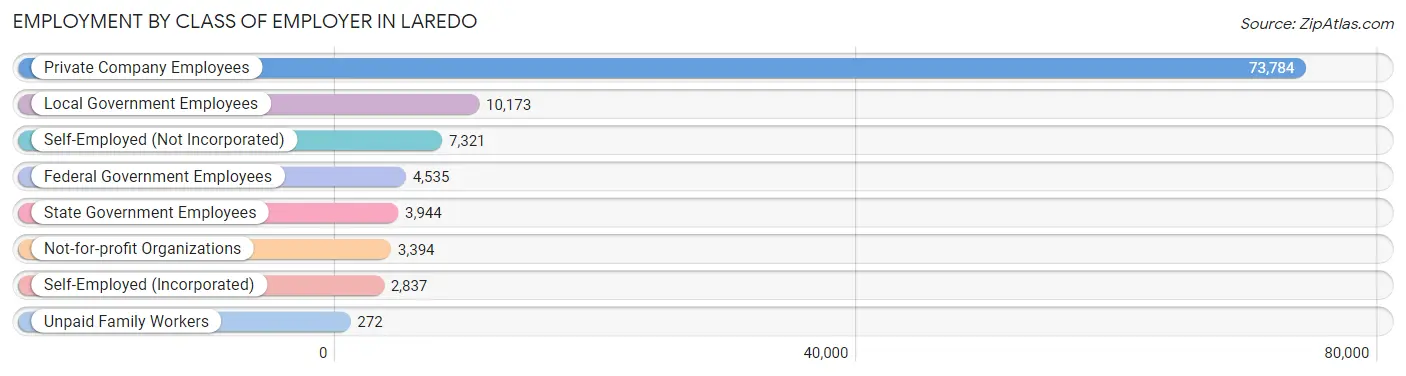
| Employer Class | # Employees | % Employees |
| Private Company Employees | 73,784 | 69.4% |
| Self-Employed (Incorporated) | 2,837 | 2.7% |
| Self-Employed (Not Incorporated) | 7,321 | 6.9% |
| Not-for-profit Organizations | 3,394 | 3.2% |
| Local Government Employees | 10,173 | 9.6% |
| State Government Employees | 3,944 | 3.7% |
| Federal Government Employees | 4,535 | 4.3% |
| Unpaid Family Workers | 272 | 0.3% |
| Total | 106,260 | 100.0% |
Employment Status by Age in Laredo
According to the labor force statistics for Laredo, out of the total population over 16 years of age (182,992), 62.3% or 114,004 individuals are in the labor force, with 5.9% or 6,726 of them unemployed. The age group with the highest labor force participation rate is 45 to 54 years, with 80.8% or 24,042 individuals in the labor force. Within the labor force, the 16 to 19 years age range has the highest percentage of unemployed individuals, with 14.6% or 673 of them being unemployed.
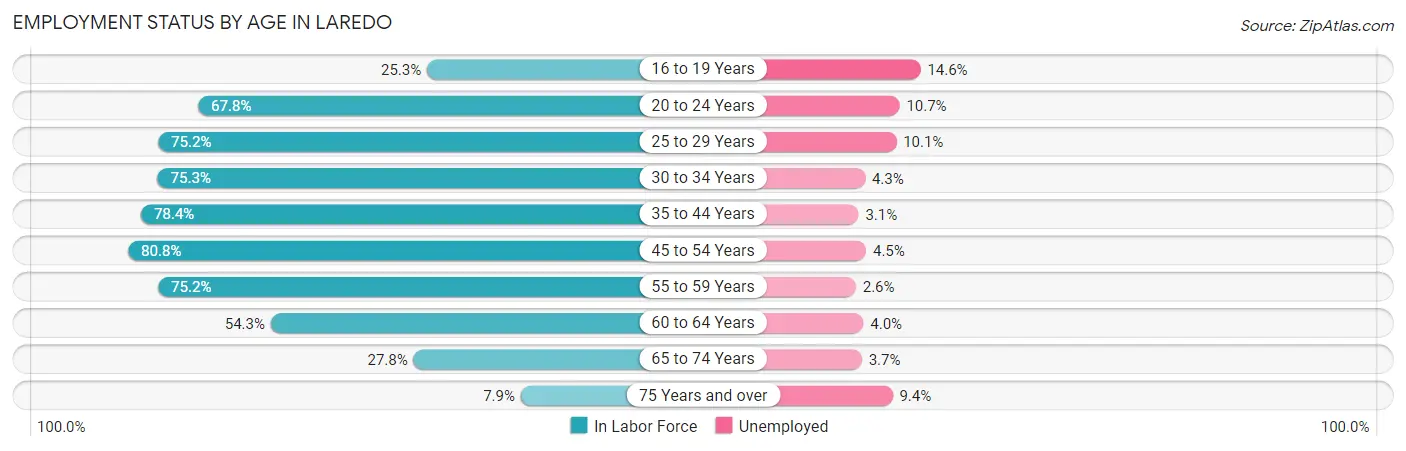
| Age Bracket | In Labor Force | Unemployed |
| 16 to 19 Years | 4,611 (25.3%) | 673 (14.6%) |
| 20 to 24 Years | 14,268 (67.8%) | 1,527 (10.7%) |
| 25 to 29 Years | 13,940 (75.2%) | 1,408 (10.1%) |
| 30 to 34 Years | 12,444 (75.3%) | 535 (4.3%) |
| 35 to 44 Years | 25,210 (78.4%) | 782 (3.1%) |
| 45 to 54 Years | 24,042 (80.8%) | 1,082 (4.5%) |
| 55 to 59 Years | 9,354 (75.2%) | 243 (2.6%) |
| 60 to 64 Years | 5,362 (54.3%) | 214 (4.0%) |
| 65 to 74 Years | 3,947 (27.8%) | 146 (3.7%) |
| 75 Years and over | 809 (7.9%) | 76 (9.4%) |
| Total | 114,004 (62.3%) | 6,726 (5.9%) |
Employment Status by Educational Attainment in Laredo
According to labor force statistics for Laredo, 75.8% of individuals (90,420) out of the total population between 25 and 64 years of age (119,287) are in the labor force, with 4.7% or 4,250 of them being unemployed. The group with the highest labor force participation rate are those with the educational attainment of bachelor's degree or higher, with 84.8% or 22,775 individuals in the labor force. Within the labor force, individuals with high school diploma education have the highest percentage of unemployment, with 6.7% or 1,254 of them being unemployed.
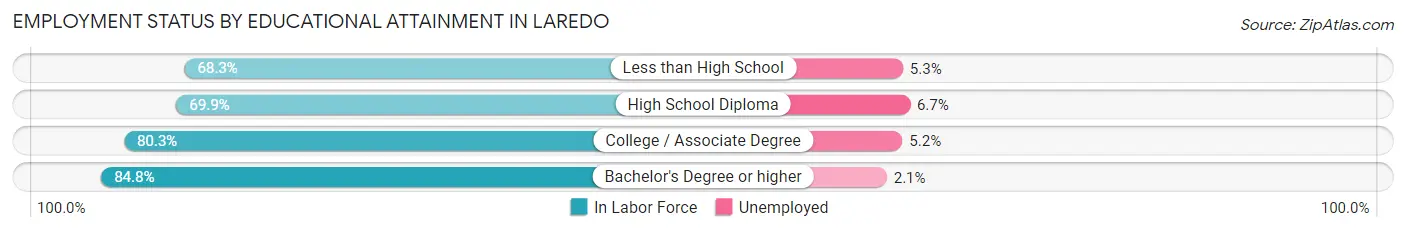
| Educational Attainment | In Labor Force | Unemployed |
| Less than High School | 21,865 (68.3%) | 1,697 (5.3%) |
| High School Diploma | 18,721 (69.9%) | 1,794 (6.7%) |
| College / Associate Degree | 27,008 (80.3%) | 1,749 (5.2%) |
| Bachelor's Degree or higher | 22,775 (84.8%) | 564 (2.1%) |
| Total | 90,420 (75.8%) | 5,606 (4.7%) |
Employment Occupations by Sex in Laredo
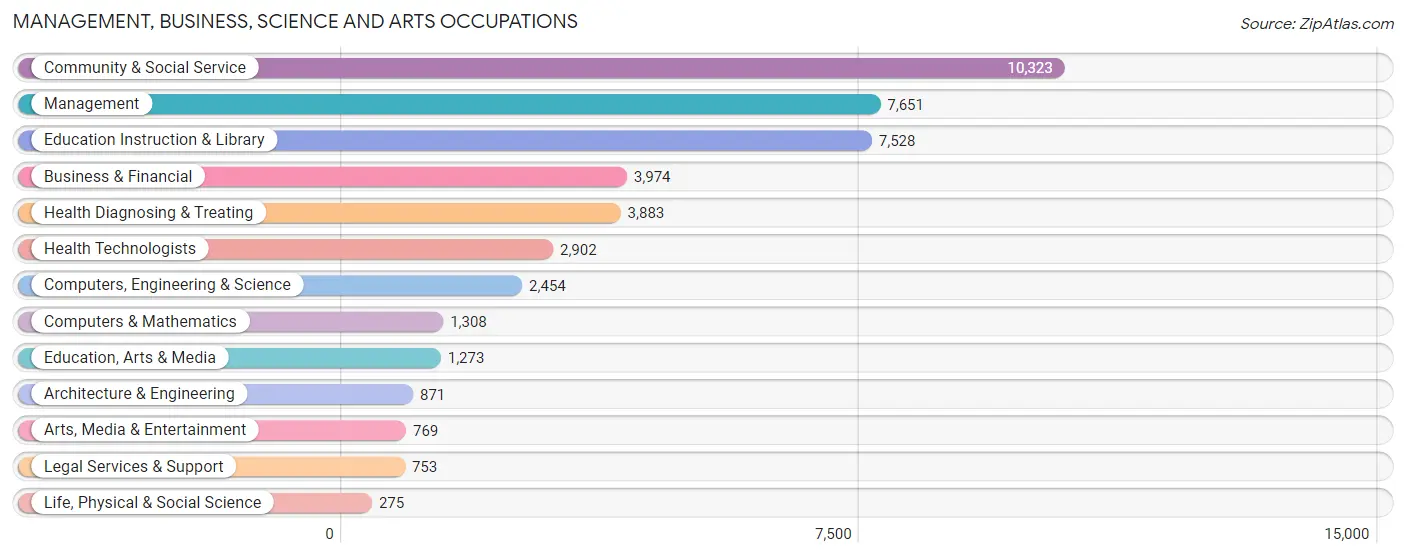
Management, Business, Science and Arts Occupations
The most common Management, Business, Science and Arts occupations in Laredo are Community & Social Service (10,323 | 9.6%), Management (7,651 | 7.1%), Education Instruction & Library (7,528 | 7.0%), Business & Financial (3,974 | 3.7%), and Health Diagnosing & Treating (3,883 | 3.6%).
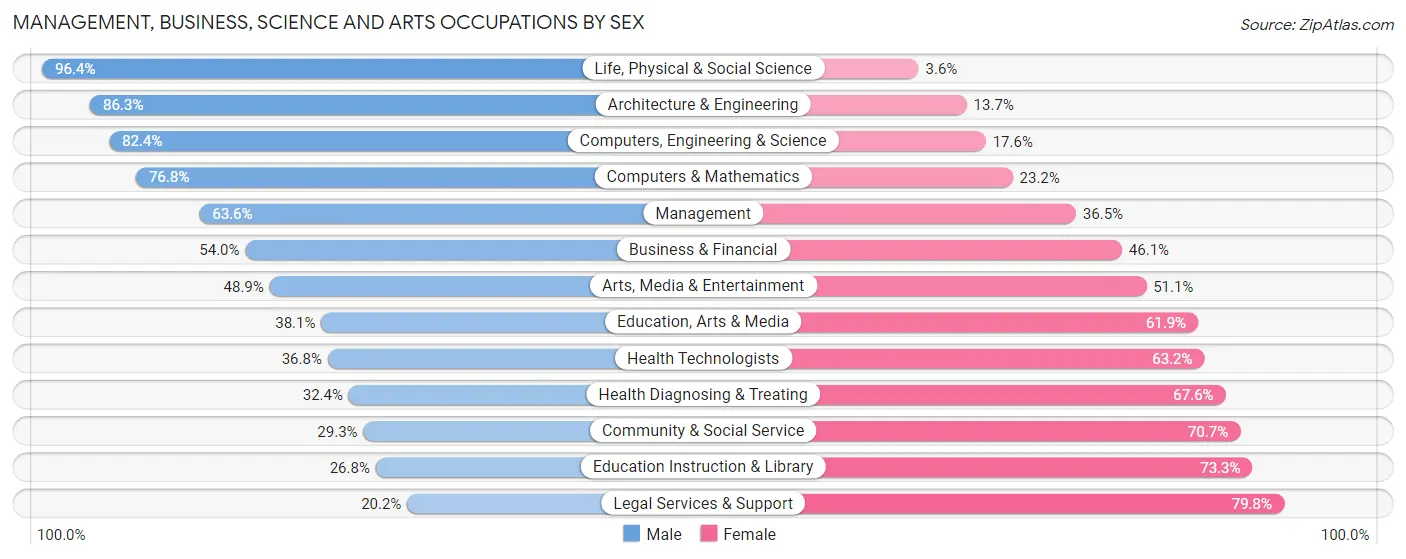
Management, Business, Science and Arts Occupations by Sex
Within the Management, Business, Science and Arts occupations in Laredo, the most male-oriented occupations are Life, Physical & Social Science (96.4%), Architecture & Engineering (86.3%), and Computers, Engineering & Science (82.4%), while the most female-oriented occupations are Legal Services & Support (79.8%), Education Instruction & Library (73.3%), and Community & Social Service (70.7%).
| Occupation | Male | Female |
| Management | 4,862 (63.5%) | 2,789 (36.4%) |
| Business & Financial | 2,144 (53.9%) | 1,830 (46.1%) |
| Computers, Engineering & Science | 2,021 (82.4%) | 433 (17.6%) |
| Computers & Mathematics | 1,004 (76.8%) | 304 (23.2%) |
| Architecture & Engineering | 752 (86.3%) | 119 (13.7%) |
| Life, Physical & Social Science | 265 (96.4%) | 10 (3.6%) |
| Community & Social Service | 3,027 (29.3%) | 7,296 (70.7%) |
| Education, Arts & Media | 485 (38.1%) | 788 (61.9%) |
| Legal Services & Support | 152 (20.2%) | 601 (79.8%) |
| Education Instruction & Library | 2,014 (26.8%) | 5,514 (73.3%) |
| Arts, Media & Entertainment | 376 (48.9%) | 393 (51.1%) |
| Health Diagnosing & Treating | 1,257 (32.4%) | 2,626 (67.6%) |
| Health Technologists | 1,067 (36.8%) | 1,835 (63.2%) |
| Total (Category) | 13,311 (47.1%) | 14,974 (52.9%) |
| Total (Overall) | 60,430 (56.4%) | 46,769 (43.6%) |
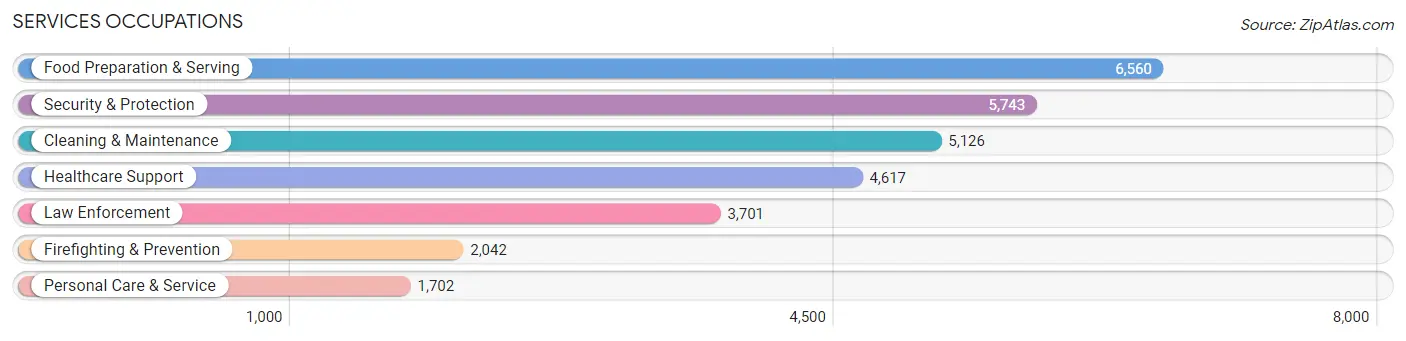
Services Occupations
The most common Services occupations in Laredo are Food Preparation & Serving (6,560 | 6.1%), Security & Protection (5,743 | 5.4%), Cleaning & Maintenance (5,126 | 4.8%), Healthcare Support (4,617 | 4.3%), and Law Enforcement (3,701 | 3.5%).
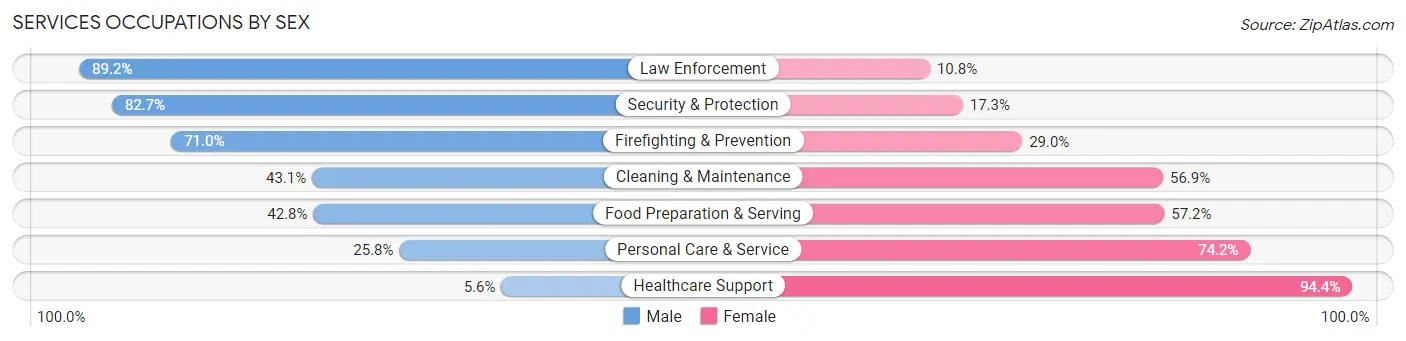
Services Occupations by Sex
Within the Services occupations in Laredo, the most male-oriented occupations are Law Enforcement (89.2%), Security & Protection (82.7%), and Firefighting & Prevention (71.0%), while the most female-oriented occupations are Healthcare Support (94.4%), Personal Care & Service (74.2%), and Food Preparation & Serving (57.2%).
| Occupation | Male | Female |
| Healthcare Support | 259 (5.6%) | 4,358 (94.4%) |
| Security & Protection | 4,751 (82.7%) | 992 (17.3%) |
| Firefighting & Prevention | 1,449 (71.0%) | 593 (29.0%) |
| Law Enforcement | 3,302 (89.2%) | 399 (10.8%) |
| Food Preparation & Serving | 2,809 (42.8%) | 3,751 (57.2%) |
| Cleaning & Maintenance | 2,208 (43.1%) | 2,918 (56.9%) |
| Personal Care & Service | 439 (25.8%) | 1,263 (74.2%) |
| Total (Category) | 10,466 (44.1%) | 13,282 (55.9%) |
| Total (Overall) | 60,430 (56.4%) | 46,769 (43.6%) |
Sales and Office Occupations
The most common Sales and Office occupations in Laredo are Office & Administration (13,804 | 12.9%), and Sales & Related (13,281 | 12.4%).

Sales and Office Occupations by Sex
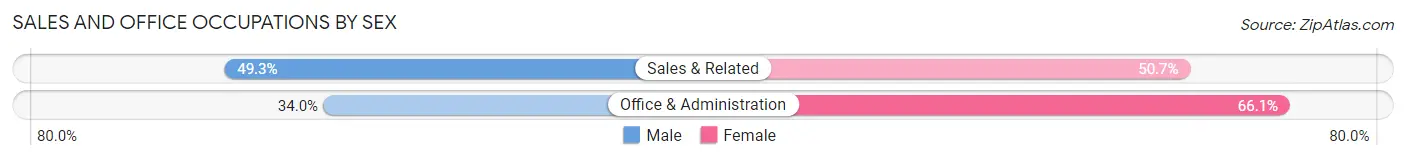
| Occupation | Male | Female |
| Sales & Related | 6,544 (49.3%) | 6,737 (50.7%) |
| Office & Administration | 4,687 (34.0%) | 9,117 (66.0%) |
| Total (Category) | 11,231 (41.5%) | 15,854 (58.5%) |
| Total (Overall) | 60,430 (56.4%) | 46,769 (43.6%) |
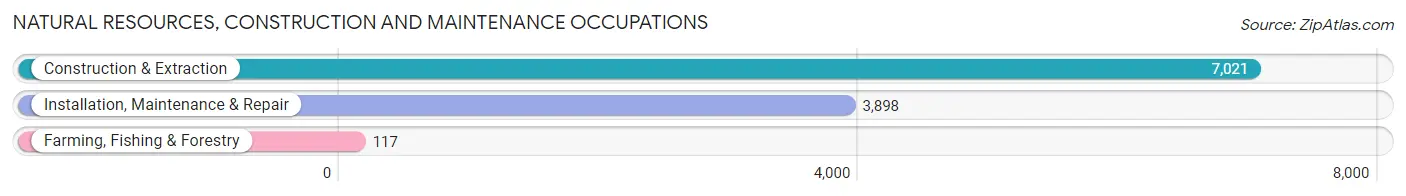
Natural Resources, Construction and Maintenance Occupations
The most common Natural Resources, Construction and Maintenance occupations in Laredo are Construction & Extraction (7,021 | 6.6%), Installation, Maintenance & Repair (3,898 | 3.6%), and Farming, Fishing & Forestry (117 | 0.1%).
Natural Resources, Construction and Maintenance Occupations by Sex
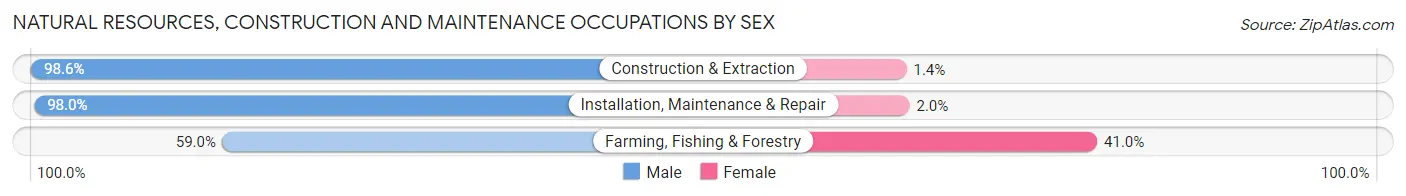
| Occupation | Male | Female |
| Farming, Fishing & Forestry | 69 (59.0%) | 48 (41.0%) |
| Construction & Extraction | 6,925 (98.6%) | 96 (1.4%) |
| Installation, Maintenance & Repair | 3,820 (98.0%) | 78 (2.0%) |
| Total (Category) | 10,814 (98.0%) | 222 (2.0%) |
| Total (Overall) | 60,430 (56.4%) | 46,769 (43.6%) |
Production, Transportation and Moving Occupations
The most common Production, Transportation and Moving occupations in Laredo are Transportation (8,373 | 7.8%), Material Moving (5,634 | 5.3%), and Production (3,038 | 2.8%).
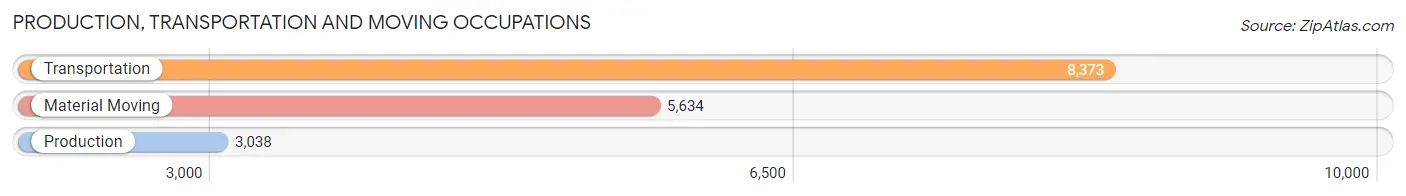
Production, Transportation and Moving Occupations by Sex
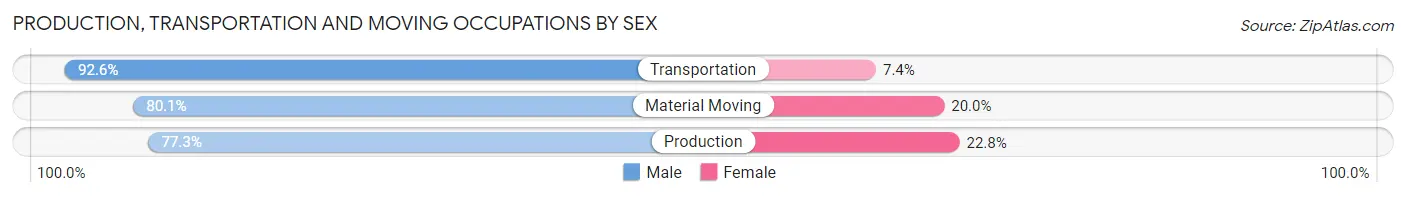
| Occupation | Male | Female |
| Production | 2,347 (77.2%) | 691 (22.8%) |
| Transportation | 7,751 (92.6%) | 622 (7.4%) |
| Material Moving | 4,510 (80.0%) | 1,124 (20.0%) |
| Total (Category) | 14,608 (85.7%) | 2,437 (14.3%) |
| Total (Overall) | 60,430 (56.4%) | 46,769 (43.6%) |
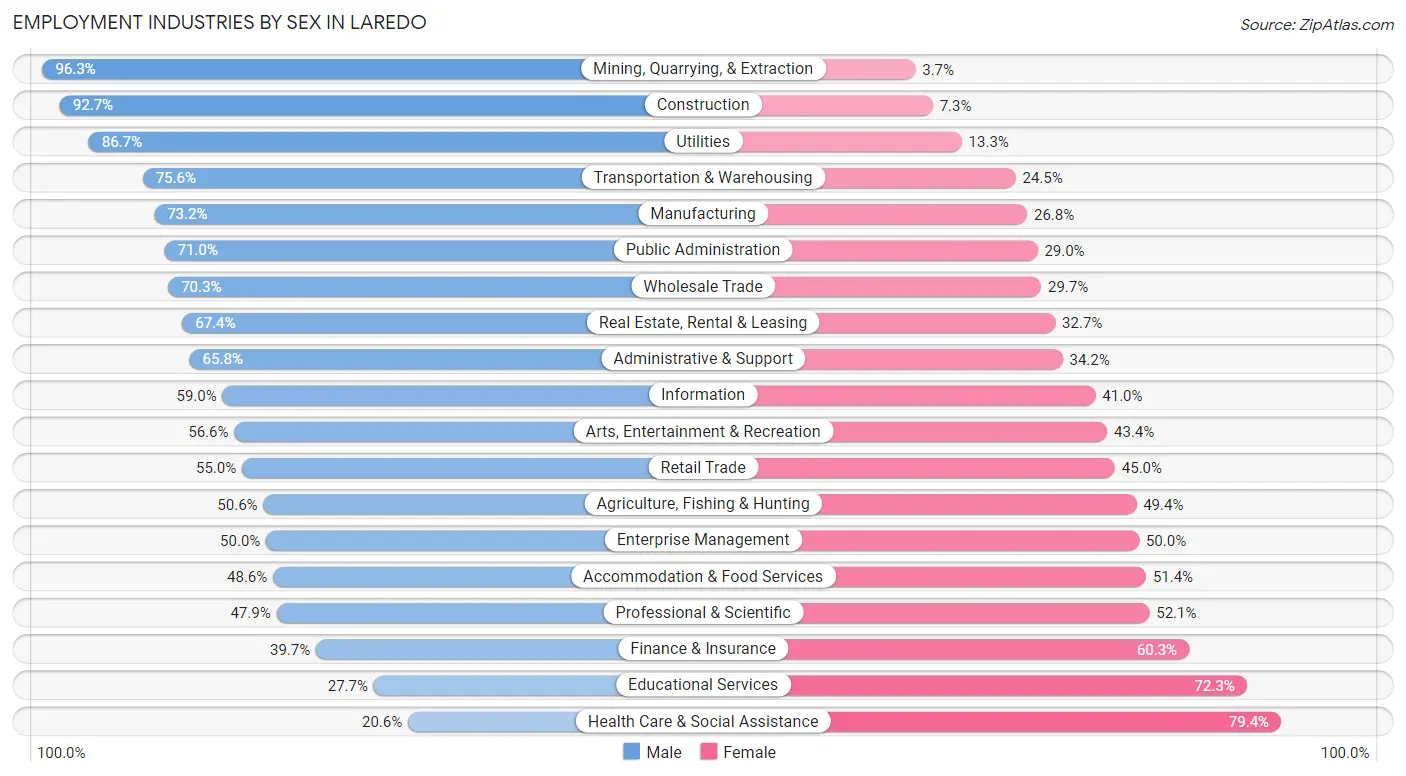
Employment Industries by Sex in Laredo
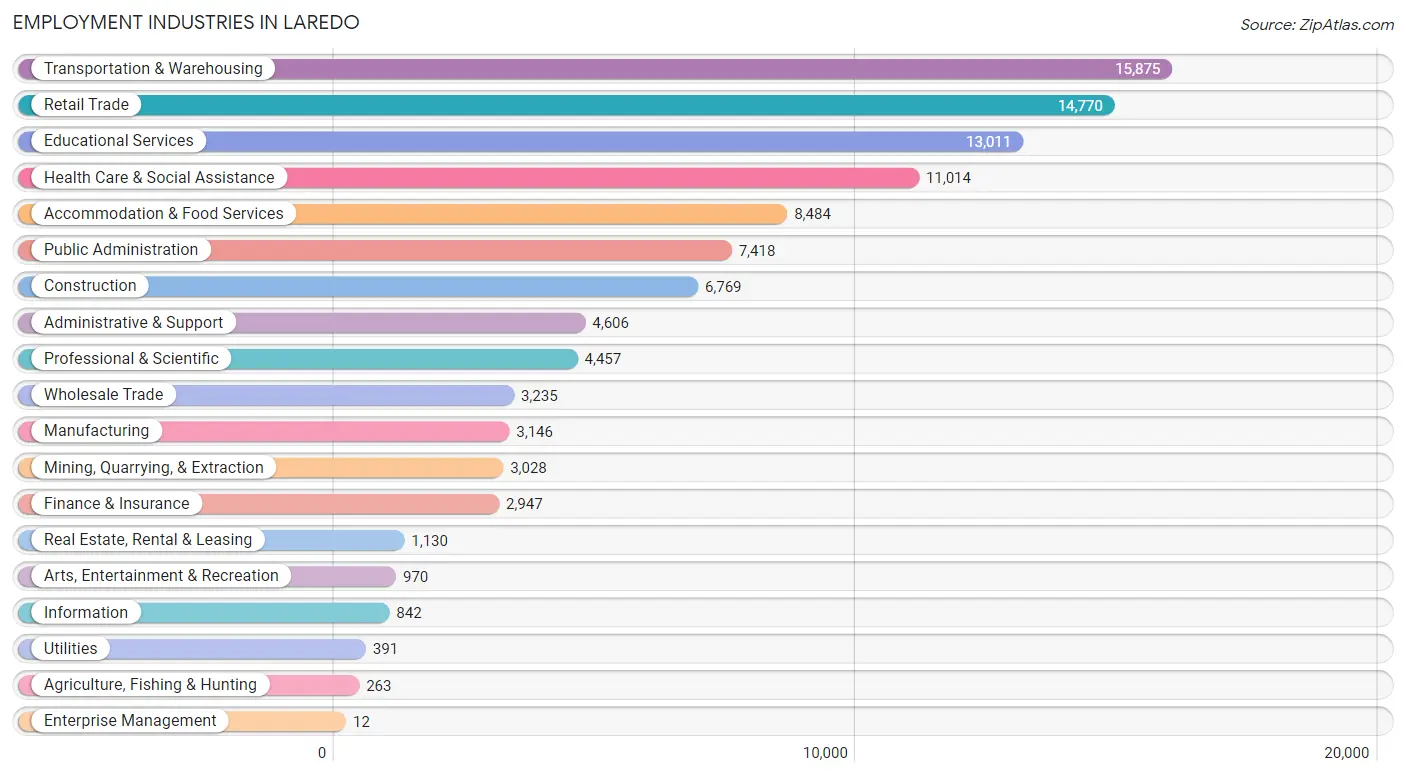
Employment Industries in Laredo
The major employment industries in Laredo include Transportation & Warehousing (15,875 | 14.8%), Retail Trade (14,770 | 13.8%), Educational Services (13,011 | 12.1%), Health Care & Social Assistance (11,014 | 10.3%), and Accommodation & Food Services (8,484 | 7.9%).
Employment Industries by Sex in Laredo
The Laredo industries that see more men than women are Mining, Quarrying, & Extraction (96.3%), Construction (92.7%), and Utilities (86.7%), whereas the industries that tend to have a higher number of women are Health Care & Social Assistance (79.4%), Educational Services (72.3%), and Finance & Insurance (60.3%).
| Industry | Male | Female |
| Agriculture, Fishing & Hunting | 133 (50.6%) | 130 (49.4%) |
| Mining, Quarrying, & Extraction | 2,916 (96.3%) | 112 (3.7%) |
| Construction | 6,274 (92.7%) | 495 (7.3%) |
| Manufacturing | 2,302 (73.2%) | 844 (26.8%) |
| Wholesale Trade | 2,273 (70.3%) | 962 (29.7%) |
| Retail Trade | 8,122 (55.0%) | 6,648 (45.0%) |
| Transportation & Warehousing | 11,993 (75.5%) | 3,882 (24.4%) |
| Utilities | 339 (86.7%) | 52 (13.3%) |
| Information | 497 (59.0%) | 345 (41.0%) |
| Finance & Insurance | 1,169 (39.7%) | 1,778 (60.3%) |
| Real Estate, Rental & Leasing | 761 (67.3%) | 369 (32.7%) |
| Professional & Scientific | 2,133 (47.9%) | 2,324 (52.1%) |
| Enterprise Management | 6 (50.0%) | 6 (50.0%) |
| Administrative & Support | 3,032 (65.8%) | 1,574 (34.2%) |
| Educational Services | 3,606 (27.7%) | 9,405 (72.3%) |
| Health Care & Social Assistance | 2,272 (20.6%) | 8,742 (79.4%) |
| Arts, Entertainment & Recreation | 549 (56.6%) | 421 (43.4%) |
| Accommodation & Food Services | 4,120 (48.6%) | 4,364 (51.4%) |
| Public Administration | 5,268 (71.0%) | 2,150 (29.0%) |
| Total | 60,430 (56.4%) | 46,769 (43.6%) |
Education in Laredo
School Enrollment in Laredo
The most common levels of schooling among the 81,249 students in Laredo are middle school (19,004 | 23.4%), high school (18,257 | 22.5%), and elementary school (18,191 | 22.4%).
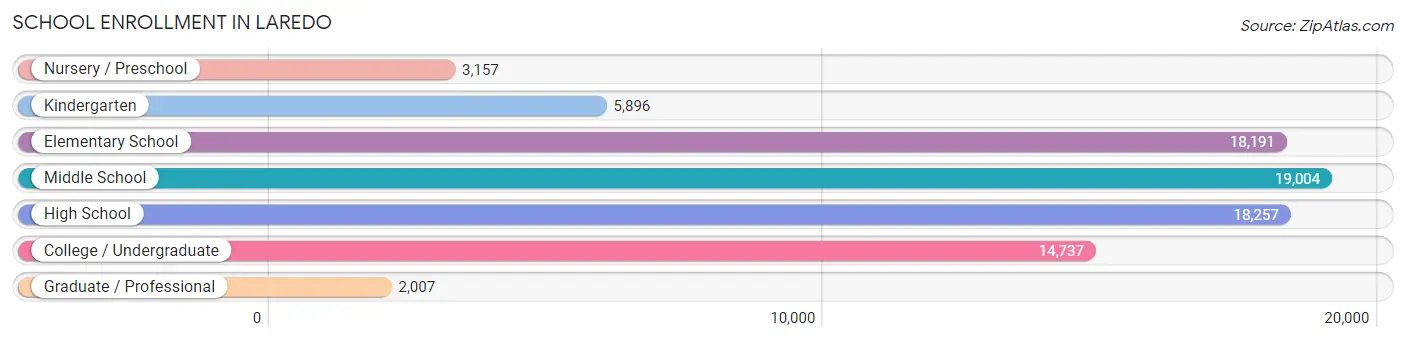
| School Level | # Students | % Students |
| Nursery / Preschool | 3,157 | 3.9% |
| Kindergarten | 5,896 | 7.3% |
| Elementary School | 18,191 | 22.4% |
| Middle School | 19,004 | 23.4% |
| High School | 18,257 | 22.5% |
| College / Undergraduate | 14,737 | 18.1% |
| Graduate / Professional | 2,007 | 2.5% |
| Total | 81,249 | 100.0% |
School Enrollment by Age by Funding Source in Laredo
Out of a total of 81,249 students who are enrolled in schools in Laredo, 6,012 (7.4%) attend a private institution, while the remaining 75,237 (92.6%) are enrolled in public schools. The age group of 35 years and over has the highest likelihood of being enrolled in private schools, with 659 (25.6% in the age bracket) enrolled. Conversely, the age group of 15 to 17 year olds has the lowest likelihood of being enrolled in a private school, with 13,168 (98.8% in the age bracket) attending a public institution.
| Age Bracket | Public School | Private School |
| 3 to 4 Year Olds | 2,458 (77.3%) | 721 (22.7%) |
| 5 to 9 Year Old | 20,101 (93.0%) | 1,505 (7.0%) |
| 10 to 14 Year Olds | 22,429 (95.3%) | 1,100 (4.7%) |
| 15 to 17 Year Olds | 13,168 (98.8%) | 157 (1.2%) |
| 18 to 19 Year Olds | 5,878 (90.4%) | 626 (9.6%) |
| 20 to 24 Year Olds | 6,885 (87.4%) | 996 (12.6%) |
| 25 to 34 Year Olds | 2,427 (91.6%) | 223 (8.4%) |
| 35 Years and over | 1,916 (74.4%) | 659 (25.6%) |
| Total | 75,237 (92.6%) | 6,012 (7.4%) |
Educational Attainment by Field of Study in Laredo
Business (8,211 | 25.9%), education (5,453 | 17.2%), arts & humanities (3,139 | 9.9%), science & technology (2,844 | 9.0%), and engineering (2,467 | 7.8%) are the most common fields of study among 31,715 individuals in Laredo who have obtained a bachelor's degree or higher.
| Field of Study | # Graduates | % Graduates |
| Computers & Mathematics | 940 | 3.0% |
| Bio, Nature & Agricultural | 1,096 | 3.5% |
| Physical & Health Sciences | 730 | 2.3% |
| Psychology | 1,733 | 5.5% |
| Social Sciences | 1,457 | 4.6% |
| Engineering | 2,467 | 7.8% |
| Multidisciplinary Studies | 503 | 1.6% |
| Science & Technology | 2,844 | 9.0% |
| Business | 8,211 | 25.9% |
| Education | 5,453 | 17.2% |
| Literature & Languages | 996 | 3.1% |
| Liberal Arts & History | 764 | 2.4% |
| Visual & Performing Arts | 717 | 2.3% |
| Communications | 665 | 2.1% |
| Arts & Humanities | 3,139 | 9.9% |
| Total | 31,715 | 100.0% |
Transportation & Commute in Laredo
Vehicle Availability by Sex in Laredo
The most prevalent vehicle ownership categories in Laredo are males with 2 vehicles (24,273, accounting for 40.6%) and females with 2 vehicles (16,944, making up 52.6%).
| Vehicles Available | Male | Female |
| No Vehicle | 1,071 (1.8%) | 1,054 (2.3%) |
| 1 Vehicle | 10,811 (18.1%) | 10,164 (22.0%) |
| 2 Vehicles | 24,273 (40.6%) | 16,944 (36.7%) |
| 3 Vehicles | 12,917 (21.6%) | 10,748 (23.3%) |
| 4 Vehicles | 7,841 (13.1%) | 4,928 (10.7%) |
| 5 or more Vehicles | 2,917 (4.9%) | 2,288 (5.0%) |
| Total | 59,830 (100.0%) | 46,126 (100.0%) |
Commute Time in Laredo
The most frequently occuring commute durations in Laredo are 15 to 19 minutes (23,509 commuters, 23.3%), 10 to 14 minutes (18,757 commuters, 18.6%), and 20 to 24 minutes (18,092 commuters, 17.9%).
| Commute Time | # Commuters | % Commuters |
| Less than 5 Minutes | 2,256 | 2.2% |
| 5 to 9 Minutes | 10,528 | 10.4% |
| 10 to 14 Minutes | 18,757 | 18.6% |
| 15 to 19 Minutes | 23,509 | 23.3% |
| 20 to 24 Minutes | 18,092 | 17.9% |
| 25 to 29 Minutes | 5,187 | 5.1% |
| 30 to 34 Minutes | 12,373 | 12.2% |
| 35 to 39 Minutes | 926 | 0.9% |
| 40 to 44 Minutes | 1,467 | 1.5% |
| 45 to 59 Minutes | 3,507 | 3.5% |
| 60 to 89 Minutes | 2,019 | 2.0% |
| 90 or more Minutes | 2,461 | 2.4% |
Commute Time by Sex in Laredo
The most common commute times in Laredo are 15 to 19 minutes (12,563 commuters, 21.9%) for males and 15 to 19 minutes (10,946 commuters, 25.1%) for females.
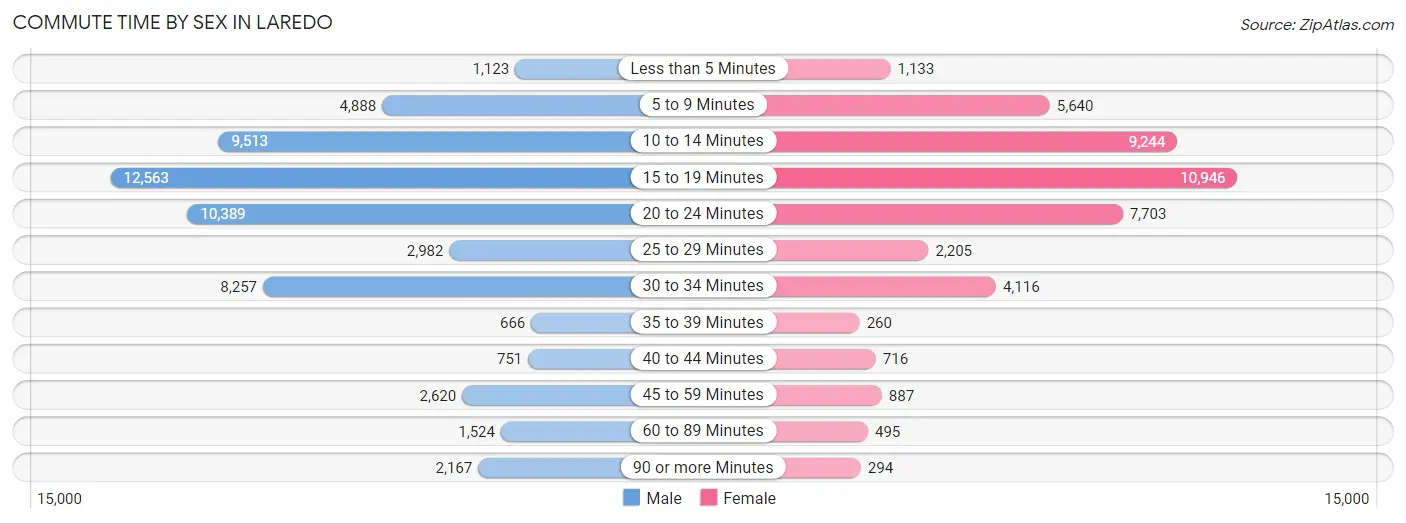
| Commute Time | Male | Female |
| Less than 5 Minutes | 1,123 (1.9%) | 1,133 (2.6%) |
| 5 to 9 Minutes | 4,888 (8.5%) | 5,640 (12.9%) |
| 10 to 14 Minutes | 9,513 (16.6%) | 9,244 (21.2%) |
| 15 to 19 Minutes | 12,563 (21.9%) | 10,946 (25.1%) |
| 20 to 24 Minutes | 10,389 (18.1%) | 7,703 (17.6%) |
| 25 to 29 Minutes | 2,982 (5.2%) | 2,205 (5.1%) |
| 30 to 34 Minutes | 8,257 (14.4%) | 4,116 (9.4%) |
| 35 to 39 Minutes | 666 (1.2%) | 260 (0.6%) |
| 40 to 44 Minutes | 751 (1.3%) | 716 (1.6%) |
| 45 to 59 Minutes | 2,620 (4.6%) | 887 (2.0%) |
| 60 to 89 Minutes | 1,524 (2.6%) | 495 (1.1%) |
| 90 or more Minutes | 2,167 (3.8%) | 294 (0.7%) |
Time of Departure to Work by Sex in Laredo
The most frequent times of departure to work in Laredo are 8:00 AM to 8:29 AM (9,057, 15.8%) for males and 7:00 AM to 7:29 AM (7,797, 17.9%) for females.
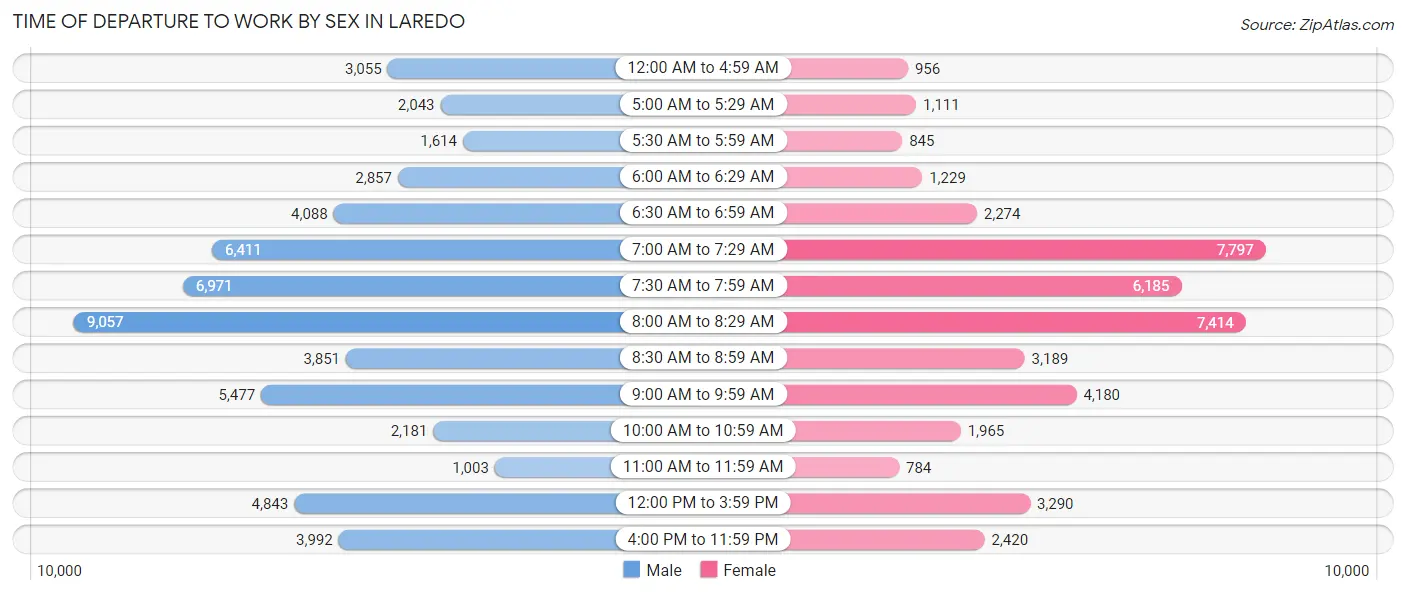
| Time of Departure | Male | Female |
| 12:00 AM to 4:59 AM | 3,055 (5.3%) | 956 (2.2%) |
| 5:00 AM to 5:29 AM | 2,043 (3.6%) | 1,111 (2.5%) |
| 5:30 AM to 5:59 AM | 1,614 (2.8%) | 845 (1.9%) |
| 6:00 AM to 6:29 AM | 2,857 (5.0%) | 1,229 (2.8%) |
| 6:30 AM to 6:59 AM | 4,088 (7.1%) | 2,274 (5.2%) |
| 7:00 AM to 7:29 AM | 6,411 (11.2%) | 7,797 (17.9%) |
| 7:30 AM to 7:59 AM | 6,971 (12.1%) | 6,185 (14.2%) |
| 8:00 AM to 8:29 AM | 9,057 (15.8%) | 7,414 (17.0%) |
| 8:30 AM to 8:59 AM | 3,851 (6.7%) | 3,189 (7.3%) |
| 9:00 AM to 9:59 AM | 5,477 (9.5%) | 4,180 (9.6%) |
| 10:00 AM to 10:59 AM | 2,181 (3.8%) | 1,965 (4.5%) |
| 11:00 AM to 11:59 AM | 1,003 (1.8%) | 784 (1.8%) |
| 12:00 PM to 3:59 PM | 4,843 (8.4%) | 3,290 (7.5%) |
| 4:00 PM to 11:59 PM | 3,992 (7.0%) | 2,420 (5.6%) |
| Total | 57,443 (100.0%) | 43,639 (100.0%) |
Housing Occupancy in Laredo
Occupancy by Ownership in Laredo
Of the total 74,380 dwellings in Laredo, owner-occupied units account for 46,669 (62.7%), while renter-occupied units make up 27,711 (37.3%).
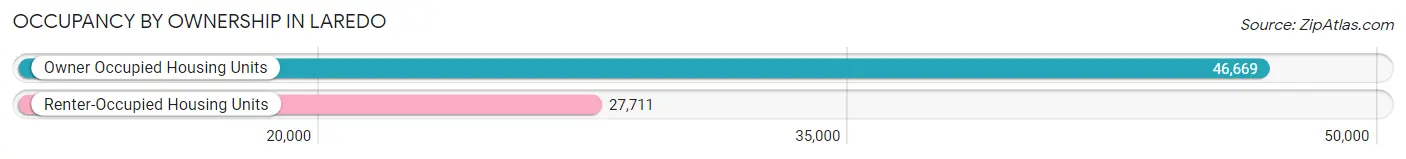
| Occupancy | # Housing Units | % Housing Units |
| Owner Occupied Housing Units | 46,669 | 62.7% |
| Renter-Occupied Housing Units | 27,711 | 37.3% |
| Total Occupied Housing Units | 74,380 | 100.0% |
Occupancy by Household Size in Laredo
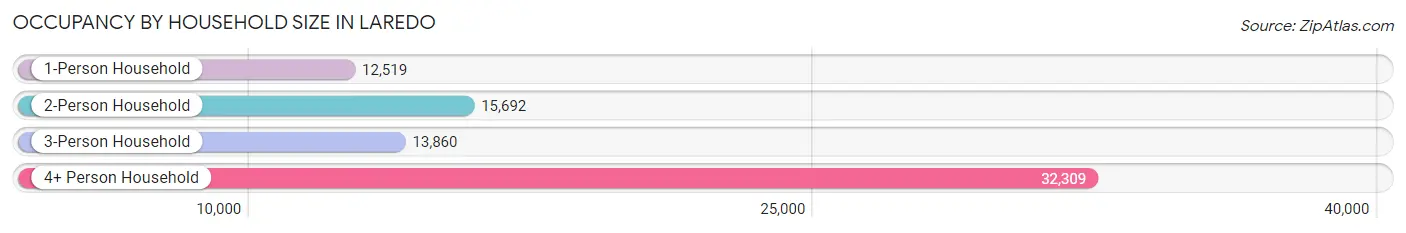
| Household Size | # Housing Units | % Housing Units |
| 1-Person Household | 12,519 | 16.8% |
| 2-Person Household | 15,692 | 21.1% |
| 3-Person Household | 13,860 | 18.6% |
| 4+ Person Household | 32,309 | 43.4% |
| Total Housing Units | 74,380 | 100.0% |
Occupancy by Ownership by Household Size in Laredo
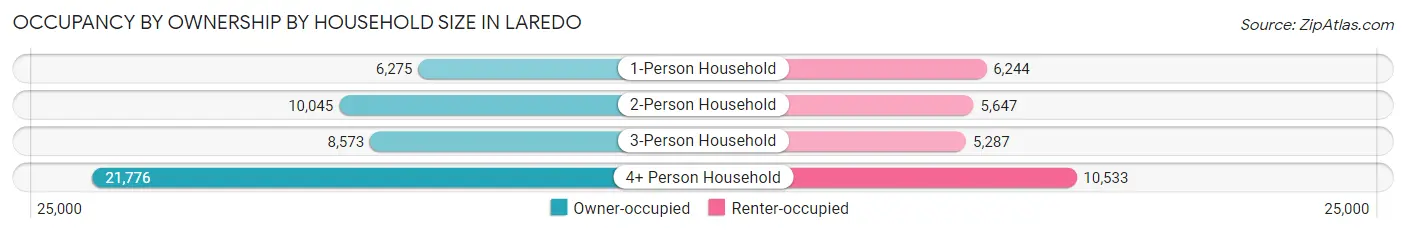
| Household Size | Owner-occupied | Renter-occupied |
| 1-Person Household | 6,275 (50.1%) | 6,244 (49.9%) |
| 2-Person Household | 10,045 (64.0%) | 5,647 (36.0%) |
| 3-Person Household | 8,573 (61.9%) | 5,287 (38.2%) |
| 4+ Person Household | 21,776 (67.4%) | 10,533 (32.6%) |
| Total Housing Units | 46,669 (62.7%) | 27,711 (37.3%) |
Occupancy by Educational Attainment in Laredo
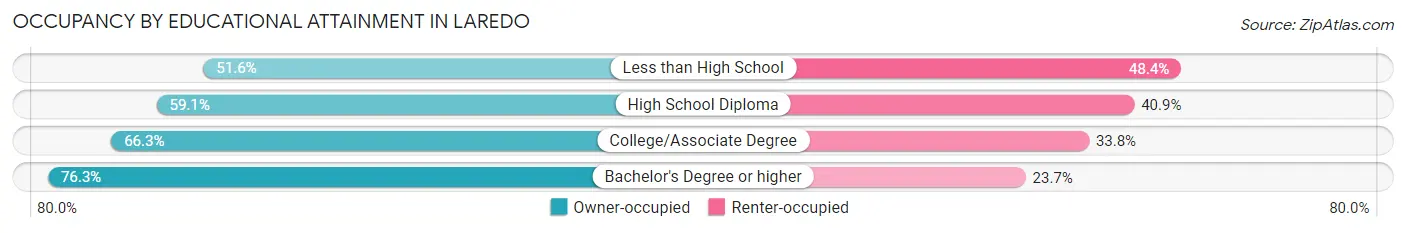
| Household Size | Owner-occupied | Renter-occupied |
| Less than High School | 11,243 (51.6%) | 10,534 (48.4%) |
| High School Diploma | 8,986 (59.1%) | 6,227 (40.9%) |
| College/Associate Degree | 13,759 (66.2%) | 7,009 (33.8%) |
| Bachelor's Degree or higher | 12,681 (76.3%) | 3,941 (23.7%) |
Occupancy by Age of Householder in Laredo
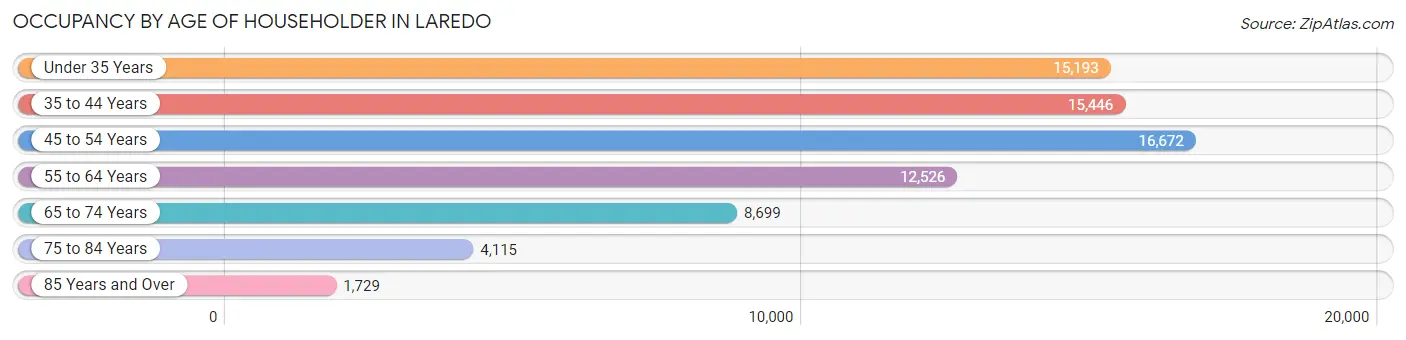
| Age Bracket | # Households | % Households |
| Under 35 Years | 15,193 | 20.4% |
| 35 to 44 Years | 15,446 | 20.8% |
| 45 to 54 Years | 16,672 | 22.4% |
| 55 to 64 Years | 12,526 | 16.8% |
| 65 to 74 Years | 8,699 | 11.7% |
| 75 to 84 Years | 4,115 | 5.5% |
| 85 Years and Over | 1,729 | 2.3% |
| Total | 74,380 | 100.0% |
Housing Finances in Laredo
Median Income by Occupancy in Laredo
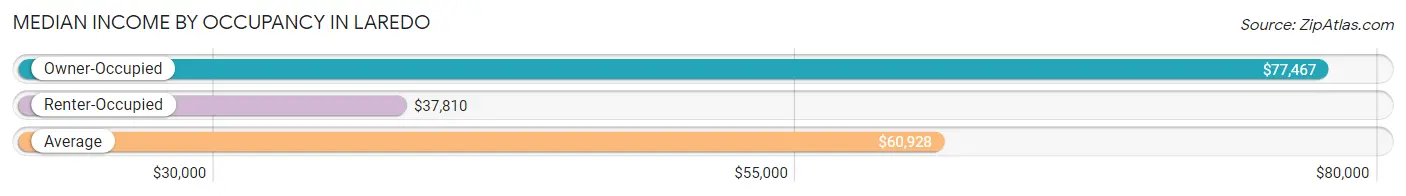
| Occupancy Type | # Households | Median Income |
| Owner-Occupied | 46,669 (62.7%) | $77,467 |
| Renter-Occupied | 27,711 (37.3%) | $37,810 |
| Average | 74,380 (100.0%) | $60,928 |
Occupancy by Householder Income Bracket in Laredo
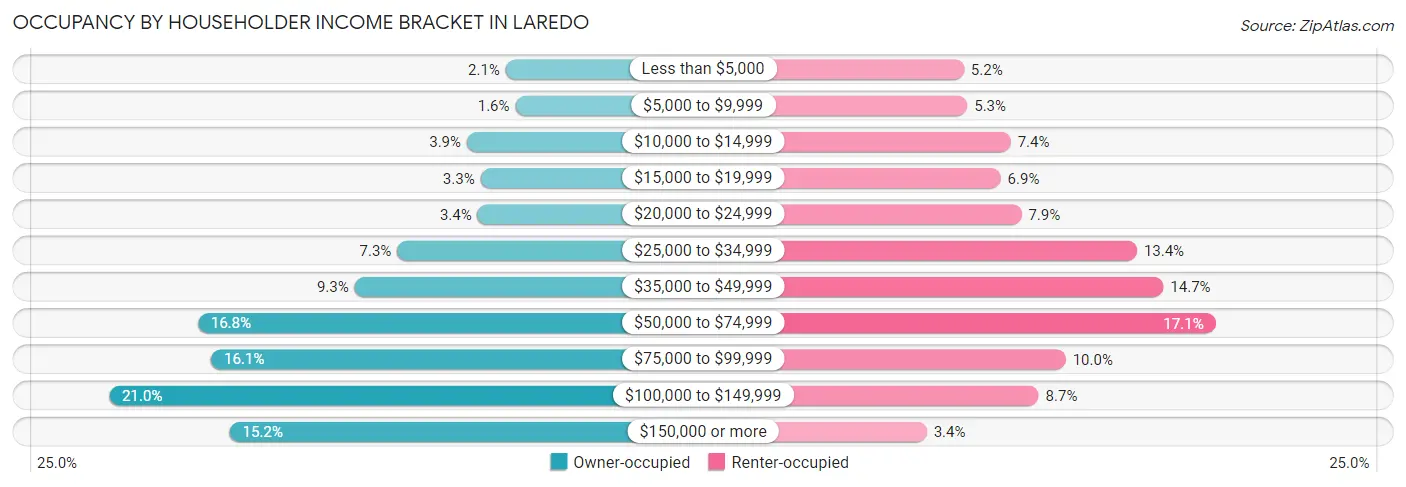
| Income Bracket | Owner-occupied | Renter-occupied |
| Less than $5,000 | 975 (2.1%) | 1,430 (5.2%) |
| $5,000 to $9,999 | 759 (1.6%) | 1,473 (5.3%) |
| $10,000 to $14,999 | 1,837 (3.9%) | 2,049 (7.4%) |
| $15,000 to $19,999 | 1,535 (3.3%) | 1,916 (6.9%) |
| $20,000 to $24,999 | 1,600 (3.4%) | 2,189 (7.9%) |
| $25,000 to $34,999 | 3,387 (7.3%) | 3,712 (13.4%) |
| $35,000 to $49,999 | 4,334 (9.3%) | 4,062 (14.7%) |
| $50,000 to $74,999 | 7,815 (16.8%) | 4,750 (17.1%) |
| $75,000 to $99,999 | 7,522 (16.1%) | 2,774 (10.0%) |
| $100,000 to $149,999 | 9,792 (21.0%) | 2,416 (8.7%) |
| $150,000 or more | 7,113 (15.2%) | 940 (3.4%) |
| Total | 46,669 (100.0%) | 27,711 (100.0%) |
Monthly Housing Cost Tiers in Laredo
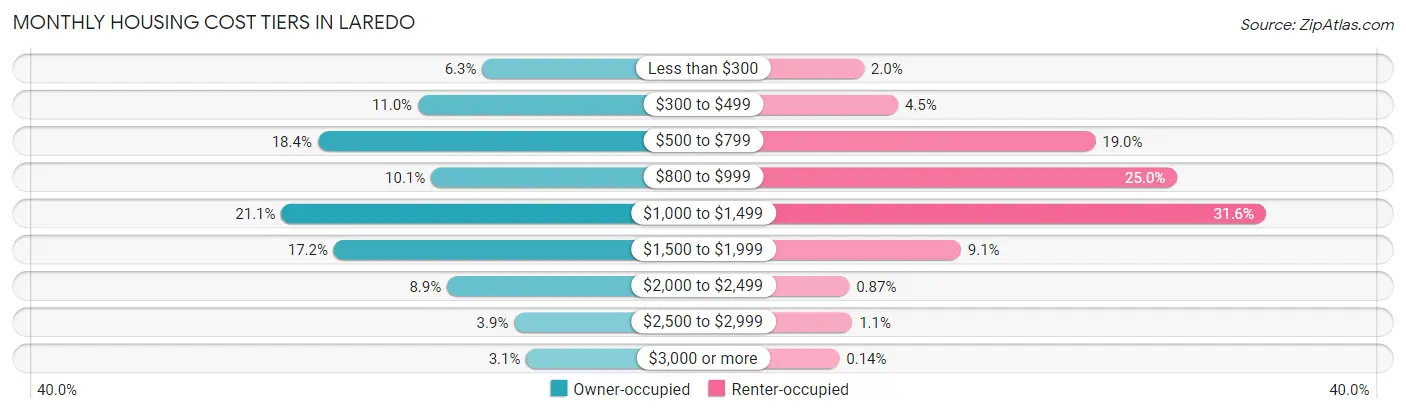
| Monthly Cost | Owner-occupied | Renter-occupied |
| Less than $300 | 2,935 (6.3%) | 540 (1.9%) |
| $300 to $499 | 5,147 (11.0%) | 1,236 (4.5%) |
| $500 to $799 | 8,594 (18.4%) | 5,261 (19.0%) |
| $800 to $999 | 4,696 (10.1%) | 6,934 (25.0%) |
| $1,000 to $1,499 | 9,843 (21.1%) | 8,744 (31.6%) |
| $1,500 to $1,999 | 8,042 (17.2%) | 2,520 (9.1%) |
| $2,000 to $2,499 | 4,149 (8.9%) | 240 (0.9%) |
| $2,500 to $2,999 | 1,840 (3.9%) | 302 (1.1%) |
| $3,000 or more | 1,423 (3.0%) | 38 (0.1%) |
| Total | 46,669 (100.0%) | 27,711 (100.0%) |
Physical Housing Characteristics in Laredo
Housing Structures in Laredo
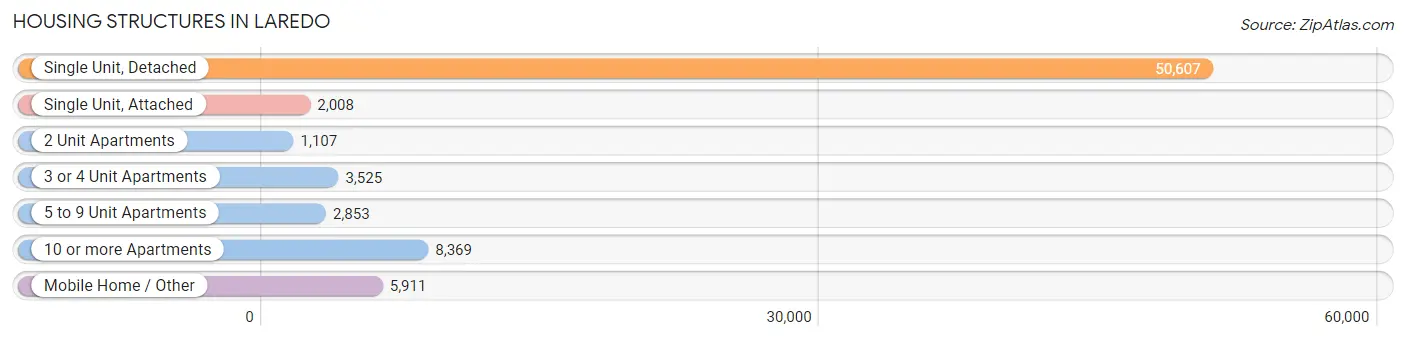
| Structure Type | # Housing Units | % Housing Units |
| Single Unit, Detached | 50,607 | 68.0% |
| Single Unit, Attached | 2,008 | 2.7% |
| 2 Unit Apartments | 1,107 | 1.5% |
| 3 or 4 Unit Apartments | 3,525 | 4.7% |
| 5 to 9 Unit Apartments | 2,853 | 3.8% |
| 10 or more Apartments | 8,369 | 11.3% |
| Mobile Home / Other | 5,911 | 8.0% |
| Total | 74,380 | 100.0% |
Housing Structures by Occupancy in Laredo
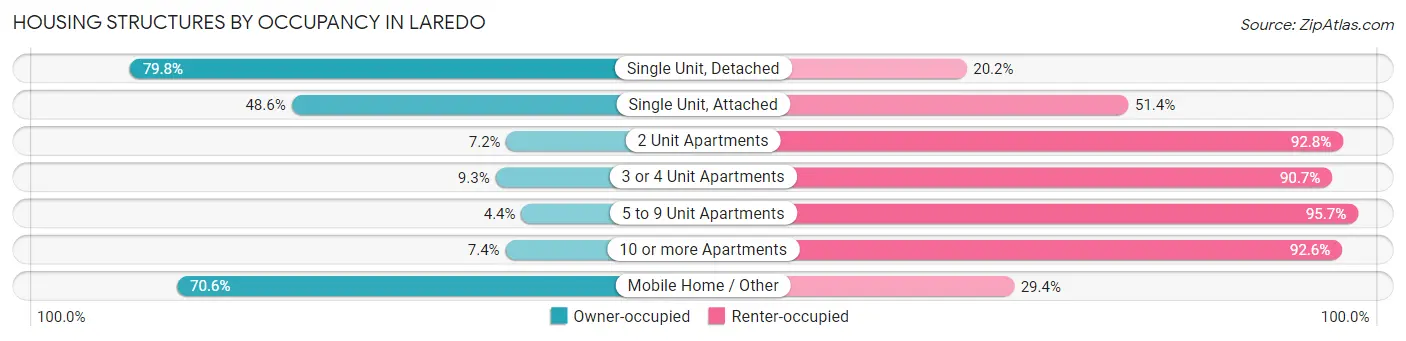
| Structure Type | Owner-occupied | Renter-occupied |
| Single Unit, Detached | 40,364 (79.8%) | 10,243 (20.2%) |
| Single Unit, Attached | 976 (48.6%) | 1,032 (51.4%) |
| 2 Unit Apartments | 80 (7.2%) | 1,027 (92.8%) |
| 3 or 4 Unit Apartments | 329 (9.3%) | 3,196 (90.7%) |
| 5 to 9 Unit Apartments | 124 (4.3%) | 2,729 (95.7%) |
| 10 or more Apartments | 621 (7.4%) | 7,748 (92.6%) |
| Mobile Home / Other | 4,175 (70.6%) | 1,736 (29.4%) |
| Total | 46,669 (62.7%) | 27,711 (37.3%) |
Housing Structures by Number of Rooms in Laredo
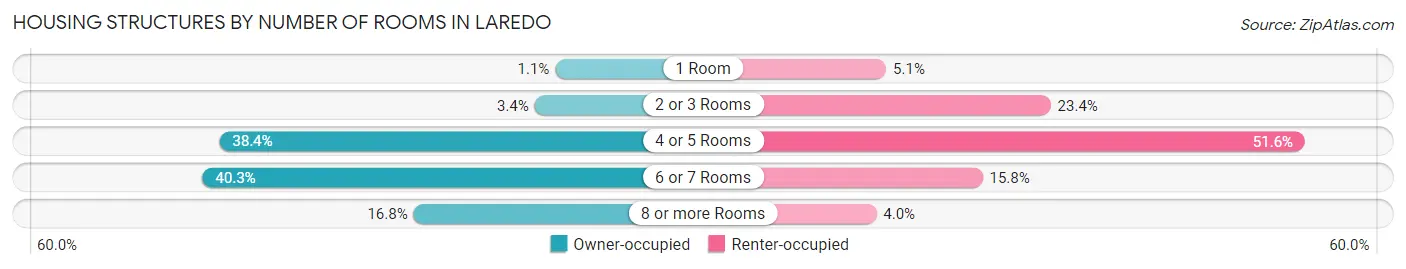
| Number of Rooms | Owner-occupied | Renter-occupied |
| 1 Room | 519 (1.1%) | 1,422 (5.1%) |
| 2 or 3 Rooms | 1,589 (3.4%) | 6,482 (23.4%) |
| 4 or 5 Rooms | 17,912 (38.4%) | 14,299 (51.6%) |
| 6 or 7 Rooms | 18,790 (40.3%) | 4,388 (15.8%) |
| 8 or more Rooms | 7,859 (16.8%) | 1,120 (4.0%) |
| Total | 46,669 (100.0%) | 27,711 (100.0%) |
Housing Structure by Heating Type in Laredo
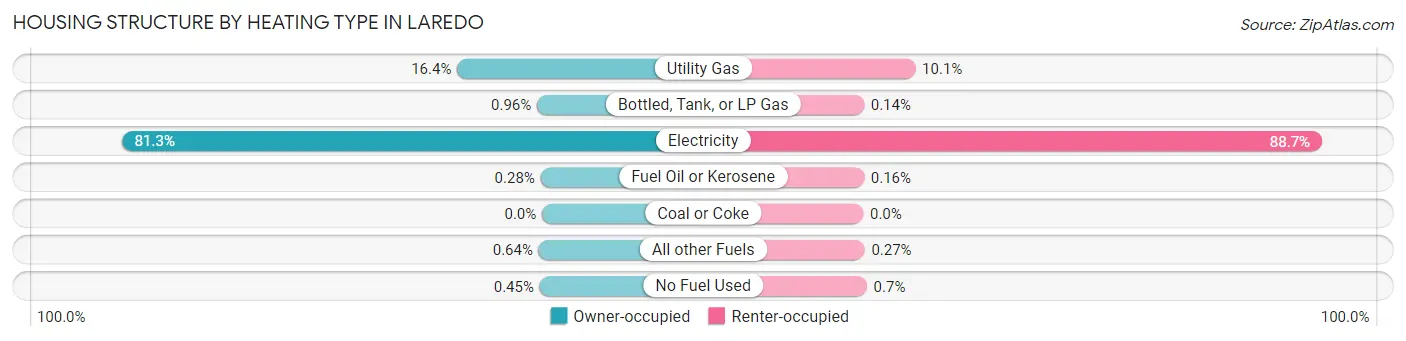
| Heating Type | Owner-occupied | Renter-occupied |
| Utility Gas | 7,656 (16.4%) | 2,791 (10.1%) |
| Bottled, Tank, or LP Gas | 446 (1.0%) | 39 (0.1%) |
| Electricity | 37,926 (81.3%) | 24,569 (88.7%) |
| Fuel Oil or Kerosene | 131 (0.3%) | 43 (0.2%) |
| Coal or Coke | 0 (0.0%) | 0 (0.0%) |
| All other Fuels | 298 (0.6%) | 76 (0.3%) |
| No Fuel Used | 212 (0.4%) | 193 (0.7%) |
| Total | 46,669 (100.0%) | 27,711 (100.0%) |
Household Vehicle Usage in Laredo
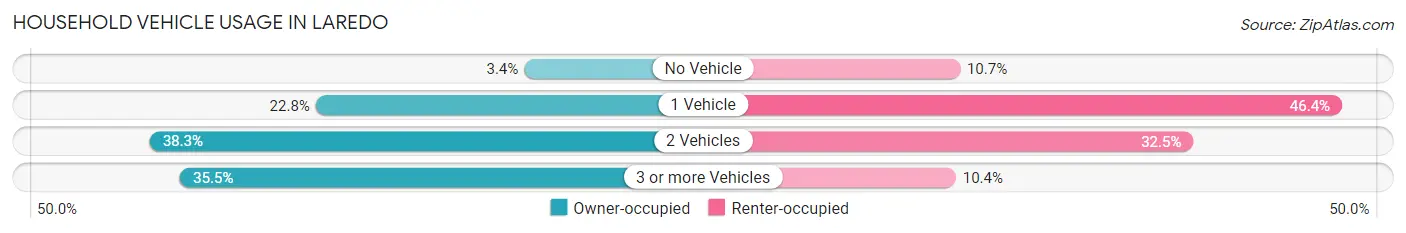
| Vehicles per Household | Owner-occupied | Renter-occupied |
| No Vehicle | 1,575 (3.4%) | 2,977 (10.7%) |
| 1 Vehicle | 10,653 (22.8%) | 12,856 (46.4%) |
| 2 Vehicles | 17,884 (38.3%) | 9,009 (32.5%) |
| 3 or more Vehicles | 16,557 (35.5%) | 2,869 (10.3%) |
| Total | 46,669 (100.0%) | 27,711 (100.0%) |
Real Estate & Mortgages in Laredo
Real Estate and Mortgage Overview in Laredo
| Characteristic | Without Mortgage | With Mortgage |
| Housing Units | 20,778 | 25,891 |
| Median Property Value | $137,000 | $184,200 |
| Median Household Income | $63,734 | $4,623 |
| Monthly Housing Costs | $578 | $1,384 |
| Real Estate Taxes | $2,682 | $619 |
Property Value by Mortgage Status in Laredo
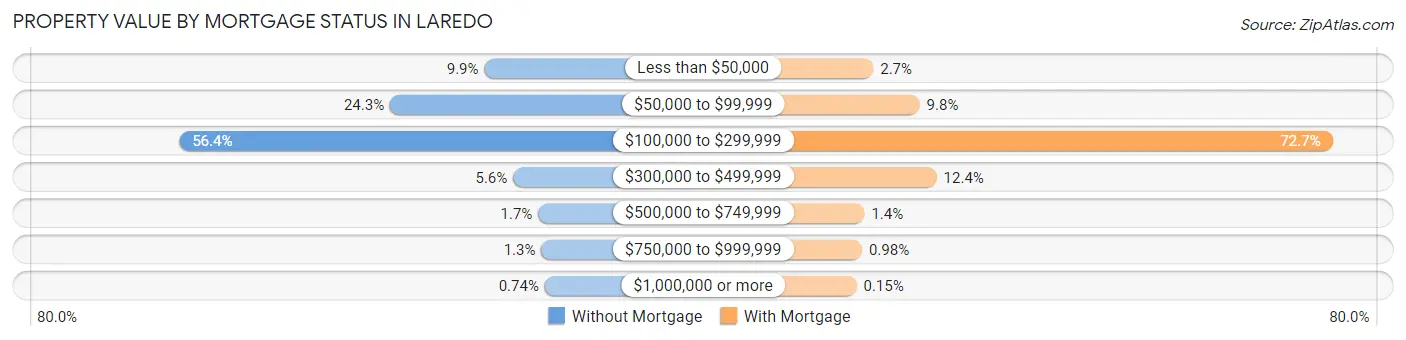
| Property Value | Without Mortgage | With Mortgage |
| Less than $50,000 | 2,066 (9.9%) | 700 (2.7%) |
| $50,000 to $99,999 | 5,054 (24.3%) | 2,529 (9.8%) |
| $100,000 to $299,999 | 11,725 (56.4%) | 18,816 (72.7%) |
| $300,000 to $499,999 | 1,156 (5.6%) | 3,201 (12.4%) |
| $500,000 to $749,999 | 362 (1.7%) | 353 (1.4%) |
| $750,000 to $999,999 | 262 (1.3%) | 253 (1.0%) |
| $1,000,000 or more | 153 (0.7%) | 39 (0.2%) |
| Total | 20,778 (100.0%) | 25,891 (100.0%) |
Household Income by Mortgage Status in Laredo
| Household Income | Without Mortgage | With Mortgage |
| Less than $10,000 | 1,151 (5.5%) | 157 (0.6%) |
| $10,000 to $24,999 | 3,324 (16.0%) | 583 (2.2%) |
| $25,000 to $34,999 | 1,944 (9.4%) | 1,648 (6.4%) |
| $35,000 to $49,999 | 1,984 (9.6%) | 1,443 (5.6%) |
| $50,000 to $74,999 | 3,293 (15.9%) | 2,350 (9.1%) |
| $75,000 to $99,999 | 3,214 (15.5%) | 4,522 (17.5%) |
| $100,000 to $149,999 | 3,378 (16.3%) | 4,308 (16.6%) |
| $150,000 or more | 2,490 (12.0%) | 6,414 (24.8%) |
| Total | 20,778 (100.0%) | 25,891 (100.0%) |
Property Value to Household Income Ratio in Laredo
| Value-to-Income Ratio | Without Mortgage | With Mortgage |
| Less than 2.0x | 9,597 (46.2%) | 88,737 (342.7%) |
| 2.0x to 2.9x | 3,768 (18.1%) | 11,007 (42.5%) |
| 3.0x to 3.9x | 1,773 (8.5%) | 6,896 (26.6%) |
| 4.0x or more | 5,371 (25.9%) | 3,278 (12.7%) |
| Total | 20,778 (100.0%) | 25,891 (100.0%) |
Real Estate Taxes by Mortgage Status in Laredo
| Property Taxes | Without Mortgage | With Mortgage |
| Less than $800 | 2,766 (13.3%) | 167 (0.6%) |
| $800 to $1,499 | 3,001 (14.4%) | 2,171 (8.4%) |
| $800 to $1,499 | 13,029 (62.7%) | 2,077 (8.0%) |
| Total | 20,778 (100.0%) | 25,891 (100.0%) |
Health & Disability in Laredo
Health Insurance Coverage by Age in Laredo
| Age Bracket | With Coverage | Without Coverage |
| Under 6 Years | 22,853 (89.2%) | 2,756 (10.8%) |
| 6 to 18 Years | 49,703 (82.6%) | 10,438 (17.4%) |
| 19 to 25 Years | 16,013 (54.1%) | 13,569 (45.9%) |
| 26 to 34 Years | 15,945 (52.5%) | 14,437 (47.5%) |
| 35 to 44 Years | 19,411 (60.9%) | 12,473 (39.1%) |
| 45 to 54 Years | 19,476 (65.9%) | 10,068 (34.1%) |
| 55 to 64 Years | 15,354 (69.0%) | 6,913 (31.0%) |
| 65 to 74 Years | 13,235 (94.2%) | 821 (5.8%) |
| 75 Years and older | 9,612 (96.2%) | 376 (3.8%) |
| Total | 181,602 (71.7%) | 71,851 (28.3%) |
Health Insurance Coverage by Citizenship Status in Laredo
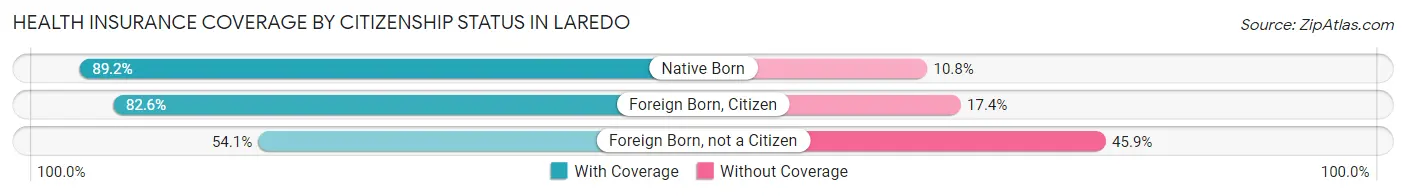
| Citizenship Status | With Coverage | Without Coverage |
| Native Born | 22,853 (89.2%) | 2,756 (10.8%) |
| Foreign Born, Citizen | 49,703 (82.6%) | 10,438 (17.4%) |
| Foreign Born, not a Citizen | 16,013 (54.1%) | 13,569 (45.9%) |
Health Insurance Coverage by Household Income in Laredo
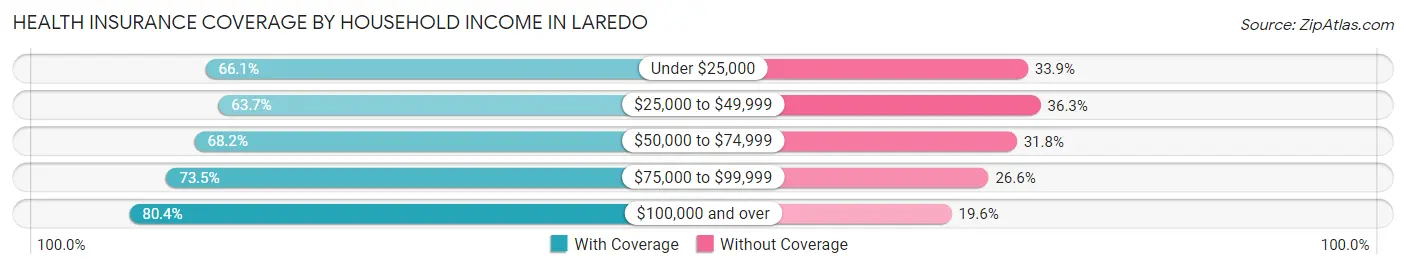
| Household Income | With Coverage | Without Coverage |
| Under $25,000 | 25,375 (66.1%) | 13,018 (33.9%) |
| $25,000 to $49,999 | 31,501 (63.7%) | 17,959 (36.3%) |
| $50,000 to $74,999 | 30,300 (68.2%) | 14,154 (31.8%) |
| $75,000 to $99,999 | 29,503 (73.5%) | 10,664 (26.6%) |
| $100,000 and over | 64,076 (80.4%) | 15,645 (19.6%) |
Public vs Private Health Insurance Coverage by Age in Laredo
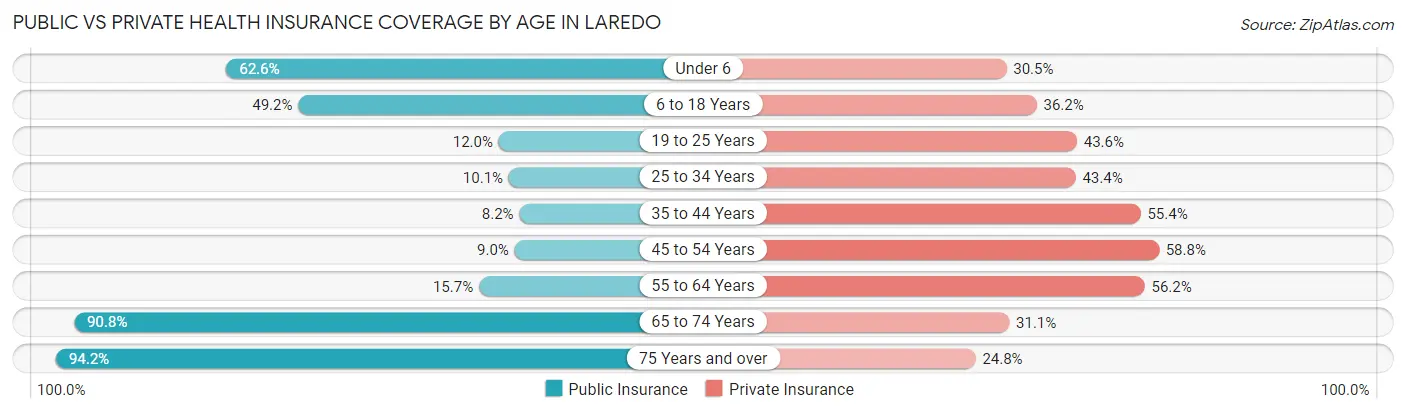
| Age Bracket | Public Insurance | Private Insurance |
| Under 6 | 16,020 (62.6%) | 7,819 (30.5%) |
| 6 to 18 Years | 29,592 (49.2%) | 21,742 (36.1%) |
| 19 to 25 Years | 3,543 (12.0%) | 12,904 (43.6%) |
| 25 to 34 Years | 3,072 (10.1%) | 13,180 (43.4%) |
| 35 to 44 Years | 2,602 (8.2%) | 17,678 (55.4%) |
| 45 to 54 Years | 2,671 (9.0%) | 17,380 (58.8%) |
| 55 to 64 Years | 3,488 (15.7%) | 12,515 (56.2%) |
| 65 to 74 Years | 12,767 (90.8%) | 4,366 (31.1%) |
| 75 Years and over | 9,407 (94.2%) | 2,478 (24.8%) |
| Total | 83,162 (32.8%) | 110,062 (43.4%) |
Disability Status by Sex by Age in Laredo
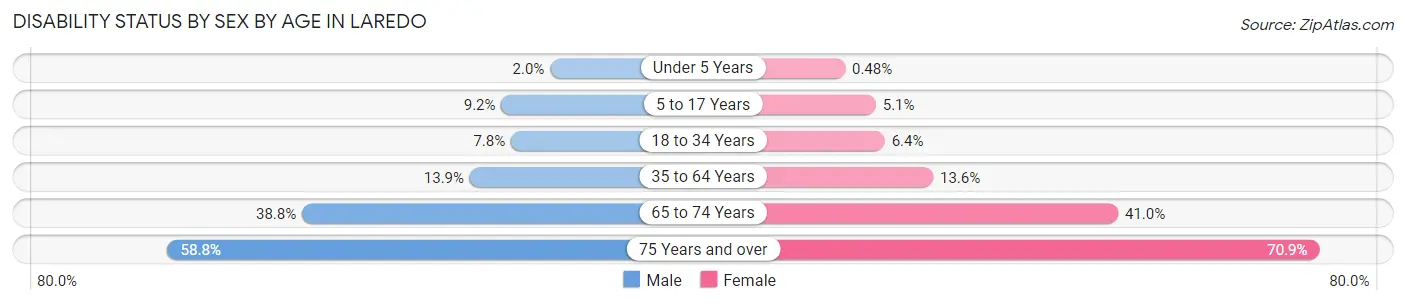
| Age Bracket | Male | Female |
| Under 5 Years | 213 (1.9%) | 51 (0.5%) |
| 5 to 17 Years | 2,777 (9.2%) | 1,484 (5.1%) |
| 18 to 34 Years | 2,547 (7.8%) | 2,026 (6.4%) |
| 35 to 64 Years | 5,674 (13.9%) | 5,804 (13.6%) |
| 65 to 74 Years | 2,504 (38.8%) | 3,118 (41.0%) |
| 75 Years and over | 2,249 (58.8%) | 4,368 (70.9%) |
Disability Class by Sex by Age in Laredo
Disability Class: Hearing Difficulty
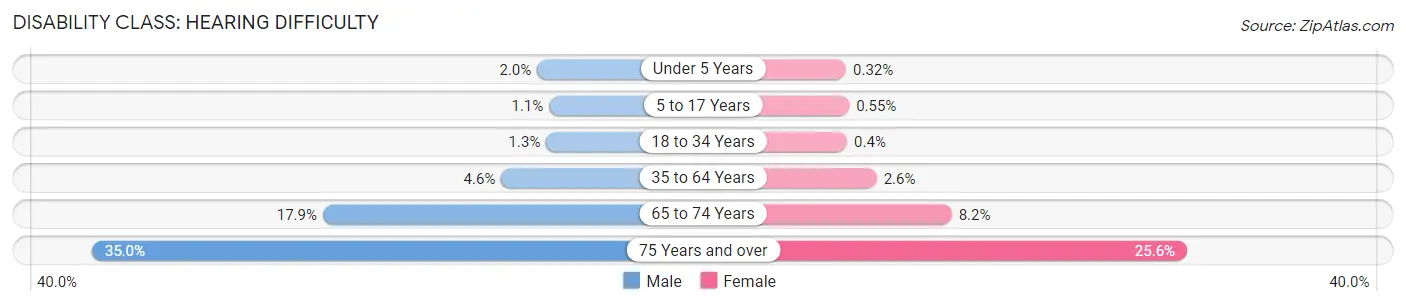
| Age Bracket | Male | Female |
| Under 5 Years | 213 (1.9%) | 34 (0.3%) |
| 5 to 17 Years | 320 (1.1%) | 162 (0.5%) |
| 18 to 34 Years | 416 (1.3%) | 126 (0.4%) |
| 35 to 64 Years | 1,885 (4.6%) | 1,109 (2.6%) |
| 65 to 74 Years | 1,153 (17.9%) | 620 (8.2%) |
| 75 Years and over | 1,340 (35.0%) | 1,578 (25.6%) |
Disability Class: Vision Difficulty
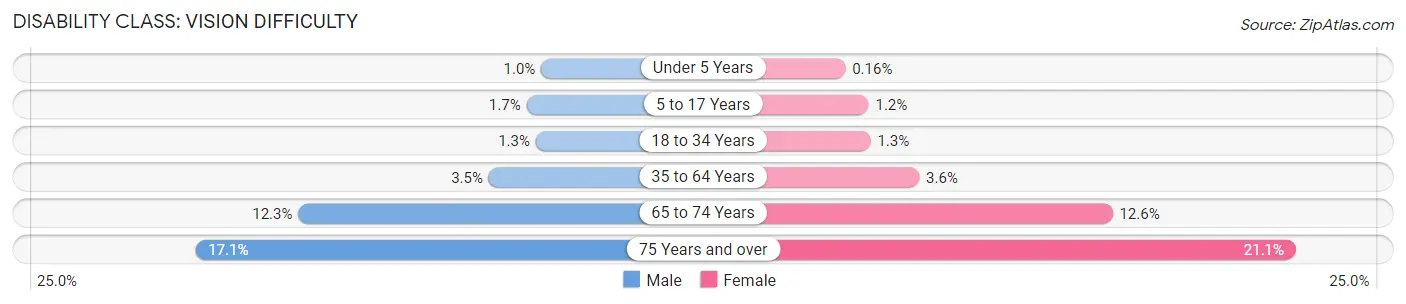
| Age Bracket | Male | Female |
| Under 5 Years | 112 (1.0%) | 17 (0.2%) |
| 5 to 17 Years | 517 (1.7%) | 365 (1.2%) |
| 18 to 34 Years | 419 (1.3%) | 424 (1.3%) |
| 35 to 64 Years | 1,414 (3.5%) | 1,539 (3.6%) |
| 65 to 74 Years | 794 (12.3%) | 955 (12.6%) |
| 75 Years and over | 654 (17.1%) | 1,298 (21.1%) |
Disability Class: Cognitive Difficulty
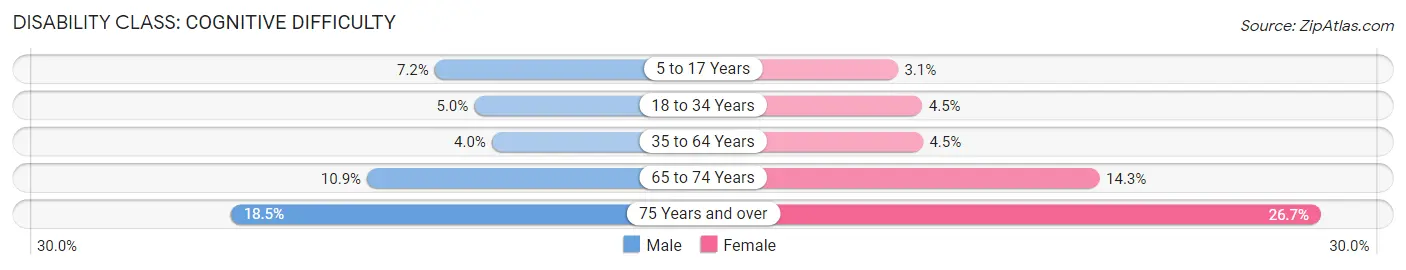
| Age Bracket | Male | Female |
| 5 to 17 Years | 2,163 (7.2%) | 912 (3.1%) |
| 18 to 34 Years | 1,629 (5.0%) | 1,420 (4.5%) |
| 35 to 64 Years | 1,632 (4.0%) | 1,925 (4.5%) |
| 65 to 74 Years | 706 (10.9%) | 1,089 (14.3%) |
| 75 Years and over | 709 (18.5%) | 1,643 (26.7%) |
Disability Class: Ambulatory Difficulty
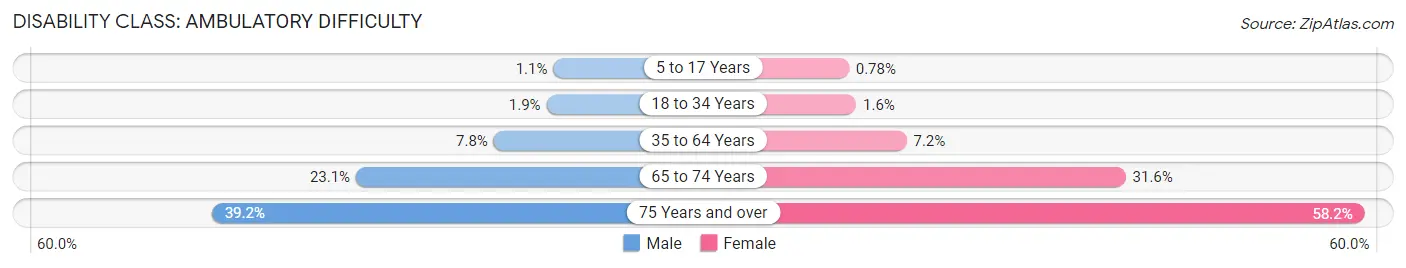
| Age Bracket | Male | Female |
| 5 to 17 Years | 338 (1.1%) | 228 (0.8%) |
| 18 to 34 Years | 615 (1.9%) | 505 (1.6%) |
| 35 to 64 Years | 3,171 (7.8%) | 3,088 (7.2%) |
| 65 to 74 Years | 1,491 (23.1%) | 2,403 (31.6%) |
| 75 Years and over | 1,499 (39.2%) | 3,586 (58.2%) |
Disability Class: Self-Care Difficulty
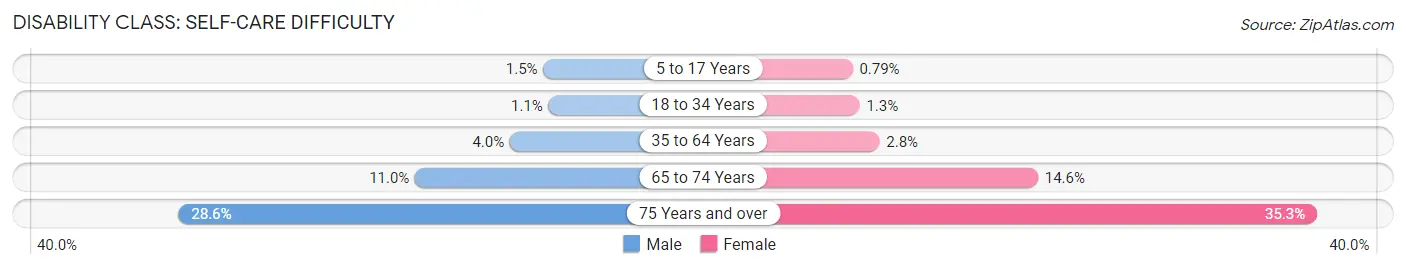
| Age Bracket | Male | Female |
| 5 to 17 Years | 448 (1.5%) | 233 (0.8%) |
| 18 to 34 Years | 358 (1.1%) | 417 (1.3%) |
| 35 to 64 Years | 1,617 (4.0%) | 1,195 (2.8%) |
| 65 to 74 Years | 710 (11.0%) | 1,106 (14.5%) |
| 75 Years and over | 1,094 (28.6%) | 2,173 (35.3%) |
Technology Access in Laredo
Computing Device Access in Laredo
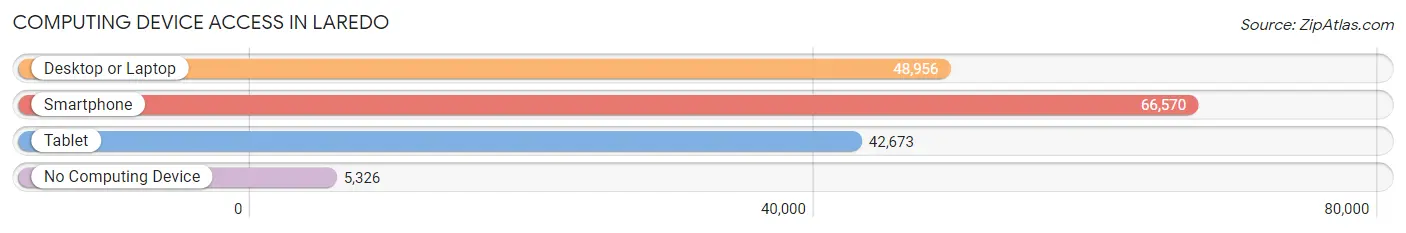
| Device Type | # Households | % Households |
| Desktop or Laptop | 48,956 | 65.8% |
| Smartphone | 66,570 | 89.5% |
| Tablet | 42,673 | 57.4% |
| No Computing Device | 5,326 | 7.2% |
| Total | 74,380 | 100.0% |
Internet Access in Laredo
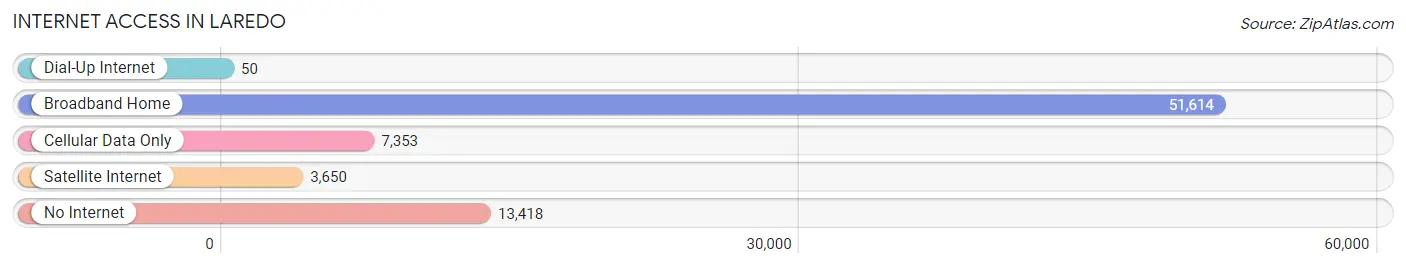
| Internet Type | # Households | % Households |
| Dial-Up Internet | 50 | 0.1% |
| Broadband Home | 51,614 | 69.4% |
| Cellular Data Only | 7,353 | 9.9% |
| Satellite Internet | 3,650 | 4.9% |
| No Internet | 13,418 | 18.0% |
| Total | 74,380 | 100.0% |
Laredo Summary
Laredo, Texas is a city located in Webb County, Texas, United States, on the north bank of the Rio Grande, across from Nuevo Laredo, Tamaulipas, Mexico. It is the county seat of Webb County and the largest city on the United States-Mexico border. As of the 2010 census, the city had a population of 236,091, making it the tenth-most populous city in the state of Texas and third-most populated on the Mexico–United States border, after San Diego, California, and El Paso, Texas. Its metropolitan area is the 178th-largest in the United States and includes all of Webb County, with a population of 250,304. Laredo is also part of the cross-border Laredo-Nuevo Laredo Metropolitan Area with an estimated population of 636,516.
History
Laredo was founded in 1755 by Don Tomás Sánchez while the area was part of the Nuevo Santander region in the Spanish colony of New Spain. The settlement was named after Laredo, Cantabria, Spain. In 1840, Laredo was the capital of the independent Republic of the Rio Grande, set up in opposition to Antonio López de Santa Anna, but the republic lasted only a few months. In 1846 during the Mexican–American War, the town was occupied by the Texas Rangers. After the war, the Treaty of Guadalupe-Hidalgo ceded the land to the United States.
Geography
Laredo is located in the South Texas region known as the Rio Grande Valley. It is bordered by the Rio Grande to the south, Nuevo Laredo, Mexico, to the southwest, and the cities of San Ygnacio and Zapata to the west. The city is also bordered by Webb County to the north and east. Laredo has a total area of 81.6 square miles, of which 79.3 square miles is land and 2.3 square miles is water.
Economy
Laredo's economy is based on international trade with Mexico. It is one of the fastest growing cities in the United States and has one of the lowest unemployment rates in the country. The city's largest employers are the United States government, Laredo Independent School District, Laredo Community College, and Webb County. The city is also home to several major manufacturing and distribution centers, including Nestlé, Frito-Lay, and H-E-B.
Demographics
As of the 2010 census, Laredo had a population of 236,091, making it the tenth-most populous city in the state of Texas and third-most populated on the Mexico–United States border, after San Diego, California, and El Paso, Texas. Its metropolitan area is the 178th-largest in the United States and includes all of Webb County, with a population of 250,304. The racial makeup of the city was 81.2% White, 0.9% African American, 0.6% Native American, 0.5% Asian, 0.1% Pacific Islander, 15.2% from other races, and 1.5% from two or more races. Hispanic or Latino of any race were 95.2% of the population.
Laredo is a majority-minority city, with Hispanics making up 95.2% of the population. The city is also home to a large number of immigrants from Mexico and other Latin American countries. The median household income in Laredo was $35,945 in 2018, and the median home value was $117,400. The city has a poverty rate of 28.2%, higher than the national average of 11.8%.
Common Questions
What is the Total Population of Laredo?
Total Population of Laredo is 255,293.
What is the Total Male Population of Laredo?
Total Male Population of Laredo is 126,431.
What is the Total Female Population of Laredo?
Total Female Population of Laredo is 128,862.
What is the Ratio of Males per 100 Females in Laredo?
There are 98.11 Males per 100 Females in Laredo.
What is the Ratio of Females per 100 Males in Laredo?
There are 101.92 Females per 100 Males in Laredo.
What is the Median Population Age in Laredo?
Median Population Age in Laredo is 29.3 Years.
What is the Average Family Size in Laredo
Average Family Size in Laredo is 3.9 People.
What is the Average Household Size in Laredo
Average Household Size in Laredo is 3.4 People.
What is Per Capita Income in Laredo?
Per Capita income in Laredo is $23,669.
What is the Median Family Income in Laredo?
Median Family Income in Laredo is $66,315.
What is the Median Household income in Laredo?
Median Household Income in Laredo is $60,928.
What is Income or Wage Gap in Laredo?
Income or Wage Gap in Laredo is 39.3%.
Women in Laredo earn 60.7 cents for every dollar earned by a man.
What is Family Income Deficit in Laredo?
Family Income Deficit in Laredo is $11,121.
Families that are below poverty line in Laredo earn $11,121 less on average than the poverty threshold level.
What is Inequality or Gini Index in Laredo?
Inequality or Gini Index in Laredo is 0.46.
How Large is the Labor Force in Laredo?
There are 114,004 People in the Labor Forcein in Laredo.
What is the Percentage of People in the Labor Force in Laredo?
62.3% of People are in the Labor Force in Laredo.
What is the Unemployment Rate in Laredo?
Unemployment Rate in Laredo is 5.9%.