Cities with the Most Immigrants from Philippines in Utah
RELATED REPORTS & OPTIONS
Philippines
Utah
Compare Cities
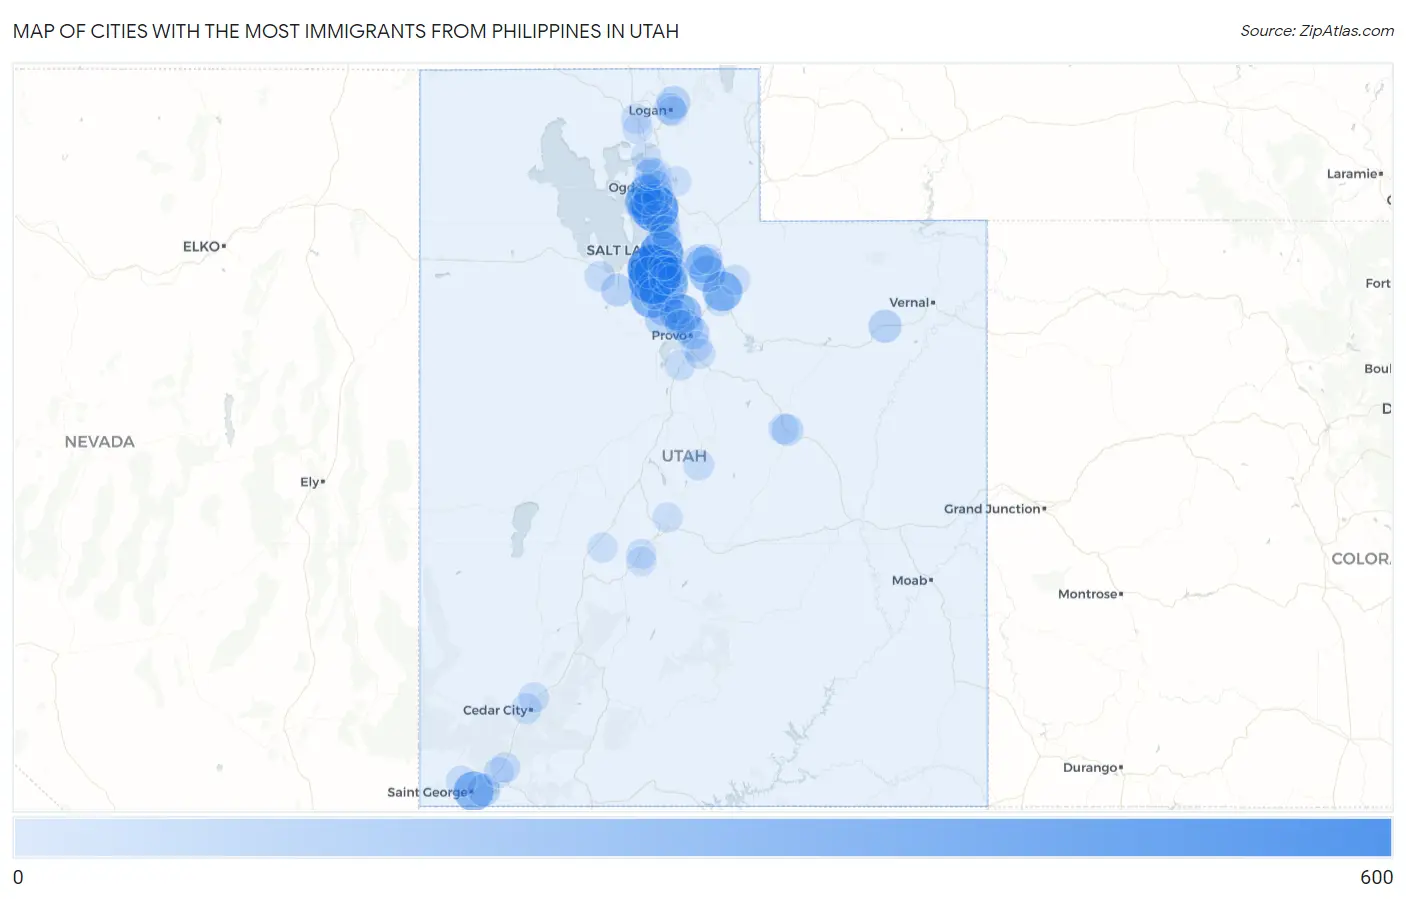
Map of Cities with the Most Immigrants from Philippines in Utah
0
600
Cities with the Most Immigrants from Philippines in Utah
| City | Philippines | vs State | vs National | |
| 1. | Taylorsville | 515 | 6,468(7.96%)#1 | 1,985,710(0.03%)#545 |
| 2. | West Jordan | 461 | 6,468(7.13%)#2 | 1,985,710(0.02%)#585 |
| 3. | West Valley City | 454 | 6,468(7.02%)#3 | 1,985,710(0.02%)#598 |
| 4. | Layton | 438 | 6,468(6.77%)#4 | 1,985,710(0.02%)#615 |
| 5. | Salt Lake City | 378 | 6,468(5.84%)#5 | 1,985,710(0.02%)#698 |
| 6. | Herriman | 278 | 6,468(4.30%)#6 | 1,985,710(0.01%)#882 |
| 7. | St George | 249 | 6,468(3.85%)#7 | 1,985,710(0.01%)#966 |
| 8. | Heber | 244 | 6,468(3.77%)#8 | 1,985,710(0.01%)#984 |
| 9. | Sandy | 216 | 6,468(3.34%)#9 | 1,985,710(0.01%)#1,085 |
| 10. | Clearfield | 216 | 6,468(3.34%)#10 | 1,985,710(0.01%)#1,090 |
| 11. | Pleasant Grove | 205 | 6,468(3.17%)#11 | 1,985,710(0.01%)#1,126 |
| 12. | Roy | 167 | 6,468(2.58%)#12 | 1,985,710(0.01%)#1,337 |
| 13. | Park City | 165 | 6,468(2.55%)#13 | 1,985,710(0.01%)#1,353 |
| 14. | Clinton | 159 | 6,468(2.46%)#14 | 1,985,710(0.01%)#1,390 |
| 15. | Snyderville | 157 | 6,468(2.43%)#15 | 1,985,710(0.01%)#1,400 |
| 16. | Lehi | 134 | 6,468(2.07%)#16 | 1,985,710(0.01%)#1,563 |
| 17. | Ogden | 97 | 6,468(1.50%)#17 | 1,985,710(0.00%)#1,945 |
| 18. | South Jordan | 93 | 6,468(1.44%)#18 | 1,985,710(0.00%)#2,011 |
| 19. | Farmington | 93 | 6,468(1.44%)#19 | 1,985,710(0.00%)#2,019 |
| 20. | West Point | 85 | 6,468(1.31%)#20 | 1,985,710(0.00%)#2,127 |
| 21. | Orem | 84 | 6,468(1.30%)#21 | 1,985,710(0.00%)#2,138 |
| 22. | Provo | 81 | 6,468(1.25%)#22 | 1,985,710(0.00%)#2,185 |
| 23. | North Logan | 77 | 6,468(1.19%)#23 | 1,985,710(0.00%)#2,272 |
| 24. | Ballard | 73 | 6,468(1.13%)#24 | 1,985,710(0.00%)#2,350 |
| 25. | Washington | 71 | 6,468(1.10%)#25 | 1,985,710(0.00%)#2,390 |
| 26. | Millcreek | 69 | 6,468(1.07%)#26 | 1,985,710(0.00%)#2,419 |
| 27. | Tooele | 67 | 6,468(1.04%)#27 | 1,985,710(0.00%)#2,457 |
| 28. | Saratoga Springs | 60 | 6,468(0.93%)#28 | 1,985,710(0.00%)#2,604 |
| 29. | Murray | 59 | 6,468(0.91%)#29 | 1,985,710(0.00%)#2,627 |
| 30. | Syracuse | 53 | 6,468(0.82%)#30 | 1,985,710(0.00%)#2,787 |
| 31. | Kearns | 47 | 6,468(0.73%)#31 | 1,985,710(0.00%)#2,966 |
| 32. | Draper | 46 | 6,468(0.71%)#32 | 1,985,710(0.00%)#2,994 |
| 33. | Logan | 43 | 6,468(0.66%)#33 | 1,985,710(0.00%)#3,099 |
| 34. | Riverton | 42 | 6,468(0.65%)#34 | 1,985,710(0.00%)#3,144 |
| 35. | South Ogden | 41 | 6,468(0.63%)#35 | 1,985,710(0.00%)#3,197 |
| 36. | Price | 40 | 6,468(0.62%)#36 | 1,985,710(0.00%)#3,252 |
| 37. | Midvale | 37 | 6,468(0.57%)#37 | 1,985,710(0.00%)#3,371 |
| 38. | West Haven | 35 | 6,468(0.54%)#38 | 1,985,710(0.00%)#3,467 |
| 39. | Cottonwood Heights | 31 | 6,468(0.48%)#39 | 1,985,710(0.00%)#3,662 |
| 40. | Woods Cross | 30 | 6,468(0.46%)#40 | 1,985,710(0.00%)#3,737 |
| 41. | Holladay | 27 | 6,468(0.42%)#41 | 1,985,710(0.00%)#3,903 |
| 42. | Cedar Hills | 27 | 6,468(0.42%)#42 | 1,985,710(0.00%)#3,933 |
| 43. | American Fork | 23 | 6,468(0.36%)#43 | 1,985,710(0.00%)#4,159 |
| 44. | Summit Park | 23 | 6,468(0.36%)#44 | 1,985,710(0.00%)#4,181 |
| 45. | Springville | 21 | 6,468(0.32%)#45 | 1,985,710(0.00%)#4,289 |
| 46. | Kaysville | 21 | 6,468(0.32%)#46 | 1,985,710(0.00%)#4,292 |
| 47. | Payson | 21 | 6,468(0.32%)#47 | 1,985,710(0.00%)#4,298 |
| 48. | Centerville | 21 | 6,468(0.32%)#48 | 1,985,710(0.00%)#4,304 |
| 49. | Ivins | 21 | 6,468(0.32%)#49 | 1,985,710(0.00%)#4,326 |
| 50. | Ephraim | 20 | 6,468(0.31%)#50 | 1,985,710(0.00%)#4,408 |
| 51. | Grantsville | 17 | 6,468(0.26%)#51 | 1,985,710(0.00%)#4,629 |
| 52. | South Weber | 16 | 6,468(0.25%)#52 | 1,985,710(0.00%)#4,745 |
| 53. | West Wood | 16 | 6,468(0.25%)#53 | 1,985,710(0.00%)#4,802 |
| 54. | Cedar City | 14 | 6,468(0.22%)#54 | 1,985,710(0.00%)#4,906 |
| 55. | Leeds | 14 | 6,468(0.22%)#55 | 1,985,710(0.00%)#5,025 |
| 56. | Sunset | 13 | 6,468(0.20%)#56 | 1,985,710(0.00%)#5,095 |
| 57. | Francis | 13 | 6,468(0.20%)#57 | 1,985,710(0.00%)#5,139 |
| 58. | East Basin | 12 | 6,468(0.19%)#58 | 1,985,710(0.00%)#5,238 |
| 59. | Vineyard | 11 | 6,468(0.17%)#59 | 1,985,710(0.00%)#5,319 |
| 60. | Farr West | 11 | 6,468(0.17%)#60 | 1,985,710(0.00%)#5,340 |
| 61. | Bountiful | 10 | 6,468(0.15%)#61 | 1,985,710(0.00%)#5,441 |
| 62. | North Ogden | 10 | 6,468(0.15%)#62 | 1,985,710(0.00%)#5,446 |
| 63. | Enoch | 10 | 6,468(0.15%)#63 | 1,985,710(0.00%)#5,486 |
| 64. | South Salt Lake | 9 | 6,468(0.14%)#64 | 1,985,710(0.00%)#5,598 |
| 65. | Mapleton | 9 | 6,468(0.14%)#65 | 1,985,710(0.00%)#5,618 |
| 66. | Pleasant View | 9 | 6,468(0.14%)#66 | 1,985,710(0.00%)#5,623 |
| 67. | Silver Summit | 8 | 6,468(0.12%)#67 | 1,985,710(0.00%)#5,878 |
| 68. | Elwood | 8 | 6,468(0.12%)#68 | 1,985,710(0.00%)#5,883 |
| 69. | Toquerville | 7 | 6,468(0.11%)#69 | 1,985,710(0.00%)#6,031 |
| 70. | River Heights | 5 | 6,468(0.08%)#70 | 1,985,710(0.00%)#6,409 |
| 71. | Willard | 5 | 6,468(0.08%)#71 | 1,985,710(0.00%)#6,424 |
| 72. | Daniel | 4 | 6,468(0.06%)#72 | 1,985,710(0.00%)#6,671 |
| 73. | Bear River City | 4 | 6,468(0.06%)#73 | 1,985,710(0.00%)#6,691 |
| 74. | Kanosh | 4 | 6,468(0.06%)#74 | 1,985,710(0.00%)#6,711 |
| 75. | Huntsville | 4 | 6,468(0.06%)#75 | 1,985,710(0.00%)#6,727 |
| 76. | Richfield | 3 | 6,468(0.05%)#76 | 1,985,710(0.00%)#6,776 |
| 77. | Central Valley | 2 | 6,468(0.03%)#77 | 1,985,710(0.00%)#7,207 |
| 78. | Redmond | 1 | 6,468(0.02%)#78 | 1,985,710(0.00%)#7,437 |
Common Questions
What are the Top 10 Cities with the Most Immigrants from Philippines in Utah?
Top 10 Cities with the Most Immigrants from Philippines in Utah are:
#1
515
#2
461
#3
454
#4
438
#5
378
#6
278
#7
249
#8
244
#9
216
#10
216
What city has the Most Immigrants from Philippines in Utah?
Taylorsville has the Most Immigrants from Philippines in Utah with 515.
What is the Total Immigrants from Philippines in the State of Utah?
Total Immigrants from Philippines in Utah is 6,468.
What is the Total Immigrants from Philippines in the United States?
Total Immigrants from Philippines in the United States is 1,985,710.