Cities with the Most Immigrants from Philippines in New Jersey
RELATED REPORTS & OPTIONS
Philippines
New Jersey
Compare Cities
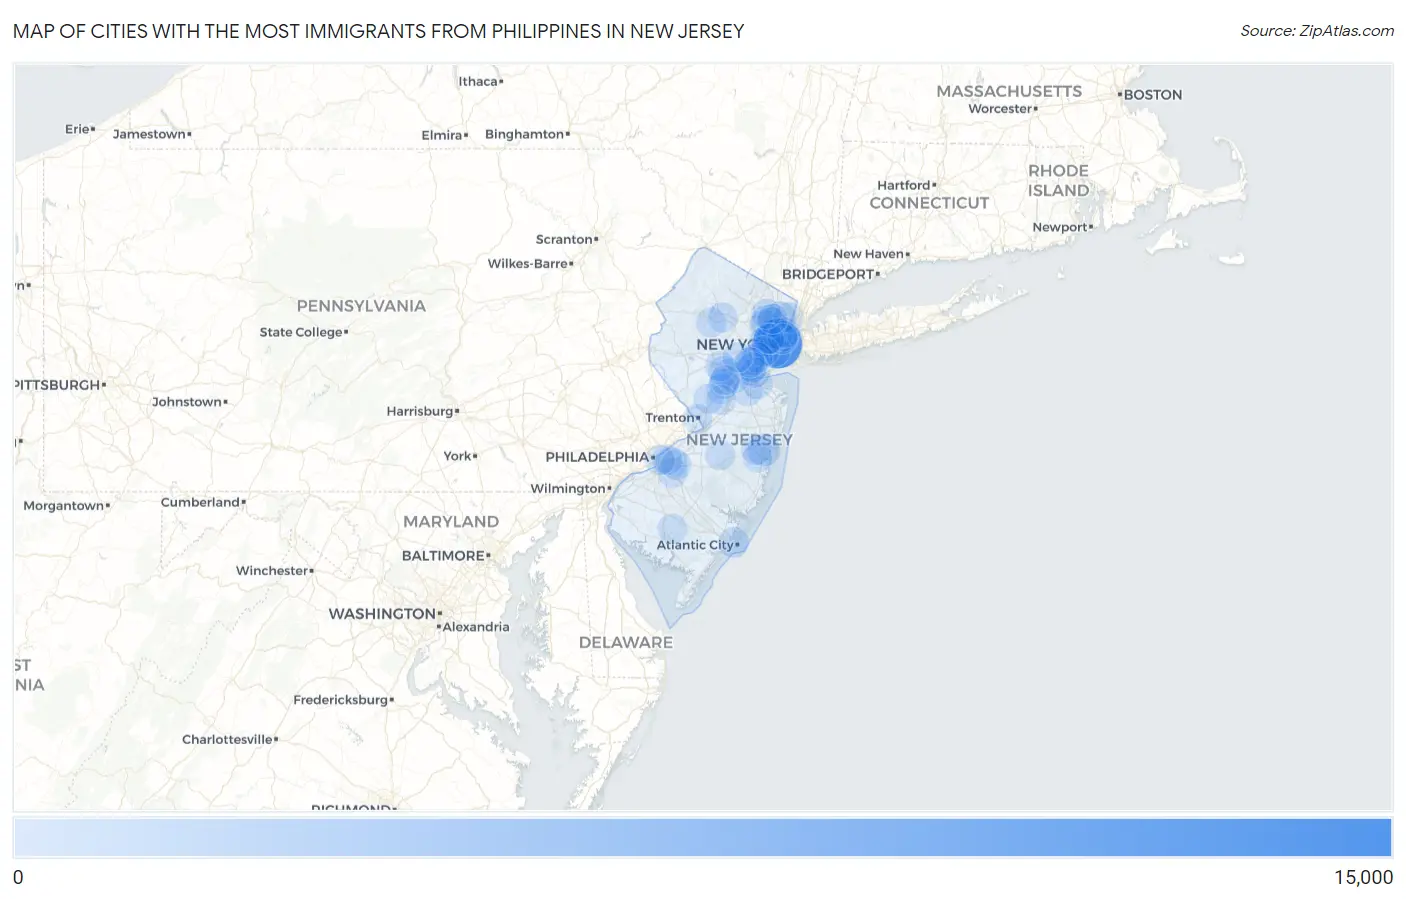
Map of Cities with the Most Immigrants from Philippines in New Jersey
0
15,000
Cities with the Most Immigrants from Philippines in New Jersey
| City | Philippines | vs State | vs National | |
| 1. | Jersey City | 11,091 | 85,934(12.91%)#1 | 1,985,710(0.56%)#20 |
| 2. | Bergenfield Borough | 3,416 | 85,934(3.98%)#2 | 1,985,710(0.17%)#73 |
| 3. | Bayonne | 2,027 | 85,934(2.36%)#3 | 1,985,710(0.10%)#137 |
| 4. | Clifton | 1,506 | 85,934(1.75%)#4 | 1,985,710(0.08%)#189 |
| 5. | Dumont Borough | 1,431 | 85,934(1.67%)#5 | 1,985,710(0.07%)#200 |
| 6. | Toms River | 1,343 | 85,934(1.56%)#6 | 1,985,710(0.07%)#217 |
| 7. | Hackensack | 1,191 | 85,934(1.39%)#7 | 1,985,710(0.06%)#246 |
| 8. | New Milford Borough | 1,131 | 85,934(1.32%)#8 | 1,985,710(0.06%)#261 |
| 9. | Carteret Borough | 751 | 85,934(0.87%)#9 | 1,985,710(0.04%)#391 |
| 10. | Fort Lee Borough | 720 | 85,934(0.84%)#10 | 1,985,710(0.04%)#401 |
| 11. | Lodi Borough | 665 | 85,934(0.77%)#11 | 1,985,710(0.03%)#430 |
| 12. | Sayreville Borough | 632 | 85,934(0.74%)#12 | 1,985,710(0.03%)#452 |
| 13. | South Plainfield Borough | 596 | 85,934(0.69%)#13 | 1,985,710(0.03%)#482 |
| 14. | Raritan Borough | 558 | 85,934(0.65%)#14 | 1,985,710(0.03%)#505 |
| 15. | Brookdale | 545 | 85,934(0.63%)#15 | 1,985,710(0.03%)#512 |
| 16. | Paramus Borough | 532 | 85,934(0.62%)#16 | 1,985,710(0.03%)#527 |
| 17. | Hasbrouck Heights Borough | 531 | 85,934(0.62%)#17 | 1,985,710(0.03%)#528 |
| 18. | Secaucus | 492 | 85,934(0.57%)#18 | 1,985,710(0.02%)#560 |
| 19. | Newark | 487 | 85,934(0.57%)#19 | 1,985,710(0.02%)#564 |
| 20. | Somerville Borough | 473 | 85,934(0.55%)#20 | 1,985,710(0.02%)#576 |
| 21. | Atlantic City | 469 | 85,934(0.55%)#21 | 1,985,710(0.02%)#580 |
| 22. | Springfield | 438 | 85,934(0.51%)#22 | 1,985,710(0.02%)#616 |
| 23. | Fair Lawn Borough | 420 | 85,934(0.49%)#23 | 1,985,710(0.02%)#639 |
| 24. | Laurence Harbor | 420 | 85,934(0.49%)#24 | 1,985,710(0.02%)#641 |
| 25. | Westwood Borough | 411 | 85,934(0.48%)#25 | 1,985,710(0.02%)#653 |
| 26. | Sicklerville | 410 | 85,934(0.48%)#26 | 1,985,710(0.02%)#655 |
| 27. | Silver Lake Cdp Essex County | 407 | 85,934(0.47%)#27 | 1,985,710(0.02%)#659 |
| 28. | Iselin | 397 | 85,934(0.46%)#28 | 1,985,710(0.02%)#669 |
| 29. | Fords | 393 | 85,934(0.46%)#29 | 1,985,710(0.02%)#674 |
| 30. | Elmwood Park Borough | 376 | 85,934(0.44%)#30 | 1,985,710(0.02%)#706 |
| 31. | Hillsborough | 360 | 85,934(0.42%)#31 | 1,985,710(0.02%)#722 |
| 32. | Highland Park Borough | 351 | 85,934(0.41%)#32 | 1,985,710(0.02%)#733 |
| 33. | Eatontown Borough | 345 | 85,934(0.40%)#33 | 1,985,710(0.02%)#742 |
| 34. | Maywood Borough | 344 | 85,934(0.40%)#34 | 1,985,710(0.02%)#744 |
| 35. | Passaic | 340 | 85,934(0.40%)#35 | 1,985,710(0.02%)#751 |
| 36. | Rahway | 334 | 85,934(0.39%)#36 | 1,985,710(0.02%)#758 |
| 37. | Pompton Lakes Borough | 320 | 85,934(0.37%)#37 | 1,985,710(0.02%)#781 |
| 38. | Union City | 310 | 85,934(0.36%)#38 | 1,985,710(0.02%)#798 |
| 39. | East Rutherford Borough | 310 | 85,934(0.36%)#39 | 1,985,710(0.02%)#801 |
| 40. | Franklin Center | 298 | 85,934(0.35%)#40 | 1,985,710(0.02%)#828 |
| 41. | Englewood | 297 | 85,934(0.35%)#41 | 1,985,710(0.01%)#830 |
| 42. | Rutherford Borough | 297 | 85,934(0.35%)#42 | 1,985,710(0.01%)#832 |
| 43. | Somerset | 296 | 85,934(0.34%)#43 | 1,985,710(0.01%)#835 |
| 44. | Emerson Borough | 280 | 85,934(0.33%)#44 | 1,985,710(0.01%)#877 |
| 45. | Echelon | 274 | 85,934(0.32%)#45 | 1,985,710(0.01%)#896 |
| 46. | Linden | 269 | 85,934(0.31%)#46 | 1,985,710(0.01%)#907 |
| 47. | West New York | 261 | 85,934(0.30%)#47 | 1,985,710(0.01%)#928 |
| 48. | Kingston Estates | 256 | 85,934(0.30%)#48 | 1,985,710(0.01%)#947 |
| 49. | Hoboken | 255 | 85,934(0.30%)#49 | 1,985,710(0.01%)#949 |
| 50. | New Brunswick | 243 | 85,934(0.28%)#50 | 1,985,710(0.01%)#985 |
| 51. | Lake Hiawatha | 242 | 85,934(0.28%)#51 | 1,985,710(0.01%)#992 |
| 52. | Tinton Falls Borough | 241 | 85,934(0.28%)#52 | 1,985,710(0.01%)#996 |
| 53. | Greentree | 236 | 85,934(0.27%)#53 | 1,985,710(0.01%)#1,007 |
| 54. | Kearny | 235 | 85,934(0.27%)#54 | 1,985,710(0.01%)#1,010 |
| 55. | Kendall Park | 235 | 85,934(0.27%)#55 | 1,985,710(0.01%)#1,012 |
| 56. | Little Ferry Borough | 228 | 85,934(0.27%)#56 | 1,985,710(0.01%)#1,032 |
| 57. | Mckee | 228 | 85,934(0.27%)#57 | 1,985,710(0.01%)#1,033 |
| 58. | Englewood Cliffs Borough | 226 | 85,934(0.26%)#58 | 1,985,710(0.01%)#1,040 |
| 59. | North Arlington Borough | 225 | 85,934(0.26%)#59 | 1,985,710(0.01%)#1,043 |
| 60. | Parsippany | 220 | 85,934(0.26%)#60 | 1,985,710(0.01%)#1,065 |
| 61. | Bogota Borough | 220 | 85,934(0.26%)#61 | 1,985,710(0.01%)#1,067 |
| 62. | Golden Triangle | 216 | 85,934(0.25%)#62 | 1,985,710(0.01%)#1,092 |
| 63. | Ridgefield Borough | 214 | 85,934(0.25%)#63 | 1,985,710(0.01%)#1,097 |
| 64. | Woodland Park Borough | 211 | 85,934(0.25%)#64 | 1,985,710(0.01%)#1,109 |
| 65. | Cliffside Park Borough | 210 | 85,934(0.24%)#65 | 1,985,710(0.01%)#1,111 |
| 66. | South River Borough | 210 | 85,934(0.24%)#66 | 1,985,710(0.01%)#1,112 |
| 67. | Elizabeth | 205 | 85,934(0.24%)#67 | 1,985,710(0.01%)#1,124 |
| 68. | Browns Mills | 205 | 85,934(0.24%)#68 | 1,985,710(0.01%)#1,130 |
| 69. | Succasunna | 202 | 85,934(0.24%)#69 | 1,985,710(0.01%)#1,146 |
| 70. | Bellmawr Borough | 191 | 85,934(0.22%)#70 | 1,985,710(0.01%)#1,212 |
| 71. | New Providence Borough | 189 | 85,934(0.22%)#71 | 1,985,710(0.01%)#1,221 |
| 72. | Vineland | 186 | 85,934(0.22%)#72 | 1,985,710(0.01%)#1,234 |
| 73. | Lindenwold Borough | 185 | 85,934(0.22%)#73 | 1,985,710(0.01%)#1,248 |
| 74. | Roselle Park Borough | 182 | 85,934(0.21%)#74 | 1,985,710(0.01%)#1,262 |
| 75. | Old Bridge | 181 | 85,934(0.21%)#75 | 1,985,710(0.01%)#1,263 |
| 76. | River Edge Borough | 177 | 85,934(0.21%)#76 | 1,985,710(0.01%)#1,289 |
| 77. | Wharton Borough | 175 | 85,934(0.20%)#77 | 1,985,710(0.01%)#1,298 |
| 78. | Wood Ridge Borough | 172 | 85,934(0.20%)#78 | 1,985,710(0.01%)#1,313 |
| 79. | Wanaque Borough | 171 | 85,934(0.20%)#79 | 1,985,710(0.01%)#1,319 |
| 80. | Franklin Park | 168 | 85,934(0.20%)#80 | 1,985,710(0.01%)#1,335 |
| 81. | Harrison | 164 | 85,934(0.19%)#81 | 1,985,710(0.01%)#1,360 |
| 82. | Princeton Meadows | 164 | 85,934(0.19%)#82 | 1,985,710(0.01%)#1,361 |
| 83. | Cresskill Borough | 160 | 85,934(0.19%)#83 | 1,985,710(0.01%)#1,385 |
| 84. | Princeton | 155 | 85,934(0.18%)#84 | 1,985,710(0.01%)#1,413 |
| 85. | Holiday City South | 152 | 85,934(0.18%)#85 | 1,985,710(0.01%)#1,436 |
| 86. | Perth Amboy | 151 | 85,934(0.18%)#86 | 1,985,710(0.01%)#1,437 |
| 87. | Trenton | 148 | 85,934(0.17%)#87 | 1,985,710(0.01%)#1,456 |
| 88. | Woodbridge | 146 | 85,934(0.17%)#88 | 1,985,710(0.01%)#1,471 |
| 89. | Dover | 141 | 85,934(0.16%)#89 | 1,985,710(0.01%)#1,510 |
| 90. | Pine Lake Park | 136 | 85,934(0.16%)#90 | 1,985,710(0.01%)#1,551 |
| 91. | Finderne | 133 | 85,934(0.15%)#91 | 1,985,710(0.01%)#1,585 |
| 92. | Old Tappan Borough | 133 | 85,934(0.15%)#92 | 1,985,710(0.01%)#1,586 |
| 93. | Colonia | 132 | 85,934(0.15%)#93 | 1,985,710(0.01%)#1,593 |
| 94. | Palisades Park Borough | 129 | 85,934(0.15%)#94 | 1,985,710(0.01%)#1,619 |
| 95. | Camden | 128 | 85,934(0.15%)#95 | 1,985,710(0.01%)#1,626 |
| 96. | Six Mile Run | 128 | 85,934(0.15%)#96 | 1,985,710(0.01%)#1,633 |
| 97. | Paterson | 126 | 85,934(0.15%)#97 | 1,985,710(0.01%)#1,642 |
| 98. | North Plainfield Borough | 126 | 85,934(0.15%)#98 | 1,985,710(0.01%)#1,647 |
| 99. | Plainfield | 125 | 85,934(0.15%)#99 | 1,985,710(0.01%)#1,650 |
| 100. | Garfield | 125 | 85,934(0.15%)#100 | 1,985,710(0.01%)#1,654 |
Common Questions
What are the Top 10 Cities with the Most Immigrants from Philippines in New Jersey?
Top 10 Cities with the Most Immigrants from Philippines in New Jersey are:
#1
11,091
#2
2,027
#3
1,506
#4
1,343
#5
1,191
#6
545
#7
492
#8
487
#9
469
#10
420
What city has the Most Immigrants from Philippines in New Jersey?
Jersey City has the Most Immigrants from Philippines in New Jersey with 11,091.
What is the Total Immigrants from Philippines in the State of New Jersey?
Total Immigrants from Philippines in New Jersey is 85,934.
What is the Total Immigrants from Philippines in the United States?
Total Immigrants from Philippines in the United States is 1,985,710.