Cities with the Most Immigrants from Philippines in North Carolina
RELATED REPORTS & OPTIONS
Philippines
North Carolina
Compare Cities
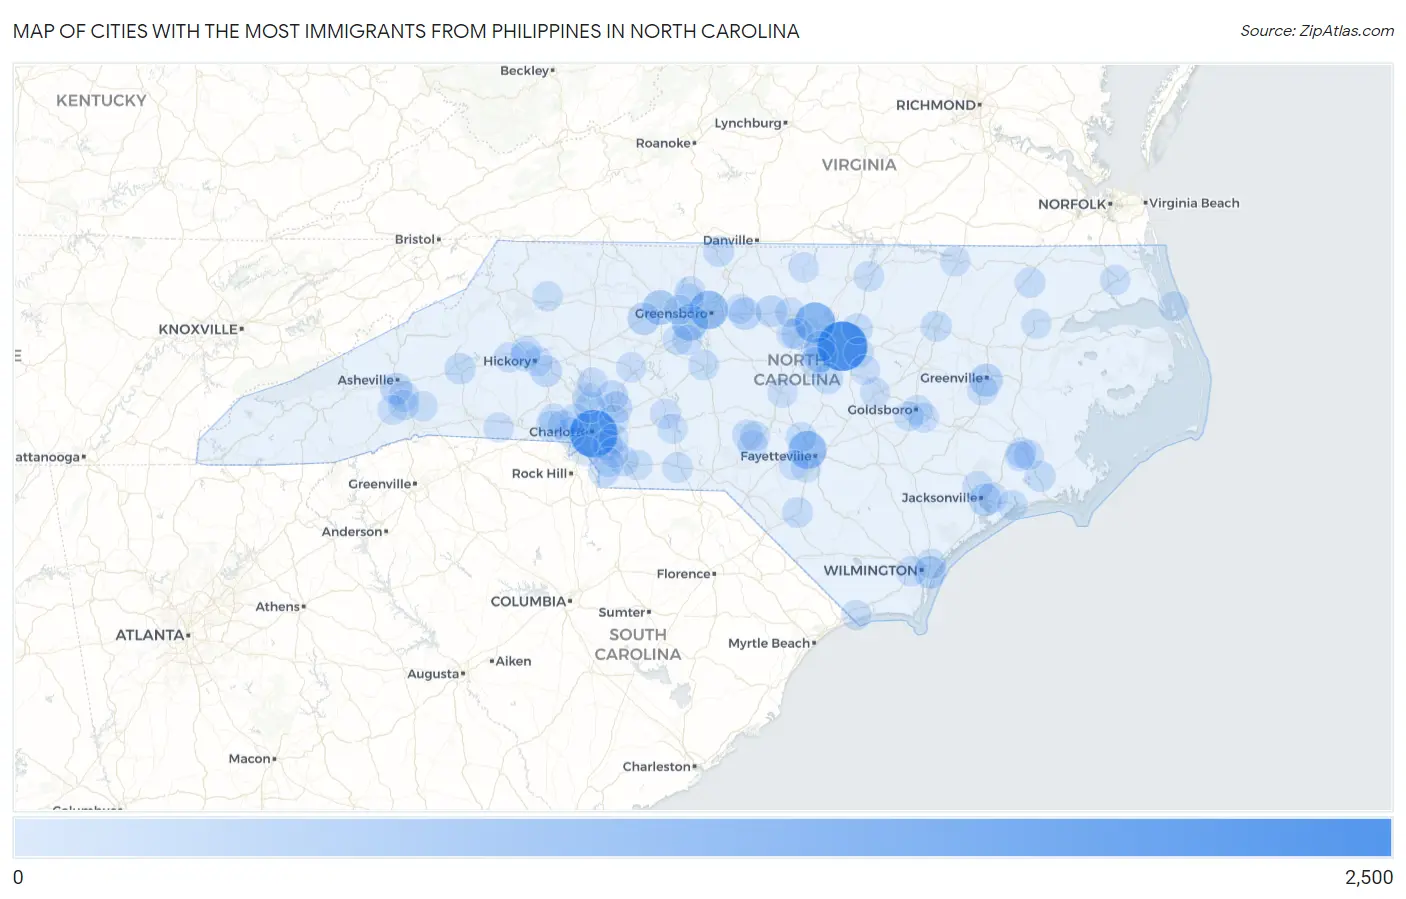
Map of Cities with the Most Immigrants from Philippines in North Carolina
0
2,500
Cities with the Most Immigrants from Philippines in North Carolina
| City | Philippines | vs State | vs National | |
| 1. | Raleigh | 2,163 | 20,695(10.45%)#1 | 1,985,710(0.11%)#125 |
| 2. | Charlotte | 1,951 | 20,695(9.43%)#2 | 1,985,710(0.10%)#146 |
| 3. | Durham | 1,108 | 20,695(5.35%)#3 | 1,985,710(0.06%)#267 |
| 4. | Greensboro | 912 | 20,695(4.41%)#4 | 1,985,710(0.05%)#325 |
| 5. | Fayetteville | 855 | 20,695(4.13%)#5 | 1,985,710(0.04%)#342 |
| 6. | High Point | 657 | 20,695(3.17%)#6 | 1,985,710(0.03%)#434 |
| 7. | Winston Salem | 512 | 20,695(2.47%)#7 | 1,985,710(0.03%)#549 |
| 8. | Cary | 485 | 20,695(2.34%)#8 | 1,985,710(0.02%)#567 |
| 9. | Greenville | 328 | 20,695(1.58%)#9 | 1,985,710(0.02%)#767 |
| 10. | Jacksonville | 288 | 20,695(1.39%)#10 | 1,985,710(0.01%)#853 |
| 11. | Clemmons | 277 | 20,695(1.34%)#11 | 1,985,710(0.01%)#889 |
| 12. | Wilmington | 264 | 20,695(1.28%)#12 | 1,985,710(0.01%)#918 |
| 13. | Burlington | 253 | 20,695(1.22%)#13 | 1,985,710(0.01%)#954 |
| 14. | Concord | 221 | 20,695(1.07%)#14 | 1,985,710(0.01%)#1,057 |
| 15. | Asheville | 219 | 20,695(1.06%)#15 | 1,985,710(0.01%)#1,068 |
| 16. | Chapel Hill | 212 | 20,695(1.02%)#16 | 1,985,710(0.01%)#1,101 |
| 17. | Mebane | 203 | 20,695(0.98%)#17 | 1,985,710(0.01%)#1,140 |
| 18. | Newton | 180 | 20,695(0.87%)#18 | 1,985,710(0.01%)#1,273 |
| 19. | Kannapolis | 174 | 20,695(0.84%)#19 | 1,985,710(0.01%)#1,300 |
| 20. | Marion | 146 | 20,695(0.71%)#20 | 1,985,710(0.01%)#1,472 |
| 21. | Eden | 144 | 20,695(0.70%)#21 | 1,985,710(0.01%)#1,487 |
| 22. | Waxhaw | 140 | 20,695(0.68%)#22 | 1,985,710(0.01%)#1,520 |
| 23. | Huntersville | 134 | 20,695(0.65%)#23 | 1,985,710(0.01%)#1,566 |
| 24. | Gastonia | 124 | 20,695(0.60%)#24 | 1,985,710(0.01%)#1,663 |
| 25. | Havelock | 123 | 20,695(0.59%)#25 | 1,985,710(0.01%)#1,676 |
| 26. | Rocky Mount | 120 | 20,695(0.58%)#26 | 1,985,710(0.01%)#1,705 |
| 27. | Fuquay Varina | 120 | 20,695(0.58%)#27 | 1,985,710(0.01%)#1,707 |
| 28. | Wake Forest | 105 | 20,695(0.51%)#28 | 1,985,710(0.01%)#1,847 |
| 29. | Asheboro | 97 | 20,695(0.47%)#29 | 1,985,710(0.00%)#1,950 |
| 30. | Pinehurst | 95 | 20,695(0.46%)#30 | 1,985,710(0.00%)#1,987 |
| 31. | Morrisville | 94 | 20,695(0.45%)#31 | 1,985,710(0.00%)#1,993 |
| 32. | Spring Lake | 94 | 20,695(0.45%)#32 | 1,985,710(0.00%)#2,000 |
| 33. | Lumberton | 93 | 20,695(0.45%)#33 | 1,985,710(0.00%)#2,021 |
| 34. | Granite Falls | 93 | 20,695(0.45%)#34 | 1,985,710(0.00%)#2,030 |
| 35. | Apex | 89 | 20,695(0.43%)#35 | 1,985,710(0.00%)#2,074 |
| 36. | Wadesboro | 89 | 20,695(0.43%)#36 | 1,985,710(0.00%)#2,084 |
| 37. | Winterville | 85 | 20,695(0.41%)#37 | 1,985,710(0.00%)#2,129 |
| 38. | Anderson Creek | 81 | 20,695(0.39%)#38 | 1,985,710(0.00%)#2,195 |
| 39. | Henderson | 80 | 20,695(0.39%)#39 | 1,985,710(0.00%)#2,212 |
| 40. | Royal Pines | 78 | 20,695(0.38%)#40 | 1,985,710(0.00%)#2,260 |
| 41. | Half Moon | 73 | 20,695(0.35%)#41 | 1,985,710(0.00%)#2,342 |
| 42. | Mount Holly | 72 | 20,695(0.35%)#42 | 1,985,710(0.00%)#2,366 |
| 43. | Spout Springs | 68 | 20,695(0.33%)#43 | 1,985,710(0.00%)#2,445 |
| 44. | Matthews | 67 | 20,695(0.32%)#44 | 1,985,710(0.00%)#2,458 |
| 45. | Leland | 67 | 20,695(0.32%)#45 | 1,985,710(0.00%)#2,461 |
| 46. | Ahoskie | 66 | 20,695(0.32%)#46 | 1,985,710(0.00%)#2,486 |
| 47. | Fletcher | 65 | 20,695(0.31%)#47 | 1,985,710(0.00%)#2,505 |
| 48. | Elizabeth City | 55 | 20,695(0.27%)#48 | 1,985,710(0.00%)#2,727 |
| 49. | Trinity | 55 | 20,695(0.27%)#49 | 1,985,710(0.00%)#2,739 |
| 50. | New Bern | 54 | 20,695(0.26%)#50 | 1,985,710(0.00%)#2,752 |
| 51. | Cornelius | 53 | 20,695(0.26%)#51 | 1,985,710(0.00%)#2,788 |
| 52. | Piney Green | 52 | 20,695(0.25%)#52 | 1,985,710(0.00%)#2,831 |
| 53. | Aberdeen | 52 | 20,695(0.25%)#53 | 1,985,710(0.00%)#2,835 |
| 54. | James City | 50 | 20,695(0.24%)#54 | 1,985,710(0.00%)#2,894 |
| 55. | Wingate | 50 | 20,695(0.24%)#55 | 1,985,710(0.00%)#2,900 |
| 56. | Sanford | 49 | 20,695(0.24%)#56 | 1,985,710(0.00%)#2,909 |
| 57. | Swansboro | 48 | 20,695(0.23%)#57 | 1,985,710(0.00%)#2,959 |
| 58. | Albemarle | 47 | 20,695(0.23%)#58 | 1,985,710(0.00%)#2,978 |
| 59. | Oak Ridge | 47 | 20,695(0.23%)#59 | 1,985,710(0.00%)#2,987 |
| 60. | Roanoke Rapids | 46 | 20,695(0.22%)#60 | 1,985,710(0.00%)#3,006 |
| 61. | Monroe | 45 | 20,695(0.22%)#61 | 1,985,710(0.00%)#3,027 |
| 62. | Roxboro | 45 | 20,695(0.22%)#62 | 1,985,710(0.00%)#3,047 |
| 63. | Stokesdale | 44 | 20,695(0.21%)#63 | 1,985,710(0.00%)#3,085 |
| 64. | Harrisburg | 43 | 20,695(0.21%)#64 | 1,985,710(0.00%)#3,108 |
| 65. | Dallas | 43 | 20,695(0.21%)#65 | 1,985,710(0.00%)#3,128 |
| 66. | Millers Creek | 42 | 20,695(0.20%)#66 | 1,985,710(0.00%)#3,183 |
| 67. | Goldsboro | 41 | 20,695(0.20%)#67 | 1,985,710(0.00%)#3,187 |
| 68. | Mooresville | 40 | 20,695(0.19%)#68 | 1,985,710(0.00%)#3,232 |
| 69. | Southern Pines | 39 | 20,695(0.19%)#69 | 1,985,710(0.00%)#3,285 |
| 70. | Belmont | 39 | 20,695(0.19%)#70 | 1,985,710(0.00%)#3,288 |
| 71. | Boiling Springs | 39 | 20,695(0.19%)#71 | 1,985,710(0.00%)#3,306 |
| 72. | Edneyville | 39 | 20,695(0.19%)#72 | 1,985,710(0.00%)#3,312 |
| 73. | Smithfield | 37 | 20,695(0.18%)#73 | 1,985,710(0.00%)#3,387 |
| 74. | Lowell | 37 | 20,695(0.18%)#74 | 1,985,710(0.00%)#3,406 |
| 75. | Knightdale | 35 | 20,695(0.17%)#75 | 1,985,710(0.00%)#3,464 |
| 76. | Kings Grant | 35 | 20,695(0.17%)#76 | 1,985,710(0.00%)#3,485 |
| 77. | Elroy | 35 | 20,695(0.17%)#77 | 1,985,710(0.00%)#3,500 |
| 78. | Windsor | 35 | 20,695(0.17%)#78 | 1,985,710(0.00%)#3,501 |
| 79. | Hope Mills | 33 | 20,695(0.16%)#79 | 1,985,710(0.00%)#3,566 |
| 80. | Hickory | 32 | 20,695(0.15%)#80 | 1,985,710(0.00%)#3,599 |
| 81. | Brices Creek | 32 | 20,695(0.15%)#81 | 1,985,710(0.00%)#3,646 |
| 82. | Southern Shores | 32 | 20,695(0.15%)#82 | 1,985,710(0.00%)#3,647 |
| 83. | Mint Hill | 29 | 20,695(0.14%)#83 | 1,985,710(0.00%)#3,783 |
| 84. | Pineville | 29 | 20,695(0.14%)#84 | 1,985,710(0.00%)#3,805 |
| 85. | Valdese | 29 | 20,695(0.14%)#85 | 1,985,710(0.00%)#3,826 |
| 86. | Carrboro | 28 | 20,695(0.14%)#86 | 1,985,710(0.00%)#3,849 |
| 87. | Mills River | 28 | 20,695(0.14%)#87 | 1,985,710(0.00%)#3,873 |
| 88. | Indian Trail | 27 | 20,695(0.13%)#88 | 1,985,710(0.00%)#3,900 |
| 89. | Salisbury | 27 | 20,695(0.13%)#89 | 1,985,710(0.00%)#3,902 |
| 90. | Gibsonville | 26 | 20,695(0.13%)#90 | 1,985,710(0.00%)#3,998 |
| 91. | Hillsborough | 24 | 20,695(0.12%)#91 | 1,985,710(0.00%)#4,121 |
| 92. | Rhodhiss | 24 | 20,695(0.12%)#92 | 1,985,710(0.00%)#4,153 |
| 93. | Rockfish | 23 | 20,695(0.11%)#93 | 1,985,710(0.00%)#4,199 |
| 94. | Kernersville | 22 | 20,695(0.11%)#94 | 1,985,710(0.00%)#4,223 |
| 95. | Mar Mac | 22 | 20,695(0.11%)#95 | 1,985,710(0.00%)#4,267 |
| 96. | Clayton | 21 | 20,695(0.10%)#96 | 1,985,710(0.00%)#4,293 |
| 97. | Sunset Beach | 21 | 20,695(0.10%)#97 | 1,985,710(0.00%)#4,349 |
| 98. | Thomasville | 20 | 20,695(0.10%)#98 | 1,985,710(0.00%)#4,374 |
| 99. | Norwood | 20 | 20,695(0.10%)#99 | 1,985,710(0.00%)#4,424 |
| 100. | Wesley Chapel | 19 | 20,695(0.09%)#100 | 1,985,710(0.00%)#4,475 |
Common Questions
What are the Top 10 Cities with the Most Immigrants from Philippines in North Carolina?
Top 10 Cities with the Most Immigrants from Philippines in North Carolina are:
#1
2,163
#2
1,951
#3
1,108
#4
912
#5
855
#6
657
#7
512
#8
485
#9
328
#10
288
What city has the Most Immigrants from Philippines in North Carolina?
Raleigh has the Most Immigrants from Philippines in North Carolina with 2,163.
What is the Total Immigrants from Philippines in the State of North Carolina?
Total Immigrants from Philippines in North Carolina is 20,695.
What is the Total Immigrants from Philippines in the United States?
Total Immigrants from Philippines in the United States is 1,985,710.