Cities with the Most Immigrants from Philippines in South Carolina
RELATED REPORTS & OPTIONS
Philippines
South Carolina
Compare Cities
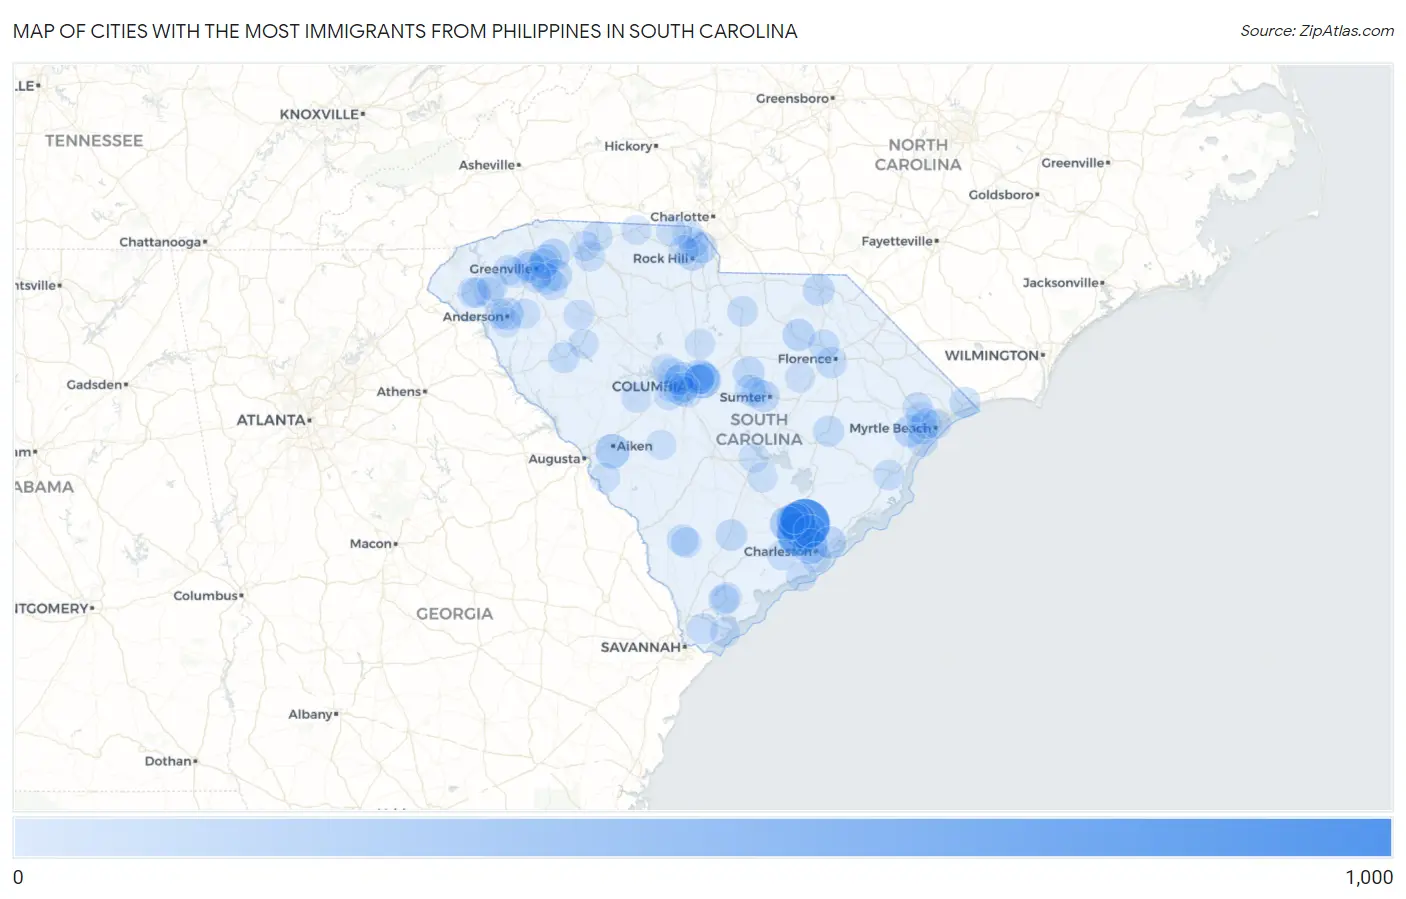
Map of Cities with the Most Immigrants from Philippines in South Carolina
0
1,000
Cities with the Most Immigrants from Philippines in South Carolina
| City | Philippines | vs State | vs National | |
| 1. | Goose Creek | 915 | 11,031(8.29%)#1 | 1,985,710(0.05%)#324 |
| 2. | North Charleston | 604 | 11,031(5.48%)#2 | 1,985,710(0.03%)#475 |
| 3. | Ladson | 389 | 11,031(3.53%)#3 | 1,985,710(0.02%)#679 |
| 4. | Columbia | 301 | 11,031(2.73%)#4 | 1,985,710(0.02%)#818 |
| 5. | Charleston | 233 | 11,031(2.11%)#5 | 1,985,710(0.01%)#1,015 |
| 6. | Summerville | 221 | 11,031(2.00%)#6 | 1,985,710(0.01%)#1,058 |
| 7. | Aiken | 197 | 11,031(1.79%)#7 | 1,985,710(0.01%)#1,181 |
| 8. | Carolina Forest | 163 | 11,031(1.48%)#8 | 1,985,710(0.01%)#1,370 |
| 9. | St Andrews | 152 | 11,031(1.38%)#9 | 1,985,710(0.01%)#1,432 |
| 10. | Hanahan | 117 | 11,031(1.06%)#10 | 1,985,710(0.01%)#1,731 |
| 11. | Greer | 111 | 11,031(1.01%)#11 | 1,985,710(0.01%)#1,780 |
| 12. | Anderson | 105 | 11,031(0.95%)#12 | 1,985,710(0.01%)#1,850 |
| 13. | Mount Pleasant | 104 | 11,031(0.94%)#13 | 1,985,710(0.01%)#1,858 |
| 14. | Hartsville | 102 | 11,031(0.92%)#14 | 1,985,710(0.01%)#1,895 |
| 15. | Greenville | 94 | 11,031(0.85%)#15 | 1,985,710(0.00%)#1,991 |
| 16. | Bucksport | 94 | 11,031(0.85%)#16 | 1,985,710(0.00%)#2,010 |
| 17. | Rock Hill | 84 | 11,031(0.76%)#17 | 1,985,710(0.00%)#2,139 |
| 18. | Taylors | 84 | 11,031(0.76%)#18 | 1,985,710(0.00%)#2,144 |
| 19. | Cheraw | 79 | 11,031(0.72%)#19 | 1,985,710(0.00%)#2,238 |
| 20. | Fort Mill | 76 | 11,031(0.69%)#20 | 1,985,710(0.00%)#2,283 |
| 21. | Rembert | 75 | 11,031(0.68%)#21 | 1,985,710(0.00%)#2,319 |
| 22. | Five Forks | 72 | 11,031(0.65%)#22 | 1,985,710(0.00%)#2,363 |
| 23. | Sumter | 71 | 11,031(0.64%)#23 | 1,985,710(0.00%)#2,387 |
| 24. | Dentsville | 71 | 11,031(0.64%)#24 | 1,985,710(0.00%)#2,395 |
| 25. | Walterboro | 71 | 11,031(0.64%)#25 | 1,985,710(0.00%)#2,401 |
| 26. | Mauldin | 57 | 11,031(0.52%)#26 | 1,985,710(0.00%)#2,682 |
| 27. | Kingstree | 54 | 11,031(0.49%)#27 | 1,985,710(0.00%)#2,772 |
| 28. | Berea | 52 | 11,031(0.47%)#28 | 1,985,710(0.00%)#2,829 |
| 29. | Florence | 51 | 11,031(0.46%)#29 | 1,985,710(0.00%)#2,846 |
| 30. | Hampton | 51 | 11,031(0.46%)#30 | 1,985,710(0.00%)#2,865 |
| 31. | Irmo | 49 | 11,031(0.44%)#31 | 1,985,710(0.00%)#2,923 |
| 32. | Stateburg | 49 | 11,031(0.44%)#32 | 1,985,710(0.00%)#2,937 |
| 33. | Socastee | 48 | 11,031(0.44%)#33 | 1,985,710(0.00%)#2,943 |
| 34. | Red Hill | 47 | 11,031(0.43%)#34 | 1,985,710(0.00%)#2,980 |
| 35. | Oak Grove | 44 | 11,031(0.40%)#35 | 1,985,710(0.00%)#3,072 |
| 36. | Woodfield | 44 | 11,031(0.40%)#36 | 1,985,710(0.00%)#3,076 |
| 37. | Darlington | 42 | 11,031(0.38%)#37 | 1,985,710(0.00%)#3,167 |
| 38. | Little River | 41 | 11,031(0.37%)#38 | 1,985,710(0.00%)#3,209 |
| 39. | Greenwood | 40 | 11,031(0.36%)#39 | 1,985,710(0.00%)#3,241 |
| 40. | Capitol View | 38 | 11,031(0.34%)#40 | 1,985,710(0.00%)#3,364 |
| 41. | Garden City | 35 | 11,031(0.32%)#41 | 1,985,710(0.00%)#3,477 |
| 42. | Beaufort | 32 | 11,031(0.29%)#42 | 1,985,710(0.00%)#3,614 |
| 43. | Georgetown | 31 | 11,031(0.28%)#43 | 1,985,710(0.00%)#3,685 |
| 44. | Burton | 30 | 11,031(0.27%)#44 | 1,985,710(0.00%)#3,749 |
| 45. | Parker | 28 | 11,031(0.25%)#45 | 1,985,710(0.00%)#3,860 |
| 46. | Bluffton | 27 | 11,031(0.24%)#46 | 1,985,710(0.00%)#3,905 |
| 47. | Forestbrook | 26 | 11,031(0.24%)#47 | 1,985,710(0.00%)#4,004 |
| 48. | Kershaw | 26 | 11,031(0.24%)#48 | 1,985,710(0.00%)#4,029 |
| 49. | Hollywood | 23 | 11,031(0.21%)#49 | 1,985,710(0.00%)#4,192 |
| 50. | Varnville | 23 | 11,031(0.21%)#50 | 1,985,710(0.00%)#4,206 |
| 51. | Spartanburg | 22 | 11,031(0.20%)#51 | 1,985,710(0.00%)#4,222 |
| 52. | James Island | 22 | 11,031(0.20%)#52 | 1,985,710(0.00%)#4,239 |
| 53. | Simpsonville | 21 | 11,031(0.19%)#53 | 1,985,710(0.00%)#4,295 |
| 54. | Hilton Head Island | 20 | 11,031(0.18%)#54 | 1,985,710(0.00%)#4,371 |
| 55. | Wade Hampton | 19 | 11,031(0.17%)#55 | 1,985,710(0.00%)#4,455 |
| 56. | Valley Falls | 18 | 11,031(0.16%)#56 | 1,985,710(0.00%)#4,569 |
| 57. | Seneca | 17 | 11,031(0.15%)#57 | 1,985,710(0.00%)#4,639 |
| 58. | Conway | 15 | 11,031(0.14%)#58 | 1,985,710(0.00%)#4,814 |
| 59. | Easley | 15 | 11,031(0.14%)#59 | 1,985,710(0.00%)#4,817 |
| 60. | Red Bank | 15 | 11,031(0.14%)#60 | 1,985,710(0.00%)#4,834 |
| 61. | Arial | 15 | 11,031(0.14%)#61 | 1,985,710(0.00%)#4,886 |
| 62. | Clemson | 14 | 11,031(0.13%)#62 | 1,985,710(0.00%)#4,920 |
| 63. | Cayce | 14 | 11,031(0.13%)#63 | 1,985,710(0.00%)#4,926 |
| 64. | Batesburg Leesville | 14 | 11,031(0.13%)#64 | 1,985,710(0.00%)#4,960 |
| 65. | Lake Wylie | 13 | 11,031(0.12%)#65 | 1,985,710(0.00%)#5,051 |
| 66. | Laurens | 13 | 11,031(0.12%)#66 | 1,985,710(0.00%)#5,066 |
| 67. | Sangaree | 13 | 11,031(0.12%)#67 | 1,985,710(0.00%)#5,069 |
| 68. | Cherryvale | 13 | 11,031(0.12%)#68 | 1,985,710(0.00%)#5,122 |
| 69. | Utica | 13 | 11,031(0.12%)#69 | 1,985,710(0.00%)#5,137 |
| 70. | Gantt | 12 | 11,031(0.11%)#70 | 1,985,710(0.00%)#5,184 |
| 71. | Tega Cay | 12 | 11,031(0.11%)#71 | 1,985,710(0.00%)#5,189 |
| 72. | Centerville | 12 | 11,031(0.11%)#72 | 1,985,710(0.00%)#5,207 |
| 73. | Central | 12 | 11,031(0.11%)#73 | 1,985,710(0.00%)#5,217 |
| 74. | Clover | 11 | 11,031(0.10%)#74 | 1,985,710(0.00%)#5,345 |
| 75. | Mayo | 11 | 11,031(0.10%)#75 | 1,985,710(0.00%)#5,402 |
| 76. | Springdale | 10 | 11,031(0.09%)#76 | 1,985,710(0.00%)#5,542 |
| 77. | Newport | 9 | 11,031(0.08%)#77 | 1,985,710(0.00%)#5,663 |
| 78. | Forest Acres | 8 | 11,031(0.07%)#78 | 1,985,710(0.00%)#5,793 |
| 79. | Belton | 8 | 11,031(0.07%)#79 | 1,985,710(0.00%)#5,832 |
| 80. | Sandy Springs | 8 | 11,031(0.07%)#80 | 1,985,710(0.00%)#5,901 |
| 81. | Arcadia Lakes | 8 | 11,031(0.07%)#81 | 1,985,710(0.00%)#5,903 |
| 82. | Lexington | 6 | 11,031(0.05%)#82 | 1,985,710(0.00%)#6,114 |
| 83. | Lake Murray Of Richland | 6 | 11,031(0.05%)#83 | 1,985,710(0.00%)#6,150 |
| 84. | Santee | 6 | 11,031(0.05%)#84 | 1,985,710(0.00%)#6,255 |
| 85. | Seven Oaks | 5 | 11,031(0.05%)#85 | 1,985,710(0.00%)#6,330 |
| 86. | Holly Hill | 5 | 11,031(0.05%)#86 | 1,985,710(0.00%)#6,445 |
| 87. | Cash | 5 | 11,031(0.05%)#87 | 1,985,710(0.00%)#6,501 |
| 88. | Kiawah Island | 4 | 11,031(0.04%)#88 | 1,985,710(0.00%)#6,598 |
| 89. | Lynchburg | 4 | 11,031(0.04%)#89 | 1,985,710(0.00%)#6,743 |
| 90. | Homeland Park | 3 | 11,031(0.03%)#90 | 1,985,710(0.00%)#6,778 |
| 91. | Ridgeway | 3 | 11,031(0.03%)#91 | 1,985,710(0.00%)#7,013 |
| 92. | Blacksburg | 2 | 11,031(0.02%)#92 | 1,985,710(0.00%)#7,095 |
| 93. | Jackson | 2 | 11,031(0.02%)#93 | 1,985,710(0.00%)#7,103 |
| 94. | Cross Hill | 2 | 11,031(0.02%)#94 | 1,985,710(0.00%)#7,236 |
| 95. | Salley | 2 | 11,031(0.02%)#95 | 1,985,710(0.00%)#7,286 |
| 96. | Myrtle Beach | 1 | 11,031(0.01%)#96 | 1,985,710(0.00%)#7,333 |
| 97. | West Columbia | 1 | 11,031(0.01%)#97 | 1,985,710(0.00%)#7,337 |
Common Questions
What are the Top 10 Cities with the Most Immigrants from Philippines in South Carolina?
Top 10 Cities with the Most Immigrants from Philippines in South Carolina are:
#1
915
#2
604
#3
389
#4
301
#5
233
#6
221
#7
197
#8
152
#9
117
#10
111
What city has the Most Immigrants from Philippines in South Carolina?
Goose Creek has the Most Immigrants from Philippines in South Carolina with 915.
What is the Total Immigrants from Philippines in the State of South Carolina?
Total Immigrants from Philippines in South Carolina is 11,031.
What is the Total Immigrants from Philippines in the United States?
Total Immigrants from Philippines in the United States is 1,985,710.