Cities with the Most Immigrants from Philippines in Oklahoma
RELATED REPORTS & OPTIONS
Philippines
Oklahoma
Compare Cities
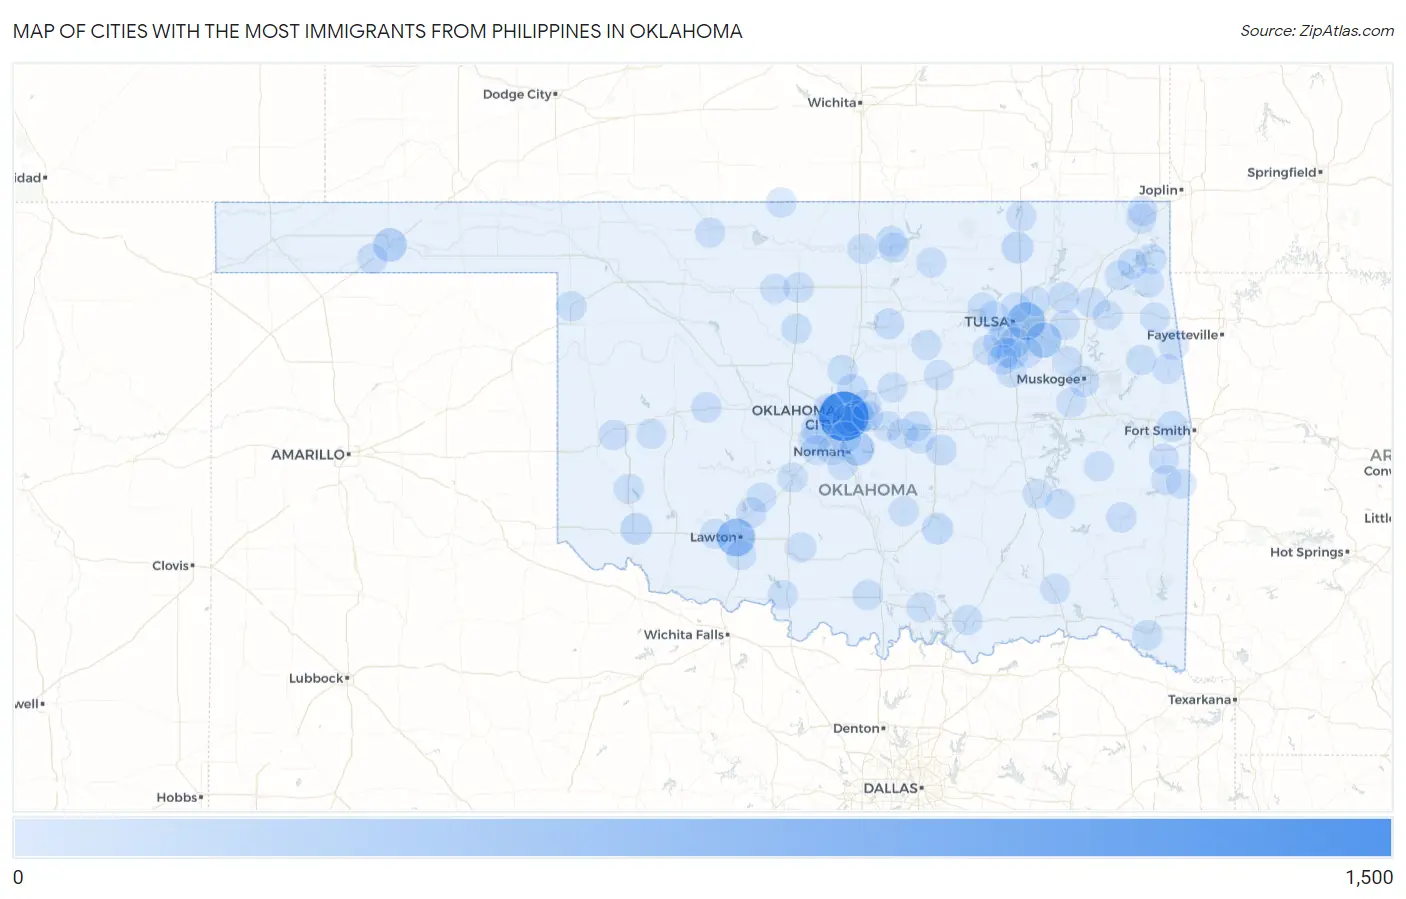
Map of Cities with the Most Immigrants from Philippines in Oklahoma
0
1,500
Cities with the Most Immigrants from Philippines in Oklahoma
| City | Philippines | vs State | vs National | |
| 1. | Oklahoma City | 1,237 | 5,671(21.81%)#1 | 1,985,710(0.06%)#236 |
| 2. | Lawton | 486 | 5,671(8.57%)#2 | 1,985,710(0.02%)#565 |
| 3. | Tulsa | 469 | 5,671(8.27%)#3 | 1,985,710(0.02%)#579 |
| 4. | Broken Arrow | 312 | 5,671(5.50%)#4 | 1,985,710(0.02%)#795 |
| 5. | Midwest City | 242 | 5,671(4.27%)#5 | 1,985,710(0.01%)#987 |
| 6. | Norman | 241 | 5,671(4.25%)#6 | 1,985,710(0.01%)#994 |
| 7. | Guymon | 205 | 5,671(3.61%)#7 | 1,985,710(0.01%)#1,129 |
| 8. | Del City | 160 | 5,671(2.82%)#8 | 1,985,710(0.01%)#1,383 |
| 9. | Altus | 112 | 5,671(1.97%)#9 | 1,985,710(0.01%)#1,770 |
| 10. | Bartlesville | 105 | 5,671(1.85%)#10 | 1,985,710(0.01%)#1,848 |
| 11. | Moore | 103 | 5,671(1.82%)#11 | 1,985,710(0.01%)#1,869 |
| 12. | Ada | 85 | 5,671(1.50%)#12 | 1,985,710(0.00%)#2,123 |
| 13. | Edmond | 71 | 5,671(1.25%)#13 | 1,985,710(0.00%)#2,385 |
| 14. | Glenpool | 54 | 5,671(0.95%)#14 | 1,985,710(0.00%)#2,762 |
| 15. | Muskogee | 51 | 5,671(0.90%)#15 | 1,985,710(0.00%)#2,847 |
| 16. | Claremore | 48 | 5,671(0.85%)#16 | 1,985,710(0.00%)#2,944 |
| 17. | Choctaw | 48 | 5,671(0.85%)#17 | 1,985,710(0.00%)#2,949 |
| 18. | Stillwater | 42 | 5,671(0.74%)#18 | 1,985,710(0.00%)#3,143 |
| 19. | Muldrow | 42 | 5,671(0.74%)#19 | 1,985,710(0.00%)#3,178 |
| 20. | Sapulpa | 41 | 5,671(0.72%)#20 | 1,985,710(0.00%)#3,196 |
| 21. | Ponca City | 38 | 5,671(0.67%)#21 | 1,985,710(0.00%)#3,331 |
| 22. | Jenks | 37 | 5,671(0.65%)#22 | 1,985,710(0.00%)#3,376 |
| 23. | Seminole | 36 | 5,671(0.63%)#23 | 1,985,710(0.00%)#3,434 |
| 24. | Mustang | 34 | 5,671(0.60%)#24 | 1,985,710(0.00%)#3,523 |
| 25. | Warr Acres | 34 | 5,671(0.60%)#25 | 1,985,710(0.00%)#3,534 |
| 26. | Tuttle | 34 | 5,671(0.60%)#26 | 1,985,710(0.00%)#3,538 |
| 27. | Idabel | 28 | 5,671(0.49%)#27 | 1,985,710(0.00%)#3,874 |
| 28. | Elgin | 26 | 5,671(0.46%)#28 | 1,985,710(0.00%)#4,020 |
| 29. | Elk City | 22 | 5,671(0.39%)#29 | 1,985,710(0.00%)#4,242 |
| 30. | Talihina | 22 | 5,671(0.39%)#30 | 1,985,710(0.00%)#4,279 |
| 31. | Goodwell | 21 | 5,671(0.37%)#31 | 1,985,710(0.00%)#4,361 |
| 32. | Weatherford | 20 | 5,671(0.35%)#32 | 1,985,710(0.00%)#4,390 |
| 33. | Panama | 20 | 5,671(0.35%)#33 | 1,985,710(0.00%)#4,436 |
| 34. | Cookson | 20 | 5,671(0.35%)#34 | 1,985,710(0.00%)#4,439 |
| 35. | Newcastle | 19 | 5,671(0.34%)#35 | 1,985,710(0.00%)#4,466 |
| 36. | Shattuck | 17 | 5,671(0.30%)#36 | 1,985,710(0.00%)#4,693 |
| 37. | Sand Springs | 16 | 5,671(0.28%)#37 | 1,985,710(0.00%)#4,715 |
| 38. | Durant | 14 | 5,671(0.25%)#38 | 1,985,710(0.00%)#4,918 |
| 39. | Hennessey | 14 | 5,671(0.25%)#39 | 1,985,710(0.00%)#4,990 |
| 40. | Enid | 13 | 5,671(0.23%)#40 | 1,985,710(0.00%)#5,032 |
| 41. | Bixby | 13 | 5,671(0.23%)#41 | 1,985,710(0.00%)#5,038 |
| 42. | Guthrie | 13 | 5,671(0.23%)#42 | 1,985,710(0.00%)#5,063 |
| 43. | Grove | 13 | 5,671(0.23%)#43 | 1,985,710(0.00%)#5,085 |
| 44. | Lone Grove | 11 | 5,671(0.19%)#44 | 1,985,710(0.00%)#5,359 |
| 45. | Tonkawa | 11 | 5,671(0.19%)#45 | 1,985,710(0.00%)#5,379 |
| 46. | Welling | 11 | 5,671(0.19%)#46 | 1,985,710(0.00%)#5,428 |
| 47. | Shawnee | 10 | 5,671(0.18%)#47 | 1,985,710(0.00%)#5,443 |
| 48. | Goldsby | 10 | 5,671(0.18%)#48 | 1,985,710(0.00%)#5,538 |
| 49. | Antlers | 10 | 5,671(0.18%)#49 | 1,985,710(0.00%)#5,547 |
| 50. | Oakhurst | 10 | 5,671(0.18%)#50 | 1,985,710(0.00%)#5,552 |
| 51. | Waurika | 10 | 5,671(0.18%)#51 | 1,985,710(0.00%)#5,556 |
| 52. | Cleora | 10 | 5,671(0.18%)#52 | 1,985,710(0.00%)#5,561 |
| 53. | Owasso | 9 | 5,671(0.16%)#53 | 1,985,710(0.00%)#5,595 |
| 54. | Mcloud | 9 | 5,671(0.16%)#54 | 1,985,710(0.00%)#5,662 |
| 55. | Stroud | 9 | 5,671(0.16%)#55 | 1,985,710(0.00%)#5,687 |
| 56. | Westville | 9 | 5,671(0.16%)#56 | 1,985,710(0.00%)#5,720 |
| 57. | Geronimo | 9 | 5,671(0.16%)#57 | 1,985,710(0.00%)#5,736 |
| 58. | Duncan | 8 | 5,671(0.14%)#58 | 1,985,710(0.00%)#5,772 |
| 59. | Cushing | 8 | 5,671(0.14%)#59 | 1,985,710(0.00%)#5,806 |
| 60. | Alva | 8 | 5,671(0.14%)#60 | 1,985,710(0.00%)#5,824 |
| 61. | Turley | 8 | 5,671(0.14%)#61 | 1,985,710(0.00%)#5,846 |
| 62. | Langley | 8 | 5,671(0.14%)#62 | 1,985,710(0.00%)#5,915 |
| 63. | Pryor Creek | 7 | 5,671(0.12%)#63 | 1,985,710(0.00%)#5,955 |
| 64. | Copan | 7 | 5,671(0.12%)#64 | 1,985,710(0.00%)#6,074 |
| 65. | Kinta | 7 | 5,671(0.12%)#65 | 1,985,710(0.00%)#6,098 |
| 66. | Miami | 6 | 5,671(0.11%)#66 | 1,985,710(0.00%)#6,126 |
| 67. | Jones | 6 | 5,671(0.11%)#67 | 1,985,710(0.00%)#6,188 |
| 68. | Mccord | 6 | 5,671(0.11%)#68 | 1,985,710(0.00%)#6,231 |
| 69. | Granite | 6 | 5,671(0.11%)#69 | 1,985,710(0.00%)#6,241 |
| 70. | Poteau | 5 | 5,671(0.09%)#70 | 1,985,710(0.00%)#6,344 |
| 71. | Stratford | 5 | 5,671(0.09%)#71 | 1,985,710(0.00%)#6,449 |
| 72. | Flint Creek | 5 | 5,671(0.09%)#72 | 1,985,710(0.00%)#6,470 |
| 73. | Stilwell | 4 | 5,671(0.07%)#73 | 1,985,710(0.00%)#6,557 |
| 74. | Kiefer | 4 | 5,671(0.07%)#74 | 1,985,710(0.00%)#6,591 |
| 75. | Inola | 4 | 5,671(0.07%)#75 | 1,985,710(0.00%)#6,608 |
| 76. | Fairfax | 4 | 5,671(0.07%)#76 | 1,985,710(0.00%)#6,655 |
| 77. | Oakland | 4 | 5,671(0.07%)#77 | 1,985,710(0.00%)#6,656 |
| 78. | Beggs | 4 | 5,671(0.07%)#78 | 1,985,710(0.00%)#6,657 |
| 79. | Wellston | 4 | 5,671(0.07%)#79 | 1,985,710(0.00%)#6,689 |
| 80. | Mcalester | 3 | 5,671(0.05%)#80 | 1,985,710(0.00%)#6,762 |
| 81. | Cache | 3 | 5,671(0.05%)#81 | 1,985,710(0.00%)#6,800 |
| 82. | Commerce | 3 | 5,671(0.05%)#82 | 1,985,710(0.00%)#6,828 |
| 83. | Burns Flat | 3 | 5,671(0.05%)#83 | 1,985,710(0.00%)#6,843 |
| 84. | Locust Grove | 3 | 5,671(0.05%)#84 | 1,985,710(0.00%)#6,893 |
| 85. | Mounds | 3 | 5,671(0.05%)#85 | 1,985,710(0.00%)#6,914 |
| 86. | Kellyville | 3 | 5,671(0.05%)#86 | 1,985,710(0.00%)#6,915 |
| 87. | Haileyville | 3 | 5,671(0.05%)#87 | 1,985,710(0.00%)#6,959 |
| 88. | Lahoma | 3 | 5,671(0.05%)#88 | 1,985,710(0.00%)#6,960 |
| 89. | Porter | 3 | 5,671(0.05%)#89 | 1,985,710(0.00%)#6,968 |
| 90. | Earlsboro | 3 | 5,671(0.05%)#90 | 1,985,710(0.00%)#6,978 |
| 91. | Bridge Creek | 3 | 5,671(0.05%)#91 | 1,985,710(0.00%)#6,985 |
| 92. | Manchester | 3 | 5,671(0.05%)#92 | 1,985,710(0.00%)#7,028 |
| 93. | Monroe | 3 | 5,671(0.05%)#93 | 1,985,710(0.00%)#7,030 |
| 94. | Chickasha | 2 | 5,671(0.04%)#94 | 1,985,710(0.00%)#7,039 |
| 95. | Jay | 2 | 5,671(0.04%)#95 | 1,985,710(0.00%)#7,071 |
| 96. | Johnson | 2 | 5,671(0.04%)#96 | 1,985,710(0.00%)#7,198 |
| 97. | Cyril | 2 | 5,671(0.04%)#97 | 1,985,710(0.00%)#7,208 |
| 98. | Prue | 2 | 5,671(0.04%)#98 | 1,985,710(0.00%)#7,261 |
| 99. | Oktaha | 2 | 5,671(0.04%)#99 | 1,985,710(0.00%)#7,298 |
| 100. | Cottonwood | 2 | 5,671(0.04%)#100 | 1,985,710(0.00%)#7,327 |
Common Questions
What are the Top 10 Cities with the Most Immigrants from Philippines in Oklahoma?
Top 10 Cities with the Most Immigrants from Philippines in Oklahoma are:
#1
1,237
#2
486
#3
469
#4
312
#5
242
#6
241
#7
205
#8
160
#9
112
#10
105
What city has the Most Immigrants from Philippines in Oklahoma?
Oklahoma City has the Most Immigrants from Philippines in Oklahoma with 1,237.
What is the Total Immigrants from Philippines in the State of Oklahoma?
Total Immigrants from Philippines in Oklahoma is 5,671.
What is the Total Immigrants from Philippines in the United States?
Total Immigrants from Philippines in the United States is 1,985,710.