Cities with the Most Immigrants from Philippines in Missouri
RELATED REPORTS & OPTIONS
Philippines
Missouri
Compare Cities
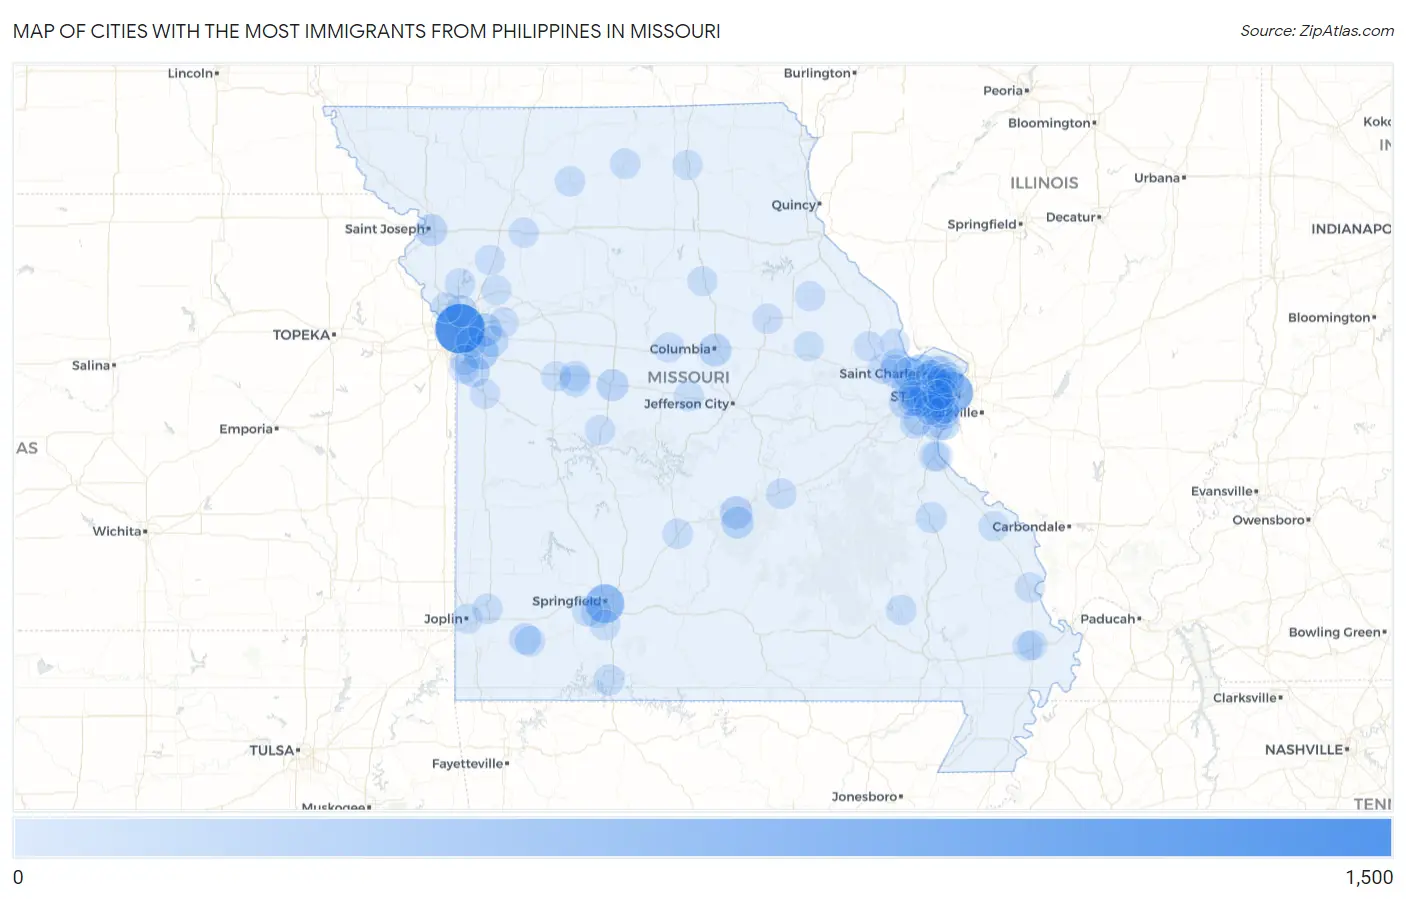
Map of Cities with the Most Immigrants from Philippines in Missouri
0
1,500
Cities with the Most Immigrants from Philippines in Missouri
| City | Philippines | vs State | vs National | |
| 1. | Kansas City | 1,193 | 10,873(10.97%)#1 | 1,985,710(0.06%)#244 |
| 2. | St Louis | 674 | 10,873(6.20%)#2 | 1,985,710(0.03%)#426 |
| 3. | Springfield | 516 | 10,873(4.75%)#3 | 1,985,710(0.03%)#543 |
| 4. | Maryland Heights | 419 | 10,873(3.85%)#4 | 1,985,710(0.02%)#643 |
| 5. | Lee S Summit | 249 | 10,873(2.29%)#5 | 1,985,710(0.01%)#965 |
| 6. | St Charles | 241 | 10,873(2.22%)#6 | 1,985,710(0.01%)#995 |
| 7. | St Peters | 224 | 10,873(2.06%)#7 | 1,985,710(0.01%)#1,044 |
| 8. | Independence | 202 | 10,873(1.86%)#8 | 1,985,710(0.01%)#1,142 |
| 9. | O Fallon | 183 | 10,873(1.68%)#9 | 1,985,710(0.01%)#1,254 |
| 10. | Columbia | 162 | 10,873(1.49%)#10 | 1,985,710(0.01%)#1,372 |
| 11. | St Robert | 156 | 10,873(1.43%)#11 | 1,985,710(0.01%)#1,409 |
| 12. | Oakville | 139 | 10,873(1.28%)#12 | 1,985,710(0.01%)#1,526 |
| 13. | Fort Leonard Wood | 135 | 10,873(1.24%)#13 | 1,985,710(0.01%)#1,556 |
| 14. | Wildwood | 131 | 10,873(1.20%)#14 | 1,985,710(0.01%)#1,596 |
| 15. | Affton | 129 | 10,873(1.19%)#15 | 1,985,710(0.01%)#1,620 |
| 16. | Raymore | 127 | 10,873(1.17%)#16 | 1,985,710(0.01%)#1,637 |
| 17. | Sedalia | 123 | 10,873(1.13%)#17 | 1,985,710(0.01%)#1,673 |
| 18. | Olivette | 122 | 10,873(1.12%)#18 | 1,985,710(0.01%)#1,689 |
| 19. | St Joseph | 119 | 10,873(1.09%)#19 | 1,985,710(0.01%)#1,717 |
| 20. | Mehlville | 116 | 10,873(1.07%)#20 | 1,985,710(0.01%)#1,735 |
| 21. | Overland | 114 | 10,873(1.05%)#21 | 1,985,710(0.01%)#1,746 |
| 22. | Blue Springs | 109 | 10,873(1.00%)#22 | 1,985,710(0.01%)#1,803 |
| 23. | Pierce City | 94 | 10,873(0.86%)#23 | 1,985,710(0.00%)#2,008 |
| 24. | Hazelwood | 92 | 10,873(0.85%)#24 | 1,985,710(0.00%)#2,037 |
| 25. | Ballwin | 91 | 10,873(0.84%)#25 | 1,985,710(0.00%)#2,050 |
| 26. | Gladstone | 90 | 10,873(0.83%)#26 | 1,985,710(0.00%)#2,062 |
| 27. | University City | 85 | 10,873(0.78%)#27 | 1,985,710(0.00%)#2,120 |
| 28. | Creve Coeur | 83 | 10,873(0.76%)#28 | 1,985,710(0.00%)#2,163 |
| 29. | Whiteman Afb | 81 | 10,873(0.74%)#29 | 1,985,710(0.00%)#2,201 |
| 30. | Manchester | 72 | 10,873(0.66%)#30 | 1,985,710(0.00%)#2,365 |
| 31. | Town And Country | 72 | 10,873(0.66%)#31 | 1,985,710(0.00%)#2,373 |
| 32. | Kirkwood | 71 | 10,873(0.65%)#32 | 1,985,710(0.00%)#2,389 |
| 33. | Florissant | 68 | 10,873(0.63%)#33 | 1,985,710(0.00%)#2,434 |
| 34. | Branson | 65 | 10,873(0.60%)#34 | 1,985,710(0.00%)#2,501 |
| 35. | Farmington | 63 | 10,873(0.58%)#35 | 1,985,710(0.00%)#2,548 |
| 36. | Monett | 49 | 10,873(0.45%)#36 | 1,985,710(0.00%)#2,924 |
| 37. | Battlefield | 47 | 10,873(0.43%)#37 | 1,985,710(0.00%)#2,990 |
| 38. | Chesterfield | 46 | 10,873(0.42%)#38 | 1,985,710(0.00%)#2,995 |
| 39. | Dellwood | 44 | 10,873(0.40%)#39 | 1,985,710(0.00%)#3,088 |
| 40. | Smithville | 43 | 10,873(0.40%)#40 | 1,985,710(0.00%)#3,115 |
| 41. | Brentwood | 43 | 10,873(0.40%)#41 | 1,985,710(0.00%)#3,123 |
| 42. | St John | 43 | 10,873(0.40%)#42 | 1,985,710(0.00%)#3,127 |
| 43. | Nixa | 42 | 10,873(0.39%)#43 | 1,985,710(0.00%)#3,152 |
| 44. | Grandview | 40 | 10,873(0.37%)#44 | 1,985,710(0.00%)#3,239 |
| 45. | Webster Groves | 40 | 10,873(0.37%)#45 | 1,985,710(0.00%)#3,240 |
| 46. | Crestwood | 40 | 10,873(0.37%)#46 | 1,985,710(0.00%)#3,247 |
| 47. | Milan | 40 | 10,873(0.37%)#47 | 1,985,710(0.00%)#3,271 |
| 48. | St Ann | 38 | 10,873(0.35%)#48 | 1,985,710(0.00%)#3,338 |
| 49. | Rock Hill | 36 | 10,873(0.33%)#49 | 1,985,710(0.00%)#3,443 |
| 50. | Piedmont | 36 | 10,873(0.33%)#50 | 1,985,710(0.00%)#3,450 |
| 51. | Republic | 35 | 10,873(0.32%)#51 | 1,985,710(0.00%)#3,465 |
| 52. | Weatherby Lake | 35 | 10,873(0.32%)#52 | 1,985,710(0.00%)#3,506 |
| 53. | Rolla | 34 | 10,873(0.31%)#53 | 1,985,710(0.00%)#3,524 |
| 54. | Des Peres | 33 | 10,873(0.30%)#54 | 1,985,710(0.00%)#3,578 |
| 55. | Carthage | 32 | 10,873(0.29%)#55 | 1,985,710(0.00%)#3,612 |
| 56. | Lebanon | 32 | 10,873(0.29%)#56 | 1,985,710(0.00%)#3,613 |
| 57. | Festus | 32 | 10,873(0.29%)#57 | 1,985,710(0.00%)#3,616 |
| 58. | Trenton | 32 | 10,873(0.29%)#58 | 1,985,710(0.00%)#3,635 |
| 59. | High Ridge | 31 | 10,873(0.29%)#59 | 1,985,710(0.00%)#3,693 |
| 60. | Knob Noster | 31 | 10,873(0.29%)#60 | 1,985,710(0.00%)#3,707 |
| 61. | Wentzville | 29 | 10,873(0.27%)#61 | 1,985,710(0.00%)#3,778 |
| 62. | Raytown | 29 | 10,873(0.27%)#62 | 1,985,710(0.00%)#3,781 |
| 63. | Warrensburg | 29 | 10,873(0.27%)#63 | 1,985,710(0.00%)#3,793 |
| 64. | Troy | 29 | 10,873(0.27%)#64 | 1,985,710(0.00%)#3,802 |
| 65. | Mexico | 28 | 10,873(0.26%)#65 | 1,985,710(0.00%)#3,863 |
| 66. | Lathrop | 26 | 10,873(0.24%)#66 | 1,985,710(0.00%)#4,028 |
| 67. | Arnold | 24 | 10,873(0.22%)#67 | 1,985,710(0.00%)#4,104 |
| 68. | Perryville | 24 | 10,873(0.22%)#68 | 1,985,710(0.00%)#4,126 |
| 69. | Boonville | 23 | 10,873(0.21%)#69 | 1,985,710(0.00%)#4,185 |
| 70. | Hamilton | 22 | 10,873(0.20%)#70 | 1,985,710(0.00%)#4,270 |
| 71. | Crystal City | 21 | 10,873(0.19%)#71 | 1,985,710(0.00%)#4,343 |
| 72. | California | 21 | 10,873(0.19%)#72 | 1,985,710(0.00%)#4,344 |
| 73. | Winchester | 21 | 10,873(0.19%)#73 | 1,985,710(0.00%)#4,357 |
| 74. | Bridgeton | 20 | 10,873(0.18%)#74 | 1,985,710(0.00%)#4,391 |
| 75. | Clarkson Valley | 20 | 10,873(0.18%)#75 | 1,985,710(0.00%)#4,430 |
| 76. | Byrnes Mill | 19 | 10,873(0.17%)#76 | 1,985,710(0.00%)#4,501 |
| 77. | Montgomery City | 19 | 10,873(0.17%)#77 | 1,985,710(0.00%)#4,505 |
| 78. | Cape Girardeau | 18 | 10,873(0.17%)#78 | 1,985,710(0.00%)#4,538 |
| 79. | Sikeston | 18 | 10,873(0.17%)#79 | 1,985,710(0.00%)#4,550 |
| 80. | Joplin | 17 | 10,873(0.16%)#80 | 1,985,710(0.00%)#4,606 |
| 81. | Lincoln | 17 | 10,873(0.16%)#81 | 1,985,710(0.00%)#4,691 |
| 82. | Concord | 16 | 10,873(0.15%)#82 | 1,985,710(0.00%)#4,718 |
| 83. | Vandalia | 16 | 10,873(0.15%)#83 | 1,985,710(0.00%)#4,780 |
| 84. | Kirksville | 15 | 10,873(0.14%)#84 | 1,985,710(0.00%)#4,825 |
| 85. | Excelsior Springs | 15 | 10,873(0.14%)#85 | 1,985,710(0.00%)#4,833 |
| 86. | Moberly | 14 | 10,873(0.13%)#86 | 1,985,710(0.00%)#4,928 |
| 87. | Ellisville | 14 | 10,873(0.13%)#87 | 1,985,710(0.00%)#4,936 |
| 88. | Berkeley | 14 | 10,873(0.13%)#88 | 1,985,710(0.00%)#4,943 |
| 89. | St Paul | 14 | 10,873(0.13%)#89 | 1,985,710(0.00%)#4,978 |
| 90. | Buckner | 14 | 10,873(0.13%)#90 | 1,985,710(0.00%)#4,982 |
| 91. | St George | 14 | 10,873(0.13%)#91 | 1,985,710(0.00%)#5,003 |
| 92. | Belton | 13 | 10,873(0.12%)#92 | 1,985,710(0.00%)#5,041 |
| 93. | Weldon Spring | 13 | 10,873(0.12%)#93 | 1,985,710(0.00%)#5,097 |
| 94. | Fenton | 13 | 10,873(0.12%)#94 | 1,985,710(0.00%)#5,112 |
| 95. | Clayton | 12 | 10,873(0.11%)#95 | 1,985,710(0.00%)#5,175 |
| 96. | Jennings | 12 | 10,873(0.11%)#96 | 1,985,710(0.00%)#5,187 |
| 97. | Harrisonville | 12 | 10,873(0.11%)#97 | 1,985,710(0.00%)#5,195 |
| 98. | Winfield | 12 | 10,873(0.11%)#98 | 1,985,710(0.00%)#5,274 |
| 99. | Miner | 12 | 10,873(0.11%)#99 | 1,985,710(0.00%)#5,285 |
| 100. | Ladue | 11 | 10,873(0.10%)#100 | 1,985,710(0.00%)#5,336 |
Common Questions
What are the Top 10 Cities with the Most Immigrants from Philippines in Missouri?
Top 10 Cities with the Most Immigrants from Philippines in Missouri are:
#1
1,193
#2
674
#3
516
#4
419
#5
249
#6
241
#7
224
#8
202
#9
183
#10
162
What city has the Most Immigrants from Philippines in Missouri?
Kansas City has the Most Immigrants from Philippines in Missouri with 1,193.
What is the Total Immigrants from Philippines in the State of Missouri?
Total Immigrants from Philippines in Missouri is 10,873.
What is the Total Immigrants from Philippines in the United States?
Total Immigrants from Philippines in the United States is 1,985,710.