Sandusky, MI
Sandusky Map
Sandusky Overview
2,711
TOTAL POPULATION
1,323
MALE POPULATION
1,388
FEMALE POPULATION
95.32
MALES / 100 FEMALES
104.91
FEMALES / 100 MALES
44.3
MEDIAN AGE
2.8
AVG FAMILY SIZE
2.1
AVG HOUSEHOLD SIZE
$32,581
PER CAPITA INCOME
$71,290
AVG FAMILY INCOME
$47,468
AVG HOUSEHOLD INCOME
20.3%
WAGE / INCOME GAP [ % ]
79.7¢/ $1
WAGE / INCOME GAP [ $ ]
0.50
INEQUALITY / GINI INDEX
1,306
LABOR FORCE [ PEOPLE ]
57.7%
PERCENT IN LABOR FORCE
4.2%
UNEMPLOYMENT RATE
Sandusky Zip Codes
Sandusky Area Codes
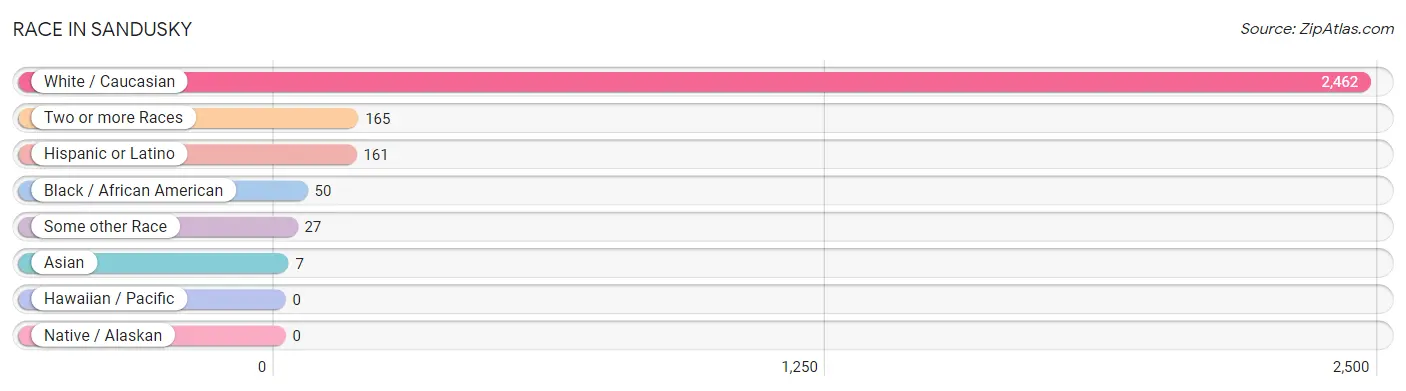
Race in Sandusky
The most populous races in Sandusky are White / Caucasian (2,462 | 90.8%), Two or more Races (165 | 6.1%), and Hispanic or Latino (161 | 5.9%).
| Race | # Population | % Population |
| Asian | 7 | 0.3% |
| Black / African American | 50 | 1.8% |
| Hawaiian / Pacific | 0 | 0.0% |
| Hispanic or Latino | 161 | 5.9% |
| Native / Alaskan | 0 | 0.0% |
| White / Caucasian | 2,462 | 90.8% |
| Two or more Races | 165 | 6.1% |
| Some other Race | 27 | 1.0% |
| Total | 2,711 | 100.0% |
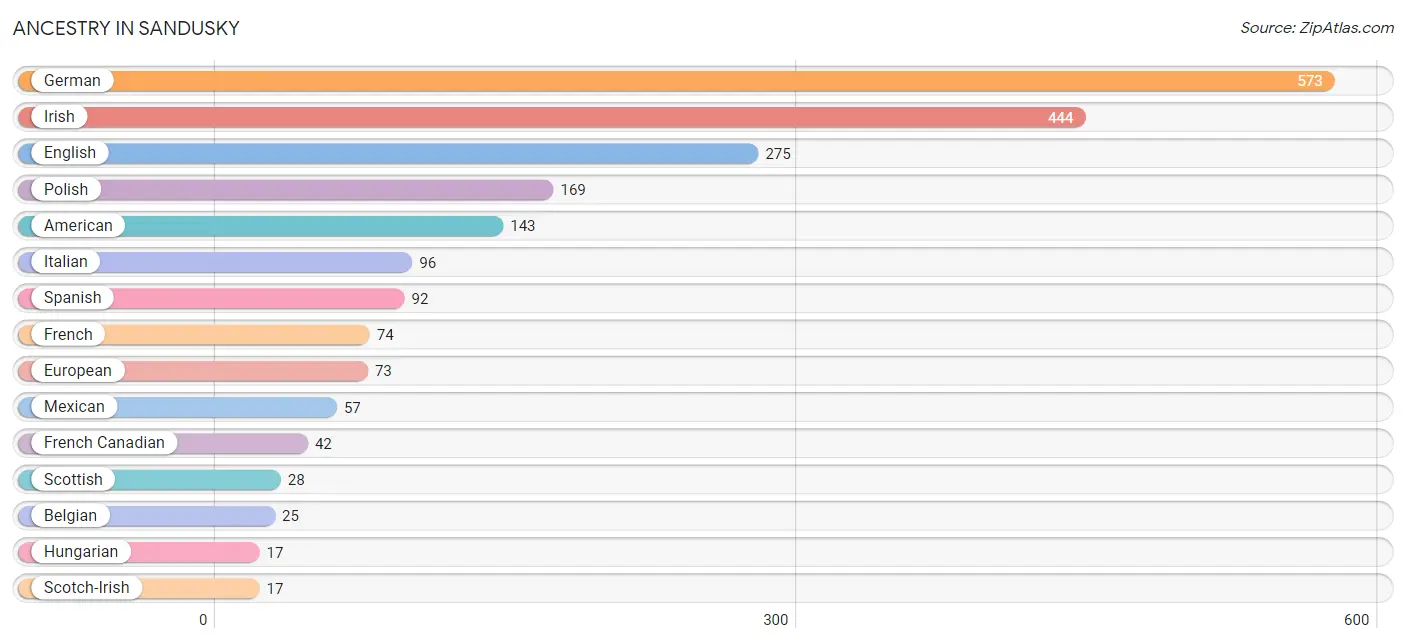
Ancestry in Sandusky
The most populous ancestries reported in Sandusky are German (573 | 21.1%), Irish (444 | 16.4%), English (275 | 10.1%), Polish (169 | 6.2%), and American (143 | 5.3%), together accounting for 59.2% of all Sandusky residents.
| Ancestry | # Population | % Population |
| American | 143 | 5.3% |
| Arab | 5 | 0.2% |
| Austrian | 5 | 0.2% |
| Belgian | 25 | 0.9% |
| British | 14 | 0.5% |
| Canadian | 5 | 0.2% |
| Cherokee | 10 | 0.4% |
| Czech | 3 | 0.1% |
| Danish | 5 | 0.2% |
| Dutch | 3 | 0.1% |
| English | 275 | 10.1% |
| European | 73 | 2.7% |
| Finnish | 16 | 0.6% |
| French | 74 | 2.7% |
| French Canadian | 42 | 1.5% |
| German | 573 | 21.1% |
| Hungarian | 17 | 0.6% |
| Indian (Asian) | 7 | 0.3% |
| Irish | 444 | 16.4% |
| Italian | 96 | 3.5% |
| Jordanian | 5 | 0.2% |
| Mexican | 57 | 2.1% |
| Polish | 169 | 6.2% |
| Russian | 6 | 0.2% |
| Scotch-Irish | 17 | 0.6% |
| Scottish | 28 | 1.0% |
| Spanish | 92 | 3.4% |
| Swedish | 14 | 0.5% |
| Swiss | 7 | 0.3% |
| Turkish | 4 | 0.2% |
| Ukrainian | 9 | 0.3% | View All 31 Rows |
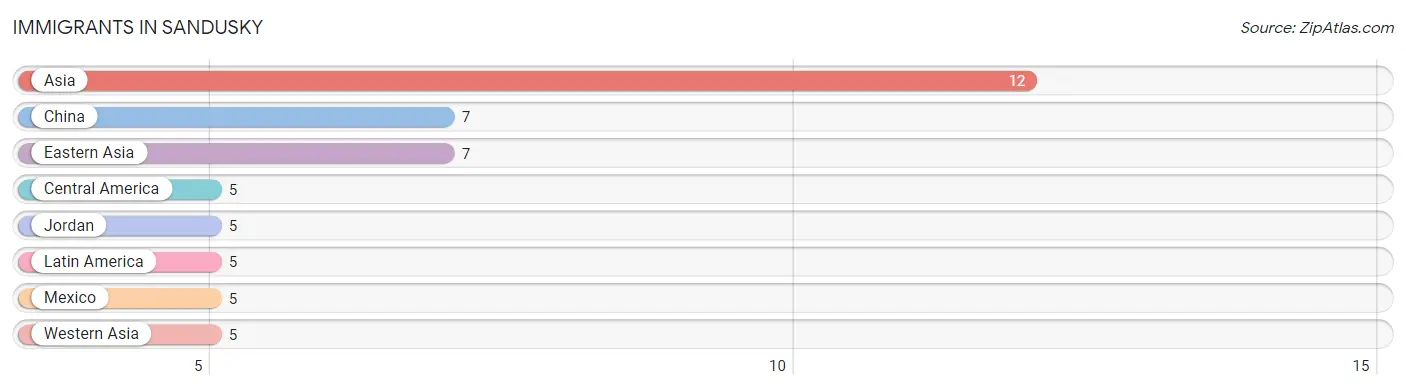
Immigrants in Sandusky
The most numerous immigrant groups reported in Sandusky came from Asia (12 | 0.4%), China (7 | 0.3%), Eastern Asia (7 | 0.3%), Central America (5 | 0.2%), and Jordan (5 | 0.2%), together accounting for 1.3% of all Sandusky residents.
| Immigration Origin | # Population | % Population |
| Asia | 12 | 0.4% |
| Central America | 5 | 0.2% |
| China | 7 | 0.3% |
| Eastern Asia | 7 | 0.3% |
| Jordan | 5 | 0.2% |
| Latin America | 5 | 0.2% |
| Mexico | 5 | 0.2% |
| Western Asia | 5 | 0.2% | View All 8 Rows |
Sex and Age in Sandusky
Sex and Age in Sandusky
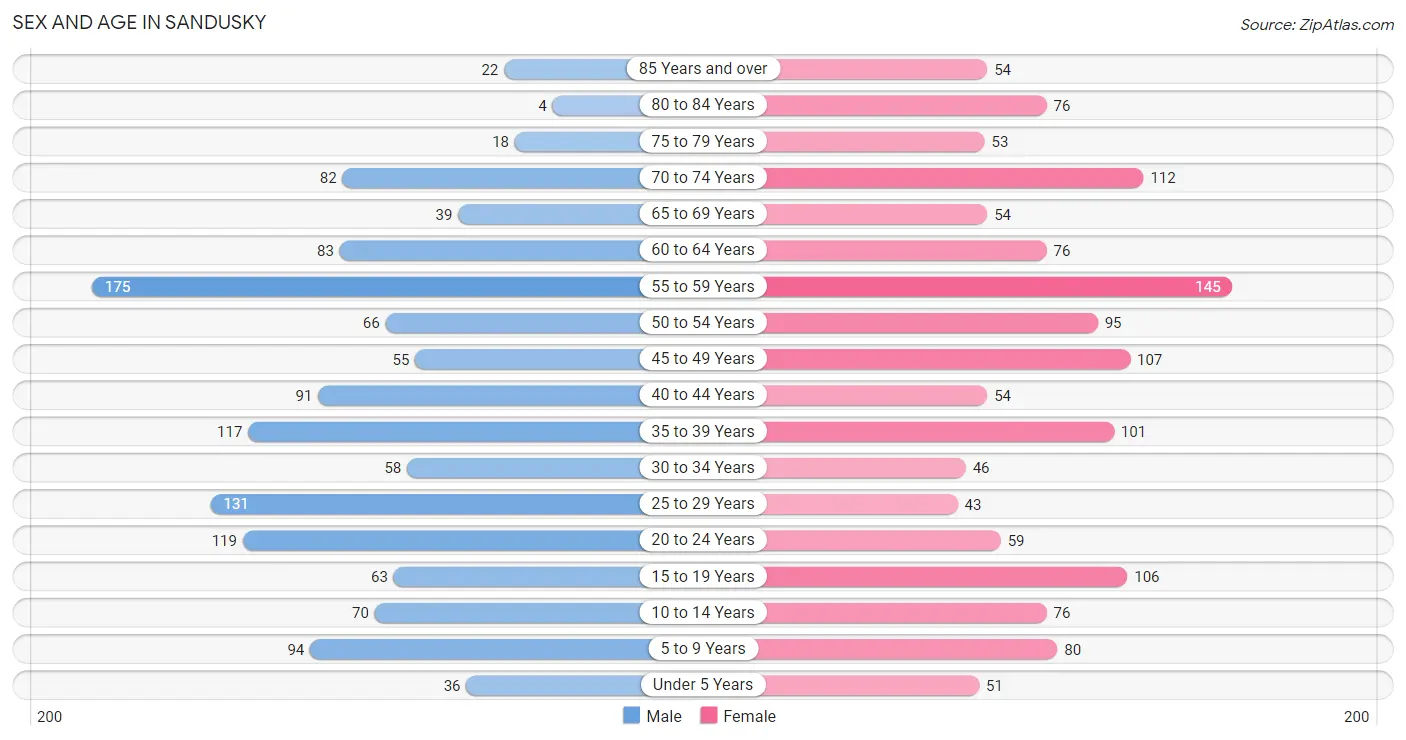
The most populous age groups in Sandusky are 55 to 59 Years (175 | 13.2%) for men and 55 to 59 Years (145 | 10.4%) for women.
| Age Bracket | Male | Female |
| Under 5 Years | 36 (2.7%) | 51 (3.7%) |
| 5 to 9 Years | 94 (7.1%) | 80 (5.8%) |
| 10 to 14 Years | 70 (5.3%) | 76 (5.5%) |
| 15 to 19 Years | 63 (4.8%) | 106 (7.6%) |
| 20 to 24 Years | 119 (9.0%) | 59 (4.3%) |
| 25 to 29 Years | 131 (9.9%) | 43 (3.1%) |
| 30 to 34 Years | 58 (4.4%) | 46 (3.3%) |
| 35 to 39 Years | 117 (8.8%) | 101 (7.3%) |
| 40 to 44 Years | 91 (6.9%) | 54 (3.9%) |
| 45 to 49 Years | 55 (4.2%) | 107 (7.7%) |
| 50 to 54 Years | 66 (5.0%) | 95 (6.8%) |
| 55 to 59 Years | 175 (13.2%) | 145 (10.4%) |
| 60 to 64 Years | 83 (6.3%) | 76 (5.5%) |
| 65 to 69 Years | 39 (2.9%) | 54 (3.9%) |
| 70 to 74 Years | 82 (6.2%) | 112 (8.1%) |
| 75 to 79 Years | 18 (1.4%) | 53 (3.8%) |
| 80 to 84 Years | 4 (0.3%) | 76 (5.5%) |
| 85 Years and over | 22 (1.7%) | 54 (3.9%) |
| Total | 1,323 (100.0%) | 1,388 (100.0%) |
Families and Households in Sandusky
Median Family Size in Sandusky
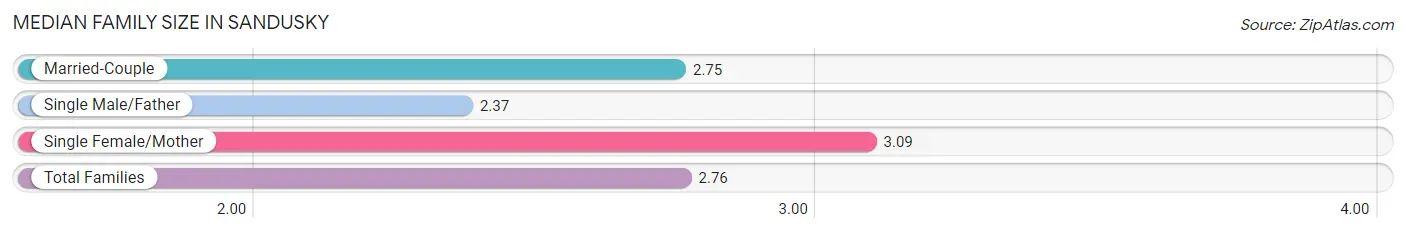
The median family size in Sandusky is 2.76 persons per family, with single female/mother families (116 | 19.2%) accounting for the largest median family size of 3.09 persons per family. On the other hand, single male/father families (81 | 13.4%) represent the smallest median family size with 2.37 persons per family.
| Family Type | # Families | Family Size |
| Married-Couple | 407 (67.4%) | 2.75 |
| Single Male/Father | 81 (13.4%) | 2.37 |
| Single Female/Mother | 116 (19.2%) | 3.09 |
| Total Families | 604 (100.0%) | 2.76 |
Median Household Size in Sandusky
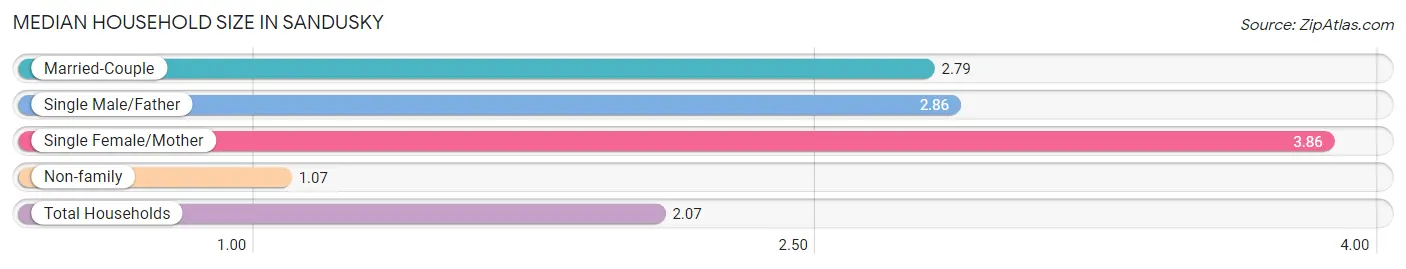
The median household size in Sandusky is 2.07 persons per household, with single female/mother households (116 | 9.9%) accounting for the largest median household size of 3.86 persons per household. non-family households (569 | 48.5%) represent the smallest median household size with 1.07 persons per household.
| Household Type | # Households | Household Size |
| Married-Couple | 407 (34.7%) | 2.79 |
| Single Male/Father | 81 (6.9%) | 2.86 |
| Single Female/Mother | 116 (9.9%) | 3.86 |
| Non-family | 569 (48.5%) | 1.07 |
| Total Households | 1,173 (100.0%) | 2.07 |
Household Size by Marriage Status in Sandusky
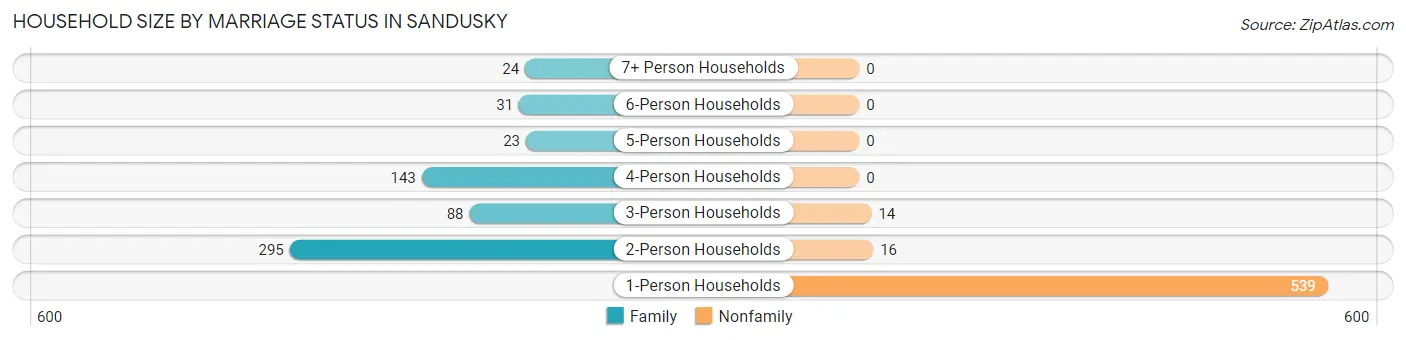
Out of a total of 1,173 households in Sandusky, 604 (51.5%) are family households, while 569 (48.5%) are nonfamily households. The most numerous type of family households are 2-person households, comprising 295, and the most common type of nonfamily households are 1-person households, comprising 539.
| Household Size | Family Households | Nonfamily Households |
| 1-Person Households | - | 539 (46.0%) |
| 2-Person Households | 295 (25.2%) | 16 (1.4%) |
| 3-Person Households | 88 (7.5%) | 14 (1.2%) |
| 4-Person Households | 143 (12.2%) | 0 (0.0%) |
| 5-Person Households | 23 (2.0%) | 0 (0.0%) |
| 6-Person Households | 31 (2.6%) | 0 (0.0%) |
| 7+ Person Households | 24 (2.1%) | 0 (0.0%) |
| Total | 604 (51.5%) | 569 (48.5%) |
Female Fertility in Sandusky
Fertility by Age in Sandusky
Average fertility rate in Sandusky is 74.0 births per 1,000 women. Women in the age bracket of 20 to 34 years have the highest fertility rate with 264.0 births per 1,000 women. Women in the age bracket of 20 to 34 years acount for 100.0% of all women with births.
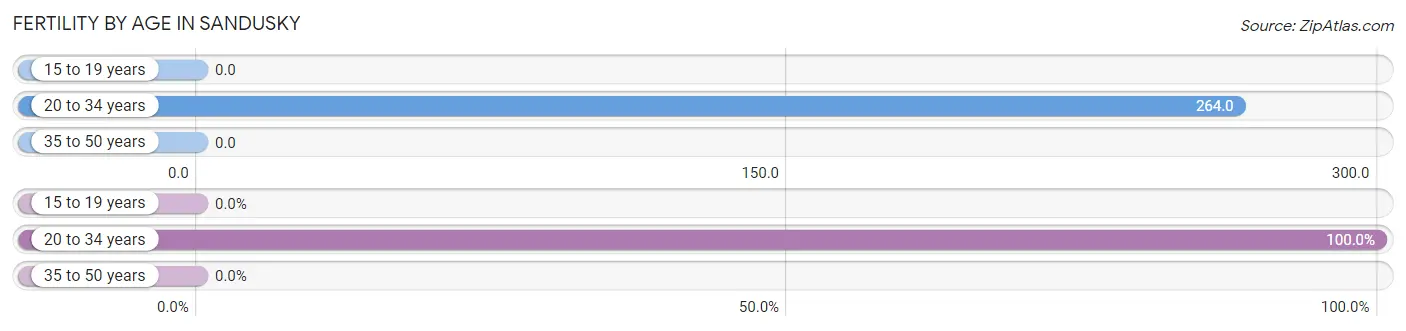
| Age Bracket | Women with Births | Births / 1,000 Women |
| 15 to 19 years | 0 (0.0%) | 0.0 |
| 20 to 34 years | 39 (100.0%) | 264.0 |
| 35 to 50 years | 0 (0.0%) | 0.0 |
| Total | 39 (100.0%) | 74.0 |
Fertility by Age by Marriage Status in Sandusky
17.9% of women with births (39) in Sandusky are married. The highest percentage of unmarried women with births falls into 20 to 34 years age bracket with 82.1% of them unmarried at the time of birth, while the lowest percentage of unmarried women with births belong to 20 to 34 years age bracket with 82.1% of them unmarried.
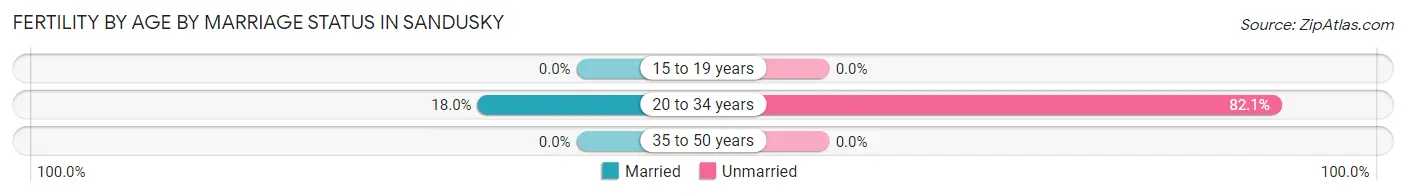
| Age Bracket | Married | Unmarried |
| 15 to 19 years | 0 (0.0%) | 0 (0.0%) |
| 20 to 34 years | 7 (17.9%) | 32 (82.1%) |
| 35 to 50 years | 0 (0.0%) | 0 (0.0%) |
| Total | 7 (17.9%) | 32 (82.1%) |
Fertility by Education in Sandusky
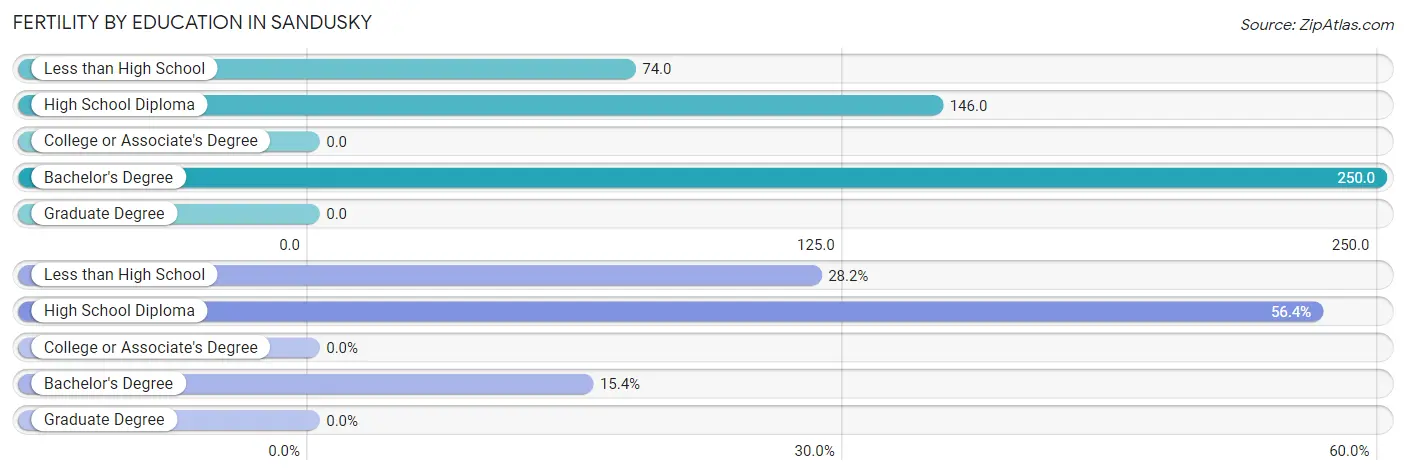
| Educational Attainment | Women with Births | Births / 1,000 Women |
| Less than High School | 11 (28.2%) | 74.0 |
| High School Diploma | 22 (56.4%) | 146.0 |
| College or Associate's Degree | 0 (0.0%) | 0.0 |
| Bachelor's Degree | 6 (15.4%) | 250.0 |
| Graduate Degree | 0 (0.0%) | 0.0 |
| Total | 39 (100.0%) | 74.0 |
Fertility by Education by Marriage Status in Sandusky
82.1% of women with births in Sandusky are unmarried. Women with the educational attainment of high school diploma are most likely to be married with 31.8% of them married at childbirth, while women with the educational attainment of less than high school are least likely to be married with 100.0% of them unmarried at childbirth.
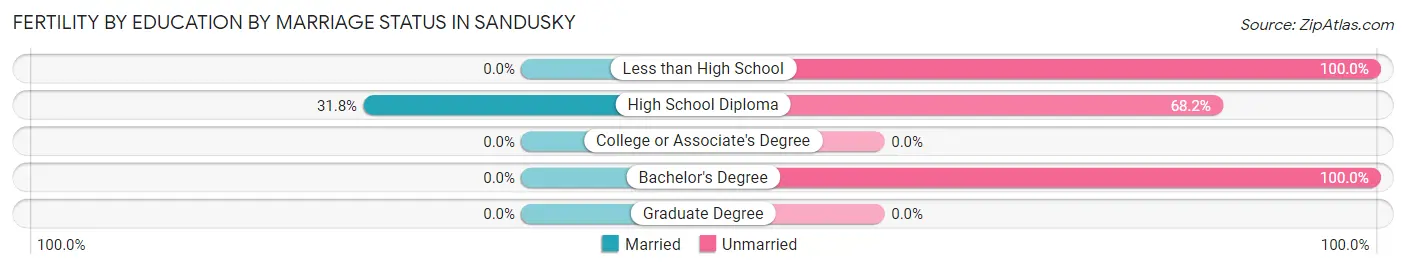
| Educational Attainment | Married | Unmarried |
| Less than High School | 0 (0.0%) | 11 (100.0%) |
| High School Diploma | 7 (31.8%) | 15 (68.2%) |
| College or Associate's Degree | 0 (0.0%) | 0 (0.0%) |
| Bachelor's Degree | 0 (0.0%) | 6 (100.0%) |
| Graduate Degree | 0 (0.0%) | 0 (0.0%) |
| Total | 7 (17.9%) | 32 (82.1%) |
Income in Sandusky
Income Overview in Sandusky
Per Capita Income in Sandusky is $32,581, while median incomes of families and households are $71,290 and $47,468 respectively.
| Characteristic | Number | Measure |
| Per Capita Income | 2,711 | $32,581 |
| Median Family Income | 604 | $71,290 |
| Mean Family Income | 604 | $92,384 |
| Median Household Income | 1,173 | $47,468 |
| Mean Household Income | 1,173 | $74,960 |
| Income Deficit | 604 | $0 |
| Wage / Income Gap (%) | 2,711 | 20.35% |
| Wage / Income Gap ($) | 2,711 | 79.65¢ per $1 |
| Gini / Inequality Index | 2,711 | 0.50 |
Earnings by Sex in Sandusky
Average Earnings in Sandusky are $34,888, $40,392 for men and $32,173 for women, a difference of 20.3%.
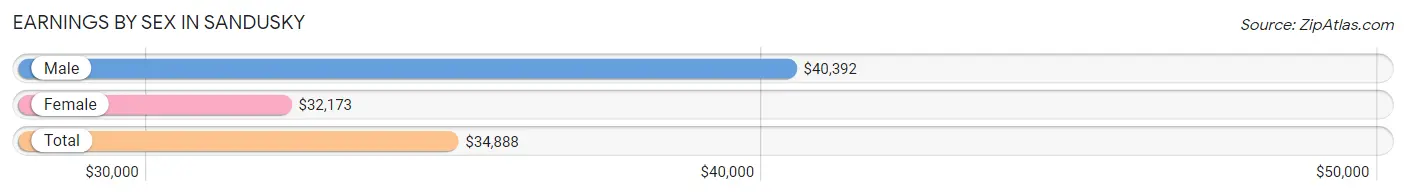
| Sex | Number | Average Earnings |
| Male | 710 (50.5%) | $40,392 |
| Female | 695 (49.5%) | $32,173 |
| Total | 1,405 (100.0%) | $34,888 |
Earnings by Sex by Income Bracket in Sandusky
The most common earnings brackets in Sandusky are $100,000+ for men (147 | 20.7%) and $30,000 to $34,999 for women (96 | 13.8%).
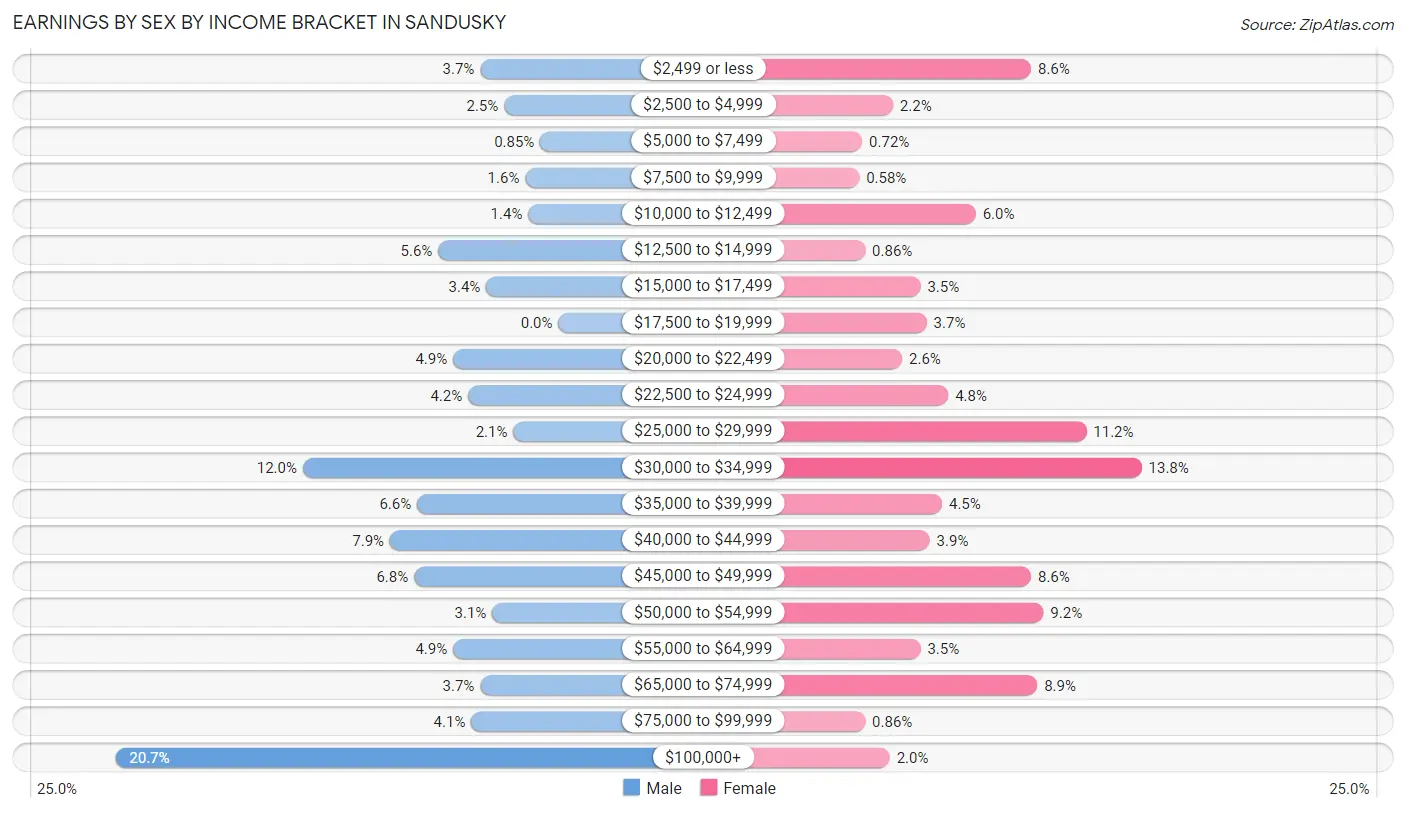
| Income | Male | Female |
| $2,499 or less | 26 (3.7%) | 60 (8.6%) |
| $2,500 to $4,999 | 18 (2.5%) | 15 (2.2%) |
| $5,000 to $7,499 | 6 (0.9%) | 5 (0.7%) |
| $7,500 to $9,999 | 11 (1.5%) | 4 (0.6%) |
| $10,000 to $12,499 | 10 (1.4%) | 42 (6.0%) |
| $12,500 to $14,999 | 40 (5.6%) | 6 (0.9%) |
| $15,000 to $17,499 | 24 (3.4%) | 24 (3.5%) |
| $17,500 to $19,999 | 0 (0.0%) | 26 (3.7%) |
| $20,000 to $22,499 | 35 (4.9%) | 18 (2.6%) |
| $22,500 to $24,999 | 30 (4.2%) | 33 (4.8%) |
| $25,000 to $29,999 | 15 (2.1%) | 78 (11.2%) |
| $30,000 to $34,999 | 85 (12.0%) | 96 (13.8%) |
| $35,000 to $39,999 | 47 (6.6%) | 31 (4.5%) |
| $40,000 to $44,999 | 56 (7.9%) | 27 (3.9%) |
| $45,000 to $49,999 | 48 (6.8%) | 60 (8.6%) |
| $50,000 to $54,999 | 22 (3.1%) | 64 (9.2%) |
| $55,000 to $64,999 | 35 (4.9%) | 24 (3.5%) |
| $65,000 to $74,999 | 26 (3.7%) | 62 (8.9%) |
| $75,000 to $99,999 | 29 (4.1%) | 6 (0.9%) |
| $100,000+ | 147 (20.7%) | 14 (2.0%) |
| Total | 710 (100.0%) | 695 (100.0%) |
Earnings by Sex by Educational Attainment in Sandusky
Average earnings in Sandusky are $46,161 for men and $34,676 for women, a difference of 24.9%. Men with an educational attainment of bachelor's degree enjoy the highest average annual earnings of $119,030, while those with less than high school education earn the least with $22,763. Women with an educational attainment of graduate degree earn the most with the average annual earnings of $49,082, while those with high school diploma education have the smallest earnings of $27,621.
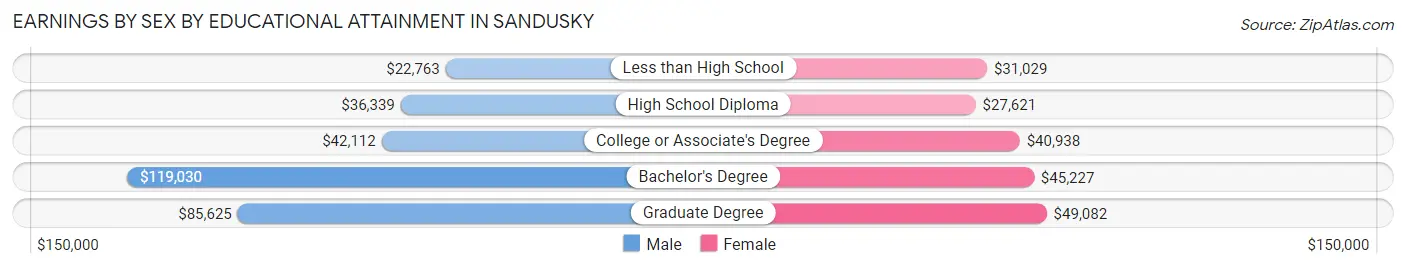
| Educational Attainment | Male Income | Female Income |
| Less than High School | $22,763 | $31,029 |
| High School Diploma | $36,339 | $27,621 |
| College or Associate's Degree | $42,112 | $40,938 |
| Bachelor's Degree | $119,030 | $45,227 |
| Graduate Degree | $85,625 | $49,082 |
| Total | $46,161 | $34,676 |
Family Income in Sandusky
Family Income Brackets in Sandusky
According to the Sandusky family income data, there are 181 families falling into the $50,000 to $74,999 income range, which is the most common income bracket and makes up 30.0% of all families. Conversely, the $15,000 to $24,999 income bracket is the least frequent group with only 5 families (0.8%) belonging to this category.
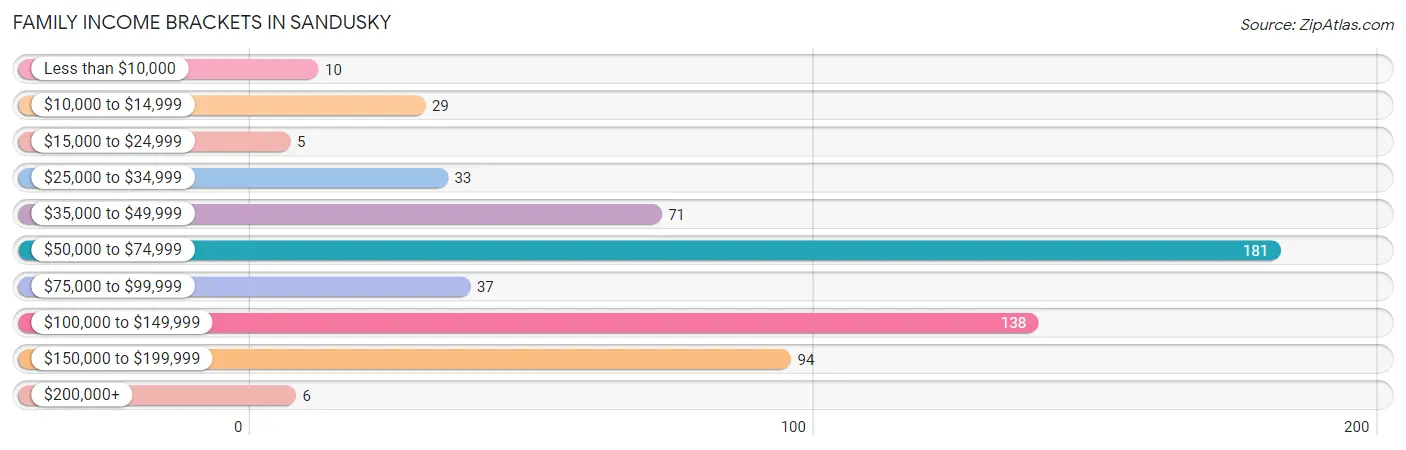
| Income Bracket | # Families | % Families |
| Less than $10,000 | 10 | 1.7% |
| $10,000 to $14,999 | 29 | 4.8% |
| $15,000 to $24,999 | 5 | 0.8% |
| $25,000 to $34,999 | 33 | 5.5% |
| $35,000 to $49,999 | 71 | 11.8% |
| $50,000 to $74,999 | 181 | 30.0% |
| $75,000 to $99,999 | 37 | 6.1% |
| $100,000 to $149,999 | 138 | 22.8% |
| $150,000 to $199,999 | 94 | 15.6% |
| $200,000+ | 6 | 1.0% |
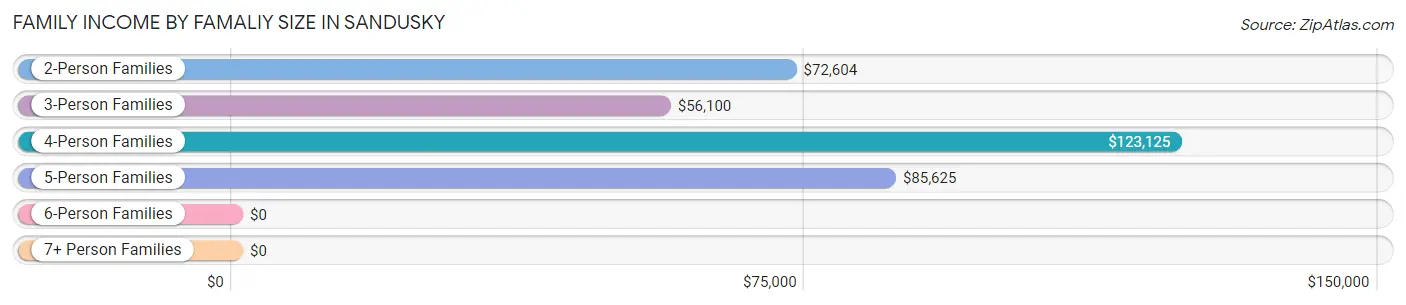
Family Income by Famaliy Size in Sandusky
4-person families (112 | 18.5%) account for the highest median family income in Sandusky with $123,125 per family, while 2-person families (335 | 55.5%) have the highest median income of $36,302 per family member.
| Income Bracket | # Families | Median Income |
| 2-Person Families | 335 (55.5%) | $72,604 |
| 3-Person Families | 94 (15.6%) | $56,100 |
| 4-Person Families | 112 (18.5%) | $123,125 |
| 5-Person Families | 45 (7.4%) | $85,625 |
| 6-Person Families | 4 (0.7%) | $0 |
| 7+ Person Families | 14 (2.3%) | $0 |
| Total | 604 (100.0%) | $71,290 |
Family Income by Number of Earners in Sandusky
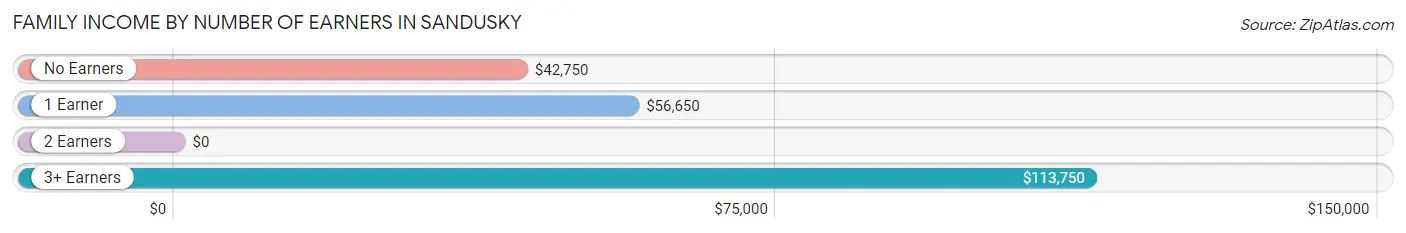
| Number of Earners | # Families | Median Income |
| No Earners | 49 (8.1%) | $42,750 |
| 1 Earner | 175 (29.0%) | $56,650 |
| 2 Earners | 338 (56.0%) | $0 |
| 3+ Earners | 42 (7.0%) | $113,750 |
| Total | 604 (100.0%) | $71,290 |
Household Income in Sandusky
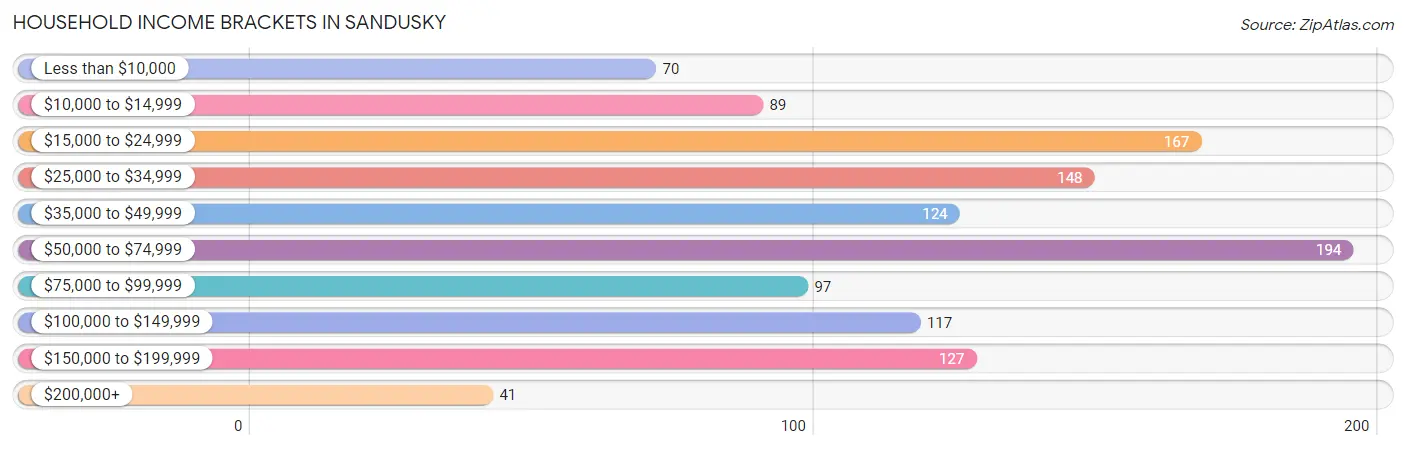
Household Income Brackets in Sandusky
With 194 households falling in the category, the $50,000 to $74,999 income range is the most frequent in Sandusky, accounting for 16.5% of all households. In contrast, only 41 households (3.5%) fall into the $200,000+ income bracket, making it the least populous group.
| Income Bracket | # Households | % Households |
| Less than $10,000 | 70 | 6.0% |
| $10,000 to $14,999 | 89 | 7.6% |
| $15,000 to $24,999 | 167 | 14.2% |
| $25,000 to $34,999 | 148 | 12.6% |
| $35,000 to $49,999 | 124 | 10.6% |
| $50,000 to $74,999 | 194 | 16.5% |
| $75,000 to $99,999 | 97 | 8.3% |
| $100,000 to $149,999 | 117 | 10.0% |
| $150,000 to $199,999 | 127 | 10.8% |
| $200,000+ | 41 | 3.5% |
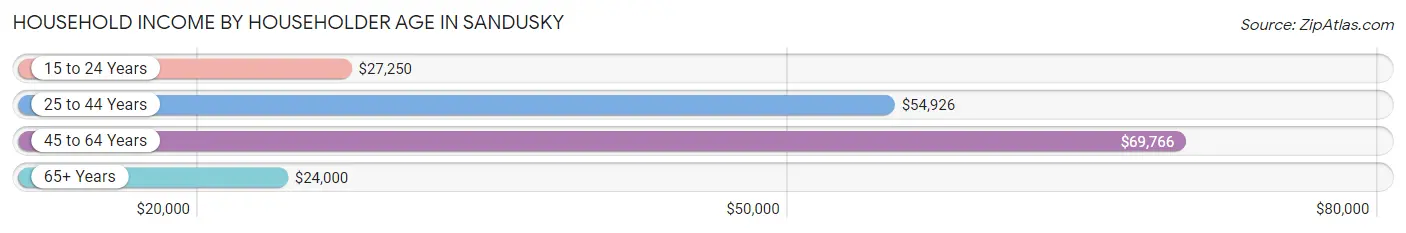
Household Income by Householder Age in Sandusky
The median household income in Sandusky is $47,468, with the highest median household income of $69,766 found in the 45 to 64 years age bracket for the primary householder. A total of 455 households (38.8%) fall into this category. Meanwhile, the 65+ years age bracket for the primary householder has the lowest median household income of $24,000, with 330 households (28.1%) in this group.
| Income Bracket | # Households | Median Income |
| 15 to 24 Years | 55 (4.7%) | $27,250 |
| 25 to 44 Years | 333 (28.4%) | $54,926 |
| 45 to 64 Years | 455 (38.8%) | $69,766 |
| 65+ Years | 330 (28.1%) | $24,000 |
| Total | 1,173 (100.0%) | $47,468 |
Poverty in Sandusky
Income Below Poverty by Sex and Age in Sandusky
With 10.0% poverty level for males and 11.6% for females among the residents of Sandusky, 35 to 44 year old males and 16 and 17 year old females are the most vulnerable to poverty, with 61 males (35.9%) and 26 females (54.2%) in their respective age groups living below the poverty level.
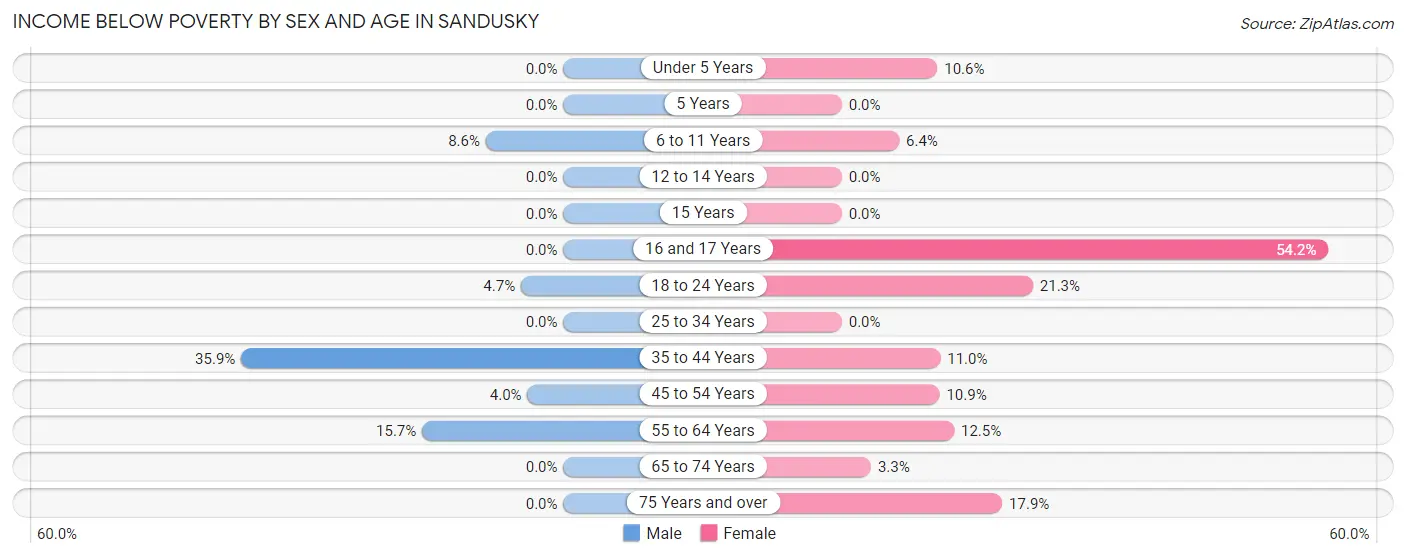
| Age Bracket | Male | Female |
| Under 5 Years | 0 (0.0%) | 5 (10.6%) |
| 5 Years | 0 (0.0%) | 0 (0.0%) |
| 6 to 11 Years | 7 (8.6%) | 6 (6.4%) |
| 12 to 14 Years | 0 (0.0%) | 0 (0.0%) |
| 15 Years | 0 (0.0%) | 0 (0.0%) |
| 16 and 17 Years | 0 (0.0%) | 26 (54.2%) |
| 18 to 24 Years | 5 (4.7%) | 20 (21.3%) |
| 25 to 34 Years | 0 (0.0%) | 0 (0.0%) |
| 35 to 44 Years | 61 (35.9%) | 17 (11.0%) |
| 45 to 54 Years | 4 (4.0%) | 21 (10.9%) |
| 55 to 64 Years | 39 (15.7%) | 27 (12.5%) |
| 65 to 74 Years | 0 (0.0%) | 5 (3.3%) |
| 75 Years and over | 0 (0.0%) | 25 (17.9%) |
| Total | 116 (10.0%) | 152 (11.6%) |
Income Above Poverty by Sex and Age in Sandusky
According to the poverty statistics in Sandusky, males aged under 5 years and females aged 5 years are the age groups that are most secure financially, with 100.0% of males and 100.0% of females in these age groups living above the poverty line.
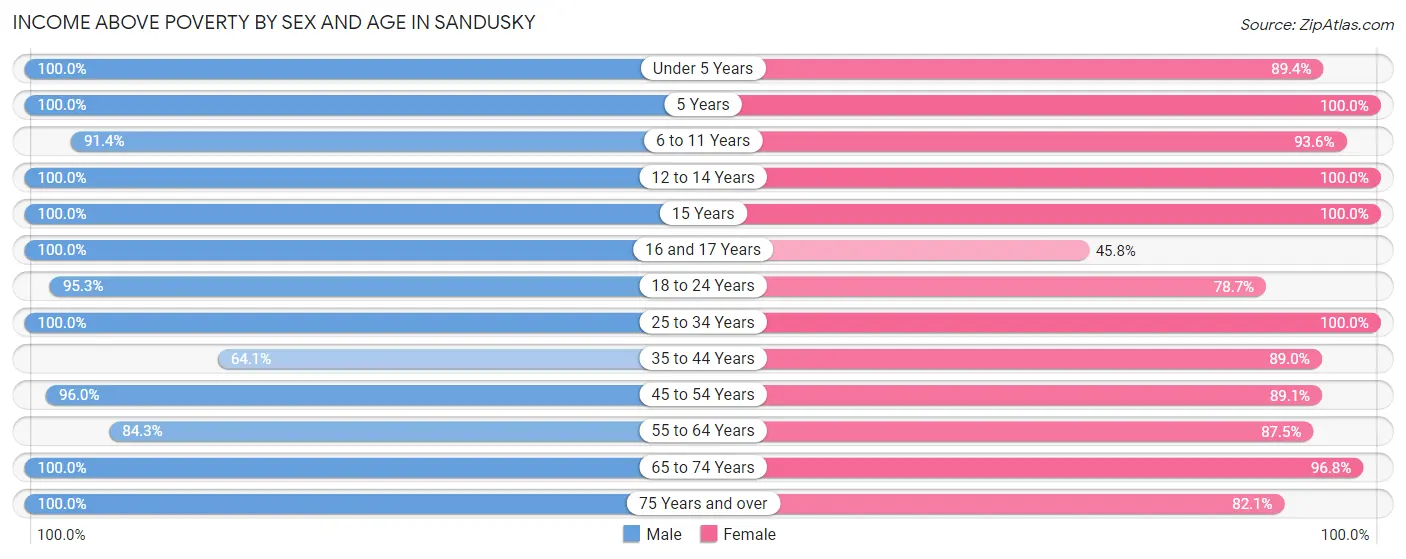
| Age Bracket | Male | Female |
| Under 5 Years | 36 (100.0%) | 42 (89.4%) |
| 5 Years | 24 (100.0%) | 28 (100.0%) |
| 6 to 11 Years | 74 (91.4%) | 88 (93.6%) |
| 12 to 14 Years | 59 (100.0%) | 34 (100.0%) |
| 15 Years | 18 (100.0%) | 23 (100.0%) |
| 16 and 17 Years | 33 (100.0%) | 22 (45.8%) |
| 18 to 24 Years | 101 (95.3%) | 74 (78.7%) |
| 25 to 34 Years | 148 (100.0%) | 89 (100.0%) |
| 35 to 44 Years | 109 (64.1%) | 138 (89.0%) |
| 45 to 54 Years | 96 (96.0%) | 172 (89.1%) |
| 55 to 64 Years | 209 (84.3%) | 189 (87.5%) |
| 65 to 74 Years | 107 (100.0%) | 149 (96.8%) |
| 75 Years and over | 29 (100.0%) | 115 (82.1%) |
| Total | 1,043 (90.0%) | 1,163 (88.4%) |
Income Below Poverty Among Married-Couple Families in Sandusky
The poverty statistics for married-couple families in Sandusky show that 0.7% or 3 of the total 407 families live below the poverty line. Families with no children have the highest poverty rate of 1.1%, comprising of 3 families. On the other hand, families with 1 or 2 children have the lowest poverty rate of 0.0%, which includes 0 families.
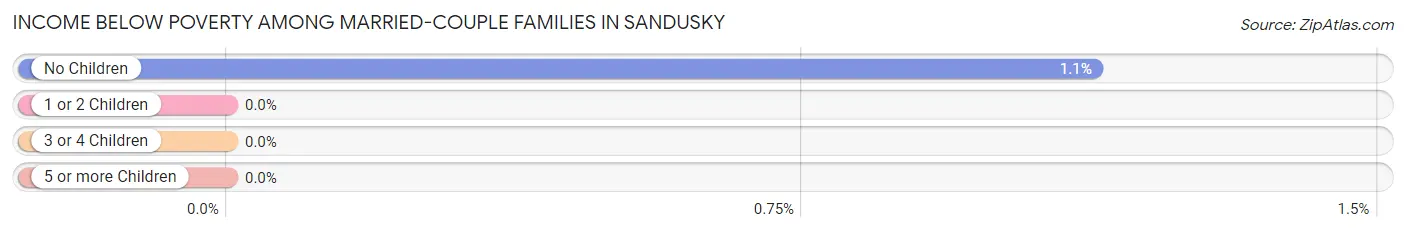
| Children | Above Poverty | Below Poverty |
| No Children | 263 (98.9%) | 3 (1.1%) |
| 1 or 2 Children | 113 (100.0%) | 0 (0.0%) |
| 3 or 4 Children | 14 (100.0%) | 0 (0.0%) |
| 5 or more Children | 14 (100.0%) | 0 (0.0%) |
| Total | 404 (99.3%) | 3 (0.7%) |
Income Below Poverty Among Single-Parent Households in Sandusky
According to the poverty data in Sandusky, 35.8% or 29 single-father households and 10.3% or 12 single-mother households are living below the poverty line. Among single-father households, those with 1 or 2 children have the highest poverty rate, with 29 households (59.2%) experiencing poverty. Likewise, among single-mother households, those with no children have the highest poverty rate, with 5 households (25.0%) falling below the poverty line.
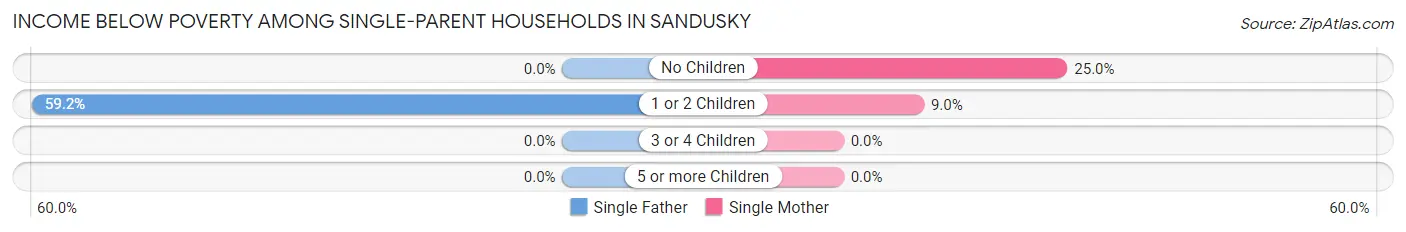
| Children | Single Father | Single Mother |
| No Children | 0 (0.0%) | 5 (25.0%) |
| 1 or 2 Children | 29 (59.2%) | 7 (9.0%) |
| 3 or 4 Children | 0 (0.0%) | 0 (0.0%) |
| 5 or more Children | 0 (0.0%) | 0 (0.0%) |
| Total | 29 (35.8%) | 12 (10.3%) |
Income Below Poverty Among Married-Couple vs Single-Parent Households in Sandusky
The poverty data for Sandusky shows that 3 of the married-couple family households (0.7%) and 41 of the single-parent households (20.8%) are living below the poverty level. Within the married-couple family households, those with no children have the highest poverty rate, with 3 households (1.1%) falling below the poverty line. Among the single-parent households, those with 1 or 2 children have the highest poverty rate, with 36 household (28.3%) living below poverty.
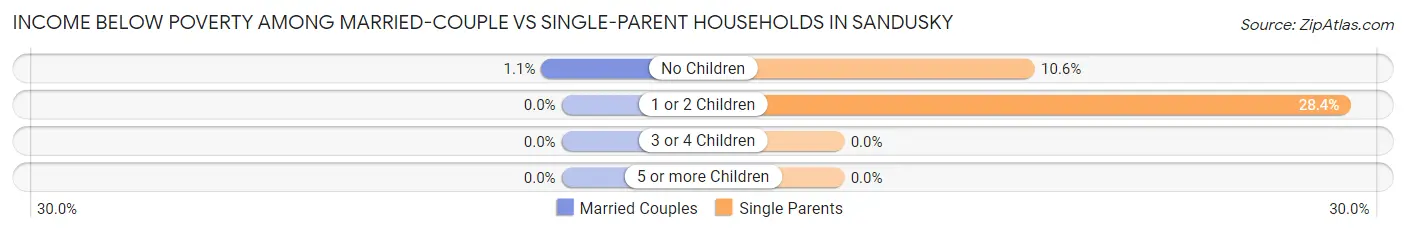
| Children | Married-Couple Families | Single-Parent Households |
| No Children | 3 (1.1%) | 5 (10.6%) |
| 1 or 2 Children | 0 (0.0%) | 36 (28.3%) |
| 3 or 4 Children | 0 (0.0%) | 0 (0.0%) |
| 5 or more Children | 0 (0.0%) | 0 (0.0%) |
| Total | 3 (0.7%) | 41 (20.8%) |
Employment Characteristics in Sandusky
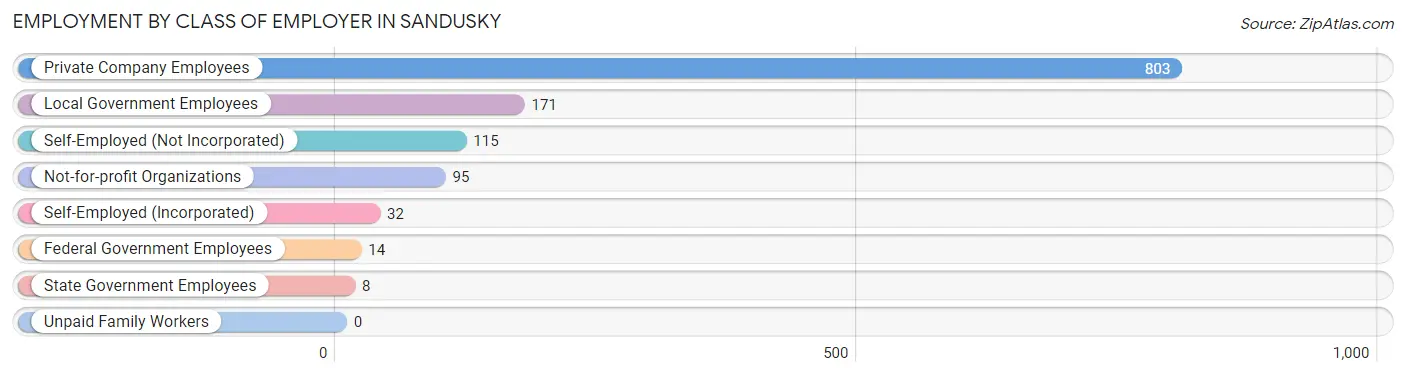
Employment by Class of Employer in Sandusky
Among the 1,238 employed individuals in Sandusky, private company employees (803 | 64.9%), local government employees (171 | 13.8%), and self-employed (not incorporated) (115 | 9.3%) make up the most common classes of employment.
| Employer Class | # Employees | % Employees |
| Private Company Employees | 803 | 64.9% |
| Self-Employed (Incorporated) | 32 | 2.6% |
| Self-Employed (Not Incorporated) | 115 | 9.3% |
| Not-for-profit Organizations | 95 | 7.7% |
| Local Government Employees | 171 | 13.8% |
| State Government Employees | 8 | 0.6% |
| Federal Government Employees | 14 | 1.1% |
| Unpaid Family Workers | 0 | 0.0% |
| Total | 1,238 | 100.0% |
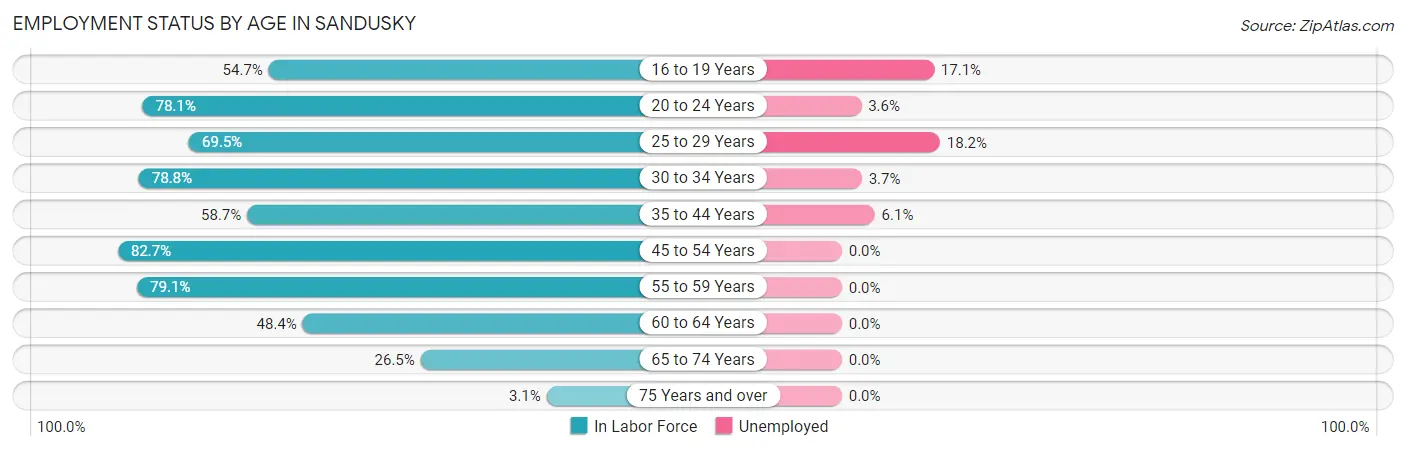
Employment Status by Age in Sandusky
According to the labor force statistics for Sandusky, out of the total population over 16 years of age (2,263), 57.7% or 1,306 individuals are in the labor force, with 4.2% or 55 of them unemployed. The age group with the highest labor force participation rate is 45 to 54 years, with 82.7% or 267 individuals in the labor force. Within the labor force, the 25 to 29 years age range has the highest percentage of unemployed individuals, with 18.2% or 22 of them being unemployed.
| Age Bracket | In Labor Force | Unemployed |
| 16 to 19 Years | 70 (54.7%) | 12 (17.1%) |
| 20 to 24 Years | 139 (78.1%) | 5 (3.6%) |
| 25 to 29 Years | 121 (69.5%) | 22 (18.2%) |
| 30 to 34 Years | 82 (78.8%) | 3 (3.7%) |
| 35 to 44 Years | 213 (58.7%) | 13 (6.1%) |
| 45 to 54 Years | 267 (82.7%) | 0 (0.0%) |
| 55 to 59 Years | 253 (79.1%) | 0 (0.0%) |
| 60 to 64 Years | 77 (48.4%) | 0 (0.0%) |
| 65 to 74 Years | 76 (26.5%) | 0 (0.0%) |
| 75 Years and over | 7 (3.1%) | 0 (0.0%) |
| Total | 1,306 (57.7%) | 55 (4.2%) |
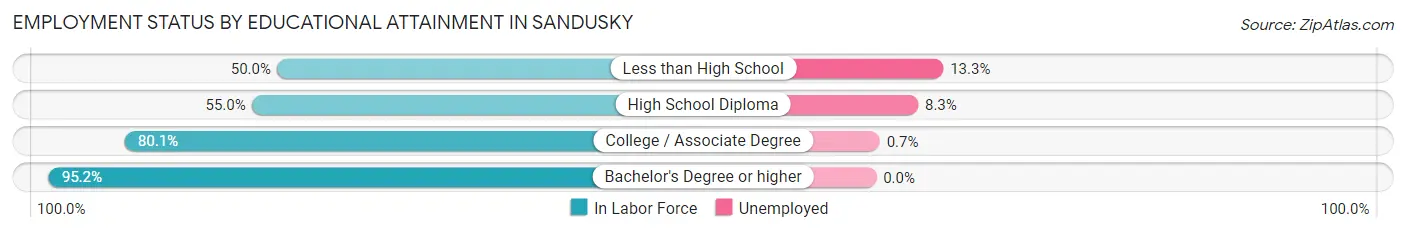
Employment Status by Educational Attainment in Sandusky
According to labor force statistics for Sandusky, 70.2% of individuals (1,013) out of the total population between 25 and 64 years of age (1,443) are in the labor force, with 3.8% or 38 of them being unemployed. The group with the highest labor force participation rate are those with the educational attainment of bachelor's degree or higher, with 95.2% or 236 individuals in the labor force. Within the labor force, individuals with less than high school education have the highest percentage of unemployment, with 13.3% or 13 of them being unemployed.
| Educational Attainment | In Labor Force | Unemployed |
| Less than High School | 98 (50.0%) | 26 (13.3%) |
| High School Diploma | 265 (55.0%) | 40 (8.3%) |
| College / Associate Degree | 414 (80.1%) | 4 (0.7%) |
| Bachelor's Degree or higher | 236 (95.2%) | 0 (0.0%) |
| Total | 1,013 (70.2%) | 55 (3.8%) |
Employment Occupations by Sex in Sandusky
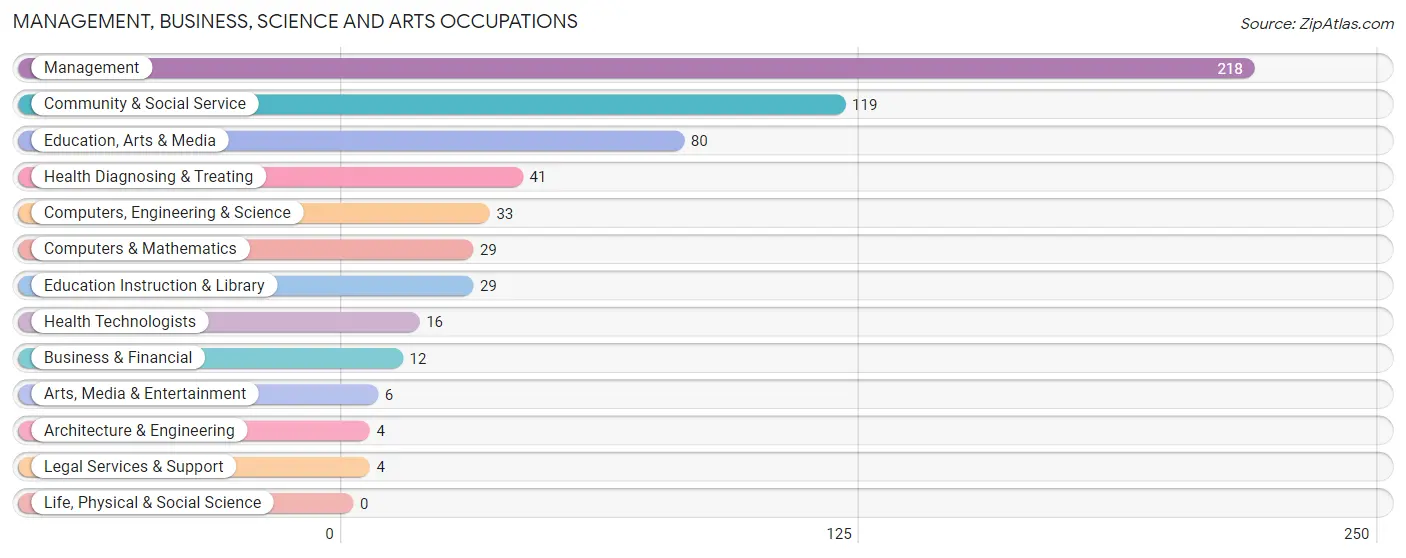
Management, Business, Science and Arts Occupations
The most common Management, Business, Science and Arts occupations in Sandusky are Management (218 | 17.5%), Community & Social Service (119 | 9.6%), Education, Arts & Media (80 | 6.4%), Health Diagnosing & Treating (41 | 3.3%), and Computers, Engineering & Science (33 | 2.6%).
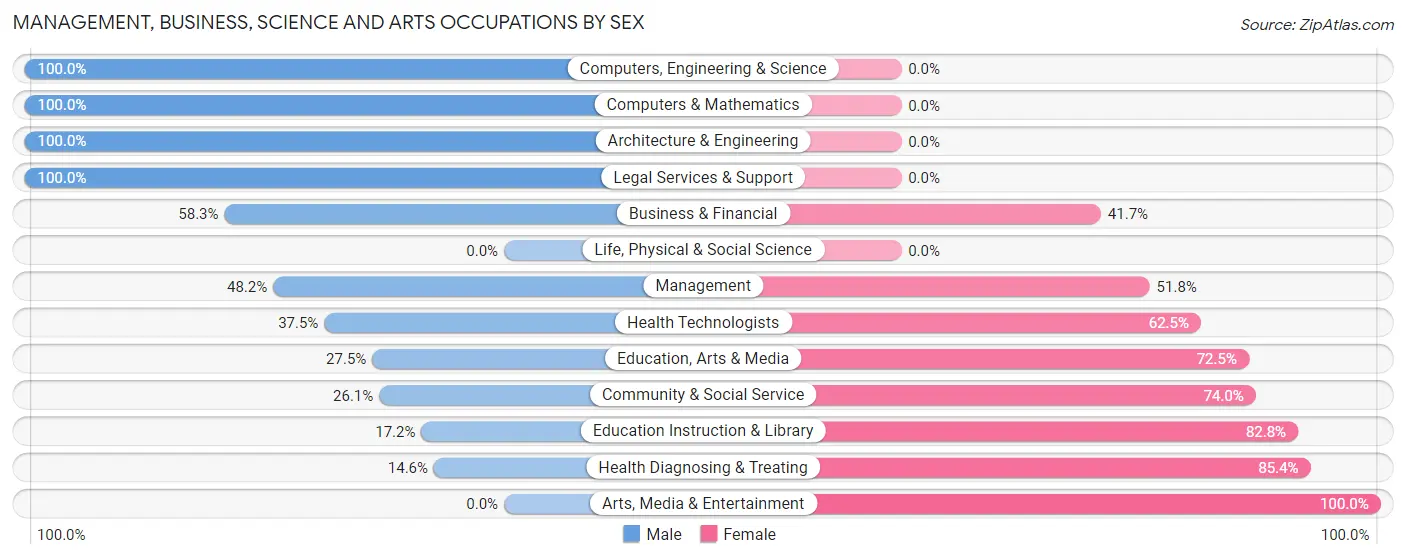
Management, Business, Science and Arts Occupations by Sex
Within the Management, Business, Science and Arts occupations in Sandusky, the most male-oriented occupations are Computers, Engineering & Science (100.0%), Computers & Mathematics (100.0%), and Architecture & Engineering (100.0%), while the most female-oriented occupations are Arts, Media & Entertainment (100.0%), Health Diagnosing & Treating (85.4%), and Education Instruction & Library (82.8%).
| Occupation | Male | Female |
| Management | 105 (48.2%) | 113 (51.8%) |
| Business & Financial | 7 (58.3%) | 5 (41.7%) |
| Computers, Engineering & Science | 33 (100.0%) | 0 (0.0%) |
| Computers & Mathematics | 29 (100.0%) | 0 (0.0%) |
| Architecture & Engineering | 4 (100.0%) | 0 (0.0%) |
| Life, Physical & Social Science | 0 (0.0%) | 0 (0.0%) |
| Community & Social Service | 31 (26.1%) | 88 (74.0%) |
| Education, Arts & Media | 22 (27.5%) | 58 (72.5%) |
| Legal Services & Support | 4 (100.0%) | 0 (0.0%) |
| Education Instruction & Library | 5 (17.2%) | 24 (82.8%) |
| Arts, Media & Entertainment | 0 (0.0%) | 6 (100.0%) |
| Health Diagnosing & Treating | 6 (14.6%) | 35 (85.4%) |
| Health Technologists | 6 (37.5%) | 10 (62.5%) |
| Total (Category) | 182 (43.0%) | 241 (57.0%) |
| Total (Overall) | 623 (50.0%) | 622 (50.0%) |
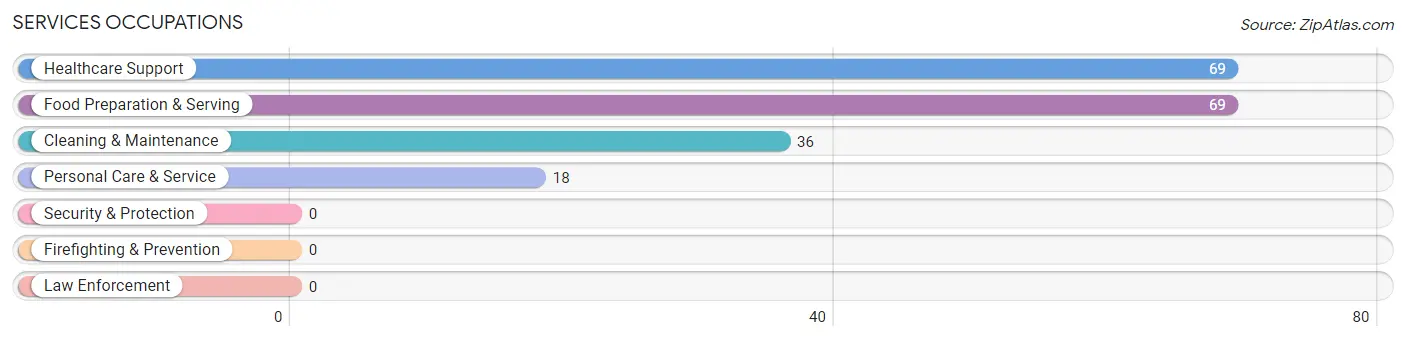
Services Occupations
The most common Services occupations in Sandusky are Healthcare Support (69 | 5.5%), Food Preparation & Serving (69 | 5.5%), Cleaning & Maintenance (36 | 2.9%), and Personal Care & Service (18 | 1.5%).
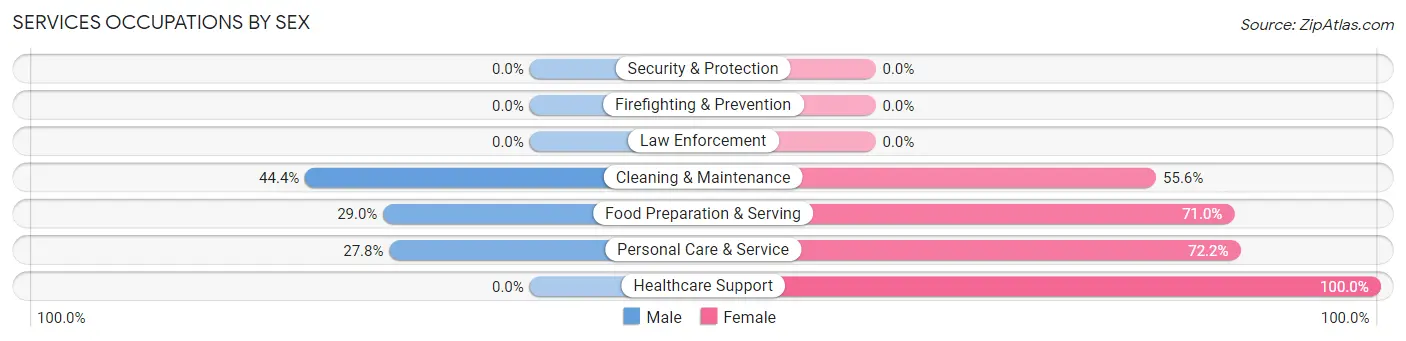
Services Occupations by Sex
Within the Services occupations in Sandusky, the most male-oriented occupations are Cleaning & Maintenance (44.4%), Food Preparation & Serving (29.0%), and Personal Care & Service (27.8%), while the most female-oriented occupations are Healthcare Support (100.0%), Personal Care & Service (72.2%), and Food Preparation & Serving (71.0%).
| Occupation | Male | Female |
| Healthcare Support | 0 (0.0%) | 69 (100.0%) |
| Security & Protection | 0 (0.0%) | 0 (0.0%) |
| Firefighting & Prevention | 0 (0.0%) | 0 (0.0%) |
| Law Enforcement | 0 (0.0%) | 0 (0.0%) |
| Food Preparation & Serving | 20 (29.0%) | 49 (71.0%) |
| Cleaning & Maintenance | 16 (44.4%) | 20 (55.6%) |
| Personal Care & Service | 5 (27.8%) | 13 (72.2%) |
| Total (Category) | 41 (21.3%) | 151 (78.6%) |
| Total (Overall) | 623 (50.0%) | 622 (50.0%) |
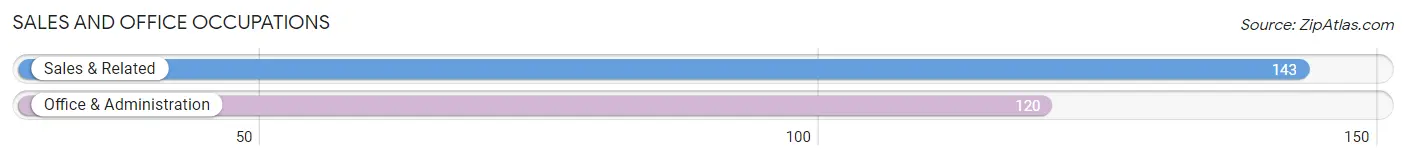
Sales and Office Occupations
The most common Sales and Office occupations in Sandusky are Sales & Related (143 | 11.5%), and Office & Administration (120 | 9.6%).
Sales and Office Occupations by Sex
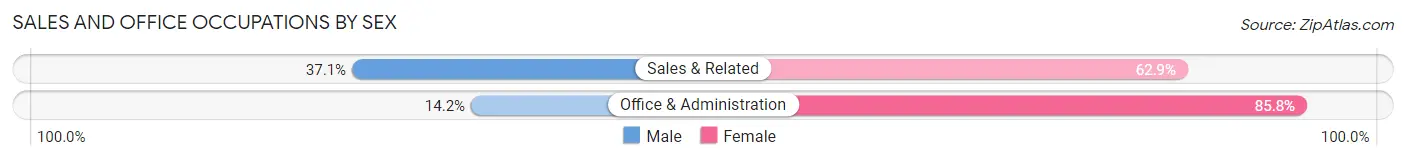
| Occupation | Male | Female |
| Sales & Related | 53 (37.1%) | 90 (62.9%) |
| Office & Administration | 17 (14.2%) | 103 (85.8%) |
| Total (Category) | 70 (26.6%) | 193 (73.4%) |
| Total (Overall) | 623 (50.0%) | 622 (50.0%) |
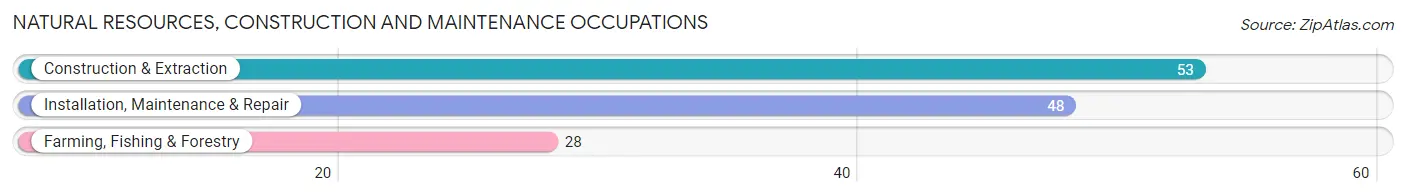
Natural Resources, Construction and Maintenance Occupations
The most common Natural Resources, Construction and Maintenance occupations in Sandusky are Construction & Extraction (53 | 4.3%), Installation, Maintenance & Repair (48 | 3.9%), and Farming, Fishing & Forestry (28 | 2.2%).
Natural Resources, Construction and Maintenance Occupations by Sex

| Occupation | Male | Female |
| Farming, Fishing & Forestry | 28 (100.0%) | 0 (0.0%) |
| Construction & Extraction | 53 (100.0%) | 0 (0.0%) |
| Installation, Maintenance & Repair | 44 (91.7%) | 4 (8.3%) |
| Total (Category) | 125 (96.9%) | 4 (3.1%) |
| Total (Overall) | 623 (50.0%) | 622 (50.0%) |
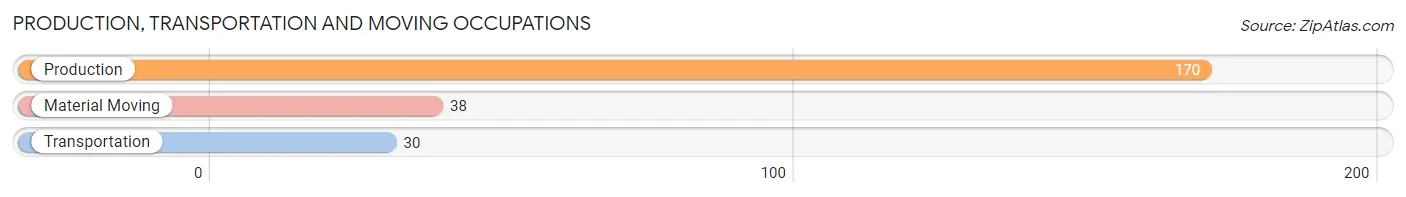
Production, Transportation and Moving Occupations
The most common Production, Transportation and Moving occupations in Sandusky are Production (170 | 13.7%), Material Moving (38 | 3.0%), and Transportation (30 | 2.4%).
Production, Transportation and Moving Occupations by Sex
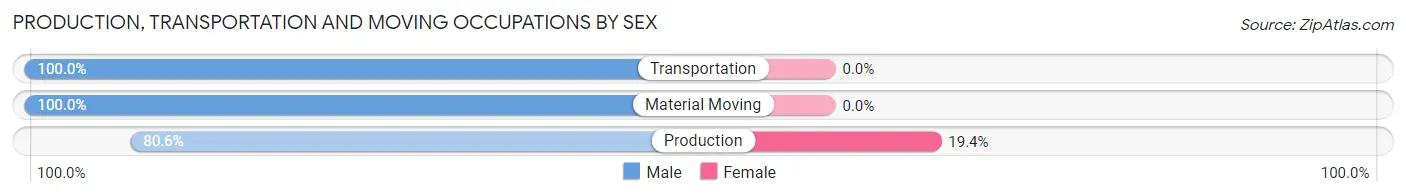
| Occupation | Male | Female |
| Production | 137 (80.6%) | 33 (19.4%) |
| Transportation | 30 (100.0%) | 0 (0.0%) |
| Material Moving | 38 (100.0%) | 0 (0.0%) |
| Total (Category) | 205 (86.1%) | 33 (13.9%) |
| Total (Overall) | 623 (50.0%) | 622 (50.0%) |
Employment Industries by Sex in Sandusky
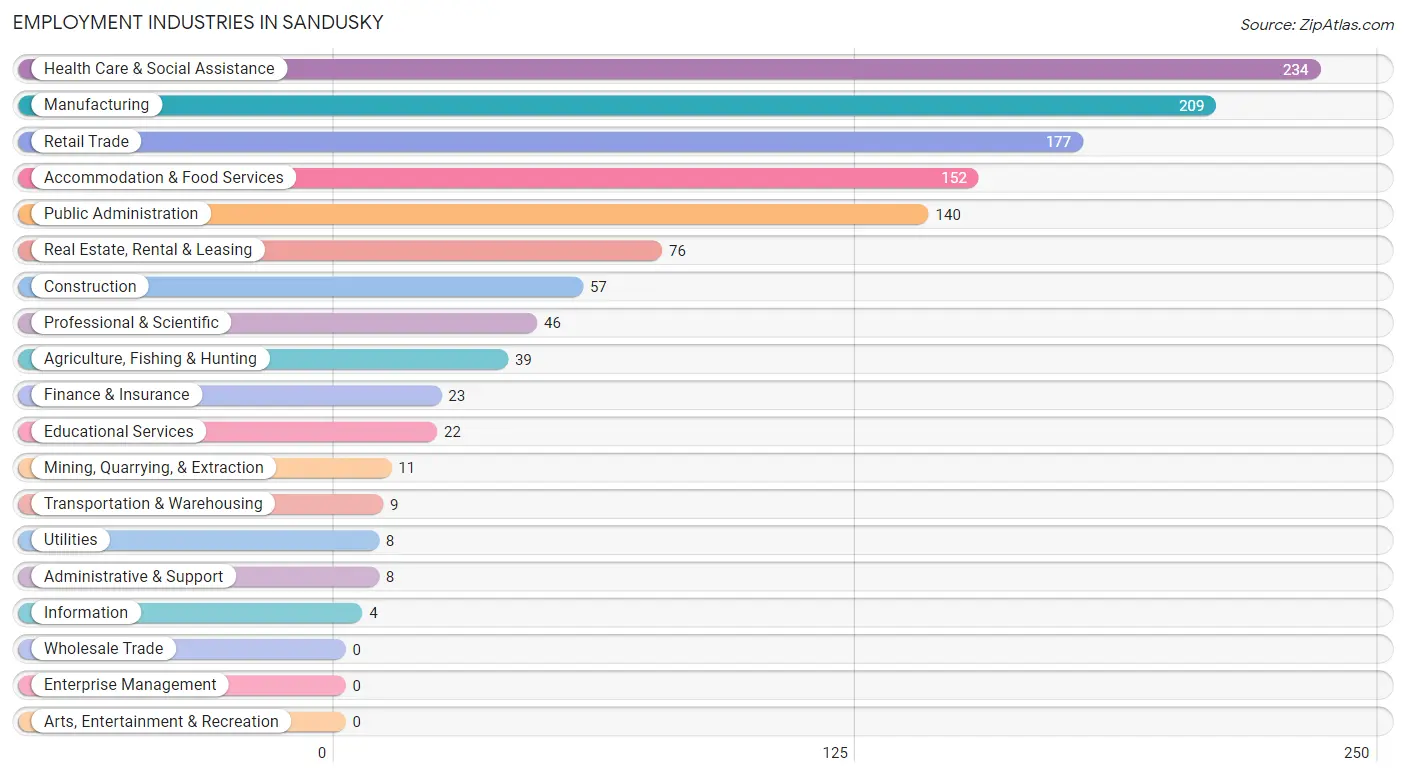
Employment Industries in Sandusky
The major employment industries in Sandusky include Health Care & Social Assistance (234 | 18.8%), Manufacturing (209 | 16.8%), Retail Trade (177 | 14.2%), Accommodation & Food Services (152 | 12.2%), and Public Administration (140 | 11.2%).
Employment Industries by Sex in Sandusky
The Sandusky industries that see more men than women are Agriculture, Fishing & Hunting (100.0%), Mining, Quarrying, & Extraction (100.0%), and Construction (100.0%), whereas the industries that tend to have a higher number of women are Public Administration (97.1%), Health Care & Social Assistance (84.2%), and Educational Services (77.3%).
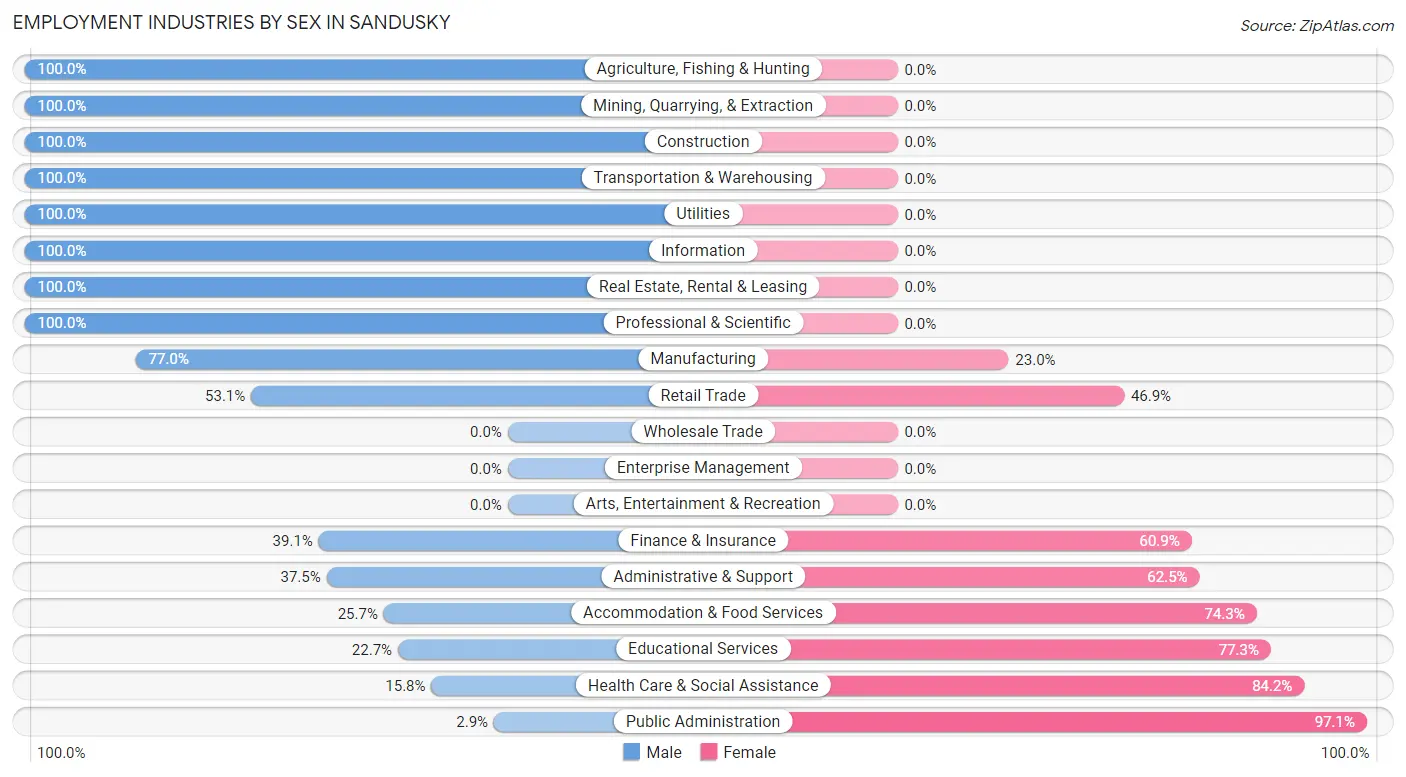
| Industry | Male | Female |
| Agriculture, Fishing & Hunting | 39 (100.0%) | 0 (0.0%) |
| Mining, Quarrying, & Extraction | 11 (100.0%) | 0 (0.0%) |
| Construction | 57 (100.0%) | 0 (0.0%) |
| Manufacturing | 161 (77.0%) | 48 (23.0%) |
| Wholesale Trade | 0 (0.0%) | 0 (0.0%) |
| Retail Trade | 94 (53.1%) | 83 (46.9%) |
| Transportation & Warehousing | 9 (100.0%) | 0 (0.0%) |
| Utilities | 8 (100.0%) | 0 (0.0%) |
| Information | 4 (100.0%) | 0 (0.0%) |
| Finance & Insurance | 9 (39.1%) | 14 (60.9%) |
| Real Estate, Rental & Leasing | 76 (100.0%) | 0 (0.0%) |
| Professional & Scientific | 46 (100.0%) | 0 (0.0%) |
| Enterprise Management | 0 (0.0%) | 0 (0.0%) |
| Administrative & Support | 3 (37.5%) | 5 (62.5%) |
| Educational Services | 5 (22.7%) | 17 (77.3%) |
| Health Care & Social Assistance | 37 (15.8%) | 197 (84.2%) |
| Arts, Entertainment & Recreation | 0 (0.0%) | 0 (0.0%) |
| Accommodation & Food Services | 39 (25.7%) | 113 (74.3%) |
| Public Administration | 4 (2.9%) | 136 (97.1%) |
| Total | 623 (50.0%) | 622 (50.0%) |
Education in Sandusky
School Enrollment in Sandusky
The most common levels of schooling among the 507 students in Sandusky are high school (177 | 34.9%), middle school (112 | 22.1%), and elementary school (110 | 21.7%).
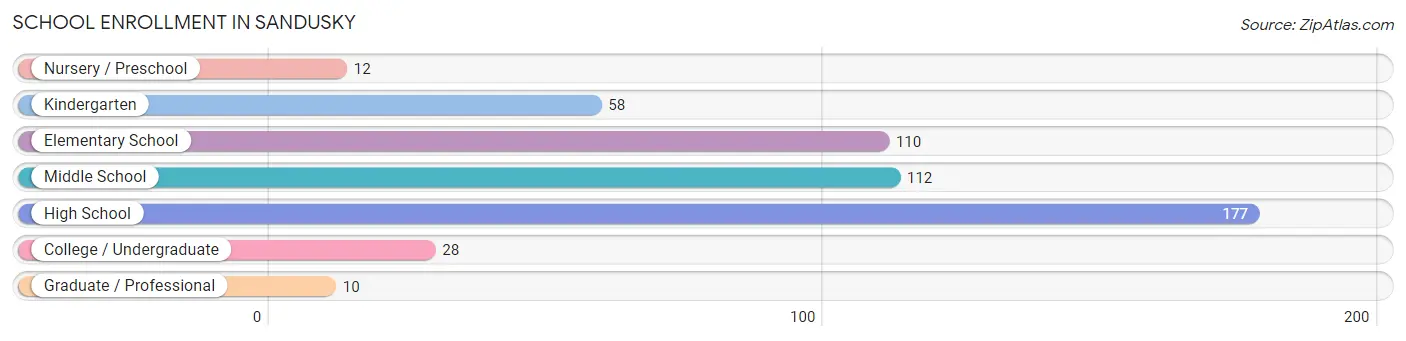
| School Level | # Students | % Students |
| Nursery / Preschool | 12 | 2.4% |
| Kindergarten | 58 | 11.4% |
| Elementary School | 110 | 21.7% |
| Middle School | 112 | 22.1% |
| High School | 177 | 34.9% |
| College / Undergraduate | 28 | 5.5% |
| Graduate / Professional | 10 | 2.0% |
| Total | 507 | 100.0% |
School Enrollment by Age by Funding Source in Sandusky
Out of a total of 507 students who are enrolled in schools in Sandusky, 20 (3.9%) attend a private institution, while the remaining 487 (96.1%) are enrolled in public schools. The age group of 20 to 24 year olds has the highest likelihood of being enrolled in private schools, with 14 (73.7% in the age bracket) enrolled. Conversely, the age group of 5 to 9 year old has the lowest likelihood of being enrolled in a private school, with 174 (100.0% in the age bracket) attending a public institution.
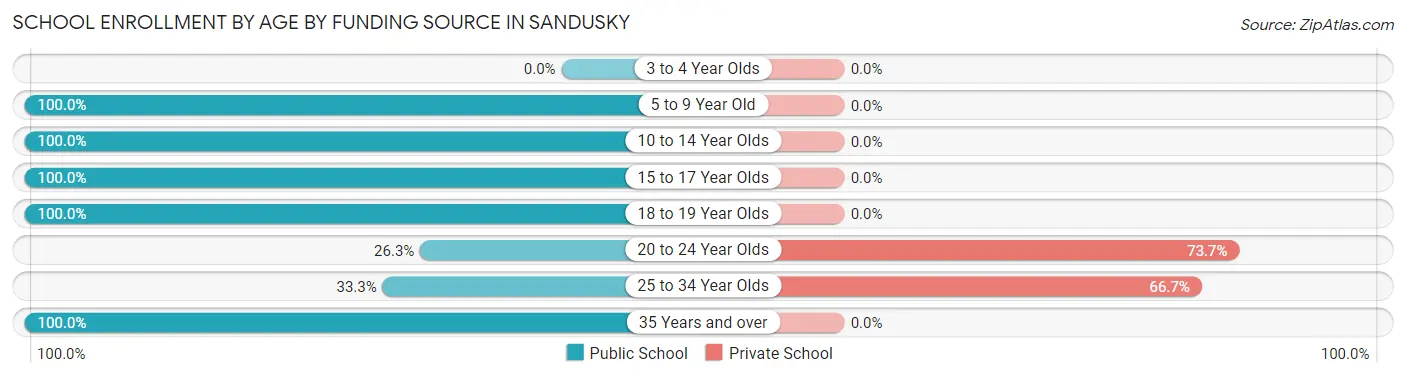
| Age Bracket | Public School | Private School |
| 3 to 4 Year Olds | 0 (0.0%) | 0 (0.0%) |
| 5 to 9 Year Old | 174 (100.0%) | 0 (0.0%) |
| 10 to 14 Year Olds | 146 (100.0%) | 0 (0.0%) |
| 15 to 17 Year Olds | 122 (100.0%) | 0 (0.0%) |
| 18 to 19 Year Olds | 27 (100.0%) | 0 (0.0%) |
| 20 to 24 Year Olds | 5 (26.3%) | 14 (73.7%) |
| 25 to 34 Year Olds | 3 (33.3%) | 6 (66.7%) |
| 35 Years and over | 10 (100.0%) | 0 (0.0%) |
| Total | 487 (96.1%) | 20 (3.9%) |
Educational Attainment by Field of Study in Sandusky
Business (116 | 32.8%), education (69 | 19.5%), arts & humanities (65 | 18.4%), science & technology (26 | 7.3%), and computers & mathematics (24 | 6.8%) are the most common fields of study among 354 individuals in Sandusky who have obtained a bachelor's degree or higher.
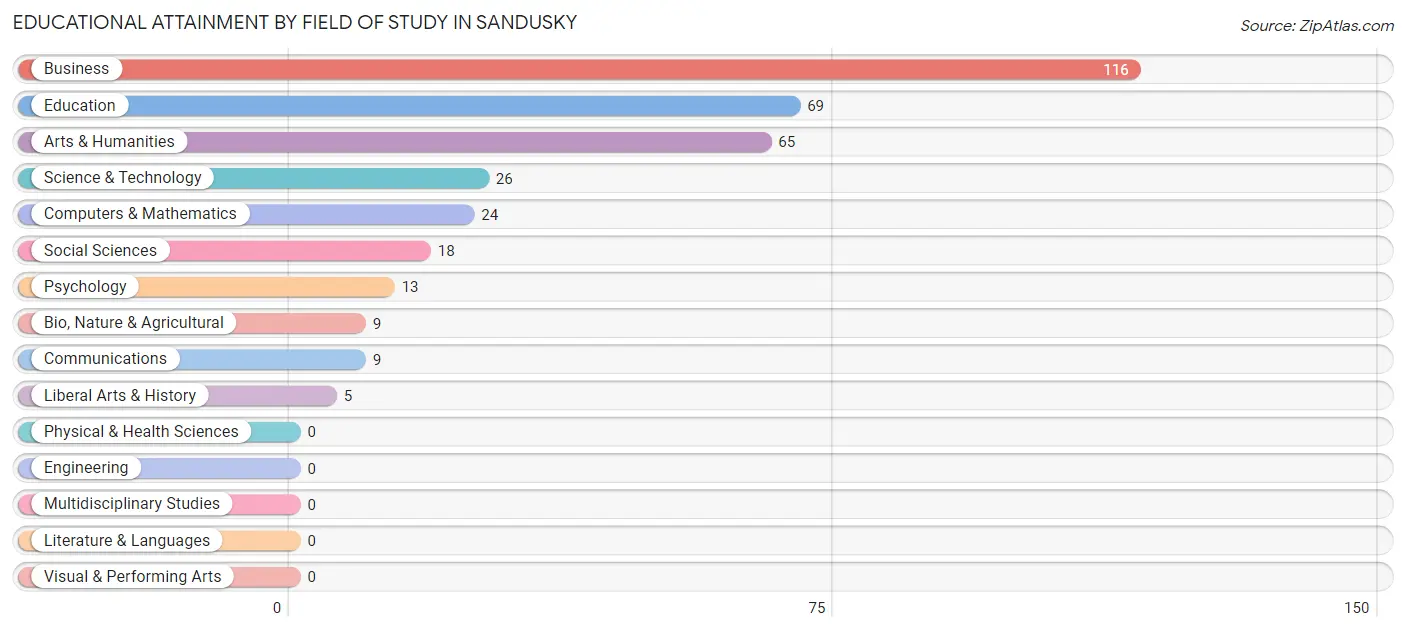
| Field of Study | # Graduates | % Graduates |
| Computers & Mathematics | 24 | 6.8% |
| Bio, Nature & Agricultural | 9 | 2.5% |
| Physical & Health Sciences | 0 | 0.0% |
| Psychology | 13 | 3.7% |
| Social Sciences | 18 | 5.1% |
| Engineering | 0 | 0.0% |
| Multidisciplinary Studies | 0 | 0.0% |
| Science & Technology | 26 | 7.3% |
| Business | 116 | 32.8% |
| Education | 69 | 19.5% |
| Literature & Languages | 0 | 0.0% |
| Liberal Arts & History | 5 | 1.4% |
| Visual & Performing Arts | 0 | 0.0% |
| Communications | 9 | 2.5% |
| Arts & Humanities | 65 | 18.4% |
| Total | 354 | 100.0% |
Transportation & Commute in Sandusky
Vehicle Availability by Sex in Sandusky
The most prevalent vehicle ownership categories in Sandusky are males with 2 vehicles (315, accounting for 50.6%) and females with 2 vehicles (300, making up 56.0%).
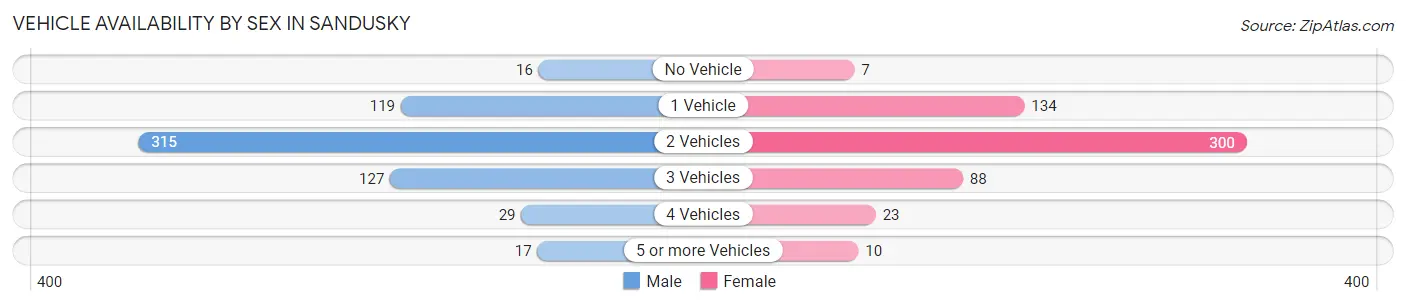
| Vehicles Available | Male | Female |
| No Vehicle | 16 (2.6%) | 7 (1.3%) |
| 1 Vehicle | 119 (19.1%) | 134 (23.8%) |
| 2 Vehicles | 315 (50.6%) | 300 (53.4%) |
| 3 Vehicles | 127 (20.4%) | 88 (15.7%) |
| 4 Vehicles | 29 (4.6%) | 23 (4.1%) |
| 5 or more Vehicles | 17 (2.7%) | 10 (1.8%) |
| Total | 623 (100.0%) | 562 (100.0%) |
Commute Time in Sandusky
The most frequently occuring commute durations in Sandusky are 5 to 9 minutes (385 commuters, 33.4%), less than 5 minutes (269 commuters, 23.3%), and 60 to 89 minutes (150 commuters, 13.0%).
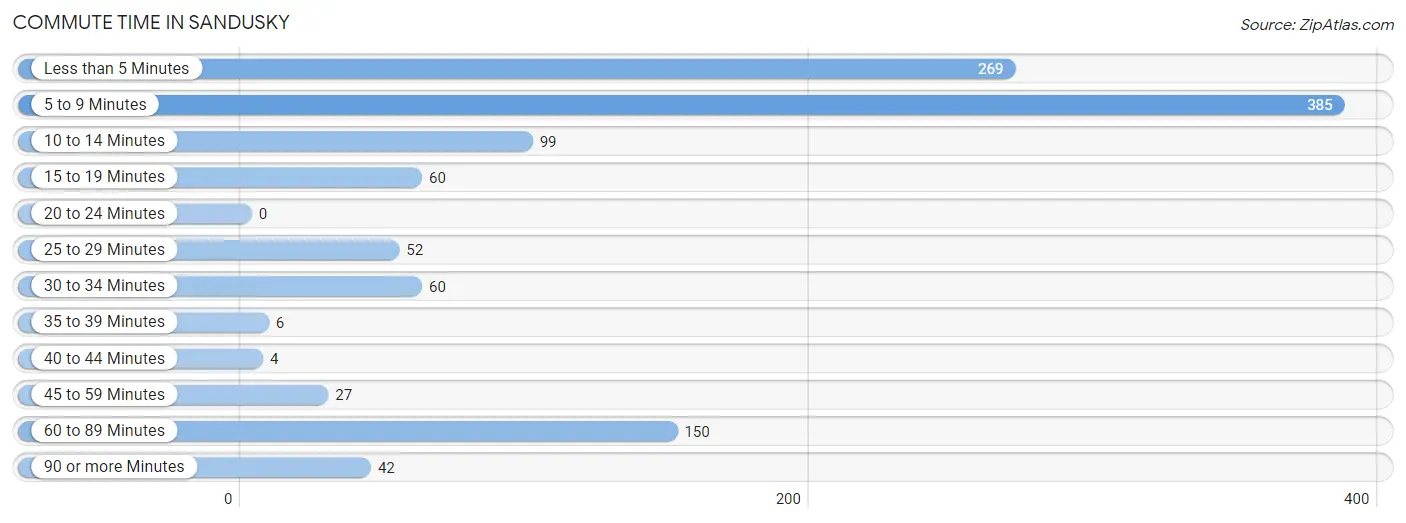
| Commute Time | # Commuters | % Commuters |
| Less than 5 Minutes | 269 | 23.3% |
| 5 to 9 Minutes | 385 | 33.4% |
| 10 to 14 Minutes | 99 | 8.6% |
| 15 to 19 Minutes | 60 | 5.2% |
| 20 to 24 Minutes | 0 | 0.0% |
| 25 to 29 Minutes | 52 | 4.5% |
| 30 to 34 Minutes | 60 | 5.2% |
| 35 to 39 Minutes | 6 | 0.5% |
| 40 to 44 Minutes | 4 | 0.4% |
| 45 to 59 Minutes | 27 | 2.3% |
| 60 to 89 Minutes | 150 | 13.0% |
| 90 or more Minutes | 42 | 3.6% |
Commute Time by Sex in Sandusky
The most common commute times in Sandusky are 5 to 9 minutes (152 commuters, 24.6%) for males and 5 to 9 minutes (233 commuters, 43.5%) for females.
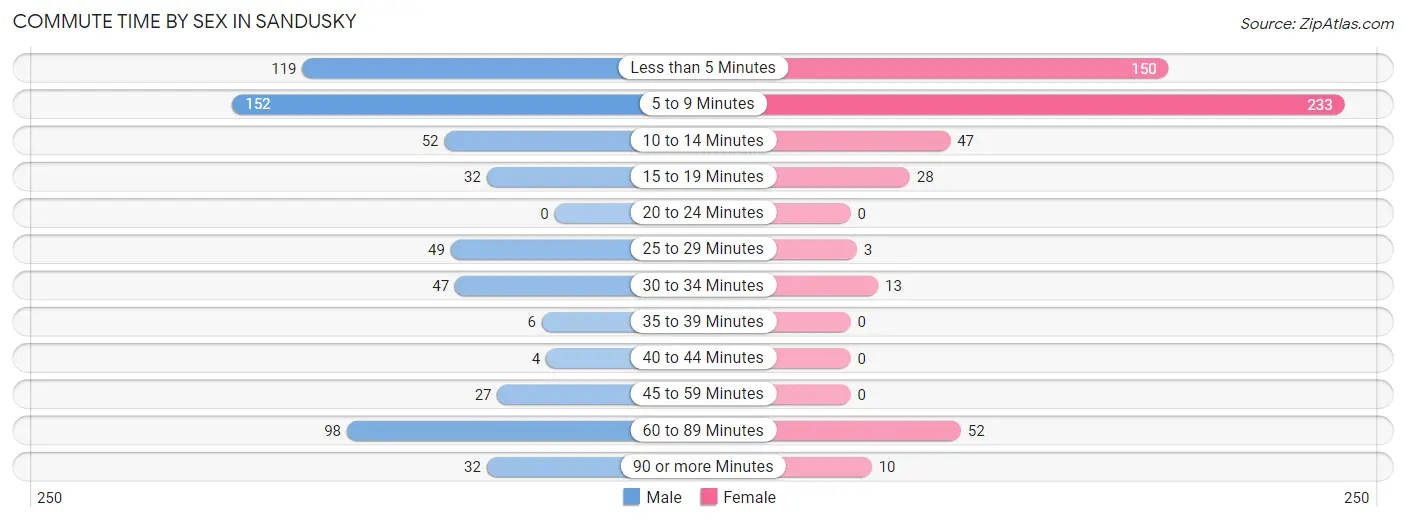
| Commute Time | Male | Female |
| Less than 5 Minutes | 119 (19.3%) | 150 (28.0%) |
| 5 to 9 Minutes | 152 (24.6%) | 233 (43.5%) |
| 10 to 14 Minutes | 52 (8.4%) | 47 (8.8%) |
| 15 to 19 Minutes | 32 (5.2%) | 28 (5.2%) |
| 20 to 24 Minutes | 0 (0.0%) | 0 (0.0%) |
| 25 to 29 Minutes | 49 (7.9%) | 3 (0.6%) |
| 30 to 34 Minutes | 47 (7.6%) | 13 (2.4%) |
| 35 to 39 Minutes | 6 (1.0%) | 0 (0.0%) |
| 40 to 44 Minutes | 4 (0.6%) | 0 (0.0%) |
| 45 to 59 Minutes | 27 (4.4%) | 0 (0.0%) |
| 60 to 89 Minutes | 98 (15.9%) | 52 (9.7%) |
| 90 or more Minutes | 32 (5.2%) | 10 (1.9%) |
Time of Departure to Work by Sex in Sandusky
The most frequent times of departure to work in Sandusky are 7:00 AM to 7:29 AM (163, 26.4%) for males and 7:30 AM to 7:59 AM (137, 25.6%) for females.
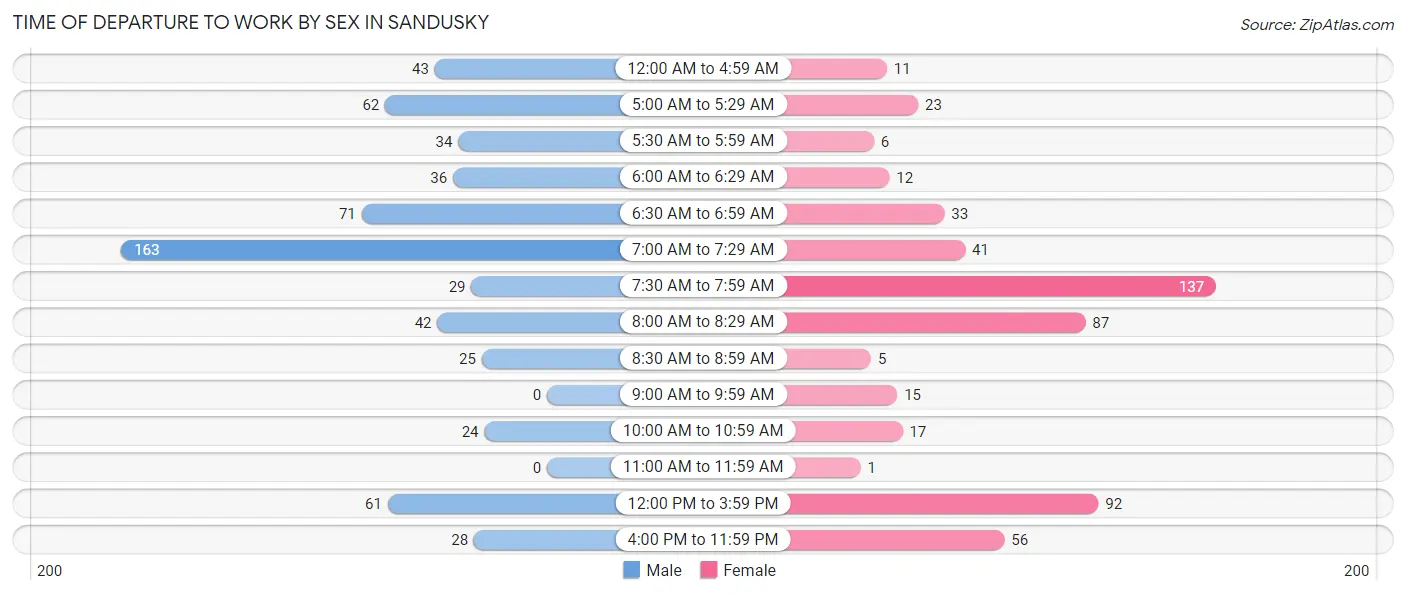
| Time of Departure | Male | Female |
| 12:00 AM to 4:59 AM | 43 (7.0%) | 11 (2.1%) |
| 5:00 AM to 5:29 AM | 62 (10.0%) | 23 (4.3%) |
| 5:30 AM to 5:59 AM | 34 (5.5%) | 6 (1.1%) |
| 6:00 AM to 6:29 AM | 36 (5.8%) | 12 (2.2%) |
| 6:30 AM to 6:59 AM | 71 (11.5%) | 33 (6.2%) |
| 7:00 AM to 7:29 AM | 163 (26.4%) | 41 (7.6%) |
| 7:30 AM to 7:59 AM | 29 (4.7%) | 137 (25.6%) |
| 8:00 AM to 8:29 AM | 42 (6.8%) | 87 (16.2%) |
| 8:30 AM to 8:59 AM | 25 (4.1%) | 5 (0.9%) |
| 9:00 AM to 9:59 AM | 0 (0.0%) | 15 (2.8%) |
| 10:00 AM to 10:59 AM | 24 (3.9%) | 17 (3.2%) |
| 11:00 AM to 11:59 AM | 0 (0.0%) | 1 (0.2%) |
| 12:00 PM to 3:59 PM | 61 (9.9%) | 92 (17.2%) |
| 4:00 PM to 11:59 PM | 28 (4.5%) | 56 (10.4%) |
| Total | 618 (100.0%) | 536 (100.0%) |
Housing Occupancy in Sandusky
Occupancy by Ownership in Sandusky
Of the total 1,173 dwellings in Sandusky, owner-occupied units account for 611 (52.1%), while renter-occupied units make up 562 (47.9%).
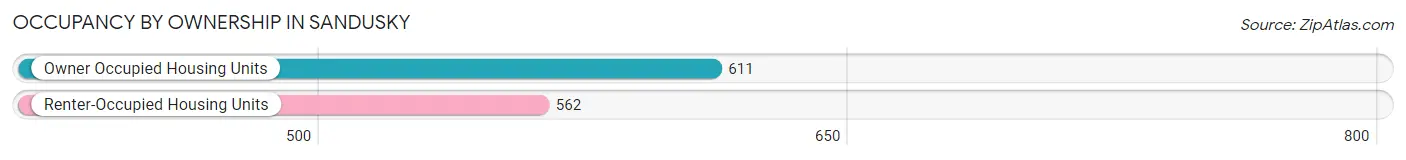
| Occupancy | # Housing Units | % Housing Units |
| Owner Occupied Housing Units | 611 | 52.1% |
| Renter-Occupied Housing Units | 562 | 47.9% |
| Total Occupied Housing Units | 1,173 | 100.0% |
Occupancy by Household Size in Sandusky
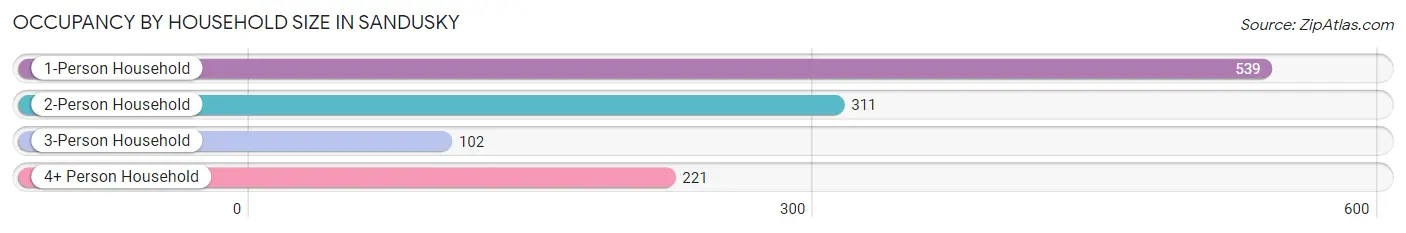
| Household Size | # Housing Units | % Housing Units |
| 1-Person Household | 539 | 46.0% |
| 2-Person Household | 311 | 26.5% |
| 3-Person Household | 102 | 8.7% |
| 4+ Person Household | 221 | 18.8% |
| Total Housing Units | 1,173 | 100.0% |
Occupancy by Ownership by Household Size in Sandusky
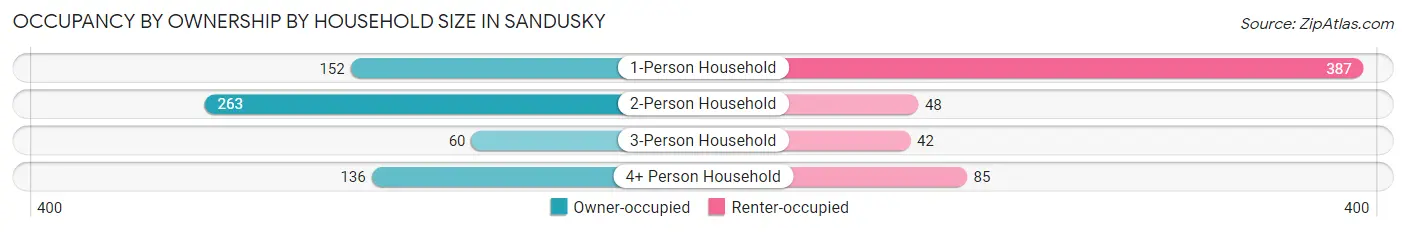
| Household Size | Owner-occupied | Renter-occupied |
| 1-Person Household | 152 (28.2%) | 387 (71.8%) |
| 2-Person Household | 263 (84.6%) | 48 (15.4%) |
| 3-Person Household | 60 (58.8%) | 42 (41.2%) |
| 4+ Person Household | 136 (61.5%) | 85 (38.5%) |
| Total Housing Units | 611 (52.1%) | 562 (47.9%) |
Occupancy by Educational Attainment in Sandusky
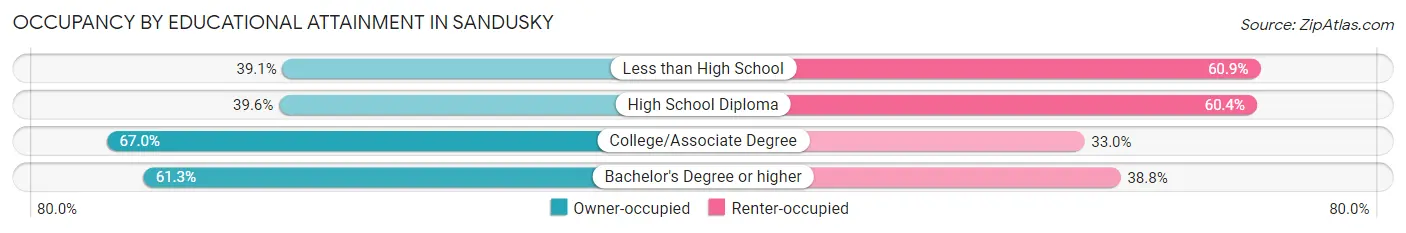
| Household Size | Owner-occupied | Renter-occupied |
| Less than High School | 77 (39.1%) | 120 (60.9%) |
| High School Diploma | 151 (39.6%) | 230 (60.4%) |
| College/Associate Degree | 217 (67.0%) | 107 (33.0%) |
| Bachelor's Degree or higher | 166 (61.3%) | 105 (38.8%) |
Occupancy by Age of Householder in Sandusky
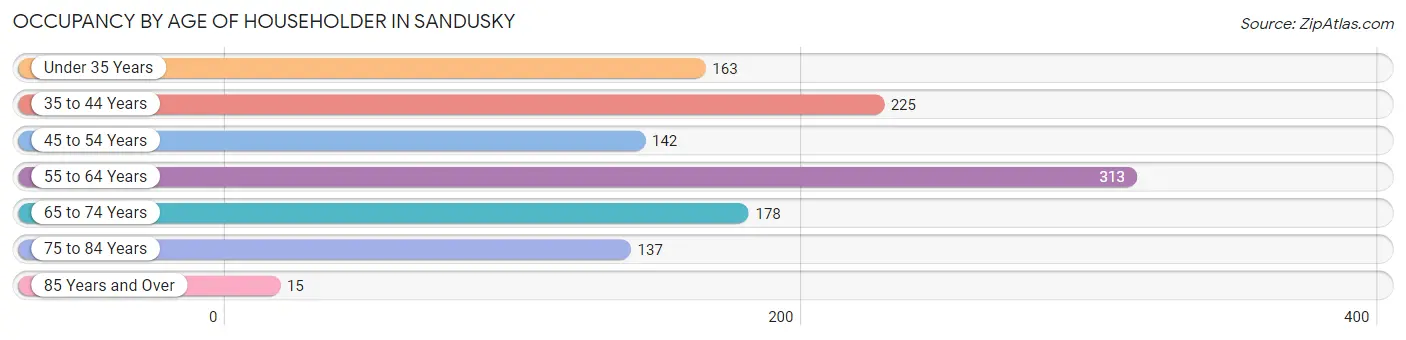
| Age Bracket | # Households | % Households |
| Under 35 Years | 163 | 13.9% |
| 35 to 44 Years | 225 | 19.2% |
| 45 to 54 Years | 142 | 12.1% |
| 55 to 64 Years | 313 | 26.7% |
| 65 to 74 Years | 178 | 15.2% |
| 75 to 84 Years | 137 | 11.7% |
| 85 Years and Over | 15 | 1.3% |
| Total | 1,173 | 100.0% |
Housing Finances in Sandusky
Median Income by Occupancy in Sandusky
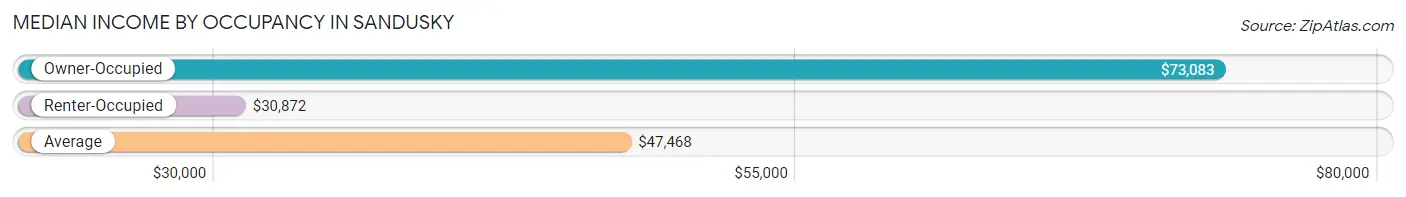
| Occupancy Type | # Households | Median Income |
| Owner-Occupied | 611 (52.1%) | $73,083 |
| Renter-Occupied | 562 (47.9%) | $30,872 |
| Average | 1,173 (100.0%) | $47,468 |
Occupancy by Householder Income Bracket in Sandusky
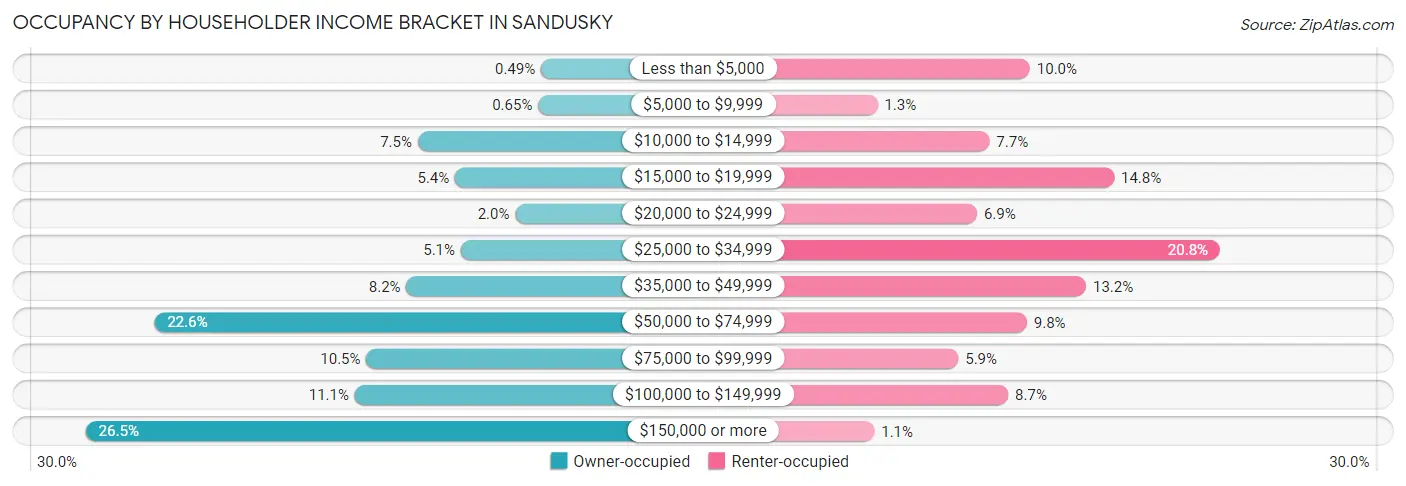
| Income Bracket | Owner-occupied | Renter-occupied |
| Less than $5,000 | 3 (0.5%) | 56 (10.0%) |
| $5,000 to $9,999 | 4 (0.6%) | 7 (1.3%) |
| $10,000 to $14,999 | 46 (7.5%) | 43 (7.6%) |
| $15,000 to $19,999 | 33 (5.4%) | 83 (14.8%) |
| $20,000 to $24,999 | 12 (2.0%) | 39 (6.9%) |
| $25,000 to $34,999 | 31 (5.1%) | 117 (20.8%) |
| $35,000 to $49,999 | 50 (8.2%) | 74 (13.2%) |
| $50,000 to $74,999 | 138 (22.6%) | 55 (9.8%) |
| $75,000 to $99,999 | 64 (10.5%) | 33 (5.9%) |
| $100,000 to $149,999 | 68 (11.1%) | 49 (8.7%) |
| $150,000 or more | 162 (26.5%) | 6 (1.1%) |
| Total | 611 (100.0%) | 562 (100.0%) |
Monthly Housing Cost Tiers in Sandusky
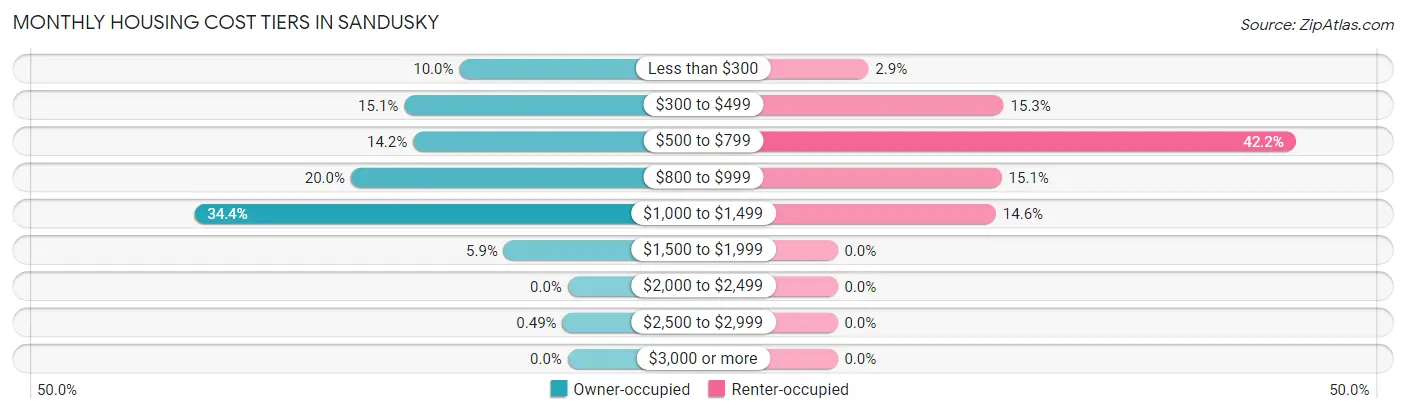
| Monthly Cost | Owner-occupied | Renter-occupied |
| Less than $300 | 61 (10.0%) | 16 (2.9%) |
| $300 to $499 | 92 (15.1%) | 86 (15.3%) |
| $500 to $799 | 87 (14.2%) | 237 (42.2%) |
| $800 to $999 | 122 (20.0%) | 85 (15.1%) |
| $1,000 to $1,499 | 210 (34.4%) | 82 (14.6%) |
| $1,500 to $1,999 | 36 (5.9%) | 0 (0.0%) |
| $2,000 to $2,499 | 0 (0.0%) | 0 (0.0%) |
| $2,500 to $2,999 | 3 (0.5%) | 0 (0.0%) |
| $3,000 or more | 0 (0.0%) | 0 (0.0%) |
| Total | 611 (100.0%) | 562 (100.0%) |
Physical Housing Characteristics in Sandusky
Housing Structures in Sandusky
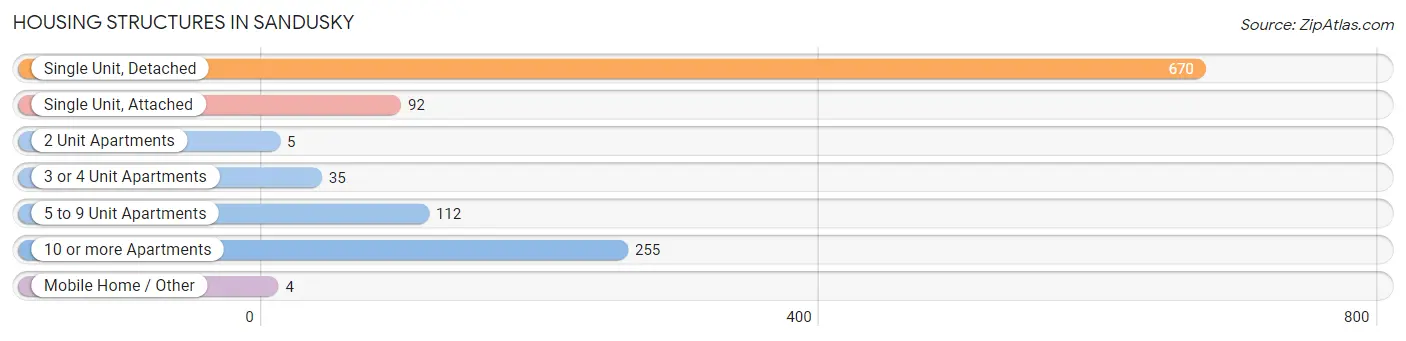
| Structure Type | # Housing Units | % Housing Units |
| Single Unit, Detached | 670 | 57.1% |
| Single Unit, Attached | 92 | 7.8% |
| 2 Unit Apartments | 5 | 0.4% |
| 3 or 4 Unit Apartments | 35 | 3.0% |
| 5 to 9 Unit Apartments | 112 | 9.6% |
| 10 or more Apartments | 255 | 21.7% |
| Mobile Home / Other | 4 | 0.3% |
| Total | 1,173 | 100.0% |
Housing Structures by Occupancy in Sandusky
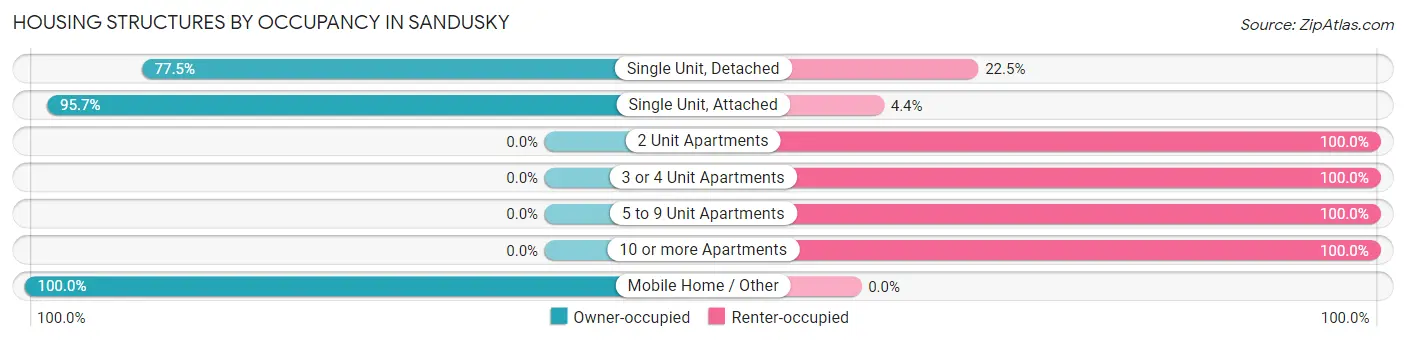
| Structure Type | Owner-occupied | Renter-occupied |
| Single Unit, Detached | 519 (77.5%) | 151 (22.5%) |
| Single Unit, Attached | 88 (95.7%) | 4 (4.3%) |
| 2 Unit Apartments | 0 (0.0%) | 5 (100.0%) |
| 3 or 4 Unit Apartments | 0 (0.0%) | 35 (100.0%) |
| 5 to 9 Unit Apartments | 0 (0.0%) | 112 (100.0%) |
| 10 or more Apartments | 0 (0.0%) | 255 (100.0%) |
| Mobile Home / Other | 4 (100.0%) | 0 (0.0%) |
| Total | 611 (52.1%) | 562 (47.9%) |
Housing Structures by Number of Rooms in Sandusky
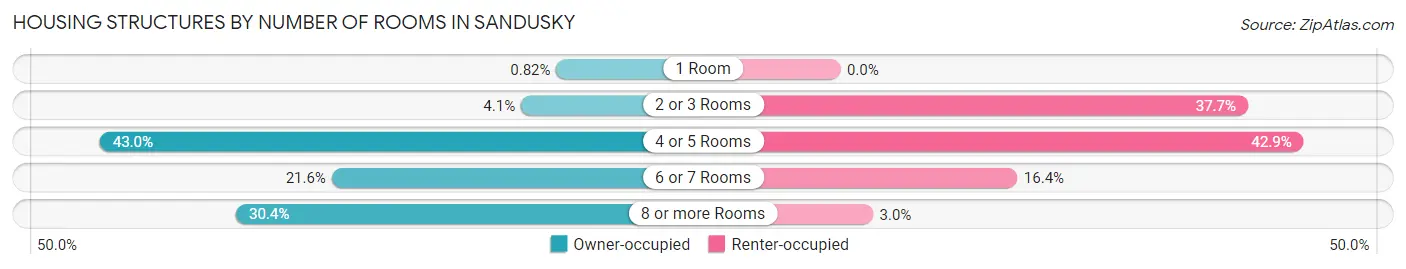
| Number of Rooms | Owner-occupied | Renter-occupied |
| 1 Room | 5 (0.8%) | 0 (0.0%) |
| 2 or 3 Rooms | 25 (4.1%) | 212 (37.7%) |
| 4 or 5 Rooms | 263 (43.0%) | 241 (42.9%) |
| 6 or 7 Rooms | 132 (21.6%) | 92 (16.4%) |
| 8 or more Rooms | 186 (30.4%) | 17 (3.0%) |
| Total | 611 (100.0%) | 562 (100.0%) |
Housing Structure by Heating Type in Sandusky
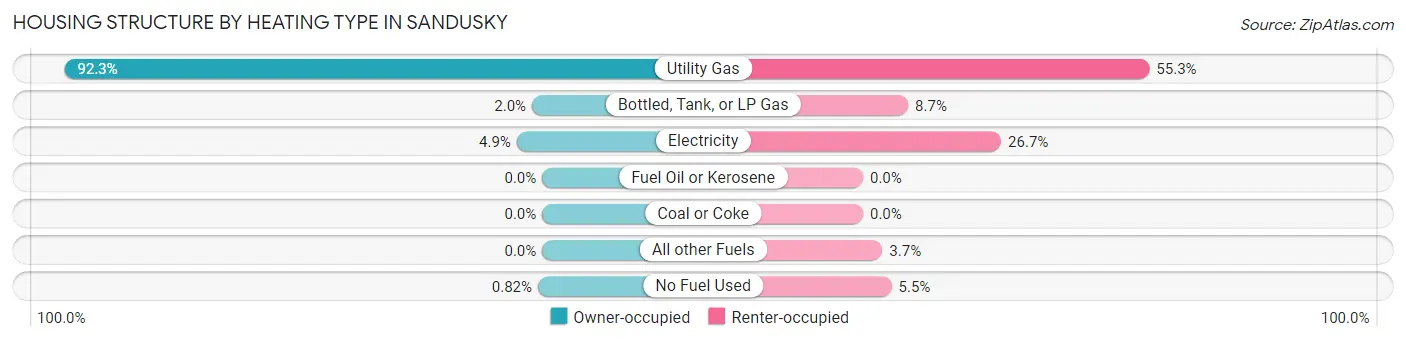
| Heating Type | Owner-occupied | Renter-occupied |
| Utility Gas | 564 (92.3%) | 311 (55.3%) |
| Bottled, Tank, or LP Gas | 12 (2.0%) | 49 (8.7%) |
| Electricity | 30 (4.9%) | 150 (26.7%) |
| Fuel Oil or Kerosene | 0 (0.0%) | 0 (0.0%) |
| Coal or Coke | 0 (0.0%) | 0 (0.0%) |
| All other Fuels | 0 (0.0%) | 21 (3.7%) |
| No Fuel Used | 5 (0.8%) | 31 (5.5%) |
| Total | 611 (100.0%) | 562 (100.0%) |
Household Vehicle Usage in Sandusky
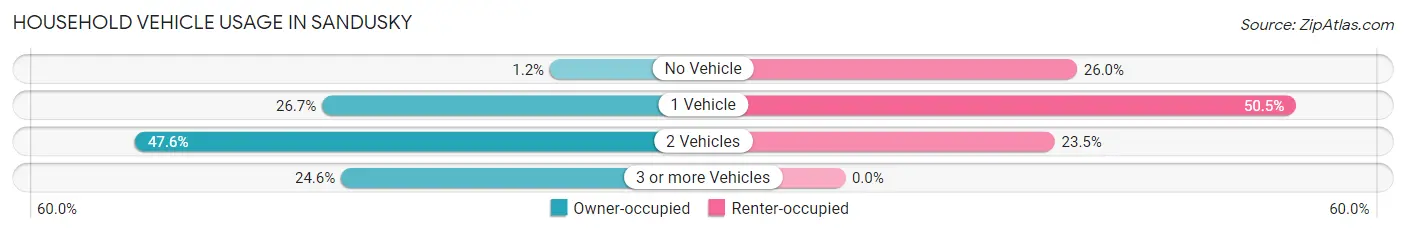
| Vehicles per Household | Owner-occupied | Renter-occupied |
| No Vehicle | 7 (1.1%) | 146 (26.0%) |
| 1 Vehicle | 163 (26.7%) | 284 (50.5%) |
| 2 Vehicles | 291 (47.6%) | 132 (23.5%) |
| 3 or more Vehicles | 150 (24.5%) | 0 (0.0%) |
| Total | 611 (100.0%) | 562 (100.0%) |
Real Estate & Mortgages in Sandusky
Real Estate and Mortgage Overview in Sandusky
| Characteristic | Without Mortgage | With Mortgage |
| Housing Units | 244 | 367 |
| Median Property Value | $93,500 | $123,900 |
| Median Household Income | $46,500 | $150 |
| Monthly Housing Costs | $452 | $0 |
| Real Estate Taxes | $1,378 | $6 |
Property Value by Mortgage Status in Sandusky
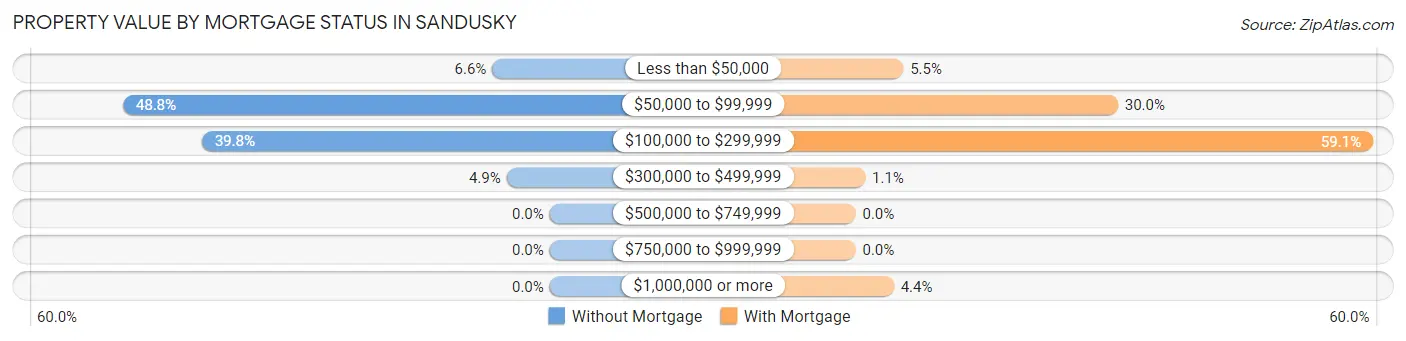
| Property Value | Without Mortgage | With Mortgage |
| Less than $50,000 | 16 (6.6%) | 20 (5.4%) |
| $50,000 to $99,999 | 119 (48.8%) | 110 (30.0%) |
| $100,000 to $299,999 | 97 (39.8%) | 217 (59.1%) |
| $300,000 to $499,999 | 12 (4.9%) | 4 (1.1%) |
| $500,000 to $749,999 | 0 (0.0%) | 0 (0.0%) |
| $750,000 to $999,999 | 0 (0.0%) | 0 (0.0%) |
| $1,000,000 or more | 0 (0.0%) | 16 (4.4%) |
| Total | 244 (100.0%) | 367 (100.0%) |
Household Income by Mortgage Status in Sandusky
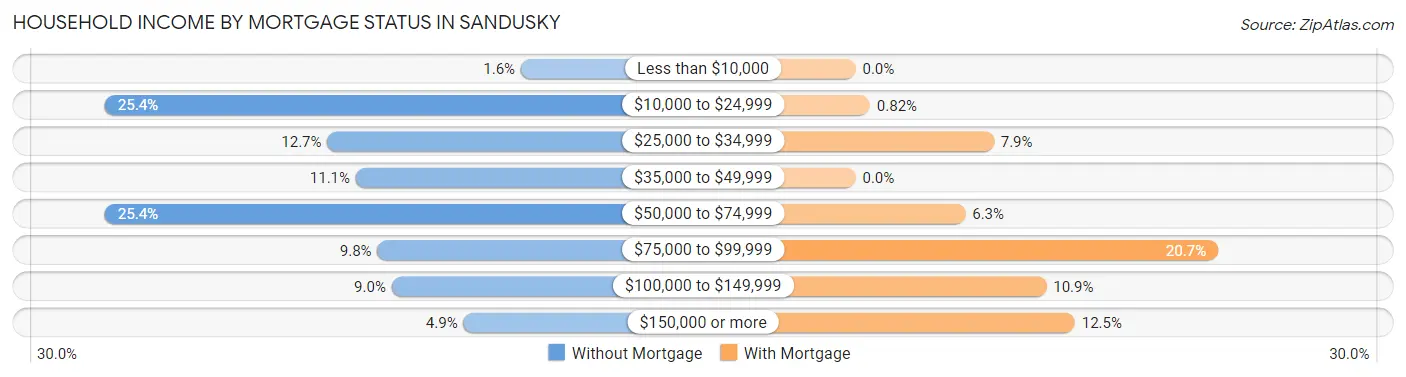
| Household Income | Without Mortgage | With Mortgage |
| Less than $10,000 | 4 (1.6%) | 0 (0.0%) |
| $10,000 to $24,999 | 62 (25.4%) | 3 (0.8%) |
| $25,000 to $34,999 | 31 (12.7%) | 29 (7.9%) |
| $35,000 to $49,999 | 27 (11.1%) | 0 (0.0%) |
| $50,000 to $74,999 | 62 (25.4%) | 23 (6.3%) |
| $75,000 to $99,999 | 24 (9.8%) | 76 (20.7%) |
| $100,000 to $149,999 | 22 (9.0%) | 40 (10.9%) |
| $150,000 or more | 12 (4.9%) | 46 (12.5%) |
| Total | 244 (100.0%) | 367 (100.0%) |
Property Value to Household Income Ratio in Sandusky
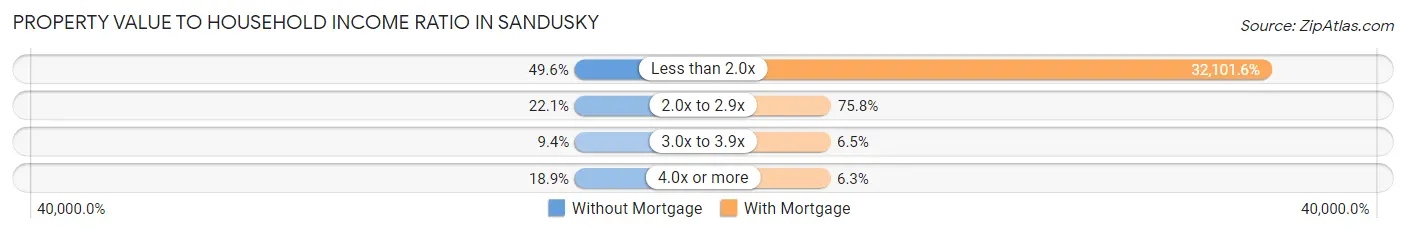
| Value-to-Income Ratio | Without Mortgage | With Mortgage |
| Less than 2.0x | 121 (49.6%) | 117,813 (32,101.6%) |
| 2.0x to 2.9x | 54 (22.1%) | 278 (75.7%) |
| 3.0x to 3.9x | 23 (9.4%) | 24 (6.5%) |
| 4.0x or more | 46 (18.9%) | 23 (6.3%) |
| Total | 244 (100.0%) | 367 (100.0%) |
Real Estate Taxes by Mortgage Status in Sandusky
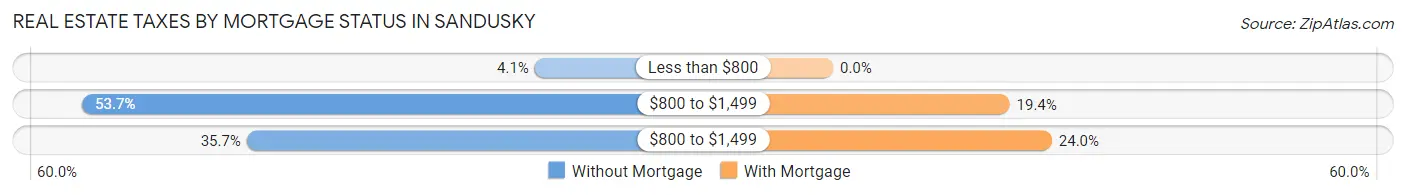
| Property Taxes | Without Mortgage | With Mortgage |
| Less than $800 | 10 (4.1%) | 0 (0.0%) |
| $800 to $1,499 | 131 (53.7%) | 71 (19.4%) |
| $800 to $1,499 | 87 (35.7%) | 88 (24.0%) |
| Total | 244 (100.0%) | 367 (100.0%) |
Health & Disability in Sandusky
Health Insurance Coverage by Age in Sandusky
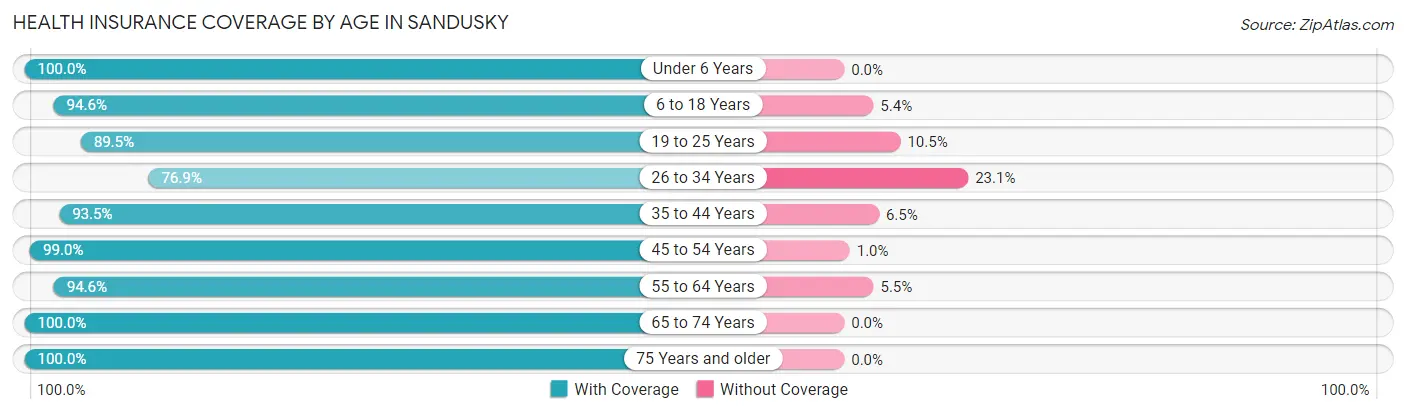
| Age Bracket | With Coverage | Without Coverage |
| Under 6 Years | 139 (100.0%) | 0 (0.0%) |
| 6 to 18 Years | 383 (94.6%) | 22 (5.4%) |
| 19 to 25 Years | 188 (89.5%) | 22 (10.5%) |
| 26 to 34 Years | 163 (76.9%) | 49 (23.1%) |
| 35 to 44 Years | 304 (93.5%) | 21 (6.5%) |
| 45 to 54 Years | 290 (99.0%) | 3 (1.0%) |
| 55 to 64 Years | 434 (94.6%) | 25 (5.4%) |
| 65 to 74 Years | 261 (100.0%) | 0 (0.0%) |
| 75 Years and older | 169 (100.0%) | 0 (0.0%) |
| Total | 2,331 (94.3%) | 142 (5.7%) |
Health Insurance Coverage by Citizenship Status in Sandusky
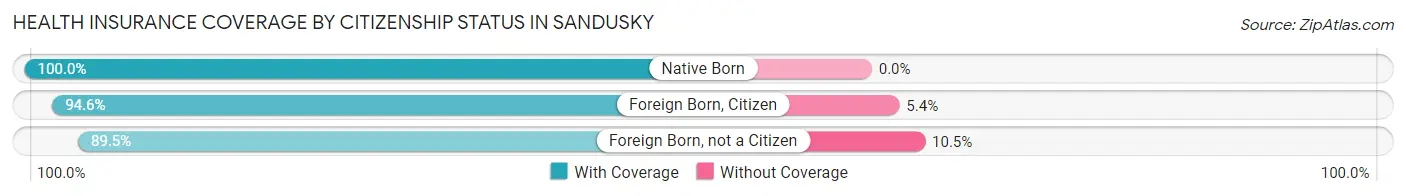
| Citizenship Status | With Coverage | Without Coverage |
| Native Born | 139 (100.0%) | 0 (0.0%) |
| Foreign Born, Citizen | 383 (94.6%) | 22 (5.4%) |
| Foreign Born, not a Citizen | 188 (89.5%) | 22 (10.5%) |
Health Insurance Coverage by Household Income in Sandusky
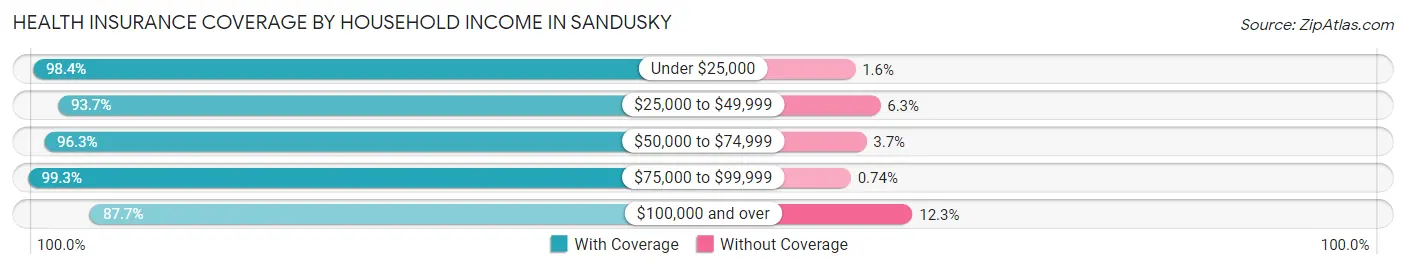
| Household Income | With Coverage | Without Coverage |
| Under $25,000 | 376 (98.4%) | 6 (1.6%) |
| $25,000 to $49,999 | 389 (93.7%) | 26 (6.3%) |
| $50,000 to $74,999 | 473 (96.3%) | 18 (3.7%) |
| $75,000 to $99,999 | 404 (99.3%) | 3 (0.7%) |
| $100,000 and over | 636 (87.7%) | 89 (12.3%) |
Public vs Private Health Insurance Coverage by Age in Sandusky
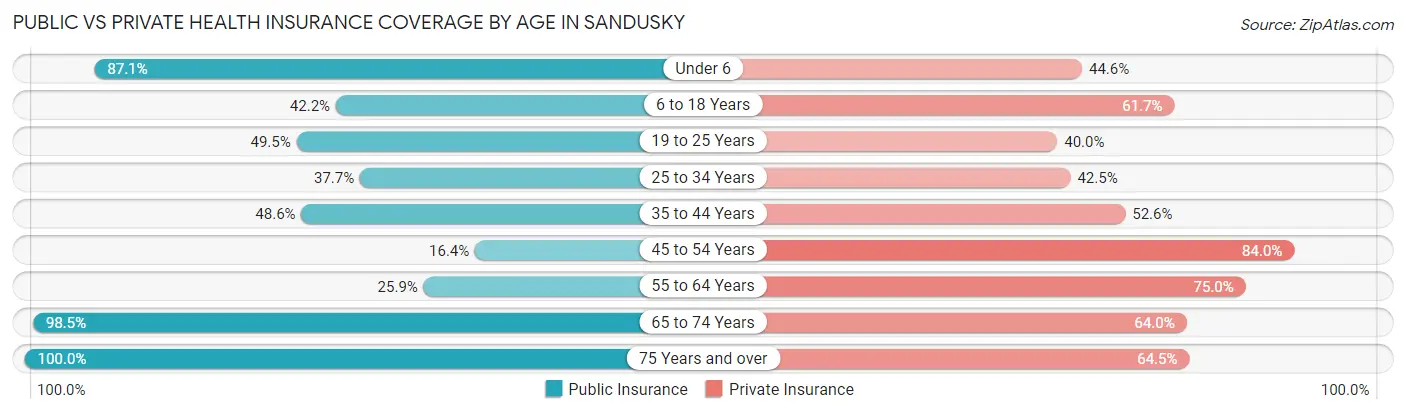
| Age Bracket | Public Insurance | Private Insurance |
| Under 6 | 121 (87.1%) | 62 (44.6%) |
| 6 to 18 Years | 171 (42.2%) | 250 (61.7%) |
| 19 to 25 Years | 104 (49.5%) | 84 (40.0%) |
| 25 to 34 Years | 80 (37.7%) | 90 (42.4%) |
| 35 to 44 Years | 158 (48.6%) | 171 (52.6%) |
| 45 to 54 Years | 48 (16.4%) | 246 (84.0%) |
| 55 to 64 Years | 119 (25.9%) | 344 (75.0%) |
| 65 to 74 Years | 257 (98.5%) | 167 (64.0%) |
| 75 Years and over | 169 (100.0%) | 109 (64.5%) |
| Total | 1,227 (49.6%) | 1,523 (61.6%) |
Disability Status by Sex by Age in Sandusky
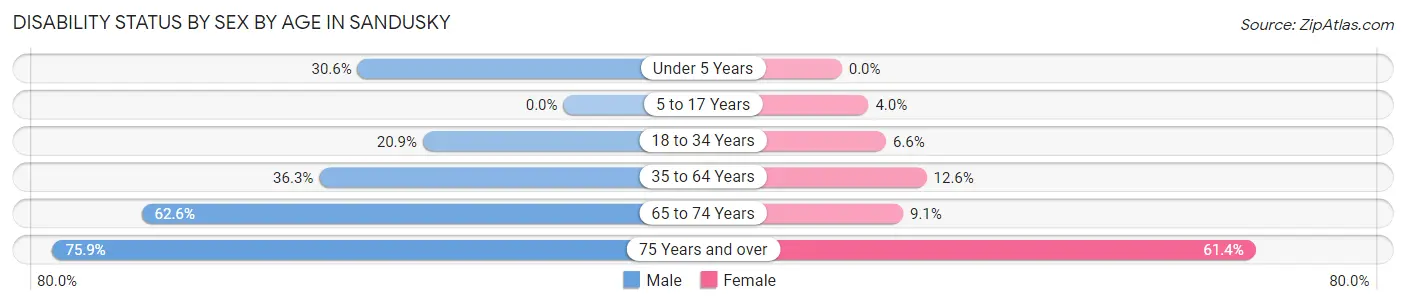
| Age Bracket | Male | Female |
| Under 5 Years | 11 (30.6%) | 0 (0.0%) |
| 5 to 17 Years | 0 (0.0%) | 9 (4.0%) |
| 18 to 34 Years | 53 (20.9%) | 12 (6.6%) |
| 35 to 64 Years | 186 (36.3%) | 71 (12.6%) |
| 65 to 74 Years | 67 (62.6%) | 14 (9.1%) |
| 75 Years and over | 22 (75.9%) | 86 (61.4%) |
Disability Class by Sex by Age in Sandusky
Disability Class: Hearing Difficulty
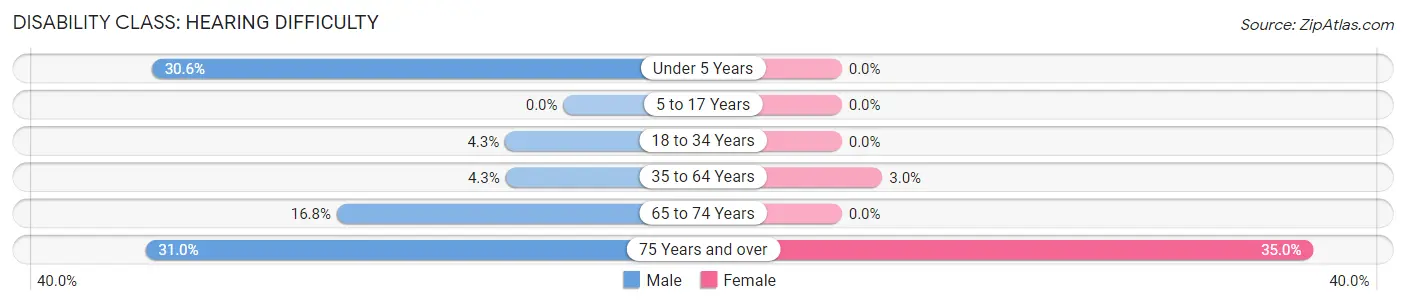
| Age Bracket | Male | Female |
| Under 5 Years | 11 (30.6%) | 0 (0.0%) |
| 5 to 17 Years | 0 (0.0%) | 0 (0.0%) |
| 18 to 34 Years | 11 (4.3%) | 0 (0.0%) |
| 35 to 64 Years | 22 (4.3%) | 17 (3.0%) |
| 65 to 74 Years | 18 (16.8%) | 0 (0.0%) |
| 75 Years and over | 9 (31.0%) | 49 (35.0%) |
Disability Class: Vision Difficulty
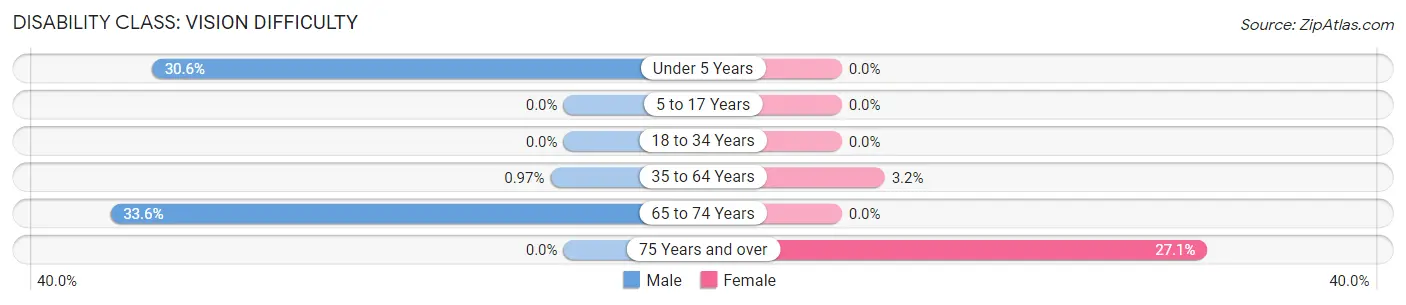
| Age Bracket | Male | Female |
| Under 5 Years | 11 (30.6%) | 0 (0.0%) |
| 5 to 17 Years | 0 (0.0%) | 0 (0.0%) |
| 18 to 34 Years | 0 (0.0%) | 0 (0.0%) |
| 35 to 64 Years | 5 (1.0%) | 18 (3.2%) |
| 65 to 74 Years | 36 (33.6%) | 0 (0.0%) |
| 75 Years and over | 0 (0.0%) | 38 (27.1%) |
Disability Class: Cognitive Difficulty
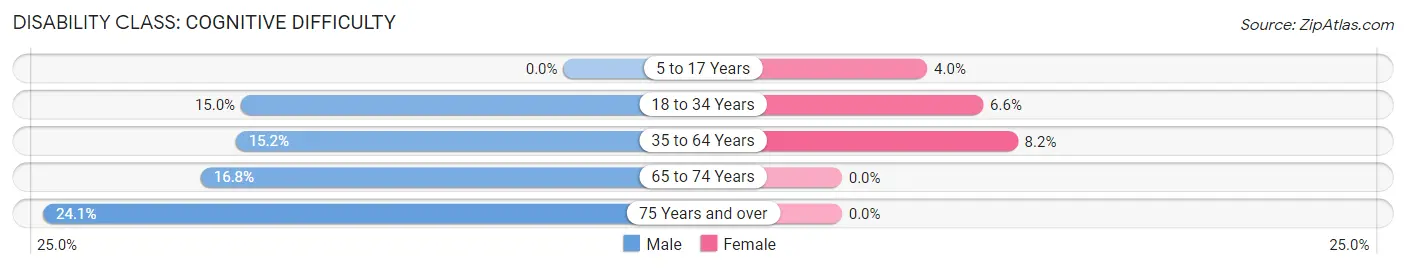
| Age Bracket | Male | Female |
| 5 to 17 Years | 0 (0.0%) | 9 (4.0%) |
| 18 to 34 Years | 38 (15.0%) | 12 (6.6%) |
| 35 to 64 Years | 78 (15.2%) | 46 (8.2%) |
| 65 to 74 Years | 18 (16.8%) | 0 (0.0%) |
| 75 Years and over | 7 (24.1%) | 0 (0.0%) |
Disability Class: Ambulatory Difficulty
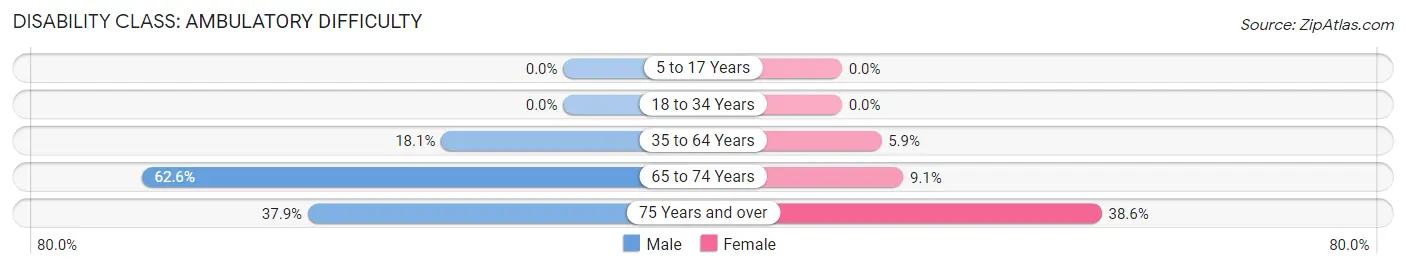
| Age Bracket | Male | Female |
| 5 to 17 Years | 0 (0.0%) | 0 (0.0%) |
| 18 to 34 Years | 0 (0.0%) | 0 (0.0%) |
| 35 to 64 Years | 93 (18.1%) | 33 (5.9%) |
| 65 to 74 Years | 67 (62.6%) | 14 (9.1%) |
| 75 Years and over | 11 (37.9%) | 54 (38.6%) |
Disability Class: Self-Care Difficulty
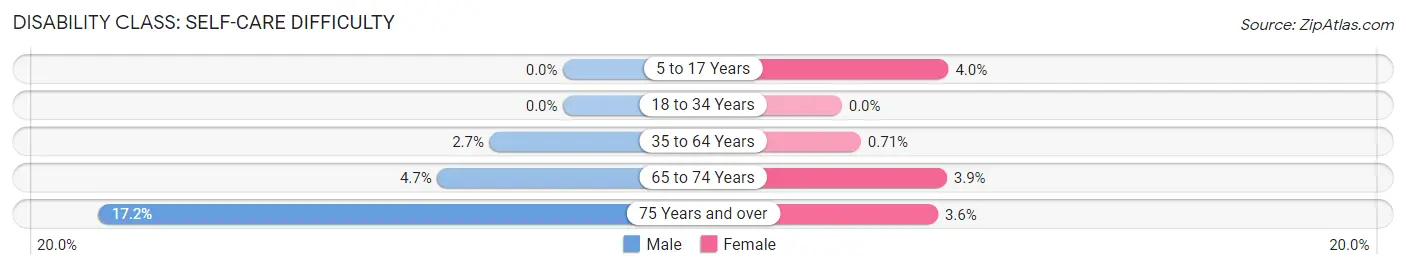
| Age Bracket | Male | Female |
| 5 to 17 Years | 0 (0.0%) | 9 (4.0%) |
| 18 to 34 Years | 0 (0.0%) | 0 (0.0%) |
| 35 to 64 Years | 14 (2.7%) | 4 (0.7%) |
| 65 to 74 Years | 5 (4.7%) | 6 (3.9%) |
| 75 Years and over | 5 (17.2%) | 5 (3.6%) |
Technology Access in Sandusky
Computing Device Access in Sandusky
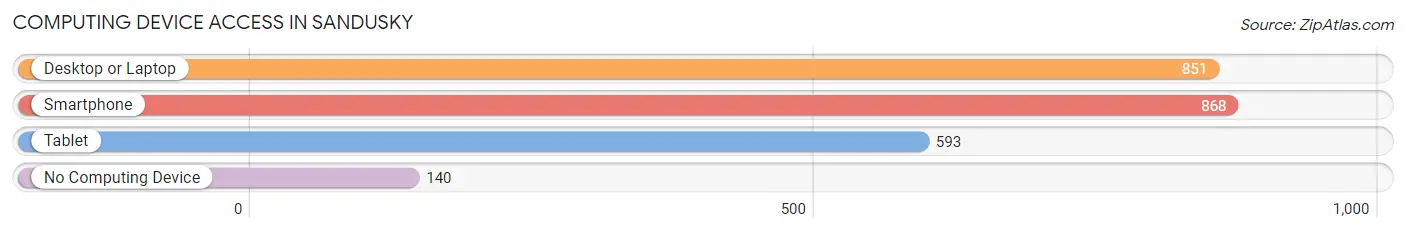
| Device Type | # Households | % Households |
| Desktop or Laptop | 851 | 72.6% |
| Smartphone | 868 | 74.0% |
| Tablet | 593 | 50.5% |
| No Computing Device | 140 | 11.9% |
| Total | 1,173 | 100.0% |
Internet Access in Sandusky
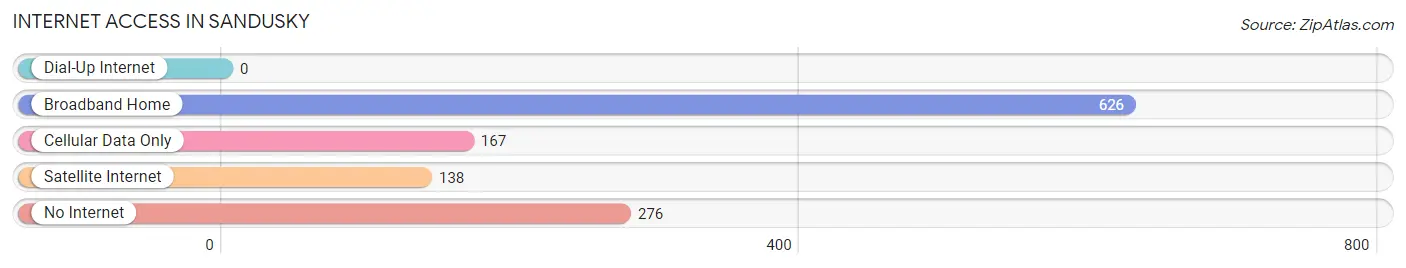
| Internet Type | # Households | % Households |
| Dial-Up Internet | 0 | 0.0% |
| Broadband Home | 626 | 53.4% |
| Cellular Data Only | 167 | 14.2% |
| Satellite Internet | 138 | 11.8% |
| No Internet | 276 | 23.5% |
| Total | 1,173 | 100.0% |
Sandusky Summary
Sandusky, Michigan is a small city located in Sanilac County in the state of Michigan. It is situated on the shores of Lake Huron, and is part of the Thumb region of Michigan. The city has a population of approximately 2,500 people, and is the county seat of Sanilac County.
History
Sandusky was first settled in 1854 by a group of settlers from New York. The settlement was originally called “Sandusky City”, and was named after the nearby Sandusky River. The settlement was incorporated as a village in 1867, and as a city in 1871.
In the late 19th century, Sandusky was a major lumbering center, and the city was home to several sawmills and lumber yards. The city also had a thriving shipbuilding industry, and several ships were built in the city’s shipyards.
In the early 20th century, Sandusky was a major center for the production of salt. The city was home to several salt mines, and the salt was used in the production of many products, including table salt, road salt, and industrial salt.
Geography
Sandusky is located in the Thumb region of Michigan, on the shores of Lake Huron. The city is situated on the banks of the Sandusky River, and is surrounded by rolling hills and farmland. The city is located approximately 60 miles north of Detroit, and is about a two-hour drive from the city.
The climate in Sandusky is generally mild, with warm summers and cold winters. The average temperature in the summer is around 70 degrees Fahrenheit, and the average temperature in the winter is around 20 degrees Fahrenheit.
Economy
The economy of Sandusky is largely based on agriculture and tourism. The city is home to several farms, and the surrounding area is known for its production of corn, soybeans, and wheat. The city is also home to several wineries, and the area is known for its production of wine.
Tourism is also an important part of the economy of Sandusky. The city is home to several parks and beaches, and is a popular destination for fishing, boating, and swimming. The city is also home to several museums, and is a popular destination for history buffs.
Demographics
As of the 2010 census, the population of Sandusky was 2,500 people. The racial makeup of the city was 95.2% White, 0.8% African American, 0.4% Native American, 0.4% Asian, 0.2% from other races, and 2.8% from two or more races. Hispanic or Latino of any race were 1.2% of the population.
The median income for a household in Sandusky was $37,500, and the median income for a family was $45,000. The per capita income for the city was $19,000. About 11.2% of families and 14.2% of the population were below the poverty line, including 18.2% of those under age 18 and 8.2% of those age 65 or over.
Sandusky is a small city with a rich history and a vibrant economy. The city is home to several farms and wineries, and is a popular destination for tourists. The city is also home to several parks and beaches, and is a great place to live for those who enjoy the outdoors.
Common Questions
What is the Total Population of Sandusky?
Total Population of Sandusky is 2,711.
What is the Total Male Population of Sandusky?
Total Male Population of Sandusky is 1,323.
What is the Total Female Population of Sandusky?
Total Female Population of Sandusky is 1,388.
What is the Ratio of Males per 100 Females in Sandusky?
There are 95.32 Males per 100 Females in Sandusky.
What is the Ratio of Females per 100 Males in Sandusky?
There are 104.91 Females per 100 Males in Sandusky.
What is the Median Population Age in Sandusky?
Median Population Age in Sandusky is 44.3 Years.
What is the Average Family Size in Sandusky
Average Family Size in Sandusky is 2.8 People.
What is the Average Household Size in Sandusky
Average Household Size in Sandusky is 2.1 People.
What is Per Capita Income in Sandusky?
Per Capita income in Sandusky is $32,581.
What is the Median Family Income in Sandusky?
Median Family Income in Sandusky is $71,290.
What is the Median Household income in Sandusky?
Median Household Income in Sandusky is $47,468.
What is Income or Wage Gap in Sandusky?
Income or Wage Gap in Sandusky is 20.3%.
Women in Sandusky earn 79.7 cents for every dollar earned by a man.
What is Inequality or Gini Index in Sandusky?
Inequality or Gini Index in Sandusky is 0.50.
How Large is the Labor Force in Sandusky?
There are 1,306 People in the Labor Forcein in Sandusky.
What is the Percentage of People in the Labor Force in Sandusky?
57.7% of People are in the Labor Force in Sandusky.
What is the Unemployment Rate in Sandusky?
Unemployment Rate in Sandusky is 4.2%.