Cities with the Most Immigrants from Morocco in Virginia
RELATED REPORTS & OPTIONS
Morocco
Virginia
Compare Cities
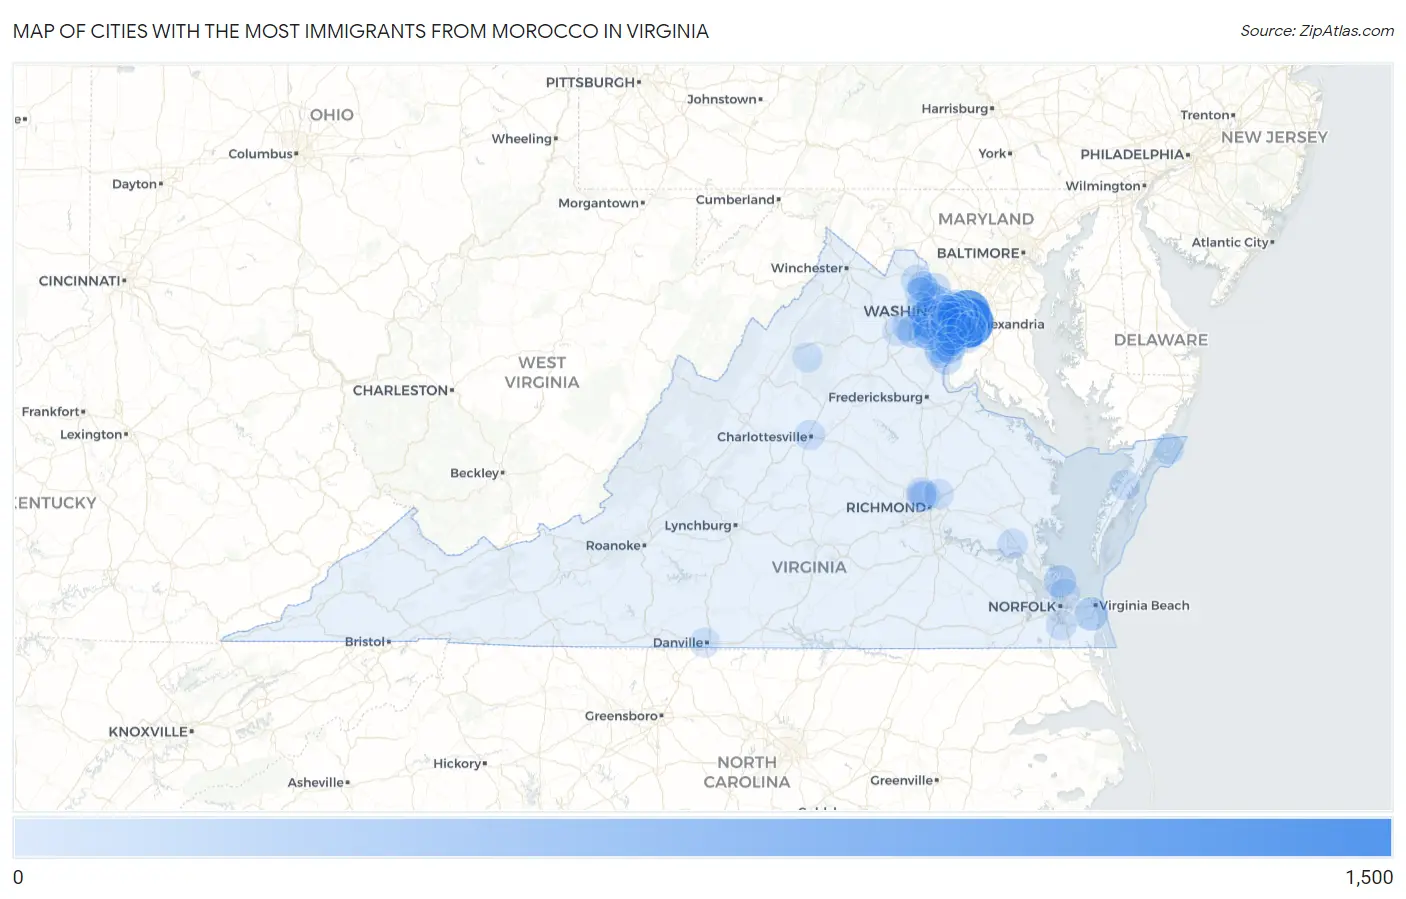
Map of Cities with the Most Immigrants from Morocco in Virginia
0
1,500
Cities with the Most Immigrants from Morocco in Virginia
| City | Morocco | vs State | vs National | |
| 1. | Alexandria | 1,116 | 7,733(14.43%)#1 | 88,055(1.27%)#7 |
| 2. | Arlington | 855 | 7,733(11.06%)#2 | 88,055(0.97%)#10 |
| 3. | Centreville | 499 | 7,733(6.45%)#3 | 88,055(0.57%)#16 |
| 4. | Groveton | 349 | 7,733(4.51%)#4 | 88,055(0.40%)#31 |
| 5. | Lake Barcroft | 285 | 7,733(3.69%)#5 | 88,055(0.32%)#39 |
| 6. | Idylwood | 283 | 7,733(3.66%)#6 | 88,055(0.32%)#41 |
| 7. | Bailey S Crossroads | 250 | 7,733(3.23%)#7 | 88,055(0.28%)#46 |
| 8. | Springfield | 201 | 7,733(2.60%)#8 | 88,055(0.23%)#62 |
| 9. | Virginia Beach | 194 | 7,733(2.51%)#9 | 88,055(0.22%)#68 |
| 10. | Linton Hall | 175 | 7,733(2.26%)#10 | 88,055(0.20%)#73 |
| 11. | Kingstowne | 173 | 7,733(2.24%)#11 | 88,055(0.20%)#75 |
| 12. | Hampton | 138 | 7,733(1.78%)#12 | 88,055(0.16%)#102 |
| 13. | Lake Ridge | 137 | 7,733(1.77%)#13 | 88,055(0.16%)#103 |
| 14. | Seven Corners | 135 | 7,733(1.75%)#14 | 88,055(0.15%)#106 |
| 15. | Reston | 134 | 7,733(1.73%)#15 | 88,055(0.15%)#107 |
| 16. | Leesylvania | 118 | 7,733(1.53%)#16 | 88,055(0.13%)#120 |
| 17. | Annandale | 111 | 7,733(1.44%)#17 | 88,055(0.13%)#129 |
| 18. | Rose Hill Cdp Fairfax County | 108 | 7,733(1.40%)#18 | 88,055(0.12%)#135 |
| 19. | Cherry Hill | 107 | 7,733(1.38%)#19 | 88,055(0.12%)#139 |
| 20. | Burke | 97 | 7,733(1.25%)#20 | 88,055(0.11%)#154 |
| 21. | Lorton | 97 | 7,733(1.25%)#21 | 88,055(0.11%)#155 |
| 22. | Dale City | 89 | 7,733(1.15%)#22 | 88,055(0.10%)#166 |
| 23. | Cascades | 85 | 7,733(1.10%)#23 | 88,055(0.10%)#174 |
| 24. | Manassas | 75 | 7,733(0.97%)#24 | 88,055(0.09%)#203 |
| 25. | Woodlawn Cdp Fairfax County | 70 | 7,733(0.91%)#25 | 88,055(0.08%)#217 |
| 26. | Ashburn | 68 | 7,733(0.88%)#26 | 88,055(0.08%)#226 |
| 27. | West Springfield | 60 | 7,733(0.78%)#27 | 88,055(0.07%)#260 |
| 28. | West Falls Church | 54 | 7,733(0.70%)#28 | 88,055(0.06%)#287 |
| 29. | Mclean | 52 | 7,733(0.67%)#29 | 88,055(0.06%)#297 |
| 30. | Potomac Mills | 52 | 7,733(0.67%)#30 | 88,055(0.06%)#303 |
| 31. | Chincoteague | 52 | 7,733(0.67%)#31 | 88,055(0.06%)#304 |
| 32. | Laurel Hill | 49 | 7,733(0.63%)#32 | 88,055(0.06%)#322 |
| 33. | Lakeside | 42 | 7,733(0.54%)#33 | 88,055(0.05%)#373 |
| 34. | Manassas Park | 37 | 7,733(0.48%)#34 | 88,055(0.04%)#407 |
| 35. | Moorefield | 37 | 7,733(0.48%)#35 | 88,055(0.04%)#408 |
| 36. | Montclair | 36 | 7,733(0.47%)#36 | 88,055(0.04%)#420 |
| 37. | Oak Grove | 36 | 7,733(0.47%)#37 | 88,055(0.04%)#425 |
| 38. | Gainesville | 34 | 7,733(0.44%)#38 | 88,055(0.04%)#441 |
| 39. | Leesburg | 33 | 7,733(0.43%)#39 | 88,055(0.04%)#448 |
| 40. | Tysons | 33 | 7,733(0.43%)#40 | 88,055(0.04%)#451 |
| 41. | Broadlands | 33 | 7,733(0.43%)#41 | 88,055(0.04%)#452 |
| 42. | Chantilly | 30 | 7,733(0.39%)#42 | 88,055(0.03%)#484 |
| 43. | South Riding | 29 | 7,733(0.38%)#43 | 88,055(0.03%)#498 |
| 44. | Kings Park West | 29 | 7,733(0.38%)#44 | 88,055(0.03%)#507 |
| 45. | Mount Vernon | 28 | 7,733(0.36%)#45 | 88,055(0.03%)#518 |
| 46. | Mantua | 27 | 7,733(0.35%)#46 | 88,055(0.03%)#538 |
| 47. | Hybla Valley | 26 | 7,733(0.34%)#47 | 88,055(0.03%)#544 |
| 48. | Chesapeake | 25 | 7,733(0.32%)#48 | 88,055(0.03%)#554 |
| 49. | Dumbarton | 25 | 7,733(0.32%)#49 | 88,055(0.03%)#569 |
| 50. | Norfolk | 24 | 7,733(0.31%)#50 | 88,055(0.03%)#574 |
| 51. | Woodbridge | 24 | 7,733(0.31%)#51 | 88,055(0.03%)#583 |
| 52. | Fairfax Station | 22 | 7,733(0.28%)#52 | 88,055(0.02%)#628 |
| 53. | Vienna | 20 | 7,733(0.26%)#53 | 88,055(0.02%)#667 |
| 54. | Buckhall | 19 | 7,733(0.25%)#54 | 88,055(0.02%)#692 |
| 55. | Merrifield | 18 | 7,733(0.23%)#55 | 88,055(0.02%)#708 |
| 56. | Burke Centre | 18 | 7,733(0.23%)#56 | 88,055(0.02%)#712 |
| 57. | Dunn Loring | 17 | 7,733(0.22%)#57 | 88,055(0.02%)#739 |
| 58. | Lincolnia | 15 | 7,733(0.19%)#58 | 88,055(0.02%)#783 |
| 59. | Williamsburg | 15 | 7,733(0.19%)#59 | 88,055(0.02%)#784 |
| 60. | Belmont | 15 | 7,733(0.19%)#60 | 88,055(0.02%)#788 |
| 61. | Oakton | 14 | 7,733(0.18%)#61 | 88,055(0.02%)#807 |
| 62. | Charlottesville | 13 | 7,733(0.17%)#62 | 88,055(0.01%)#823 |
| 63. | Woodburn | 13 | 7,733(0.17%)#63 | 88,055(0.01%)#839 |
| 64. | Laurel | 10 | 7,733(0.13%)#64 | 88,055(0.01%)#931 |
| 65. | North Springfield | 10 | 7,733(0.13%)#65 | 88,055(0.01%)#938 |
| 66. | Onley | 10 | 7,733(0.13%)#66 | 88,055(0.01%)#944 |
| 67. | Fairfax | 9 | 7,733(0.12%)#67 | 88,055(0.01%)#964 |
| 68. | Newington Forest | 9 | 7,733(0.12%)#68 | 88,055(0.01%)#974 |
| 69. | Mechanicsville | 8 | 7,733(0.10%)#69 | 88,055(0.01%)#1,001 |
| 70. | Franconia | 8 | 7,733(0.10%)#70 | 88,055(0.01%)#1,010 |
| 71. | Occoquan | 6 | 7,733(0.08%)#71 | 88,055(0.01%)#1,077 |
| 72. | Danville | 5 | 7,733(0.06%)#72 | 88,055(0.01%)#1,084 |
| 73. | New Baltimore | 5 | 7,733(0.06%)#73 | 88,055(0.01%)#1,088 |
| 74. | Huntington | 4 | 7,733(0.05%)#74 | 88,055(0.00%)#1,111 |
| 75. | Stanley | 4 | 7,733(0.05%)#75 | 88,055(0.00%)#1,121 |
Common Questions
What are the Top 10 Cities with the Most Immigrants from Morocco in Virginia?
Top 10 Cities with the Most Immigrants from Morocco in Virginia are:
#1
1,116
#2
855
#3
499
#4
349
#5
285
#6
283
#7
250
#8
201
#9
194
#10
175
What city has the Most Immigrants from Morocco in Virginia?
Alexandria has the Most Immigrants from Morocco in Virginia with 1,116.
What is the Total Immigrants from Morocco in the State of Virginia?
Total Immigrants from Morocco in Virginia is 7,733.
What is the Total Immigrants from Morocco in the United States?
Total Immigrants from Morocco in the United States is 88,055.