Cities with the Most Immigrants from Morocco in Florida
RELATED REPORTS & OPTIONS
Morocco
Florida
Compare Cities
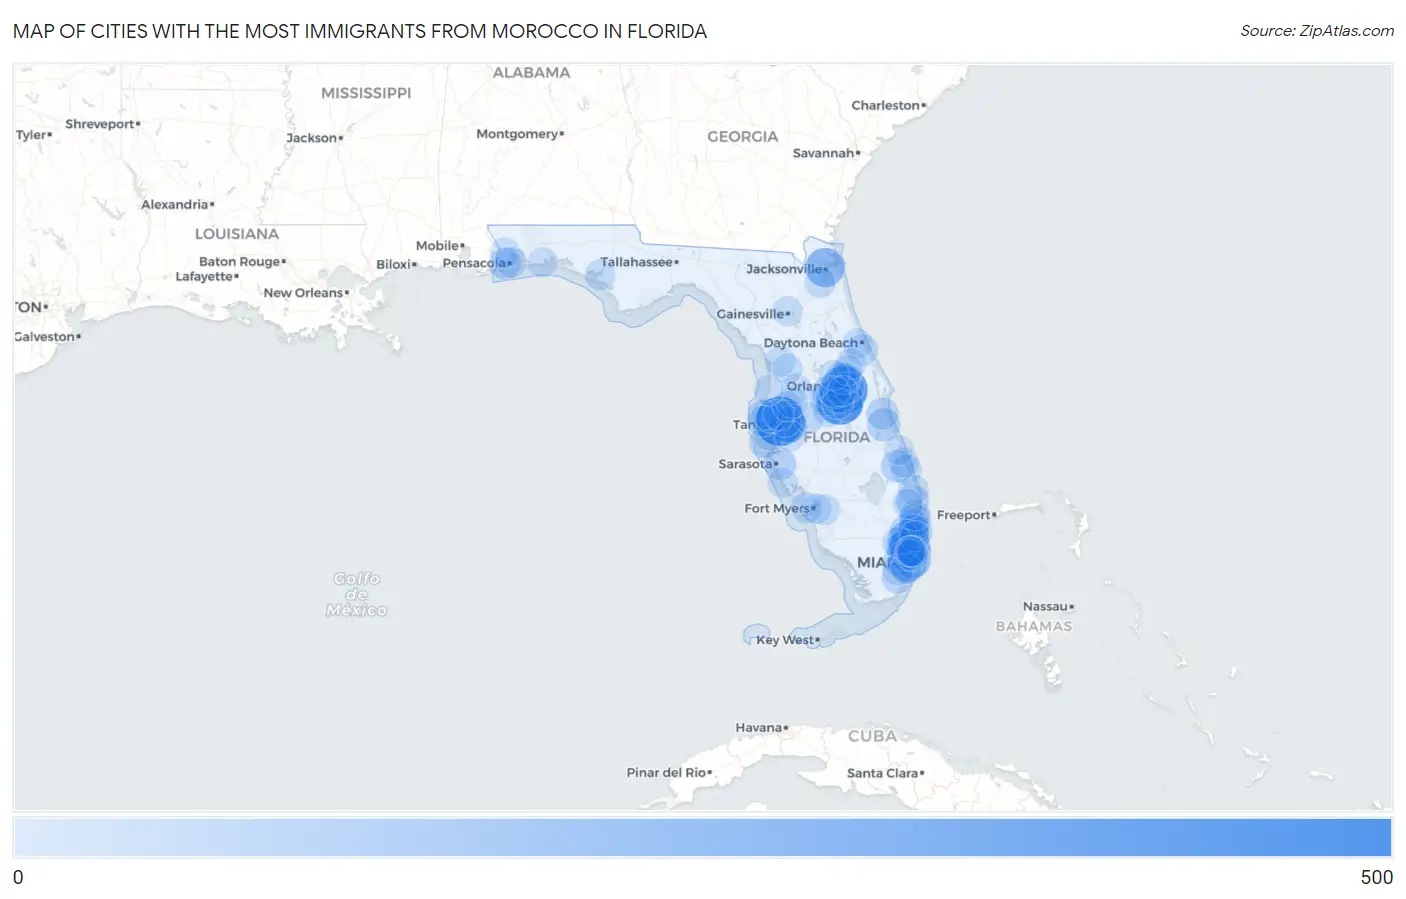
Map of Cities with the Most Immigrants from Morocco in Florida
0
500
Cities with the Most Immigrants from Morocco in Florida
| City | Morocco | vs State | vs National | |
| 1. | Tampa | 470 | 9,164(5.13%)#1 | 88,055(0.53%)#19 |
| 2. | Orlando | 424 | 9,164(4.63%)#2 | 88,055(0.48%)#25 |
| 3. | Kissimmee | 409 | 9,164(4.46%)#3 | 88,055(0.46%)#26 |
| 4. | Hollywood | 248 | 9,164(2.71%)#4 | 88,055(0.28%)#48 |
| 5. | Jacksonville | 221 | 9,164(2.41%)#5 | 88,055(0.25%)#56 |
| 6. | Miami | 207 | 9,164(2.26%)#6 | 88,055(0.24%)#59 |
| 7. | Aventura | 172 | 9,164(1.88%)#7 | 88,055(0.20%)#76 |
| 8. | Miami Gardens | 165 | 9,164(1.80%)#8 | 88,055(0.19%)#81 |
| 9. | Miami Beach | 162 | 9,164(1.77%)#9 | 88,055(0.18%)#82 |
| 10. | Temple Terrace | 154 | 9,164(1.68%)#10 | 88,055(0.17%)#87 |
| 11. | Brandon | 136 | 9,164(1.48%)#11 | 88,055(0.15%)#104 |
| 12. | Fort Lauderdale | 110 | 9,164(1.20%)#12 | 88,055(0.12%)#130 |
| 13. | Lighthouse Point | 106 | 9,164(1.16%)#13 | 88,055(0.12%)#142 |
| 14. | Williamsburg | 105 | 9,164(1.15%)#14 | 88,055(0.12%)#144 |
| 15. | Horizon West | 83 | 9,164(0.91%)#15 | 88,055(0.09%)#178 |
| 16. | Palm Bay | 82 | 9,164(0.89%)#16 | 88,055(0.09%)#181 |
| 17. | Coral Springs | 76 | 9,164(0.83%)#17 | 88,055(0.09%)#196 |
| 18. | West Palm Beach | 76 | 9,164(0.83%)#18 | 88,055(0.09%)#197 |
| 19. | Pompano Beach | 76 | 9,164(0.83%)#19 | 88,055(0.09%)#198 |
| 20. | Tamarac | 76 | 9,164(0.83%)#20 | 88,055(0.09%)#200 |
| 21. | Four Corners | 76 | 9,164(0.83%)#21 | 88,055(0.09%)#201 |
| 22. | Palm River Clair Mel | 74 | 9,164(0.81%)#22 | 88,055(0.08%)#205 |
| 23. | Southchase | 74 | 9,164(0.81%)#23 | 88,055(0.08%)#206 |
| 24. | Port St Lucie | 70 | 9,164(0.76%)#24 | 88,055(0.08%)#215 |
| 25. | Oak Ridge | 69 | 9,164(0.75%)#25 | 88,055(0.08%)#221 |
| 26. | Fruitville | 69 | 9,164(0.75%)#26 | 88,055(0.08%)#222 |
| 27. | Doral | 68 | 9,164(0.74%)#27 | 88,055(0.08%)#224 |
| 28. | Holden Lakes | 66 | 9,164(0.72%)#28 | 88,055(0.07%)#231 |
| 29. | Delray Beach | 65 | 9,164(0.71%)#29 | 88,055(0.07%)#236 |
| 30. | Melbourne | 64 | 9,164(0.70%)#30 | 88,055(0.07%)#239 |
| 31. | Sunrise | 63 | 9,164(0.69%)#31 | 88,055(0.07%)#243 |
| 32. | Myrtle Grove | 59 | 9,164(0.64%)#32 | 88,055(0.07%)#265 |
| 33. | Opa Locka | 59 | 9,164(0.64%)#33 | 88,055(0.07%)#266 |
| 34. | University Cdp Hillsborough County | 58 | 9,164(0.63%)#34 | 88,055(0.07%)#269 |
| 35. | Princeton | 58 | 9,164(0.63%)#35 | 88,055(0.07%)#270 |
| 36. | Carrollwood | 56 | 9,164(0.61%)#36 | 88,055(0.06%)#277 |
| 37. | Tierra Verde | 47 | 9,164(0.51%)#37 | 88,055(0.05%)#333 |
| 38. | Boca Raton | 44 | 9,164(0.48%)#38 | 88,055(0.05%)#356 |
| 39. | St Petersburg | 42 | 9,164(0.46%)#39 | 88,055(0.05%)#368 |
| 40. | Orlovista | 42 | 9,164(0.46%)#40 | 88,055(0.05%)#375 |
| 41. | East Lake Orient Park | 40 | 9,164(0.44%)#41 | 88,055(0.05%)#386 |
| 42. | Surfside | 39 | 9,164(0.43%)#42 | 88,055(0.04%)#395 |
| 43. | Port Orange | 37 | 9,164(0.40%)#43 | 88,055(0.04%)#405 |
| 44. | Lakeland | 36 | 9,164(0.39%)#44 | 88,055(0.04%)#409 |
| 45. | Casselberry | 36 | 9,164(0.39%)#45 | 88,055(0.04%)#417 |
| 46. | Davenport | 36 | 9,164(0.39%)#46 | 88,055(0.04%)#423 |
| 47. | East Lake | 34 | 9,164(0.37%)#47 | 88,055(0.04%)#439 |
| 48. | Jensen Beach | 34 | 9,164(0.37%)#48 | 88,055(0.04%)#442 |
| 49. | Pembroke Pines | 33 | 9,164(0.36%)#49 | 88,055(0.04%)#445 |
| 50. | Pensacola | 32 | 9,164(0.35%)#50 | 88,055(0.04%)#460 |
| 51. | Altamonte Springs | 32 | 9,164(0.35%)#51 | 88,055(0.04%)#461 |
| 52. | Cooper City | 32 | 9,164(0.35%)#52 | 88,055(0.04%)#463 |
| 53. | Hunters Creek | 31 | 9,164(0.34%)#53 | 88,055(0.04%)#470 |
| 54. | Cape Coral | 29 | 9,164(0.32%)#54 | 88,055(0.03%)#491 |
| 55. | Lakeside | 29 | 9,164(0.32%)#55 | 88,055(0.03%)#500 |
| 56. | Lynn Haven | 29 | 9,164(0.32%)#56 | 88,055(0.03%)#505 |
| 57. | Beverly Hills | 28 | 9,164(0.31%)#57 | 88,055(0.03%)#519 |
| 58. | Deerfield Beach | 26 | 9,164(0.28%)#58 | 88,055(0.03%)#541 |
| 59. | Golden Beach | 26 | 9,164(0.28%)#59 | 88,055(0.03%)#551 |
| 60. | Palm Harbor | 25 | 9,164(0.27%)#60 | 88,055(0.03%)#562 |
| 61. | Boynton Beach | 24 | 9,164(0.26%)#61 | 88,055(0.03%)#576 |
| 62. | St Cloud | 24 | 9,164(0.26%)#62 | 88,055(0.03%)#579 |
| 63. | Lehigh Acres | 23 | 9,164(0.25%)#63 | 88,055(0.03%)#595 |
| 64. | Clearwater | 23 | 9,164(0.25%)#64 | 88,055(0.03%)#596 |
| 65. | Fort Myers | 23 | 9,164(0.25%)#65 | 88,055(0.03%)#598 |
| 66. | Daytona Beach | 23 | 9,164(0.25%)#66 | 88,055(0.03%)#600 |
| 67. | The Crossings | 23 | 9,164(0.25%)#67 | 88,055(0.03%)#604 |
| 68. | Fern Park | 23 | 9,164(0.25%)#68 | 88,055(0.03%)#610 |
| 69. | Rio Pinar | 23 | 9,164(0.25%)#69 | 88,055(0.03%)#611 |
| 70. | Bal Harbour | 23 | 9,164(0.25%)#70 | 88,055(0.03%)#612 |
| 71. | Bay Hill | 22 | 9,164(0.24%)#71 | 88,055(0.02%)#630 |
| 72. | Weston | 21 | 9,164(0.23%)#72 | 88,055(0.02%)#641 |
| 73. | Westchase | 21 | 9,164(0.23%)#73 | 88,055(0.02%)#647 |
| 74. | Doctor Phillips | 21 | 9,164(0.23%)#74 | 88,055(0.02%)#649 |
| 75. | Deltona | 20 | 9,164(0.22%)#75 | 88,055(0.02%)#655 |
| 76. | Jupiter | 20 | 9,164(0.22%)#76 | 88,055(0.02%)#657 |
| 77. | Coral Gables | 20 | 9,164(0.22%)#77 | 88,055(0.02%)#659 |
| 78. | Pasadena Hills | 20 | 9,164(0.22%)#78 | 88,055(0.02%)#671 |
| 79. | Ridge Manor | 20 | 9,164(0.22%)#79 | 88,055(0.02%)#674 |
| 80. | Campbell | 20 | 9,164(0.22%)#80 | 88,055(0.02%)#677 |
| 81. | Inverness Highlands South | 18 | 9,164(0.20%)#81 | 88,055(0.02%)#717 |
| 82. | Balm | 18 | 9,164(0.20%)#82 | 88,055(0.02%)#719 |
| 83. | Gainesville | 17 | 9,164(0.19%)#83 | 88,055(0.02%)#724 |
| 84. | Sanford | 16 | 9,164(0.17%)#84 | 88,055(0.02%)#750 |
| 85. | Indian River Estates | 16 | 9,164(0.17%)#85 | 88,055(0.02%)#764 |
| 86. | North Miami | 15 | 9,164(0.16%)#86 | 88,055(0.02%)#773 |
| 87. | Lake Magdalene | 15 | 9,164(0.16%)#87 | 88,055(0.02%)#778 |
| 88. | Lauderdale By The Sea | 15 | 9,164(0.16%)#88 | 88,055(0.02%)#792 |
| 89. | Wesley Chapel | 14 | 9,164(0.15%)#89 | 88,055(0.02%)#801 |
| 90. | Ives Estates | 14 | 9,164(0.15%)#90 | 88,055(0.02%)#809 |
| 91. | Apopka | 13 | 9,164(0.14%)#91 | 88,055(0.01%)#822 |
| 92. | Royal Palm Beach | 13 | 9,164(0.14%)#92 | 88,055(0.01%)#826 |
| 93. | Sunny Isles Beach | 13 | 9,164(0.14%)#93 | 88,055(0.01%)#829 |
| 94. | Fort Walton Beach | 13 | 9,164(0.14%)#94 | 88,055(0.01%)#830 |
| 95. | South Venice | 13 | 9,164(0.14%)#95 | 88,055(0.01%)#835 |
| 96. | Pine Castle | 13 | 9,164(0.14%)#96 | 88,055(0.01%)#840 |
| 97. | Hernando Beach | 13 | 9,164(0.14%)#97 | 88,055(0.01%)#844 |
| 98. | Gonzalez | 12 | 9,164(0.13%)#98 | 88,055(0.01%)#868 |
| 99. | Ojus | 11 | 9,164(0.12%)#99 | 88,055(0.01%)#895 |
| 100. | Lakewood Park | 11 | 9,164(0.12%)#100 | 88,055(0.01%)#896 |
Common Questions
What are the Top 10 Cities with the Most Immigrants from Morocco in Florida?
Top 10 Cities with the Most Immigrants from Morocco in Florida are:
#1
470
#2
424
#3
409
#4
248
#5
221
#6
207
#7
172
#8
165
#9
162
#10
154
What city has the Most Immigrants from Morocco in Florida?
Tampa has the Most Immigrants from Morocco in Florida with 470.
What is the Total Immigrants from Morocco in the State of Florida?
Total Immigrants from Morocco in Florida is 9,164.
What is the Total Immigrants from Morocco in the United States?
Total Immigrants from Morocco in the United States is 88,055.