Cities with the Most Immigrants from Ireland in New York
RELATED REPORTS & OPTIONS
Ireland
New York
Compare Cities
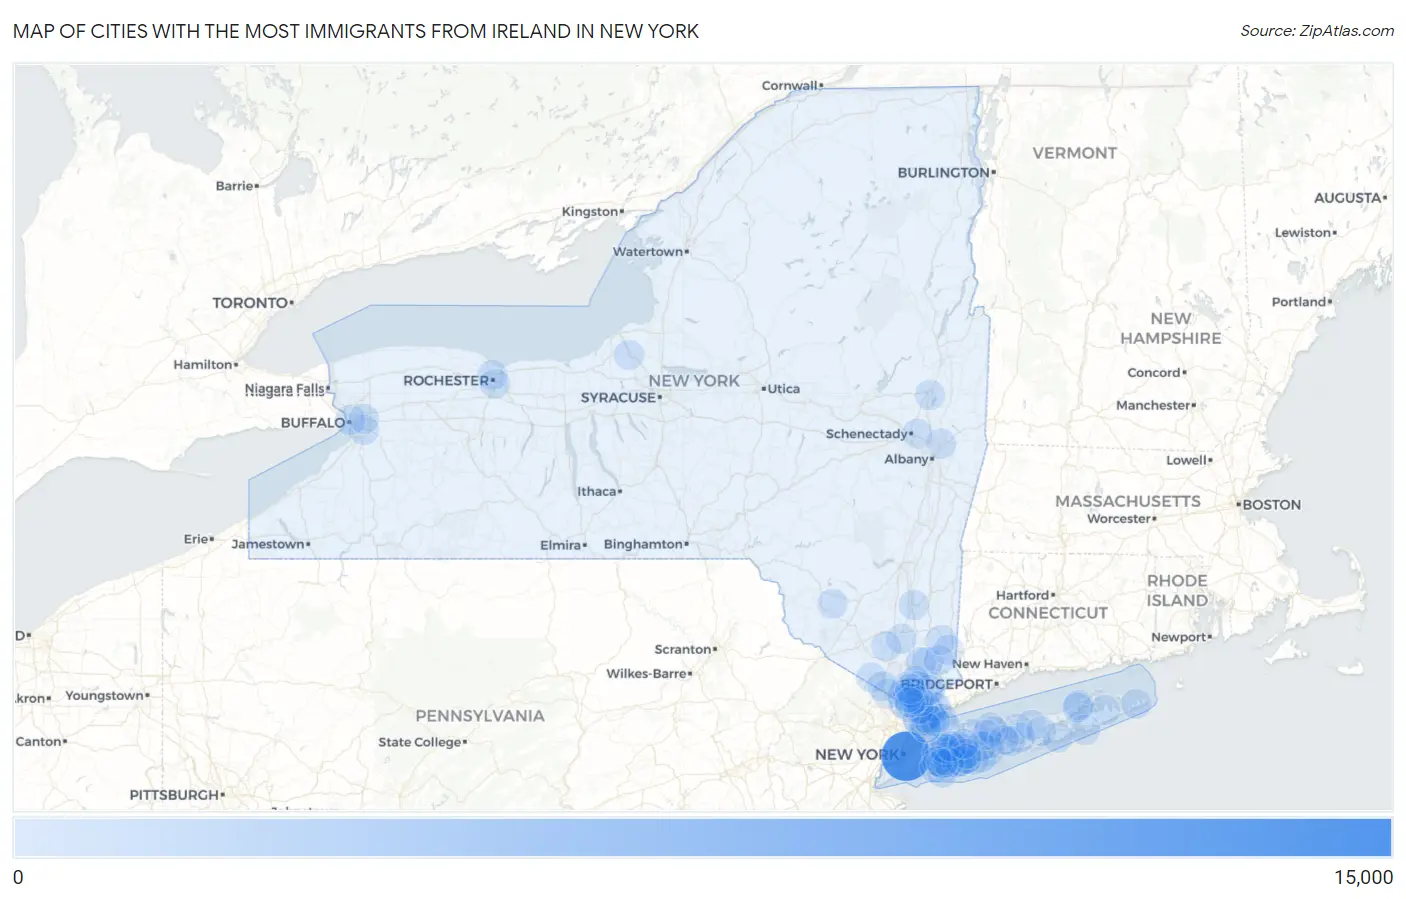
Map of Cities with the Most Immigrants from Ireland in New York
0
15,000
Cities with the Most Immigrants from Ireland in New York
| City | Ireland | vs State | vs National | |
| 1. | New York | 11,954 | 26,772(44.65%)#1 | 119,836(9.98%)#1 |
| 2. | Yonkers | 2,532 | 26,772(9.46%)#2 | 119,836(2.11%)#4 |
| 3. | Pearl River | 607 | 26,772(2.27%)#3 | 119,836(0.51%)#8 |
| 4. | Scarsdale | 280 | 26,772(1.05%)#4 | 119,836(0.23%)#26 |
| 5. | Floral Park | 275 | 26,772(1.03%)#5 | 119,836(0.23%)#29 |
| 6. | Bay Shore | 269 | 26,772(1.00%)#6 | 119,836(0.22%)#30 |
| 7. | Oceanside | 238 | 26,772(0.89%)#7 | 119,836(0.20%)#38 |
| 8. | Cedarhurst | 200 | 26,772(0.75%)#8 | 119,836(0.17%)#49 |
| 9. | New City | 197 | 26,772(0.74%)#9 | 119,836(0.16%)#51 |
| 10. | East Meadow | 166 | 26,772(0.62%)#10 | 119,836(0.14%)#69 |
| 11. | Nanuet | 158 | 26,772(0.59%)#11 | 119,836(0.13%)#74 |
| 12. | Southampton | 141 | 26,772(0.53%)#12 | 119,836(0.12%)#86 |
| 13. | Long Beach | 139 | 26,772(0.52%)#13 | 119,836(0.12%)#90 |
| 14. | White Plains | 128 | 26,772(0.48%)#14 | 119,836(0.11%)#104 |
| 15. | Wantagh | 126 | 26,772(0.47%)#15 | 119,836(0.11%)#107 |
| 16. | Carmel | 126 | 26,772(0.47%)#16 | 119,836(0.11%)#108 |
| 17. | Jefferson Valley Yorktown | 119 | 26,772(0.44%)#17 | 119,836(0.10%)#120 |
| 18. | Mount Vernon | 112 | 26,772(0.42%)#18 | 119,836(0.09%)#128 |
| 19. | New Rochelle | 109 | 26,772(0.41%)#19 | 119,836(0.09%)#139 |
| 20. | Lynbrook | 105 | 26,772(0.39%)#20 | 119,836(0.09%)#146 |
| 21. | Lake Mohegan | 103 | 26,772(0.38%)#21 | 119,836(0.09%)#155 |
| 22. | Tuxedo | 101 | 26,772(0.38%)#22 | 119,836(0.08%)#158 |
| 23. | Greenwood Lake | 96 | 26,772(0.36%)#23 | 119,836(0.08%)#170 |
| 24. | Chappaqua | 90 | 26,772(0.34%)#24 | 119,836(0.08%)#192 |
| 25. | Rochester | 86 | 26,772(0.32%)#25 | 119,836(0.07%)#200 |
| 26. | North New Hyde Park | 86 | 26,772(0.32%)#26 | 119,836(0.07%)#202 |
| 27. | Coram | 84 | 26,772(0.31%)#27 | 119,836(0.07%)#209 |
| 28. | Brewster | 83 | 26,772(0.31%)#28 | 119,836(0.07%)#214 |
| 29. | Ardsley | 80 | 26,772(0.30%)#29 | 119,836(0.07%)#225 |
| 30. | Harrison | 78 | 26,772(0.29%)#30 | 119,836(0.07%)#230 |
| 31. | Eastchester | 78 | 26,772(0.29%)#31 | 119,836(0.07%)#231 |
| 32. | Hicksville | 77 | 26,772(0.29%)#32 | 119,836(0.06%)#236 |
| 33. | Troy | 76 | 26,772(0.28%)#33 | 119,836(0.06%)#238 |
| 34. | Brighton | 75 | 26,772(0.28%)#34 | 119,836(0.06%)#247 |
| 35. | Fulton | 74 | 26,772(0.28%)#35 | 119,836(0.06%)#254 |
| 36. | Levittown | 68 | 26,772(0.25%)#36 | 119,836(0.06%)#266 |
| 37. | Kings Park | 68 | 26,772(0.25%)#37 | 119,836(0.06%)#267 |
| 38. | Rockville Centre | 67 | 26,772(0.25%)#38 | 119,836(0.06%)#269 |
| 39. | Rye | 67 | 26,772(0.25%)#39 | 119,836(0.06%)#271 |
| 40. | Babylon | 67 | 26,772(0.25%)#40 | 119,836(0.06%)#272 |
| 41. | Niskayuna | 66 | 26,772(0.25%)#41 | 119,836(0.06%)#277 |
| 42. | Latham | 66 | 26,772(0.25%)#42 | 119,836(0.06%)#278 |
| 43. | Medford | 65 | 26,772(0.24%)#43 | 119,836(0.05%)#283 |
| 44. | Ossining | 63 | 26,772(0.24%)#44 | 119,836(0.05%)#294 |
| 45. | Garden City | 62 | 26,772(0.23%)#45 | 119,836(0.05%)#298 |
| 46. | Tappan | 61 | 26,772(0.23%)#46 | 119,836(0.05%)#304 |
| 47. | West Seneca | 59 | 26,772(0.22%)#47 | 119,836(0.05%)#315 |
| 48. | Dobbs Ferry | 59 | 26,772(0.22%)#48 | 119,836(0.05%)#317 |
| 49. | East Massapequa | 57 | 26,772(0.21%)#49 | 119,836(0.05%)#334 |
| 50. | Glen Cove | 54 | 26,772(0.20%)#50 | 119,836(0.05%)#353 |
| 51. | Pleasantville | 54 | 26,772(0.20%)#51 | 119,836(0.05%)#355 |
| 52. | Westhampton | 54 | 26,772(0.20%)#52 | 119,836(0.05%)#356 |
| 53. | Mamaroneck | 50 | 26,772(0.19%)#53 | 119,836(0.04%)#380 |
| 54. | Salisbury | 50 | 26,772(0.19%)#54 | 119,836(0.04%)#382 |
| 55. | Williston Park | 49 | 26,772(0.18%)#55 | 119,836(0.04%)#392 |
| 56. | Poughkeepsie | 48 | 26,772(0.18%)#56 | 119,836(0.04%)#400 |
| 57. | Brentwood | 47 | 26,772(0.18%)#57 | 119,836(0.04%)#408 |
| 58. | Bethpage | 47 | 26,772(0.18%)#58 | 119,836(0.04%)#413 |
| 59. | Wingdale | 47 | 26,772(0.18%)#59 | 119,836(0.04%)#418 |
| 60. | Huntington Station | 46 | 26,772(0.17%)#60 | 119,836(0.04%)#423 |
| 61. | Deer Park | 46 | 26,772(0.17%)#61 | 119,836(0.04%)#425 |
| 62. | New Windsor | 45 | 26,772(0.17%)#62 | 119,836(0.04%)#434 |
| 63. | Smithtown | 44 | 26,772(0.16%)#63 | 119,836(0.04%)#440 |
| 64. | Suffern | 44 | 26,772(0.16%)#64 | 119,836(0.04%)#444 |
| 65. | Copiague | 43 | 26,772(0.16%)#65 | 119,836(0.04%)#455 |
| 66. | Mineola | 43 | 26,772(0.16%)#66 | 119,836(0.04%)#457 |
| 67. | Bellmore | 43 | 26,772(0.16%)#67 | 119,836(0.04%)#459 |
| 68. | Valley Cottage | 43 | 26,772(0.16%)#68 | 119,836(0.04%)#460 |
| 69. | Seaford | 42 | 26,772(0.16%)#69 | 119,836(0.04%)#473 |
| 70. | Croton On Hudson | 42 | 26,772(0.16%)#70 | 119,836(0.04%)#475 |
| 71. | Pelham Manor | 41 | 26,772(0.15%)#71 | 119,836(0.03%)#485 |
| 72. | Commack | 40 | 26,772(0.15%)#72 | 119,836(0.03%)#490 |
| 73. | Massapequa Park | 40 | 26,772(0.15%)#73 | 119,836(0.03%)#495 |
| 74. | South Farmingdale | 40 | 26,772(0.15%)#74 | 119,836(0.03%)#496 |
| 75. | Valley Stream | 39 | 26,772(0.15%)#75 | 119,836(0.03%)#513 |
| 76. | Baldwin | 39 | 26,772(0.15%)#76 | 119,836(0.03%)#514 |
| 77. | Saratoga Springs | 39 | 26,772(0.15%)#77 | 119,836(0.03%)#516 |
| 78. | Westbury | 39 | 26,772(0.15%)#78 | 119,836(0.03%)#518 |
| 79. | Heritage Hills | 39 | 26,772(0.15%)#79 | 119,836(0.03%)#522 |
| 80. | Buffalo | 38 | 26,772(0.14%)#80 | 119,836(0.03%)#526 |
| 81. | Tarrytown | 38 | 26,772(0.14%)#81 | 119,836(0.03%)#534 |
| 82. | Montauk | 38 | 26,772(0.14%)#82 | 119,836(0.03%)#538 |
| 83. | South Nyack | 38 | 26,772(0.14%)#83 | 119,836(0.03%)#540 |
| 84. | Cheektowaga | 37 | 26,772(0.14%)#84 | 119,836(0.03%)#546 |
| 85. | Holbrook | 37 | 26,772(0.14%)#85 | 119,836(0.03%)#551 |
| 86. | Lake Carmel | 37 | 26,772(0.14%)#86 | 119,836(0.03%)#556 |
| 87. | Washingtonville | 37 | 26,772(0.14%)#87 | 119,836(0.03%)#558 |
| 88. | Peconic | 37 | 26,772(0.14%)#88 | 119,836(0.03%)#561 |
| 89. | South Fallsburg | 36 | 26,772(0.13%)#89 | 119,836(0.03%)#571 |
| 90. | Ridge | 35 | 26,772(0.13%)#90 | 119,836(0.03%)#587 |
| 91. | Sloatsburg | 35 | 26,772(0.13%)#91 | 119,836(0.03%)#589 |
| 92. | Cutchogue | 35 | 26,772(0.13%)#92 | 119,836(0.03%)#590 |
| 93. | Northwest Harbor | 34 | 26,772(0.13%)#93 | 119,836(0.03%)#608 |
| 94. | West Nyack | 34 | 26,772(0.13%)#94 | 119,836(0.03%)#609 |
| 95. | Congers | 33 | 26,772(0.12%)#95 | 119,836(0.03%)#623 |
| 96. | East Rockaway | 32 | 26,772(0.12%)#96 | 119,836(0.03%)#646 |
| 97. | Orangeburg | 32 | 26,772(0.12%)#97 | 119,836(0.03%)#652 |
| 98. | Plainview | 31 | 26,772(0.12%)#98 | 119,836(0.03%)#666 |
| 99. | Manorville | 31 | 26,772(0.12%)#99 | 119,836(0.03%)#672 |
| 100. | Ronkonkoma | 30 | 26,772(0.11%)#100 | 119,836(0.03%)#683 |
Common Questions
What are the Top 10 Cities with the Most Immigrants from Ireland in New York?
Top 10 Cities with the Most Immigrants from Ireland in New York are:
#1
11,954
#2
2,532
#3
607
#4
280
#5
275
#6
269
#7
238
#8
200
#9
197
#10
166
What city has the Most Immigrants from Ireland in New York?
New York has the Most Immigrants from Ireland in New York with 11,954.
What is the Total Immigrants from Ireland in the State of New York?
Total Immigrants from Ireland in New York is 26,772.
What is the Total Immigrants from Ireland in the United States?
Total Immigrants from Ireland in the United States is 119,836.