Cities with the Highest Percentage of Immigrants from Jamaica in Connecticut
RELATED REPORTS & OPTIONS
Jamaica
Connecticut
Compare Cities
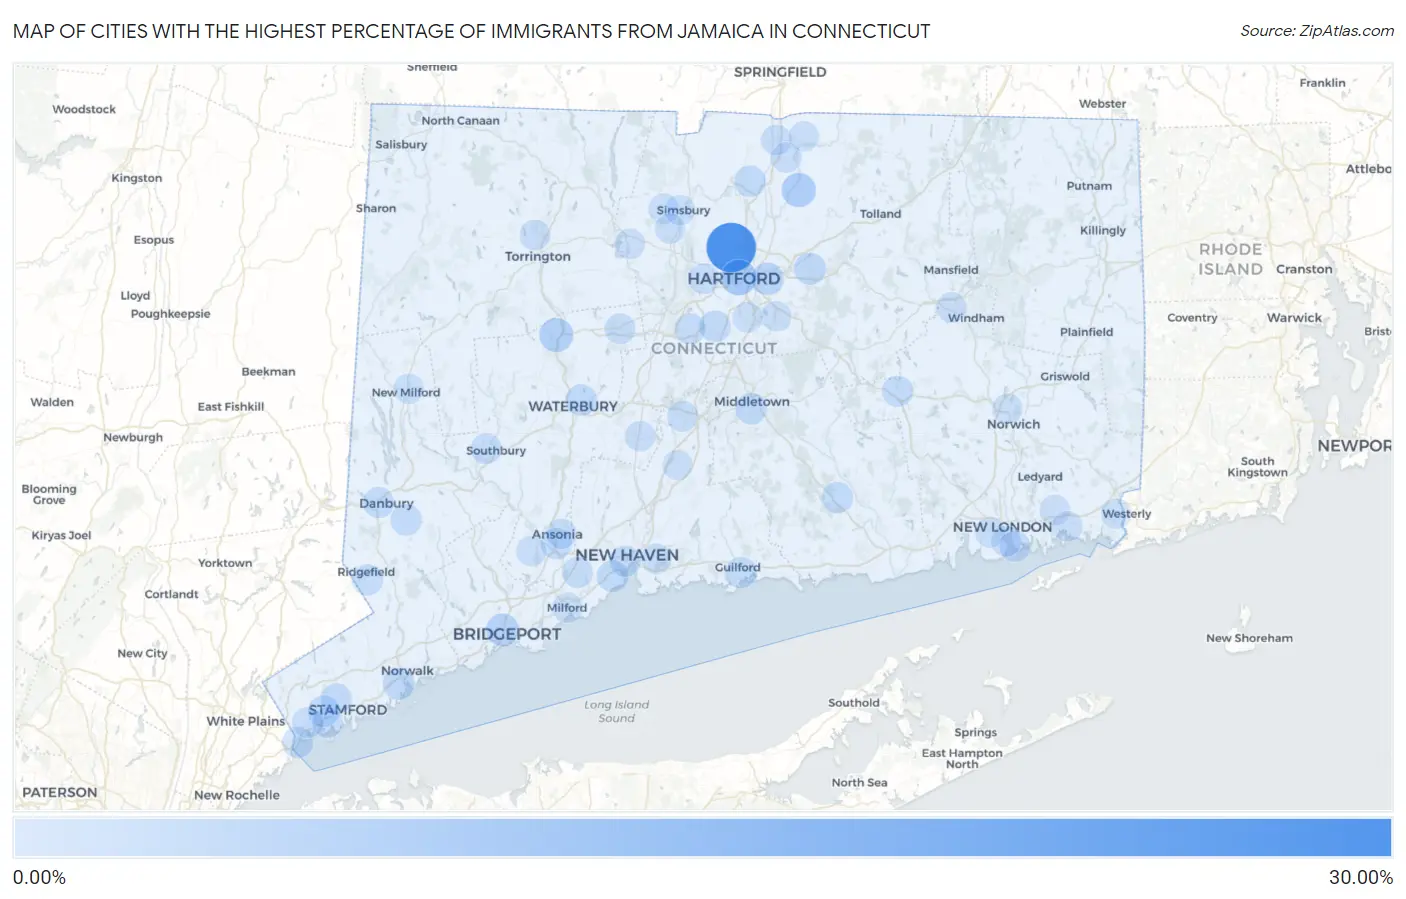
Map of Cities with the Highest Percentage of Immigrants from Jamaica in Connecticut
0.00%
30.00%
Cities with the Highest Percentage of Immigrants from Jamaica in Connecticut
| City | Jamaica | vs State | vs National | |
| 1. | Blue Hills | 27.29% | 1.12%(+26.2)#1 | 0.24%(+27.1)#476 |
| 2. | South Wilton | 8.40% | 1.12%(+7.28)#21 | 0.24%(+8.17)#2,420 |
| 3. | Hartford | 7.33% | 1.12%(+6.21)#22 | 0.24%(+7.09)#2,421 |
| 4. | Broad Brook | 5.39% | 1.12%(+4.27)#23 | 0.24%(+5.15)#2,422 |
| 5. | Thomaston | 5.13% | 1.12%(+4.00)#48 | 0.24%(+4.89)#4,664 |
| 6. | Bridgeport | 3.74% | 1.12%(+2.62)#49 | 0.24%(+3.50)#4,665 |
| 7. | East Hartford | 3.32% | 1.12%(+2.20)#50 | 0.24%(+3.08)#4,666 |
| 8. | Old Hill | 2.42% | 1.12%(+1.29)#51 | 0.24%(+2.18)#4,876 |
| 9. | Norwalk | 2.35% | 1.12%(+1.22)#52 | 0.24%(+2.11)#4,877 |
| 10. | Manchester | 2.21% | 1.12%(+1.09)#53 | 0.24%(+1.97)#4,878 |
| 11. | West Haven | 1.75% | 1.12%(+0.624)#54 | 0.24%(+1.51)#4,879 |
| 12. | Waterbury | 1.73% | 1.12%(+0.606)#55 | 0.24%(+1.49)#4,880 |
| 13. | Windsor Locks | 1.73% | 1.12%(+0.604)#73 | 0.24%(+1.49)#6,770 |
| 14. | Cos Cob | 1.73% | 1.12%(+0.602)#74 | 0.24%(+1.49)#6,771 |
| 15. | Middletown | 1.72% | 1.12%(+0.600)#75 | 0.24%(+1.49)#6,772 |
| 16. | Newington | 1.66% | 1.12%(+0.535)#76 | 0.24%(+1.42)#6,773 |
| 17. | Naugatuck Borough | 1.54% | 1.12%(+0.422)#77 | 0.24%(+1.31)#6,774 |
| 18. | Chester Center | 1.50% | 1.12%(+0.380)#78 | 0.24%(+1.27)#6,775 |
| 19. | Bethel | 1.50% | 1.12%(+0.374)#79 | 0.24%(+1.26)#6,776 |
| 20. | Derby | 1.43% | 1.12%(+0.307)#80 | 0.24%(+1.19)#6,777 |
| 21. | Byram | 1.38% | 1.12%(+0.258)#81 | 0.24%(+1.14)#6,778 |
| 22. | Guilford Center | 1.38% | 1.12%(+0.254)#82 | 0.24%(+1.14)#6,779 |
| 23. | Colchester | 1.38% | 1.12%(+0.253)#83 | 0.24%(+1.14)#6,780 |
| 24. | Stamford | 1.20% | 1.12%(+0.076)#84 | 0.24%(+0.962)#6,781 |
| 25. | New Haven | 1.20% | 1.12%(+0.074)#85 | 0.24%(+0.960)#6,782 |
| 26. | Danbury | 1.14% | 1.12%(+0.018)#86 | 0.24%(+0.904)#6,783 |
| 27. | Ridgefield | 1.11% | 1.12%(-0.013)#107 | 0.24%(+0.873)#9,809 |
| 28. | New Britain | 1.02% | 1.12%(-0.103)#108 | 0.24%(+0.783)#9,810 |
| 29. | Orange | 0.93% | 1.12%(-0.189)#109 | 0.24%(+0.697)#9,811 |
| 30. | Groton | 0.83% | 1.12%(-0.290)#110 | 0.24%(+0.596)#9,812 |
| 31. | Heritage Village | 0.82% | 1.12%(-0.307)#113 | 0.24%(+0.579)#10,231 |
| 32. | Bristol | 0.77% | 1.12%(-0.349)#114 | 0.24%(+0.537)#10,232 |
| 33. | Meriden | 0.69% | 1.12%(-0.438)#115 | 0.24%(+0.448)#10,233 |
| 34. | West Hartford | 0.68% | 1.12%(-0.445)#116 | 0.24%(+0.441)#10,234 |
| 35. | Torrington | 0.66% | 1.12%(-0.467)#117 | 0.24%(+0.419)#10,235 |
| 36. | Greenwich | 0.60% | 1.12%(-0.526)#118 | 0.24%(+0.360)#10,236 |
| 37. | Trumbull Center | 0.59% | 1.12%(-0.533)#119 | 0.24%(+0.353)#10,237 |
| 38. | Thompsonville | 0.57% | 1.12%(-0.555)#120 | 0.24%(+0.331)#10,238 |
| 39. | Southwood Acres | 0.53% | 1.12%(-0.594)#121 | 0.24%(+0.292)#10,239 |
| 40. | New London | 0.49% | 1.12%(-0.631)#122 | 0.24%(+0.255)#10,240 |
| 41. | Stonington Borough | 0.42% | 1.12%(-0.699)#144 | 0.24%(+0.187)#13,479 |
| 42. | Fairfield University | 0.41% | 1.12%(-0.713)#145 | 0.24%(+0.173)#13,480 |
| 43. | Quinnipiac University | 0.39% | 1.12%(-0.738)#146 | 0.24%(+0.148)#13,481 |
| 44. | Stratford Downtown | 0.36% | 1.12%(-0.764)#147 | 0.24%(+0.122)#13,482 |
| 45. | Cheshire Village | 0.32% | 1.12%(-0.800)#148 | 0.24%(+0.086)#13,483 |
| 46. | Northford | 0.32% | 1.12%(-0.800)#149 | 0.24%(+0.086)#14,019 |
| 47. | Riverside | 0.25% | 1.12%(-0.870)#150 | 0.24%(+0.016)#14,020 |
| 48. | Ansonia | 0.24% | 1.12%(-0.881)#151 | 0.24%(+0.005)#14,021 |
| 49. | Glastonbury Center | 0.23% | 1.12%(-0.897)#152 | 0.24%(-0.011)#14,022 |
| 50. | Old Mystic | 0.21% | 1.12%(-0.917)#153 | 0.24%(-0.031)#14,023 |
| 51. | Waterford | 0.18% | 1.12%(-0.940)#154 | 0.24%(-0.054)#14,024 |
| 52. | Pawcatuck | 0.18% | 1.12%(-0.944)#155 | 0.24%(-0.058)#14,025 |
| 53. | West Simsbury | 0.18% | 1.12%(-0.945)#156 | 0.24%(-0.059)#14,026 |
| 54. | Collinsville | 0.16% | 1.12%(-0.963)#157 | 0.24%(-0.077)#14,027 |
| 55. | Shelton | 0.15% | 1.12%(-0.975)#158 | 0.24%(-0.089)#14,028 |
| 56. | Hazardville | 0.15% | 1.12%(-0.976)#159 | 0.24%(-0.090)#14,029 |
| 57. | Simsbury Center | 0.13% | 1.12%(-0.992)#160 | 0.24%(-0.106)#14,030 |
| 58. | Wethersfield | 0.13% | 1.12%(-0.995)#161 | 0.24%(-0.109)#14,031 |
| 59. | Weatogue | 0.075% | 1.12%(-1.05)#162 | 0.24%(-0.163)#14,032 |
| 60. | New Milford | 0.056% | 1.12%(-1.07)#163 | 0.24%(-0.181)#14,033 |
| 61. | East Haven | 0.054% | 1.12%(-1.07)#164 | 0.24%(-0.184)#14,034 |
| 62. | Daniels Farm | 0.049% | 1.12%(-1.07)#165 | 0.24%(-0.188)#14,035 |
| 63. | Wallingford Center | 0.048% | 1.12%(-1.08)#166 | 0.24%(-0.189)#14,036 |
| 64. | Mystic | 0.045% | 1.12%(-1.08)#167 | 0.24%(-0.192)#14,197 |
| 65. | Norwich | 0.042% | 1.12%(-1.08)#168 | 0.24%(-0.195)#14,198 |
| 66. | Willimantic | 0.039% | 1.12%(-1.08)#169 | 0.24%(-0.198)#14,199 |
| 67. | Milford City Balance | 0.024% | 1.12%(-1.10)#170 | 0.24%(-0.214)#14,200 |
1
2Common Questions
What are the Top 10 Cities with the Highest Percentage of Immigrants from Jamaica in Connecticut?
Top 10 Cities with the Highest Percentage of Immigrants from Jamaica in Connecticut are:
#1
27.29%
#2
7.33%
#3
5.39%
#4
5.13%
#5
3.74%
#6
3.32%
#7
2.35%
#8
2.21%
#9
1.75%
#10
1.73%
What city has the Highest Percentage of Immigrants from Jamaica in Connecticut?
Blue Hills has the Highest Percentage of Immigrants from Jamaica in Connecticut with 27.29%.
What is the Percentage of Immigrants from Jamaica in the State of Connecticut?
Percentage of Immigrants from Jamaica in Connecticut is 1.12%.
What is the Percentage of Immigrants from Jamaica in the United States?
Percentage of Immigrants from Jamaica in the United States is 0.24%.