Cities with the Highest Percentage of Population Employed in Management in Kentucky
RELATED REPORTS & OPTIONS
Management
Kentucky
Compare Cities
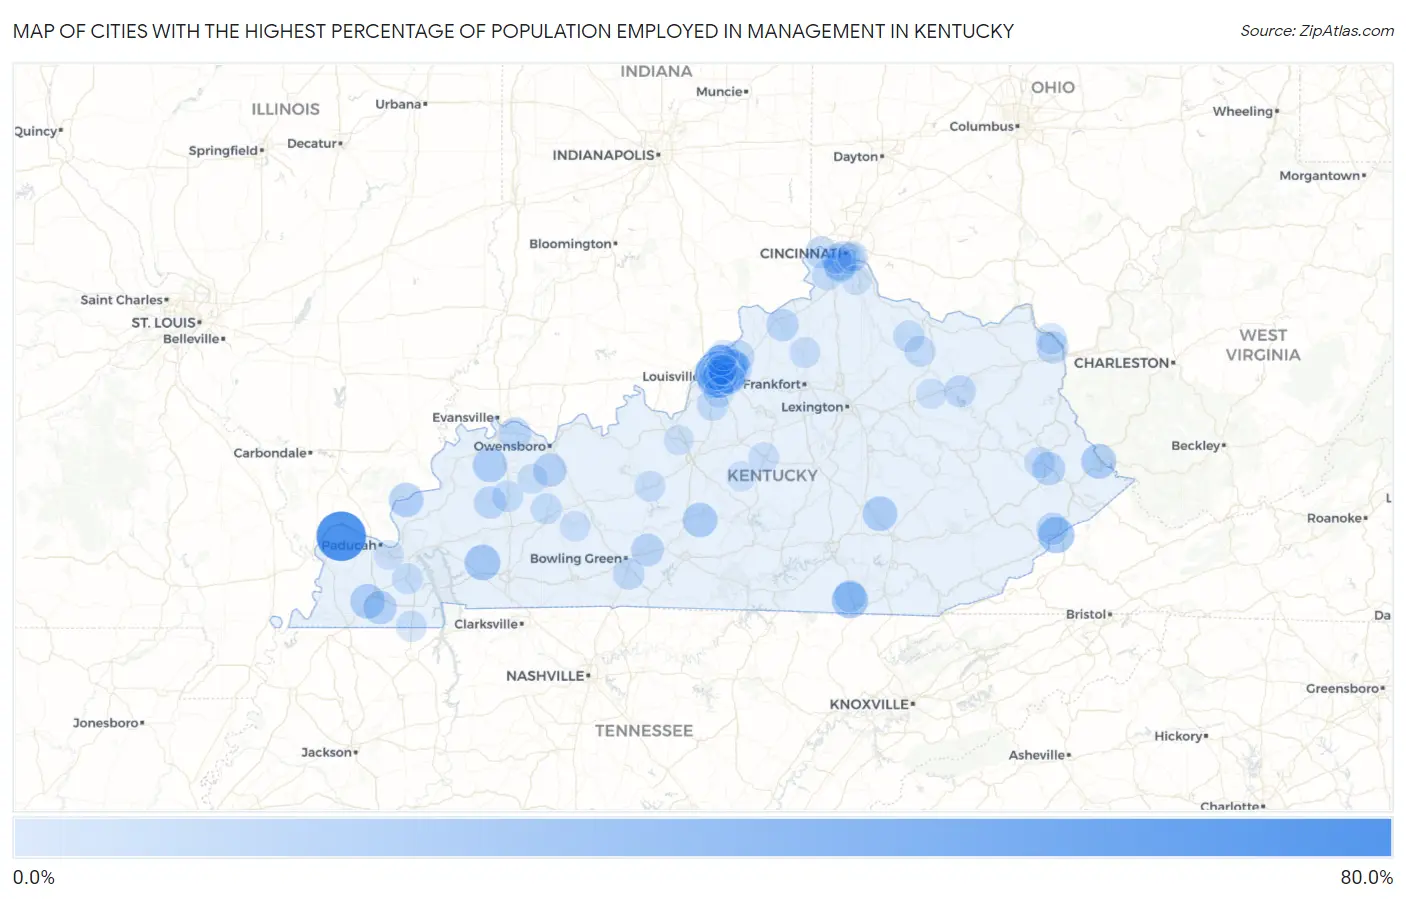
Map of Cities with the Highest Percentage of Population Employed in Management in Kentucky
0.0%
80.0%
Cities with the Highest Percentage of Population Employed in Management in Kentucky
| City | % Employed | vs State | vs National | |
| 1. | Bandana | 65.9% | 9.6%(+56.3)#1 | 11.0%(+54.9)#120 |
| 2. | Indian Hills | 39.9% | 9.6%(+30.2)#2 | 11.0%(+28.8)#445 |
| 3. | Prospect | 34.2% | 9.6%(+24.6)#3 | 11.0%(+23.2)#645 |
| 4. | Curdsville | 31.0% | 9.6%(+21.3)#4 | 11.0%(+19.9)#832 |
| 5. | Stearns | 30.4% | 9.6%(+20.7)#5 | 11.0%(+19.3)#876 |
| 6. | Payne Gap | 30.3% | 9.6%(+20.7)#6 | 11.0%(+19.3)#878 |
| 7. | Anchorage | 29.4% | 9.6%(+19.8)#7 | 11.0%(+18.4)#943 |
| 8. | Ten Broeck | 29.0% | 9.6%(+19.4)#8 | 11.0%(+18.0)#982 |
| 9. | Cerulean | 28.6% | 9.6%(+19.0)#9 | 11.0%(+17.6)#1,007 |
| 10. | Glenview | 28.2% | 9.6%(+18.6)#10 | 11.0%(+17.2)#1,064 |
| 11. | Manor Creek | 28.0% | 9.6%(+18.4)#11 | 11.0%(+17.0)#1,085 |
| 12. | South Williamson | 26.4% | 9.6%(+16.8)#12 | 11.0%(+15.3)#1,292 |
| 13. | Rolling Fields | 26.1% | 9.6%(+16.5)#13 | 11.0%(+15.0)#1,339 |
| 14. | Livingston | 26.0% | 9.6%(+16.4)#14 | 11.0%(+15.0)#1,346 |
| 15. | Mockingbird Valley | 25.9% | 9.6%(+16.2)#15 | 11.0%(+14.8)#1,369 |
| 16. | Hardyville | 25.7% | 9.6%(+16.1)#16 | 11.0%(+14.7)#1,396 |
| 17. | Pryorsburg | 25.6% | 9.6%(+16.0)#17 | 11.0%(+14.6)#1,413 |
| 18. | Orchard Grass Hills | 25.4% | 9.6%(+15.8)#18 | 11.0%(+14.4)#1,441 |
| 19. | Poole | 25.3% | 9.6%(+15.6)#19 | 11.0%(+14.2)#1,462 |
| 20. | Brownsboro Village | 25.0% | 9.6%(+15.4)#20 | 11.0%(+14.0)#1,492 |
| 21. | Carrsville | 25.0% | 9.6%(+15.4)#21 | 11.0%(+14.0)#1,517 |
| 22. | Creekside | 23.0% | 9.6%(+13.4)#22 | 11.0%(+12.0)#1,918 |
| 23. | Pewee Valley | 22.9% | 9.6%(+13.3)#23 | 11.0%(+11.9)#1,929 |
| 24. | Sedalia | 22.9% | 9.6%(+13.2)#24 | 11.0%(+11.8)#1,945 |
| 25. | Meadowview Estates | 22.8% | 9.6%(+13.2)#25 | 11.0%(+11.8)#1,961 |
| 26. | Utica | 22.6% | 9.6%(+13.0)#26 | 11.0%(+11.6)#1,991 |
| 27. | Green Spring | 22.6% | 9.6%(+13.0)#27 | 11.0%(+11.6)#2,002 |
| 28. | Norwood | 22.3% | 9.6%(+12.7)#28 | 11.0%(+11.3)#2,057 |
| 29. | Allen | 22.2% | 9.6%(+12.6)#29 | 11.0%(+11.2)#2,074 |
| 30. | Lincolnshire | 22.0% | 9.6%(+12.4)#30 | 11.0%(+11.0)#2,125 |
| 31. | Druid Hills | 21.4% | 9.6%(+11.8)#31 | 11.0%(+10.4)#2,296 |
| 32. | Spring Valley | 21.0% | 9.6%(+11.4)#32 | 11.0%(+9.99)#2,418 |
| 33. | Oakland | 20.8% | 9.6%(+11.2)#33 | 11.0%(+9.81)#2,467 |
| 34. | Hickory Hill | 20.6% | 9.6%(+11.0)#34 | 11.0%(+9.57)#2,553 |
| 35. | Worthville | 20.5% | 9.6%(+10.9)#35 | 11.0%(+9.53)#2,563 |
| 36. | Crestview Hills | 20.5% | 9.6%(+10.9)#36 | 11.0%(+9.48)#2,581 |
| 37. | Spottsville | 20.3% | 9.6%(+10.6)#37 | 11.0%(+9.23)#2,660 |
| 38. | Park Hills | 20.1% | 9.6%(+10.5)#38 | 11.0%(+9.10)#2,696 |
| 39. | Nebo | 20.0% | 9.6%(+10.4)#39 | 11.0%(+8.98)#2,738 |
| 40. | Norbourne Estates | 19.9% | 9.6%(+10.3)#40 | 11.0%(+8.89)#2,801 |
| 41. | Beechwood Village | 19.8% | 9.6%(+10.2)#41 | 11.0%(+8.80)#2,824 |
| 42. | Fleming Neon | 19.5% | 9.6%(+9.93)#42 | 11.0%(+8.52)#2,922 |
| 43. | Windy Hills | 19.5% | 9.6%(+9.86)#43 | 11.0%(+8.45)#2,946 |
| 44. | Riverwood | 19.5% | 9.6%(+9.84)#44 | 11.0%(+8.44)#2,954 |
| 45. | Bellemeade | 19.4% | 9.6%(+9.77)#45 | 11.0%(+8.36)#2,991 |
| 46. | Whitley City | 19.4% | 9.6%(+9.75)#46 | 11.0%(+8.35)#2,997 |
| 47. | Edgewood | 19.3% | 9.6%(+9.71)#47 | 11.0%(+8.31)#3,010 |
| 48. | Ironville | 19.3% | 9.6%(+9.71)#48 | 11.0%(+8.30)#3,014 |
| 49. | Francisville | 19.3% | 9.6%(+9.65)#49 | 11.0%(+8.24)#3,039 |
| 50. | Lakeview Heights | 19.1% | 9.6%(+9.50)#50 | 11.0%(+8.10)#3,098 |
| 51. | Buckner | 18.6% | 9.6%(+9.00)#51 | 11.0%(+7.60)#3,299 |
| 52. | Plano | 18.6% | 9.6%(+8.96)#52 | 11.0%(+7.56)#3,323 |
| 53. | Richlawn | 18.2% | 9.6%(+8.57)#53 | 11.0%(+7.16)#3,528 |
| 54. | Sardis | 18.2% | 9.6%(+8.57)#54 | 11.0%(+7.16)#3,545 |
| 55. | Philpot | 18.1% | 9.6%(+8.47)#55 | 11.0%(+7.06)#3,584 |
| 56. | Langdon Place | 18.1% | 9.6%(+8.45)#56 | 11.0%(+7.05)#3,593 |
| 57. | Meadowbrook Farm | 18.0% | 9.6%(+8.38)#57 | 11.0%(+6.98)#3,617 |
| 58. | Pioneer Village | 17.9% | 9.6%(+8.27)#58 | 11.0%(+6.86)#3,690 |
| 59. | Bancroft | 17.8% | 9.6%(+8.23)#59 | 11.0%(+6.82)#3,713 |
| 60. | Hanson | 17.6% | 9.6%(+8.02)#60 | 11.0%(+6.61)#3,829 |
| 61. | Glenview Hills | 17.6% | 9.6%(+7.97)#61 | 11.0%(+6.56)#3,848 |
| 62. | Wellington | 17.4% | 9.6%(+7.83)#62 | 11.0%(+6.42)#3,926 |
| 63. | Prestonsburg | 17.4% | 9.6%(+7.76)#63 | 11.0%(+6.36)#3,967 |
| 64. | Russell | 17.2% | 9.6%(+7.61)#64 | 11.0%(+6.20)#4,072 |
| 65. | Blue Ridge Manor | 17.1% | 9.6%(+7.45)#65 | 11.0%(+6.05)#4,156 |
| 66. | Ewing | 16.8% | 9.6%(+7.22)#66 | 11.0%(+5.81)#4,281 |
| 67. | Old Brownsboro Place | 16.8% | 9.6%(+7.15)#67 | 11.0%(+5.74)#4,324 |
| 68. | Benton | 16.7% | 9.6%(+7.10)#68 | 11.0%(+5.69)#4,350 |
| 69. | St Matthews | 16.7% | 9.6%(+7.06)#69 | 11.0%(+5.66)#4,361 |
| 70. | Crestwood | 16.7% | 9.6%(+7.06)#70 | 11.0%(+5.66)#4,363 |
| 71. | South Carrollton | 16.7% | 9.6%(+7.05)#71 | 11.0%(+5.65)#4,390 |
| 72. | Union | 16.6% | 9.6%(+7.03)#72 | 11.0%(+5.62)#4,423 |
| 73. | Hazel | 16.4% | 9.6%(+6.80)#73 | 11.0%(+5.40)#4,549 |
| 74. | Houston Acres | 16.4% | 9.6%(+6.78)#74 | 11.0%(+5.38)#4,563 |
| 75. | Monterey | 16.3% | 9.6%(+6.66)#75 | 11.0%(+5.26)#4,626 |
| 76. | Hurstbourne | 16.2% | 9.6%(+6.54)#76 | 11.0%(+5.14)#4,695 |
| 77. | Douglass Hills | 16.1% | 9.6%(+6.50)#77 | 11.0%(+5.10)#4,732 |
| 78. | Clarkson | 16.1% | 9.6%(+6.45)#78 | 11.0%(+5.04)#4,764 |
| 79. | Moorland | 16.0% | 9.6%(+6.37)#79 | 11.0%(+4.97)#4,827 |
| 80. | Middletown | 15.8% | 9.6%(+6.17)#80 | 11.0%(+4.76)#4,980 |
| 81. | Seneca Gardens | 15.7% | 9.6%(+6.06)#81 | 11.0%(+4.66)#5,080 |
| 82. | Woodlawn Park | 15.6% | 9.6%(+6.03)#82 | 11.0%(+4.63)#5,106 |
| 83. | Southgate | 15.6% | 9.6%(+6.00)#83 | 11.0%(+4.59)#5,132 |
| 84. | Brownsboro Farm | 15.6% | 9.6%(+5.96)#84 | 11.0%(+4.55)#5,166 |
| 85. | Bellewood | 15.4% | 9.6%(+5.83)#85 | 11.0%(+4.43)#5,271 |
| 86. | Broeck Pointe | 15.3% | 9.6%(+5.65)#86 | 11.0%(+4.25)#5,429 |
| 87. | Villa Hills | 15.2% | 9.6%(+5.62)#87 | 11.0%(+4.22)#5,450 |
| 88. | Rochester | 15.2% | 9.6%(+5.60)#88 | 11.0%(+4.20)#5,470 |
| 89. | Barbourmeade | 15.2% | 9.6%(+5.58)#89 | 11.0%(+4.18)#5,485 |
| 90. | Fort Thomas | 15.1% | 9.6%(+5.51)#90 | 11.0%(+4.11)#5,531 |
| 91. | Goshen | 15.1% | 9.6%(+5.43)#91 | 11.0%(+4.03)#5,601 |
| 92. | Springfield | 15.0% | 9.6%(+5.39)#92 | 11.0%(+3.98)#5,625 |
| 93. | River Bluff | 14.9% | 9.6%(+5.29)#93 | 11.0%(+3.89)#5,706 |
| 94. | Calhoun | 14.9% | 9.6%(+5.25)#94 | 11.0%(+3.85)#5,735 |
| 95. | Spring Mill | 14.8% | 9.6%(+5.22)#95 | 11.0%(+3.82)#5,768 |
| 96. | Raywick | 14.8% | 9.6%(+5.14)#96 | 11.0%(+3.73)#5,841 |
| 97. | Owingsville | 14.7% | 9.6%(+5.09)#97 | 11.0%(+3.69)#5,868 |
| 98. | Vine Grove | 14.6% | 9.6%(+5.01)#98 | 11.0%(+3.61)#5,939 |
| 99. | Reidland | 14.4% | 9.6%(+4.80)#99 | 11.0%(+3.40)#6,117 |
| 100. | Claryville | 14.4% | 9.6%(+4.79)#100 | 11.0%(+3.38)#6,136 |
Common Questions
What are the Top 10 Cities with the Highest Percentage of Population Employed in Management in Kentucky?
Top 10 Cities with the Highest Percentage of Population Employed in Management in Kentucky are:
#1
65.9%
#2
39.9%
#3
34.2%
#4
30.4%
#5
30.3%
#6
29.4%
#7
29.0%
#8
28.6%
#9
28.2%
#10
28.0%
What city has the Highest Percentage of Population Employed in Management in Kentucky?
Bandana has the Highest Percentage of Population Employed in Management in Kentucky with 65.9%.
What is the Percentage of Population Employed in Management in the State of Kentucky?
Percentage of Population Employed in Management in Kentucky is 9.6%.
What is the Percentage of Population Employed in Management in the United States?
Percentage of Population Employed in Management in the United States is 11.0%.