Cities with the Most Immigrants from Trinidad and Tobago in Virginia
RELATED REPORTS & OPTIONS
Trinidad and Tobago
Virginia
Compare Cities
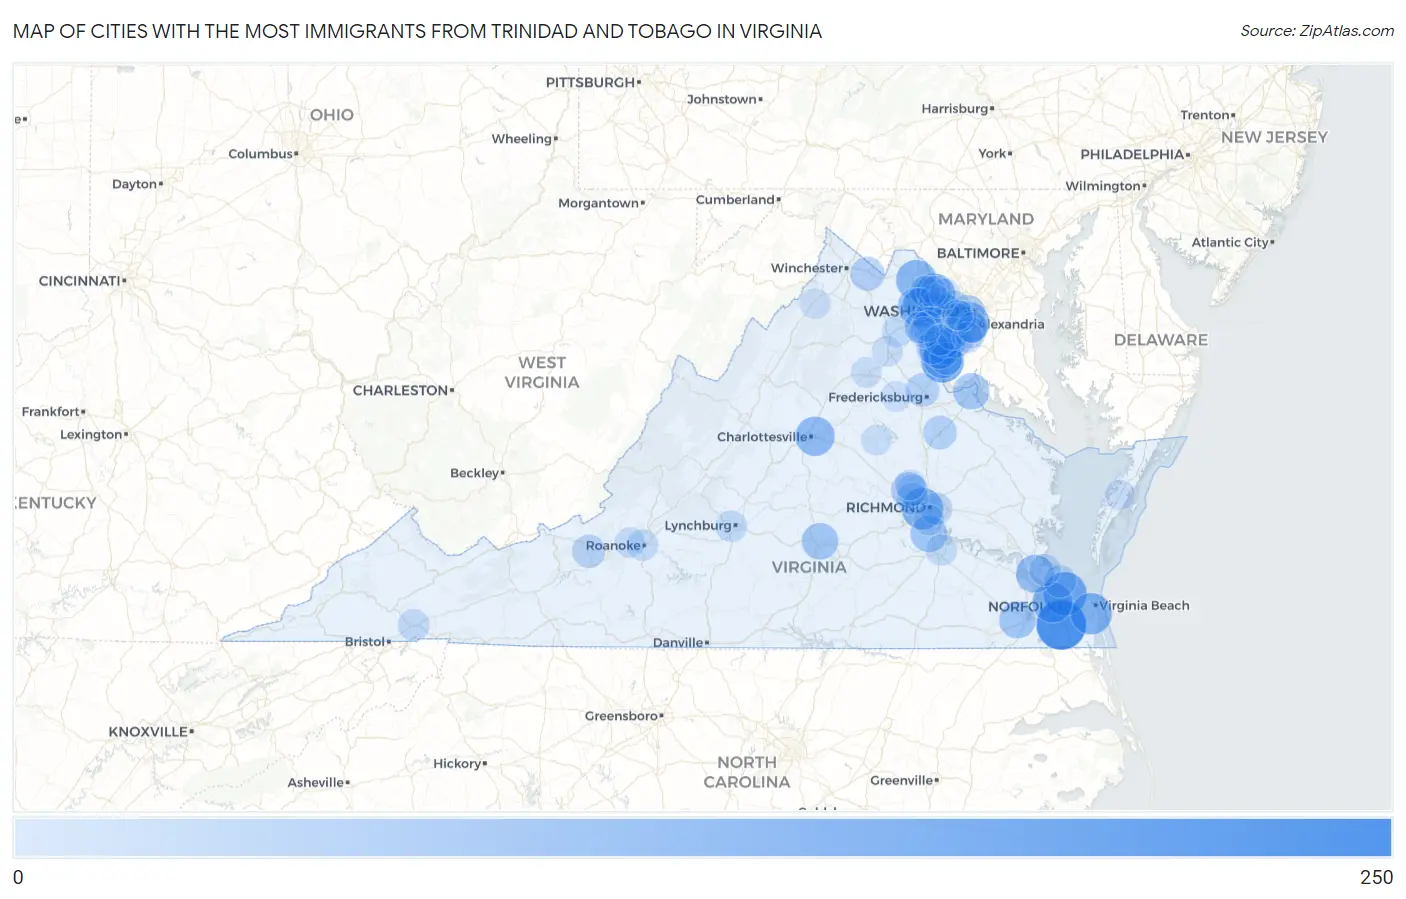
Map of Cities with the Most Immigrants from Trinidad and Tobago in Virginia
0
250
Cities with the Most Immigrants from Trinidad and Tobago in Virginia
| City | Trinidad and Tobago | vs State | vs National | |
| 1. | Chesapeake | 219 | 4,211(5.20%)#1 | 231,222(0.09%)#102 |
| 2. | Norfolk | 149 | 4,211(3.54%)#2 | 231,222(0.06%)#163 |
| 3. | Sterling | 145 | 4,211(3.44%)#3 | 231,222(0.06%)#170 |
| 4. | Triangle | 141 | 4,211(3.35%)#4 | 231,222(0.06%)#182 |
| 5. | Dale City | 127 | 4,211(3.02%)#5 | 231,222(0.05%)#200 |
| 6. | Virginia Beach | 125 | 4,211(2.97%)#6 | 231,222(0.05%)#208 |
| 7. | Richmond | 125 | 4,211(2.97%)#7 | 231,222(0.05%)#210 |
| 8. | Rose Hill Cdp Fairfax County | 123 | 4,211(2.92%)#8 | 231,222(0.05%)#215 |
| 9. | Alexandria | 120 | 4,211(2.85%)#9 | 231,222(0.05%)#220 |
| 10. | Portsmouth | 115 | 4,211(2.73%)#10 | 231,222(0.05%)#231 |
| 11. | Leesburg | 112 | 4,211(2.66%)#11 | 231,222(0.05%)#244 |
| 12. | South Riding | 103 | 4,211(2.45%)#12 | 231,222(0.04%)#271 |
| 13. | Pantops | 101 | 4,211(2.40%)#13 | 231,222(0.04%)#276 |
| 14. | Dumfries | 99 | 4,211(2.35%)#14 | 231,222(0.04%)#280 |
| 15. | Newport News | 86 | 4,211(2.04%)#15 | 231,222(0.04%)#321 |
| 16. | Stone Ridge | 75 | 4,211(1.78%)#16 | 231,222(0.03%)#378 |
| 17. | Suffolk | 72 | 4,211(1.71%)#17 | 231,222(0.03%)#393 |
| 18. | Chester | 72 | 4,211(1.71%)#18 | 231,222(0.03%)#397 |
| 19. | Potomac Mills | 72 | 4,211(1.71%)#19 | 231,222(0.03%)#400 |
| 20. | Farmville | 70 | 4,211(1.66%)#20 | 231,222(0.03%)#414 |
| 21. | Dahlgren | 67 | 4,211(1.59%)#21 | 231,222(0.03%)#434 |
| 22. | Lorton | 60 | 4,211(1.42%)#22 | 231,222(0.03%)#463 |
| 23. | Short Pump | 57 | 4,211(1.35%)#23 | 231,222(0.02%)#487 |
| 24. | Arlington | 55 | 4,211(1.31%)#24 | 231,222(0.02%)#498 |
| 25. | Sudley | 49 | 4,211(1.16%)#25 | 231,222(0.02%)#538 |
| 26. | Manassas Park | 44 | 4,211(1.04%)#26 | 231,222(0.02%)#577 |
| 27. | Berryville | 42 | 4,211(1.00%)#27 | 231,222(0.02%)#594 |
| 28. | Tysons | 41 | 4,211(0.97%)#28 | 231,222(0.02%)#602 |
| 29. | Bowling Green | 39 | 4,211(0.93%)#29 | 231,222(0.02%)#627 |
| 30. | Southern Gateway | 38 | 4,211(0.90%)#30 | 231,222(0.02%)#646 |
| 31. | Blacksburg | 34 | 4,211(0.81%)#31 | 231,222(0.01%)#699 |
| 32. | Montclair | 34 | 4,211(0.81%)#32 | 231,222(0.01%)#703 |
| 33. | Lake Ridge | 33 | 4,211(0.78%)#33 | 231,222(0.01%)#715 |
| 34. | Oakton | 33 | 4,211(0.78%)#34 | 231,222(0.01%)#717 |
| 35. | Independent Hill | 31 | 4,211(0.74%)#35 | 231,222(0.01%)#749 |
| 36. | Hutchison | 31 | 4,211(0.74%)#36 | 231,222(0.01%)#752 |
| 37. | Hampton | 28 | 4,211(0.66%)#37 | 231,222(0.01%)#791 |
| 38. | Huntington | 25 | 4,211(0.59%)#38 | 231,222(0.01%)#860 |
| 39. | Montrose | 25 | 4,211(0.59%)#39 | 231,222(0.01%)#869 |
| 40. | Cherry Hill | 24 | 4,211(0.57%)#40 | 231,222(0.01%)#883 |
| 41. | Newington Forest | 24 | 4,211(0.57%)#41 | 231,222(0.01%)#886 |
| 42. | Tuckahoe | 23 | 4,211(0.55%)#42 | 231,222(0.01%)#901 |
| 43. | Franklin Farm | 22 | 4,211(0.52%)#43 | 231,222(0.01%)#934 |
| 44. | Hybla Valley | 19 | 4,211(0.45%)#44 | 231,222(0.01%)#1,000 |
| 45. | Abingdon | 19 | 4,211(0.45%)#45 | 231,222(0.01%)#1,014 |
| 46. | Bethel Manor | 19 | 4,211(0.45%)#46 | 231,222(0.01%)#1,018 |
| 47. | New Baltimore | 16 | 4,211(0.38%)#47 | 231,222(0.01%)#1,111 |
| 48. | Innsbrook | 16 | 4,211(0.38%)#48 | 231,222(0.01%)#1,114 |
| 49. | Lynchburg | 15 | 4,211(0.36%)#49 | 231,222(0.01%)#1,132 |
| 50. | Herndon | 15 | 4,211(0.36%)#50 | 231,222(0.01%)#1,143 |
| 51. | Roanoke | 14 | 4,211(0.33%)#51 | 231,222(0.01%)#1,161 |
| 52. | Annandale | 14 | 4,211(0.33%)#52 | 231,222(0.01%)#1,171 |
| 53. | Fort Lee | 14 | 4,211(0.33%)#53 | 231,222(0.01%)#1,187 |
| 54. | Centreville | 13 | 4,211(0.31%)#54 | 231,222(0.01%)#1,202 |
| 55. | Arcola | 13 | 4,211(0.31%)#55 | 231,222(0.01%)#1,229 |
| 56. | Bull Run | 12 | 4,211(0.28%)#56 | 231,222(0.01%)#1,252 |
| 57. | Yorkshire | 12 | 4,211(0.28%)#57 | 231,222(0.01%)#1,260 |
| 58. | County Center | 11 | 4,211(0.26%)#58 | 231,222(0.00%)#1,315 |
| 59. | Reston | 9 | 4,211(0.21%)#59 | 231,222(0.00%)#1,381 |
| 60. | Ashburn | 9 | 4,211(0.21%)#60 | 231,222(0.00%)#1,384 |
| 61. | Sugarland Run | 9 | 4,211(0.21%)#61 | 231,222(0.00%)#1,402 |
| 62. | Mount Vernon | 8 | 4,211(0.19%)#62 | 231,222(0.00%)#1,444 |
| 63. | Lake Barcroft | 8 | 4,211(0.19%)#63 | 231,222(0.00%)#1,447 |
| 64. | Belle Haven | 8 | 4,211(0.19%)#64 | 231,222(0.00%)#1,451 |
| 65. | Salem | 7 | 4,211(0.17%)#65 | 231,222(0.00%)#1,476 |
| 66. | Woodlawn Cdp Fairfax County | 7 | 4,211(0.17%)#66 | 231,222(0.00%)#1,478 |
| 67. | Leesylvania | 7 | 4,211(0.17%)#67 | 231,222(0.00%)#1,479 |
| 68. | Great Falls | 7 | 4,211(0.17%)#68 | 231,222(0.00%)#1,488 |
| 69. | Wyndham | 7 | 4,211(0.17%)#69 | 231,222(0.00%)#1,494 |
| 70. | Bensley | 7 | 4,211(0.17%)#70 | 231,222(0.00%)#1,503 |
| 71. | Culpeper | 6 | 4,211(0.14%)#71 | 231,222(0.00%)#1,533 |
| 72. | Dulles Town Center | 6 | 4,211(0.14%)#72 | 231,222(0.00%)#1,545 |
| 73. | Opal | 6 | 4,211(0.14%)#73 | 231,222(0.00%)#1,564 |
| 74. | Mineral | 6 | 4,211(0.14%)#74 | 231,222(0.00%)#1,565 |
| 75. | Manassas | 5 | 4,211(0.12%)#75 | 231,222(0.00%)#1,576 |
| 76. | Lake Wilderness | 5 | 4,211(0.12%)#76 | 231,222(0.00%)#1,598 |
| 77. | Rio | 5 | 4,211(0.12%)#77 | 231,222(0.00%)#1,608 |
| 78. | Toms Brook | 5 | 4,211(0.12%)#78 | 231,222(0.00%)#1,612 |
| 79. | West Falls Church | 4 | 4,211(0.09%)#79 | 231,222(0.00%)#1,619 |
| 80. | Keller | 2 | 4,211(0.05%)#80 | 231,222(0.00%)#1,695 |
Common Questions
What are the Top 10 Cities with the Most Immigrants from Trinidad and Tobago in Virginia?
Top 10 Cities with the Most Immigrants from Trinidad and Tobago in Virginia are:
#1
219
#2
149
#3
145
#4
141
#5
127
#6
125
#7
125
#8
120
#9
115
#10
112
What city has the Most Immigrants from Trinidad and Tobago in Virginia?
Chesapeake has the Most Immigrants from Trinidad and Tobago in Virginia with 219.
What is the Total Immigrants from Trinidad and Tobago in the State of Virginia?
Total Immigrants from Trinidad and Tobago in Virginia is 4,211.
What is the Total Immigrants from Trinidad and Tobago in the United States?
Total Immigrants from Trinidad and Tobago in the United States is 231,222.