Cities with the Most Immigrants from Trinidad and Tobago in Florida
RELATED REPORTS & OPTIONS
Trinidad and Tobago
Florida
Compare Cities
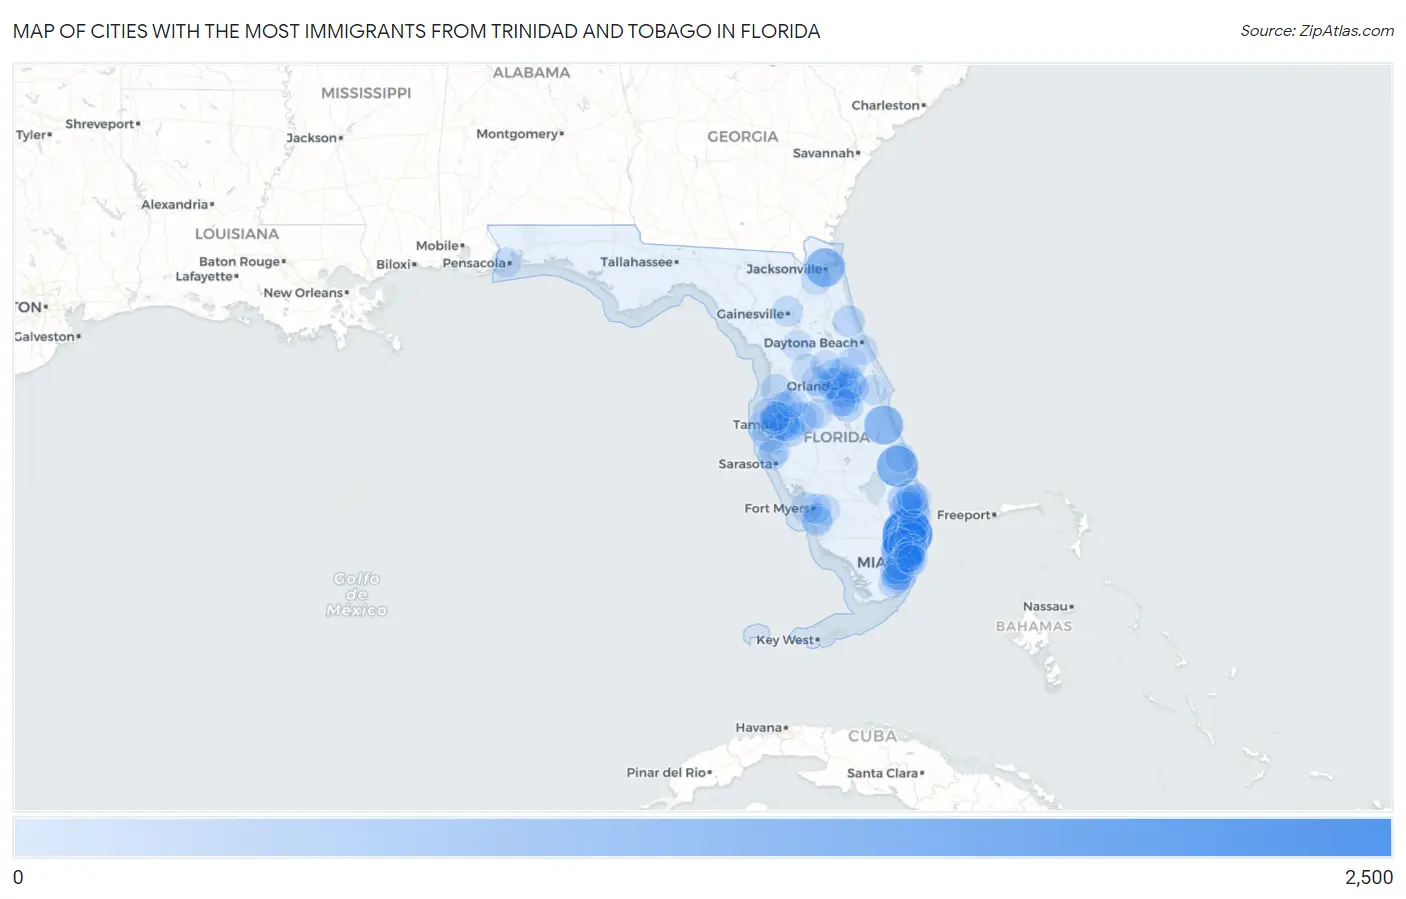
Map of Cities with the Most Immigrants from Trinidad and Tobago in Florida
0
2,500
Cities with the Most Immigrants from Trinidad and Tobago in Florida
| City | Trinidad and Tobago | vs State | vs National | |
| 1. | Margate | 2,234 | 43,642(5.12%)#1 | 231,222(0.97%)#4 |
| 2. | Sunrise | 1,443 | 43,642(3.31%)#2 | 231,222(0.62%)#9 |
| 3. | Coral Springs | 1,337 | 43,642(3.06%)#3 | 231,222(0.58%)#11 |
| 4. | Port St Lucie | 1,289 | 43,642(2.95%)#4 | 231,222(0.56%)#12 |
| 5. | Miramar | 1,192 | 43,642(2.73%)#5 | 231,222(0.52%)#14 |
| 6. | Palm Bay | 1,031 | 43,642(2.36%)#6 | 231,222(0.45%)#15 |
| 7. | Jacksonville | 1,024 | 43,642(2.35%)#7 | 231,222(0.44%)#16 |
| 8. | Miami Gardens | 947 | 43,642(2.17%)#8 | 231,222(0.41%)#18 |
| 9. | North Lauderdale | 934 | 43,642(2.14%)#9 | 231,222(0.40%)#19 |
| 10. | Tamarac | 788 | 43,642(1.81%)#10 | 231,222(0.34%)#20 |
| 11. | Pembroke Pines | 770 | 43,642(1.76%)#11 | 231,222(0.33%)#21 |
| 12. | Tampa | 765 | 43,642(1.75%)#12 | 231,222(0.33%)#22 |
| 13. | Lauderhill | 755 | 43,642(1.73%)#13 | 231,222(0.33%)#23 |
| 14. | University Cdp Hillsborough County | 577 | 43,642(1.32%)#14 | 231,222(0.25%)#28 |
| 15. | Lauderdale Lakes | 558 | 43,642(1.28%)#15 | 231,222(0.24%)#29 |
| 16. | Orlando | 555 | 43,642(1.27%)#16 | 231,222(0.24%)#30 |
| 17. | Coconut Creek | 500 | 43,642(1.15%)#17 | 231,222(0.22%)#34 |
| 18. | Hollywood | 456 | 43,642(1.04%)#18 | 231,222(0.20%)#38 |
| 19. | Greenacres | 447 | 43,642(1.02%)#19 | 231,222(0.19%)#39 |
| 20. | Plant City | 424 | 43,642(0.97%)#20 | 231,222(0.18%)#44 |
| 21. | Fort Lauderdale | 413 | 43,642(0.95%)#21 | 231,222(0.18%)#46 |
| 22. | Davie | 394 | 43,642(0.90%)#22 | 231,222(0.17%)#47 |
| 23. | St Petersburg | 383 | 43,642(0.88%)#23 | 231,222(0.17%)#49 |
| 24. | Buenaventura Lakes | 355 | 43,642(0.81%)#24 | 231,222(0.15%)#51 |
| 25. | Alafaya | 346 | 43,642(0.79%)#25 | 231,222(0.15%)#55 |
| 26. | The Acreage | 340 | 43,642(0.78%)#26 | 231,222(0.15%)#58 |
| 27. | Miami | 319 | 43,642(0.73%)#27 | 231,222(0.14%)#64 |
| 28. | Brandon | 293 | 43,642(0.67%)#28 | 231,222(0.13%)#70 |
| 29. | Pine Hills | 278 | 43,642(0.64%)#29 | 231,222(0.12%)#75 |
| 30. | Deerfield Beach | 276 | 43,642(0.63%)#30 | 231,222(0.12%)#77 |
| 31. | Palm Coast | 268 | 43,642(0.61%)#31 | 231,222(0.12%)#80 |
| 32. | Cutler Bay | 266 | 43,642(0.61%)#32 | 231,222(0.12%)#82 |
| 33. | Boynton Beach | 258 | 43,642(0.59%)#33 | 231,222(0.11%)#85 |
| 34. | Wellington | 249 | 43,642(0.57%)#34 | 231,222(0.11%)#88 |
| 35. | Ocoee | 248 | 43,642(0.57%)#35 | 231,222(0.11%)#90 |
| 36. | St Cloud | 236 | 43,642(0.54%)#36 | 231,222(0.10%)#95 |
| 37. | Oakland Park | 225 | 43,642(0.52%)#37 | 231,222(0.10%)#98 |
| 38. | Riverview | 222 | 43,642(0.51%)#38 | 231,222(0.10%)#99 |
| 39. | West Park | 220 | 43,642(0.50%)#39 | 231,222(0.10%)#101 |
| 40. | Spring Hill | 209 | 43,642(0.48%)#40 | 231,222(0.09%)#107 |
| 41. | Union Park | 204 | 43,642(0.47%)#41 | 231,222(0.09%)#110 |
| 42. | Kissimmee | 198 | 43,642(0.45%)#42 | 231,222(0.09%)#115 |
| 43. | Marion Oaks | 198 | 43,642(0.45%)#43 | 231,222(0.09%)#116 |
| 44. | Richmond West | 189 | 43,642(0.43%)#44 | 231,222(0.08%)#125 |
| 45. | West Palm Beach | 185 | 43,642(0.42%)#45 | 231,222(0.08%)#128 |
| 46. | Homestead | 184 | 43,642(0.42%)#46 | 231,222(0.08%)#131 |
| 47. | Pompano Beach | 181 | 43,642(0.41%)#47 | 231,222(0.08%)#132 |
| 48. | Kendall | 179 | 43,642(0.41%)#48 | 231,222(0.08%)#133 |
| 49. | Cape Coral | 176 | 43,642(0.40%)#49 | 231,222(0.08%)#136 |
| 50. | Cooper City | 174 | 43,642(0.40%)#50 | 231,222(0.08%)#139 |
| 51. | University Cdp Orange County | 171 | 43,642(0.39%)#51 | 231,222(0.07%)#140 |
| 52. | Gainesville | 166 | 43,642(0.38%)#52 | 231,222(0.07%)#146 |
| 53. | Memphis | 160 | 43,642(0.37%)#53 | 231,222(0.07%)#152 |
| 54. | Apopka | 158 | 43,642(0.36%)#54 | 231,222(0.07%)#154 |
| 55. | Royal Palm Beach | 152 | 43,642(0.35%)#55 | 231,222(0.07%)#157 |
| 56. | Carrollwood | 150 | 43,642(0.34%)#56 | 231,222(0.06%)#162 |
| 57. | Gladeview | 149 | 43,642(0.34%)#57 | 231,222(0.06%)#164 |
| 58. | Wesley Chapel | 147 | 43,642(0.34%)#58 | 231,222(0.06%)#165 |
| 59. | San Carlos Park | 145 | 43,642(0.33%)#59 | 231,222(0.06%)#171 |
| 60. | Richmond Heights | 143 | 43,642(0.33%)#60 | 231,222(0.06%)#175 |
| 61. | East Lake | 142 | 43,642(0.33%)#61 | 231,222(0.06%)#177 |
| 62. | South Miami Heights | 138 | 43,642(0.32%)#62 | 231,222(0.06%)#186 |
| 63. | Oakleaf Plantation | 130 | 43,642(0.30%)#63 | 231,222(0.06%)#194 |
| 64. | Land O Lakes | 127 | 43,642(0.29%)#64 | 231,222(0.05%)#201 |
| 65. | The Hammocks | 126 | 43,642(0.29%)#65 | 231,222(0.05%)#204 |
| 66. | Clermont | 125 | 43,642(0.29%)#66 | 231,222(0.05%)#211 |
| 67. | Deltona | 122 | 43,642(0.28%)#67 | 231,222(0.05%)#216 |
| 68. | North Miami Beach | 121 | 43,642(0.28%)#68 | 231,222(0.05%)#219 |
| 69. | South Bradenton | 117 | 43,642(0.27%)#69 | 231,222(0.05%)#228 |
| 70. | Lake Mary | 117 | 43,642(0.27%)#70 | 231,222(0.05%)#229 |
| 71. | Liberty Triangle | 113 | 43,642(0.26%)#71 | 231,222(0.05%)#240 |
| 72. | Lehigh Acres | 110 | 43,642(0.25%)#72 | 231,222(0.05%)#247 |
| 73. | Hallandale Beach | 109 | 43,642(0.25%)#73 | 231,222(0.05%)#250 |
| 74. | Estero | 109 | 43,642(0.25%)#74 | 231,222(0.05%)#251 |
| 75. | Golden Glades | 109 | 43,642(0.25%)#75 | 231,222(0.05%)#252 |
| 76. | Port St John | 108 | 43,642(0.25%)#76 | 231,222(0.05%)#258 |
| 77. | Boca Raton | 105 | 43,642(0.24%)#77 | 231,222(0.05%)#264 |
| 78. | Lakeland | 104 | 43,642(0.24%)#78 | 231,222(0.04%)#267 |
| 79. | Palm Beach Gardens | 104 | 43,642(0.24%)#79 | 231,222(0.04%)#268 |
| 80. | Fort Myers | 103 | 43,642(0.24%)#80 | 231,222(0.04%)#269 |
| 81. | Port Orange | 103 | 43,642(0.24%)#81 | 231,222(0.04%)#270 |
| 82. | Palm River Clair Mel | 96 | 43,642(0.22%)#82 | 231,222(0.04%)#288 |
| 83. | Largo | 94 | 43,642(0.22%)#83 | 231,222(0.04%)#290 |
| 84. | West Pensacola | 89 | 43,642(0.20%)#84 | 231,222(0.04%)#311 |
| 85. | Westchester | 88 | 43,642(0.20%)#85 | 231,222(0.04%)#317 |
| 86. | Riviera Beach | 88 | 43,642(0.20%)#86 | 231,222(0.04%)#318 |
| 87. | Ocala | 86 | 43,642(0.20%)#87 | 231,222(0.04%)#322 |
| 88. | Wildwood | 85 | 43,642(0.19%)#88 | 231,222(0.04%)#330 |
| 89. | Fort Pierce | 84 | 43,642(0.19%)#89 | 231,222(0.04%)#334 |
| 90. | Miami Shores | 82 | 43,642(0.19%)#90 | 231,222(0.04%)#345 |
| 91. | Naranja | 79 | 43,642(0.18%)#91 | 231,222(0.03%)#357 |
| 92. | Town N Country | 78 | 43,642(0.18%)#92 | 231,222(0.03%)#360 |
| 93. | Citrus Park | 76 | 43,642(0.17%)#93 | 231,222(0.03%)#374 |
| 94. | Auburndale | 76 | 43,642(0.17%)#94 | 231,222(0.03%)#375 |
| 95. | Weston | 73 | 43,642(0.17%)#95 | 231,222(0.03%)#387 |
| 96. | Pasadena Hills | 73 | 43,642(0.17%)#96 | 231,222(0.03%)#392 |
| 97. | West Little River | 72 | 43,642(0.16%)#97 | 231,222(0.03%)#395 |
| 98. | Groveland | 71 | 43,642(0.16%)#98 | 231,222(0.03%)#405 |
| 99. | Miami Beach | 70 | 43,642(0.16%)#99 | 231,222(0.03%)#408 |
| 100. | Eustis | 70 | 43,642(0.16%)#100 | 231,222(0.03%)#411 |
Common Questions
What are the Top 10 Cities with the Most Immigrants from Trinidad and Tobago in Florida?
Top 10 Cities with the Most Immigrants from Trinidad and Tobago in Florida are:
#1
2,234
#2
1,443
#3
1,337
#4
1,289
#5
1,192
#6
1,031
#7
1,024
#8
947
#9
934
#10
788
What city has the Most Immigrants from Trinidad and Tobago in Florida?
Margate has the Most Immigrants from Trinidad and Tobago in Florida with 2,234.
What is the Total Immigrants from Trinidad and Tobago in the State of Florida?
Total Immigrants from Trinidad and Tobago in Florida is 43,642.
What is the Total Immigrants from Trinidad and Tobago in the United States?
Total Immigrants from Trinidad and Tobago in the United States is 231,222.