Flora, IL
Flora Map
Flora Overview
4,701
TOTAL POPULATION
2,166
MALE POPULATION
2,535
FEMALE POPULATION
85.44
MALES / 100 FEMALES
117.04
FEMALES / 100 MALES
43.7
MEDIAN AGE
2.8
AVG FAMILY SIZE
2.1
AVG HOUSEHOLD SIZE
$29,968
PER CAPITA INCOME
$65,036
AVG FAMILY INCOME
$50,407
AVG HOUSEHOLD INCOME
37.6%
WAGE / INCOME GAP [ % ]
62.4¢/ $1
WAGE / INCOME GAP [ $ ]
0.41
INEQUALITY / GINI INDEX
2,109
LABOR FORCE [ PEOPLE ]
53.2%
PERCENT IN LABOR FORCE
6.8%
UNEMPLOYMENT RATE
Flora Zip Codes
Flora Area Codes
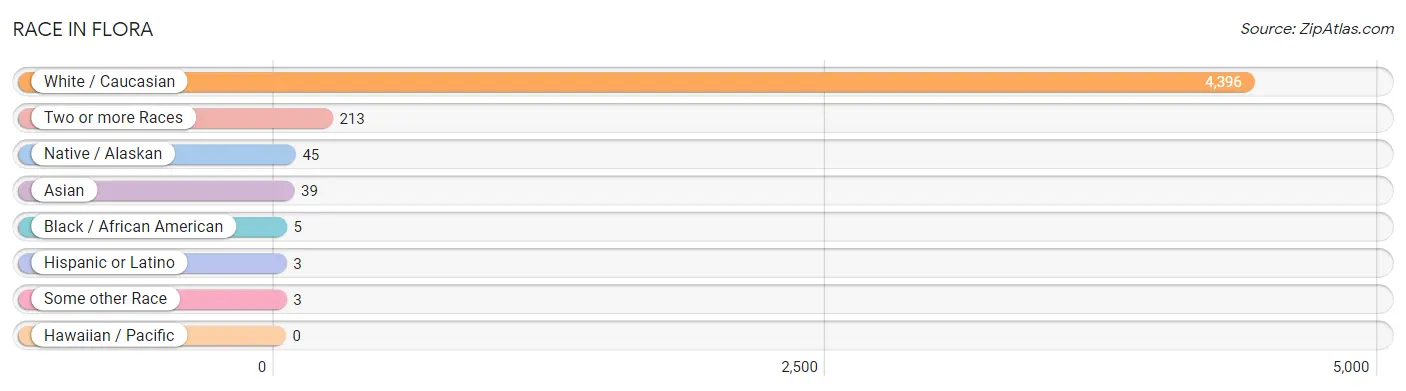
Race in Flora
The most populous races in Flora are White / Caucasian (4,396 | 93.5%), Two or more Races (213 | 4.5%), and Native / Alaskan (45 | 1.0%).
| Race | # Population | % Population |
| Asian | 39 | 0.8% |
| Black / African American | 5 | 0.1% |
| Hawaiian / Pacific | 0 | 0.0% |
| Hispanic or Latino | 3 | 0.1% |
| Native / Alaskan | 45 | 1.0% |
| White / Caucasian | 4,396 | 93.5% |
| Two or more Races | 213 | 4.5% |
| Some other Race | 3 | 0.1% |
| Total | 4,701 | 100.0% |
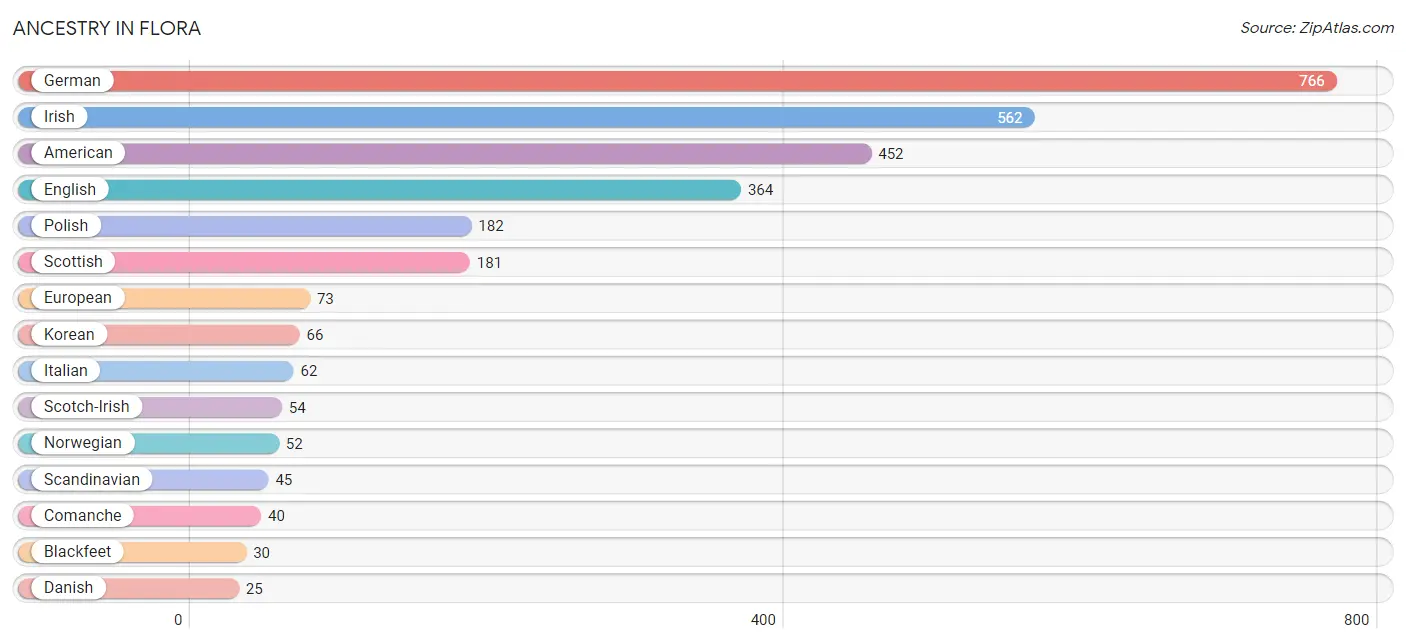
Ancestry in Flora
The most populous ancestries reported in Flora are German (766 | 16.3%), Irish (562 | 11.9%), American (452 | 9.6%), English (364 | 7.7%), and Polish (182 | 3.9%), together accounting for 49.5% of all Flora residents.
| Ancestry | # Population | % Population |
| American | 452 | 9.6% |
| Blackfeet | 30 | 0.6% |
| Celtic | 8 | 0.2% |
| Comanche | 40 | 0.9% |
| Danish | 25 | 0.5% |
| Dutch | 14 | 0.3% |
| English | 364 | 7.7% |
| European | 73 | 1.5% |
| Filipino | 6 | 0.1% |
| German | 766 | 16.3% |
| Irish | 562 | 11.9% |
| Italian | 62 | 1.3% |
| Korean | 66 | 1.4% |
| Mexican | 3 | 0.1% |
| Northern European | 11 | 0.2% |
| Norwegian | 52 | 1.1% |
| Polish | 182 | 3.9% |
| Scandinavian | 45 | 1.0% |
| Scotch-Irish | 54 | 1.1% |
| Scottish | 181 | 3.8% |
| Sioux | 5 | 0.1% |
| Sri Lankan | 19 | 0.4% | View All 22 Rows |
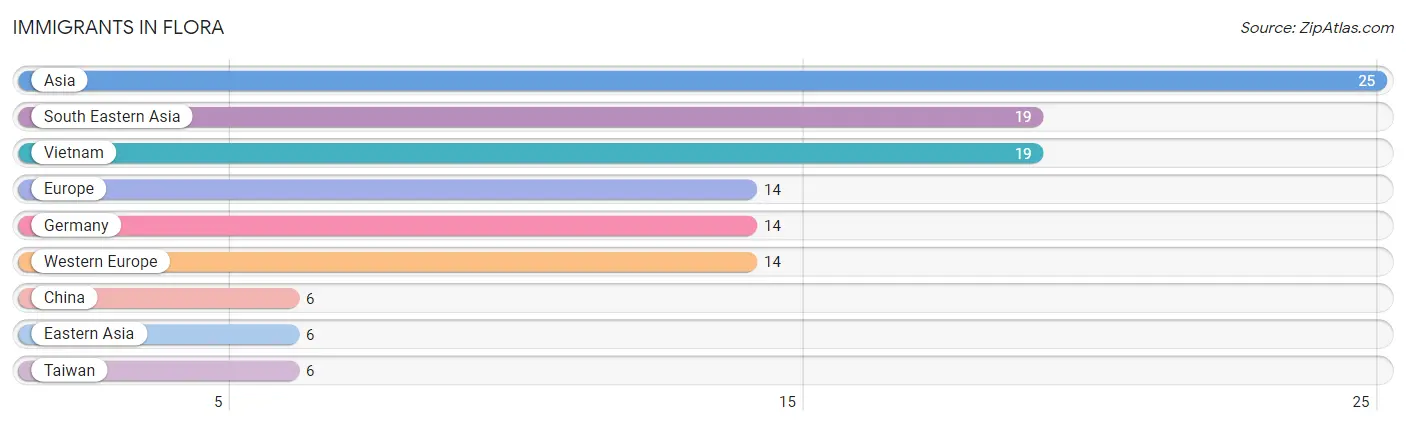
Immigrants in Flora
The most numerous immigrant groups reported in Flora came from Asia (25 | 0.5%), South Eastern Asia (19 | 0.4%), Vietnam (19 | 0.4%), Europe (14 | 0.3%), and Germany (14 | 0.3%), together accounting for 1.9% of all Flora residents.
| Immigration Origin | # Population | % Population |
| Asia | 25 | 0.5% |
| China | 6 | 0.1% |
| Eastern Asia | 6 | 0.1% |
| Europe | 14 | 0.3% |
| Germany | 14 | 0.3% |
| South Eastern Asia | 19 | 0.4% |
| Taiwan | 6 | 0.1% |
| Vietnam | 19 | 0.4% |
| Western Europe | 14 | 0.3% | View All 9 Rows |
Sex and Age in Flora
Sex and Age in Flora
The most populous age groups in Flora are 60 to 64 Years (238 | 11.0%) for men and 55 to 59 Years (257 | 10.1%) for women.
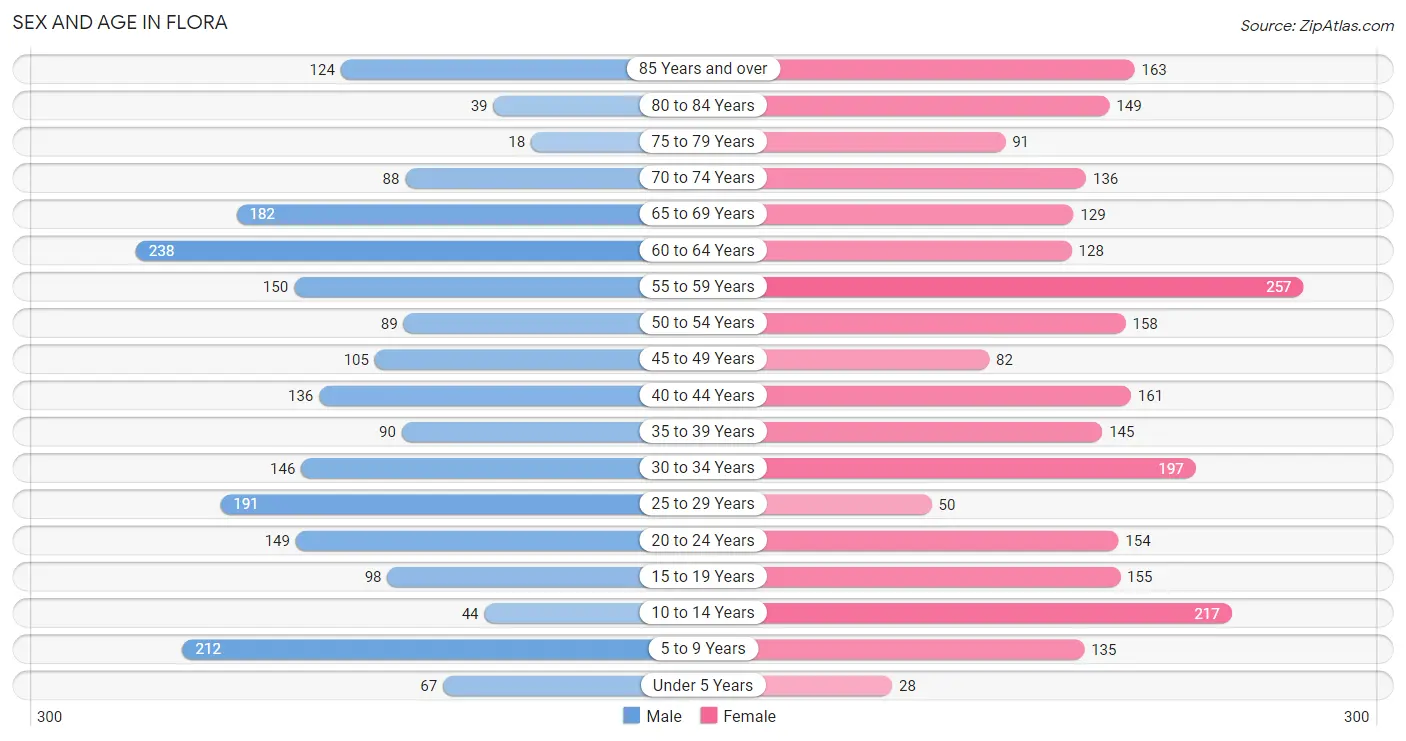
| Age Bracket | Male | Female |
| Under 5 Years | 67 (3.1%) | 28 (1.1%) |
| 5 to 9 Years | 212 (9.8%) | 135 (5.3%) |
| 10 to 14 Years | 44 (2.0%) | 217 (8.6%) |
| 15 to 19 Years | 98 (4.5%) | 155 (6.1%) |
| 20 to 24 Years | 149 (6.9%) | 154 (6.1%) |
| 25 to 29 Years | 191 (8.8%) | 50 (2.0%) |
| 30 to 34 Years | 146 (6.7%) | 197 (7.8%) |
| 35 to 39 Years | 90 (4.2%) | 145 (5.7%) |
| 40 to 44 Years | 136 (6.3%) | 161 (6.4%) |
| 45 to 49 Years | 105 (4.9%) | 82 (3.2%) |
| 50 to 54 Years | 89 (4.1%) | 158 (6.2%) |
| 55 to 59 Years | 150 (6.9%) | 257 (10.1%) |
| 60 to 64 Years | 238 (11.0%) | 128 (5.1%) |
| 65 to 69 Years | 182 (8.4%) | 129 (5.1%) |
| 70 to 74 Years | 88 (4.1%) | 136 (5.4%) |
| 75 to 79 Years | 18 (0.8%) | 91 (3.6%) |
| 80 to 84 Years | 39 (1.8%) | 149 (5.9%) |
| 85 Years and over | 124 (5.7%) | 163 (6.4%) |
| Total | 2,166 (100.0%) | 2,535 (100.0%) |
Families and Households in Flora
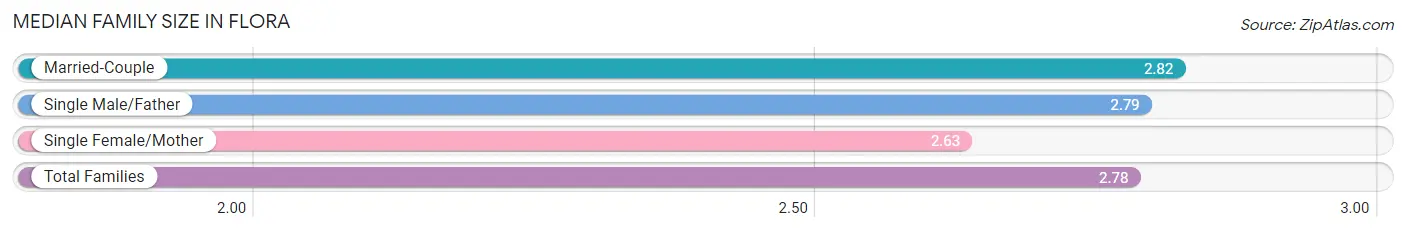
Median Family Size in Flora
The median family size in Flora is 2.78 persons per family, with married-couple families (724 | 71.1%) accounting for the largest median family size of 2.82 persons per family. On the other hand, single female/mother families (158 | 15.5%) represent the smallest median family size with 2.63 persons per family.
| Family Type | # Families | Family Size |
| Married-Couple | 724 (71.1%) | 2.82 |
| Single Male/Father | 136 (13.4%) | 2.79 |
| Single Female/Mother | 158 (15.5%) | 2.63 |
| Total Families | 1,018 (100.0%) | 2.78 |
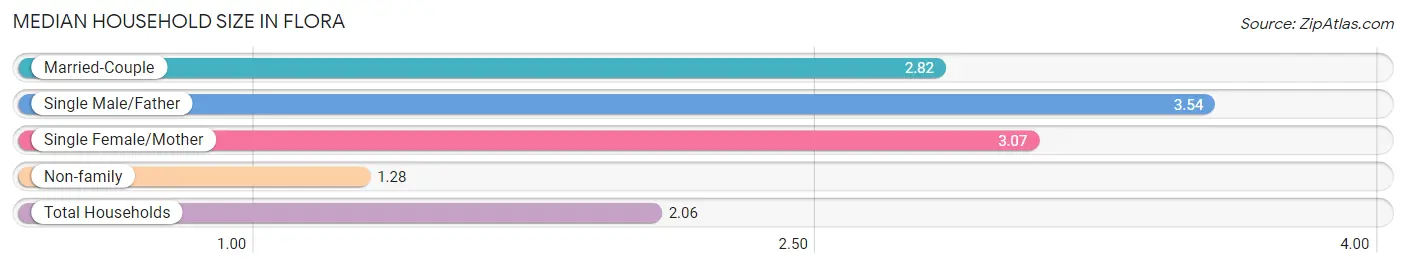
Median Household Size in Flora
The median household size in Flora is 2.06 persons per household, with single male/father households (136 | 6.2%) accounting for the largest median household size of 3.54 persons per household. non-family households (1,170 | 53.5%) represent the smallest median household size with 1.28 persons per household.
| Household Type | # Households | Household Size |
| Married-Couple | 724 (33.1%) | 2.82 |
| Single Male/Father | 136 (6.2%) | 3.54 |
| Single Female/Mother | 158 (7.2%) | 3.07 |
| Non-family | 1,170 (53.5%) | 1.28 |
| Total Households | 2,188 (100.0%) | 2.06 |
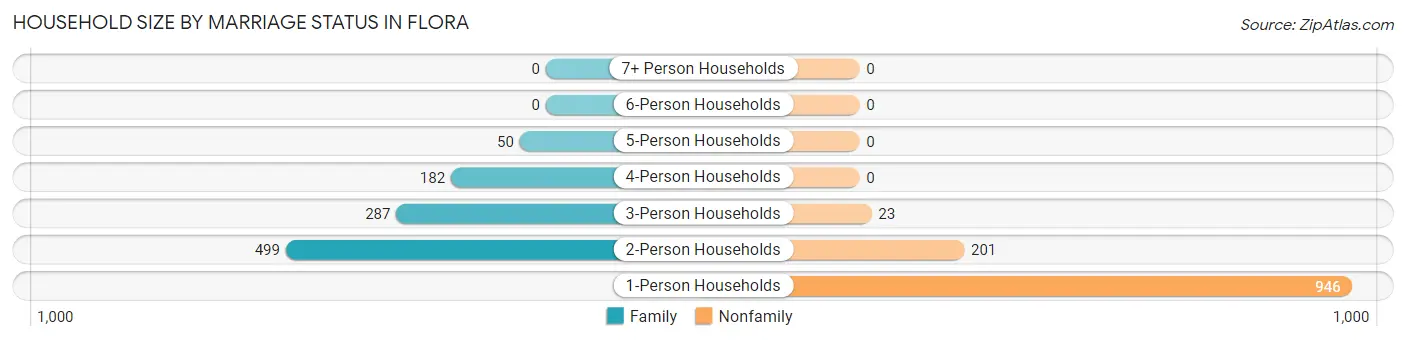
Household Size by Marriage Status in Flora
Out of a total of 2,188 households in Flora, 1,018 (46.5%) are family households, while 1,170 (53.5%) are nonfamily households. The most numerous type of family households are 2-person households, comprising 499, and the most common type of nonfamily households are 1-person households, comprising 946.
| Household Size | Family Households | Nonfamily Households |
| 1-Person Households | - | 946 (43.2%) |
| 2-Person Households | 499 (22.8%) | 201 (9.2%) |
| 3-Person Households | 287 (13.1%) | 23 (1.1%) |
| 4-Person Households | 182 (8.3%) | 0 (0.0%) |
| 5-Person Households | 50 (2.3%) | 0 (0.0%) |
| 6-Person Households | 0 (0.0%) | 0 (0.0%) |
| 7+ Person Households | 0 (0.0%) | 0 (0.0%) |
| Total | 1,018 (46.5%) | 1,170 (53.5%) |
Female Fertility in Flora
Fertility by Age in Flora
| Age Bracket | Women with Births | Births / 1,000 Women |
| 15 to 19 years | 0 (0.0%) | 0.0 |
| 20 to 34 years | 0 (0.0%) | 0.0 |
| 35 to 50 years | 0 (0.0%) | 0.0 |
| Total | 0 (0.0%) | 0.0 |
Fertility by Age by Marriage Status in Flora
| Age Bracket | Married | Unmarried |
| 15 to 19 years | 0 (0.0%) | 0 (0.0%) |
| 20 to 34 years | 0 (0.0%) | 0 (0.0%) |
| 35 to 50 years | 0 (0.0%) | 0 (0.0%) |
| Total | 0 (0.0%) | 0 (0.0%) |
Fertility by Education in Flora
| Educational Attainment | Women with Births | Births / 1,000 Women |
| Less than High School | 0 (0.0%) | 0.0 |
| High School Diploma | 0 (0.0%) | 0.0 |
| College or Associate's Degree | 0 (0.0%) | 0.0 |
| Bachelor's Degree | 0 (0.0%) | 0.0 |
| Graduate Degree | 0 (0.0%) | 0.0 |
| Total | 0 (0.0%) | 0.0 |
Fertility by Education by Marriage Status in Flora
| Educational Attainment | Married | Unmarried |
| Less than High School | 0 (0.0%) | 0 (0.0%) |
| High School Diploma | 0 (0.0%) | 0 (0.0%) |
| College or Associate's Degree | 0 (0.0%) | 0 (0.0%) |
| Bachelor's Degree | 0 (0.0%) | 0 (0.0%) |
| Graduate Degree | 0 (0.0%) | 0 (0.0%) |
| Total | 0 (0.0%) | 0 (0.0%) |
Income in Flora
Income Overview in Flora
Per Capita Income in Flora is $29,968, while median incomes of families and households are $65,036 and $50,407 respectively.
| Characteristic | Number | Measure |
| Per Capita Income | 4,701 | $29,968 |
| Median Family Income | 1,018 | $65,036 |
| Mean Family Income | 1,018 | $79,178 |
| Median Household Income | 2,188 | $50,407 |
| Mean Household Income | 2,188 | $62,159 |
| Income Deficit | 1,018 | $0 |
| Wage / Income Gap (%) | 4,701 | 37.62% |
| Wage / Income Gap ($) | 4,701 | 62.38¢ per $1 |
| Gini / Inequality Index | 4,701 | 0.41 |
Earnings by Sex in Flora
Average Earnings in Flora are $35,779, $47,065 for men and $29,357 for women, a difference of 37.6%.
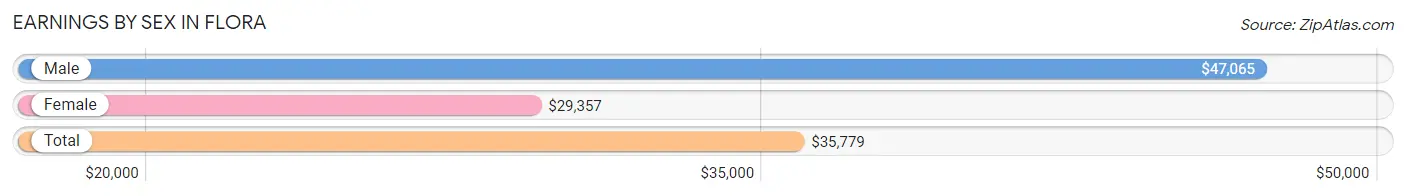
| Sex | Number | Average Earnings |
| Male | 1,000 (47.2%) | $47,065 |
| Female | 1,117 (52.8%) | $29,357 |
| Total | 2,117 (100.0%) | $35,779 |
Earnings by Sex by Income Bracket in Flora
The most common earnings brackets in Flora are $25,000 to $29,999 for men (162 | 16.2%) and $25,000 to $29,999 for women (194 | 17.4%).
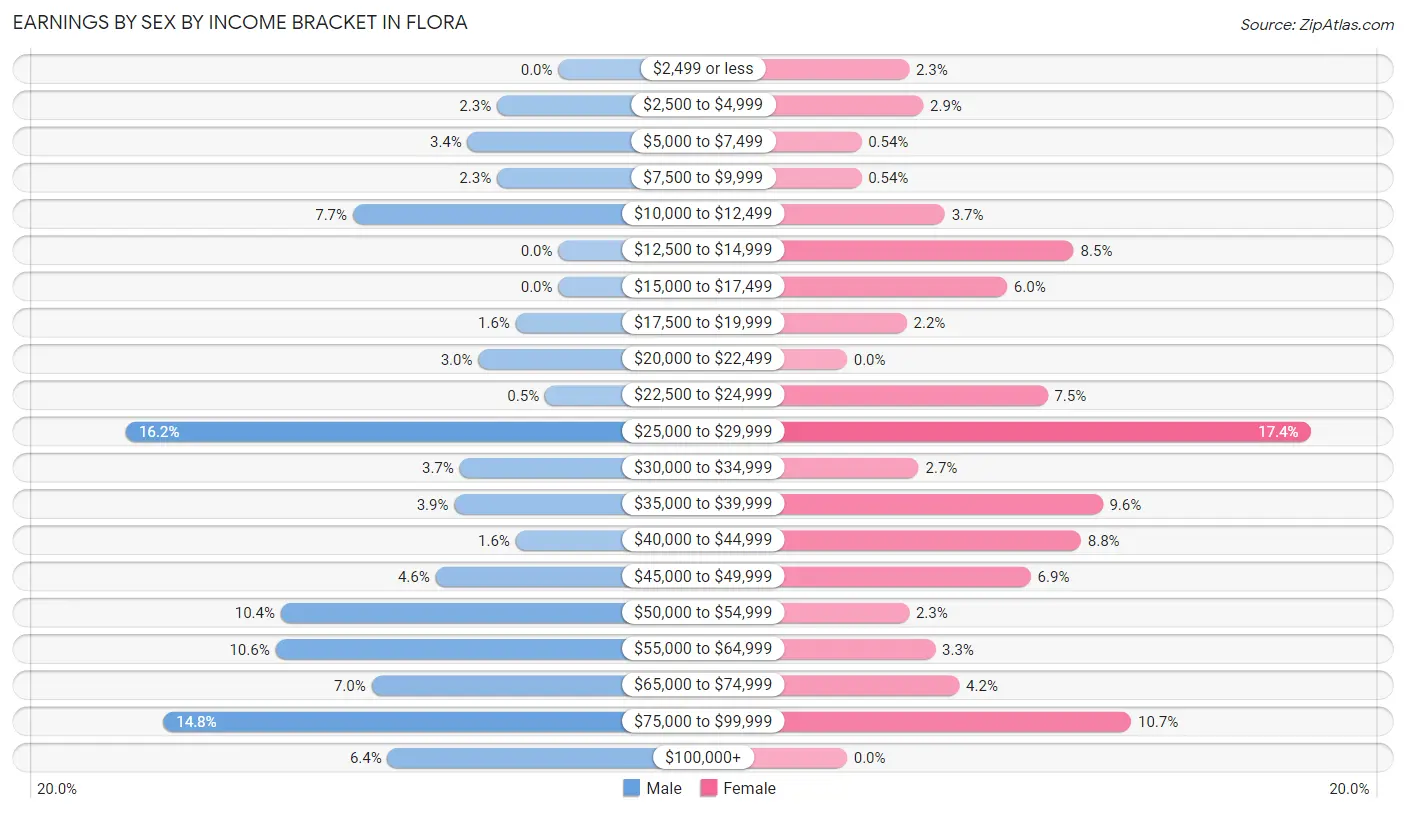
| Income | Male | Female |
| $2,499 or less | 0 (0.0%) | 26 (2.3%) |
| $2,500 to $4,999 | 23 (2.3%) | 32 (2.9%) |
| $5,000 to $7,499 | 34 (3.4%) | 6 (0.5%) |
| $7,500 to $9,999 | 23 (2.3%) | 6 (0.5%) |
| $10,000 to $12,499 | 77 (7.7%) | 41 (3.7%) |
| $12,500 to $14,999 | 0 (0.0%) | 95 (8.5%) |
| $15,000 to $17,499 | 0 (0.0%) | 67 (6.0%) |
| $17,500 to $19,999 | 16 (1.6%) | 25 (2.2%) |
| $20,000 to $22,499 | 30 (3.0%) | 0 (0.0%) |
| $22,500 to $24,999 | 5 (0.5%) | 84 (7.5%) |
| $25,000 to $29,999 | 162 (16.2%) | 194 (17.4%) |
| $30,000 to $34,999 | 37 (3.7%) | 30 (2.7%) |
| $35,000 to $39,999 | 39 (3.9%) | 107 (9.6%) |
| $40,000 to $44,999 | 16 (1.6%) | 98 (8.8%) |
| $45,000 to $49,999 | 46 (4.6%) | 77 (6.9%) |
| $50,000 to $54,999 | 104 (10.4%) | 26 (2.3%) |
| $55,000 to $64,999 | 106 (10.6%) | 37 (3.3%) |
| $65,000 to $74,999 | 70 (7.0%) | 47 (4.2%) |
| $75,000 to $99,999 | 148 (14.8%) | 119 (10.6%) |
| $100,000+ | 64 (6.4%) | 0 (0.0%) |
| Total | 1,000 (100.0%) | 1,117 (100.0%) |
Earnings by Sex by Educational Attainment in Flora
Average earnings in Flora are $50,243 for men and $33,047 for women, a difference of 34.2%. Men with an educational attainment of graduate degree enjoy the highest average annual earnings of $81,602, while those with bachelor's degree education earn the least with $26,178. Women with an educational attainment of graduate degree earn the most with the average annual earnings of $70,769, while those with high school diploma education have the smallest earnings of $27,536.
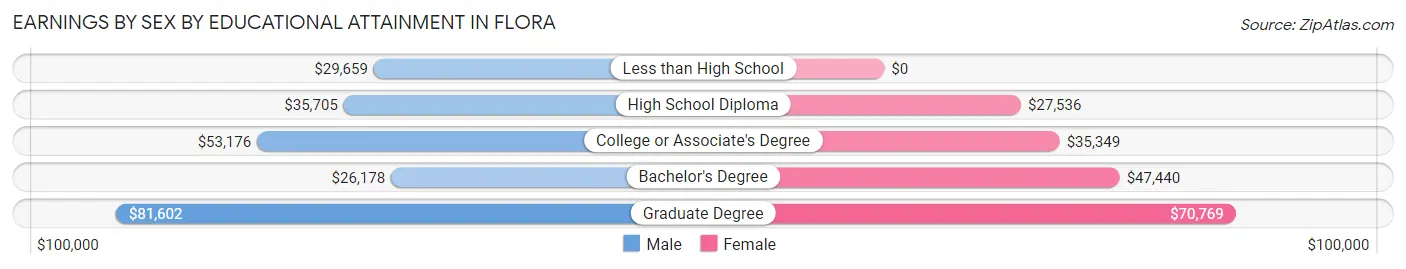
| Educational Attainment | Male Income | Female Income |
| Less than High School | $29,659 | $0 |
| High School Diploma | $35,705 | $27,536 |
| College or Associate's Degree | $53,176 | $35,349 |
| Bachelor's Degree | $26,178 | $47,440 |
| Graduate Degree | $81,602 | $70,769 |
| Total | $50,243 | $33,047 |
Family Income in Flora
Family Income Brackets in Flora
According to the Flora family income data, there are 226 families falling into the $50,000 to $74,999 income range, which is the most common income bracket and makes up 22.2% of all families.
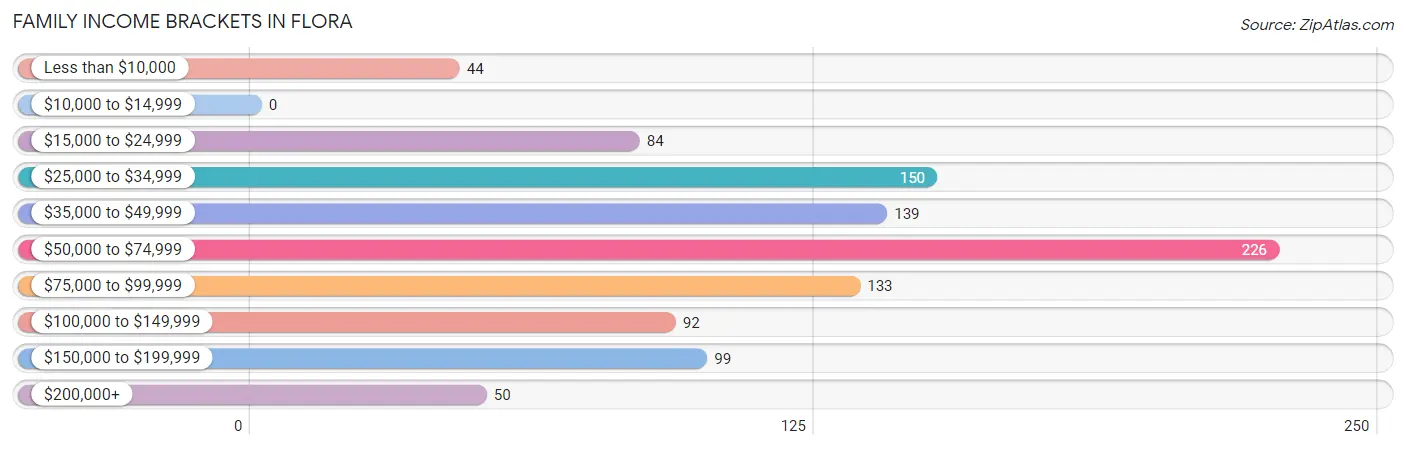
| Income Bracket | # Families | % Families |
| Less than $10,000 | 44 | 4.3% |
| $10,000 to $14,999 | 0 | 0.0% |
| $15,000 to $24,999 | 84 | 8.3% |
| $25,000 to $34,999 | 150 | 14.7% |
| $35,000 to $49,999 | 139 | 13.7% |
| $50,000 to $74,999 | 226 | 22.2% |
| $75,000 to $99,999 | 133 | 13.1% |
| $100,000 to $149,999 | 92 | 9.0% |
| $150,000 to $199,999 | 99 | 9.7% |
| $200,000+ | 50 | 4.9% |
Family Income by Famaliy Size in Flora
4-person families (145 | 14.2%) account for the highest median family income in Flora with $155,215 per family, while 4-person families (145 | 14.2%) have the highest median income of $38,804 per family member.
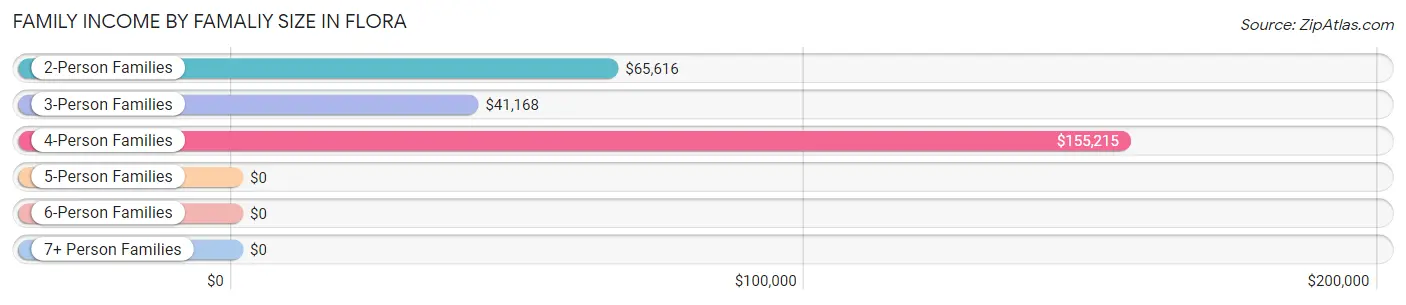
| Income Bracket | # Families | Median Income |
| 2-Person Families | 616 (60.5%) | $65,616 |
| 3-Person Families | 207 (20.3%) | $41,168 |
| 4-Person Families | 145 (14.2%) | $155,215 |
| 5-Person Families | 50 (4.9%) | $0 |
| 6-Person Families | 0 (0.0%) | $0 |
| 7+ Person Families | 0 (0.0%) | $0 |
| Total | 1,018 (100.0%) | $65,036 |
Family Income by Number of Earners in Flora
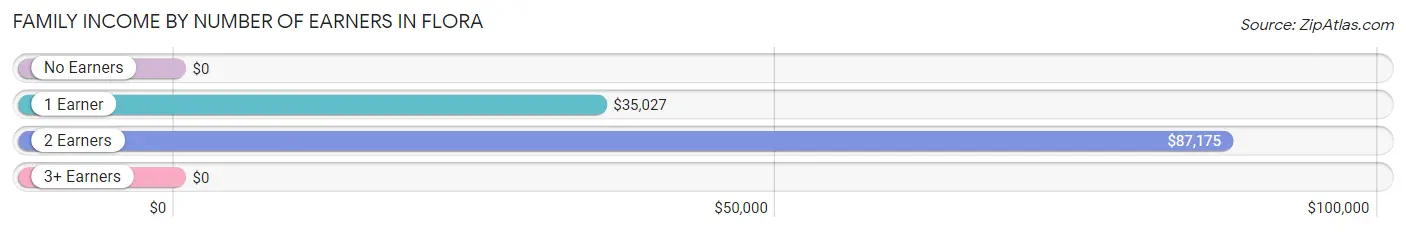
| Number of Earners | # Families | Median Income |
| No Earners | 264 (25.9%) | $0 |
| 1 Earner | 333 (32.7%) | $35,027 |
| 2 Earners | 373 (36.6%) | $87,175 |
| 3+ Earners | 48 (4.7%) | $0 |
| Total | 1,018 (100.0%) | $65,036 |
Household Income in Flora
Household Income Brackets in Flora
With 514 households falling in the category, the $50,000 to $74,999 income range is the most frequent in Flora, accounting for 23.5% of all households. In contrast, only 33 households (1.5%) fall into the less than $10,000 income bracket, making it the least populous group.
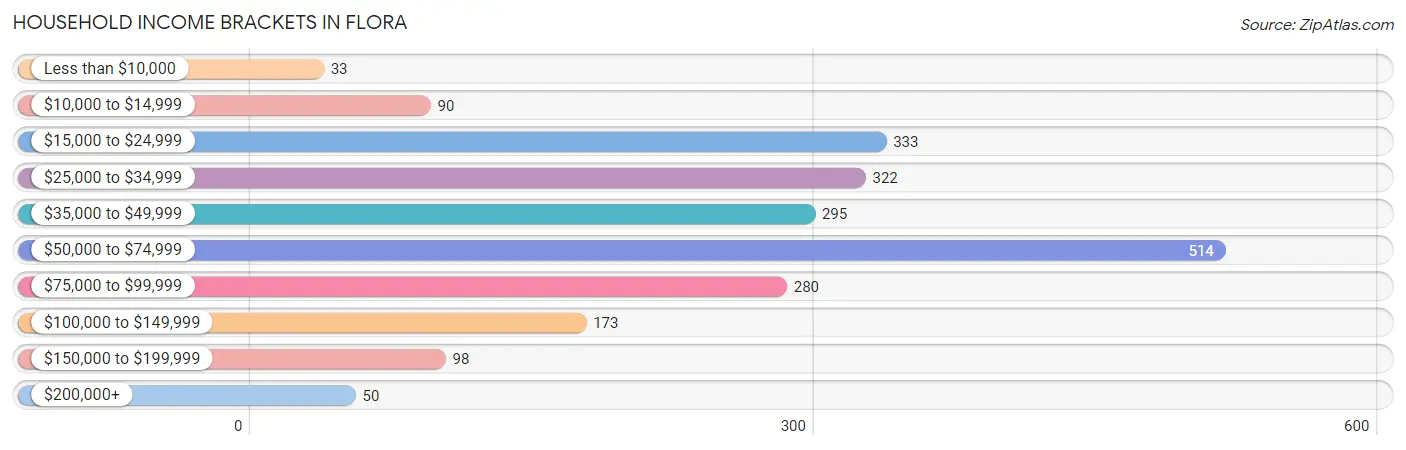
| Income Bracket | # Households | % Households |
| Less than $10,000 | 33 | 1.5% |
| $10,000 to $14,999 | 90 | 4.1% |
| $15,000 to $24,999 | 333 | 15.2% |
| $25,000 to $34,999 | 322 | 14.7% |
| $35,000 to $49,999 | 295 | 13.5% |
| $50,000 to $74,999 | 514 | 23.5% |
| $75,000 to $99,999 | 280 | 12.8% |
| $100,000 to $149,999 | 173 | 7.9% |
| $150,000 to $199,999 | 98 | 4.5% |
| $200,000+ | 50 | 2.3% |
Household Income by Householder Age in Flora
The median household income in Flora is $50,407, with the highest median household income of $90,341 found in the 15 to 24 years age bracket for the primary householder. A total of 97 households (4.4%) fall into this category. Meanwhile, the 65+ years age bracket for the primary householder has the lowest median household income of $36,544, with 838 households (38.3%) in this group.
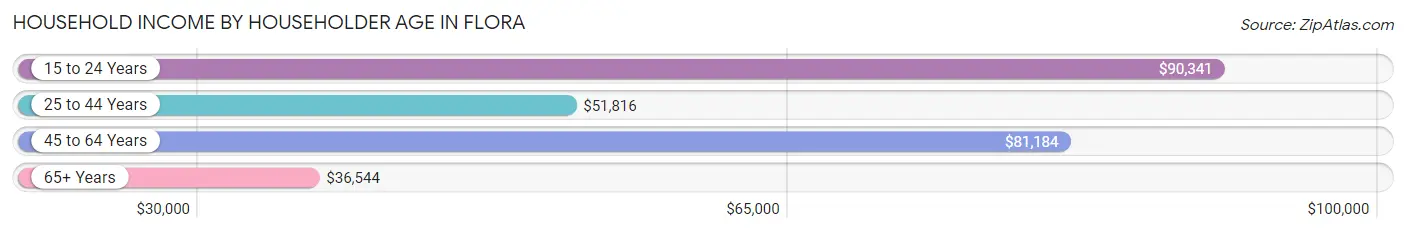
| Income Bracket | # Households | Median Income |
| 15 to 24 Years | 97 (4.4%) | $90,341 |
| 25 to 44 Years | 707 (32.3%) | $51,816 |
| 45 to 64 Years | 546 (24.9%) | $81,184 |
| 65+ Years | 838 (38.3%) | $36,544 |
| Total | 2,188 (100.0%) | $50,407 |
Poverty in Flora
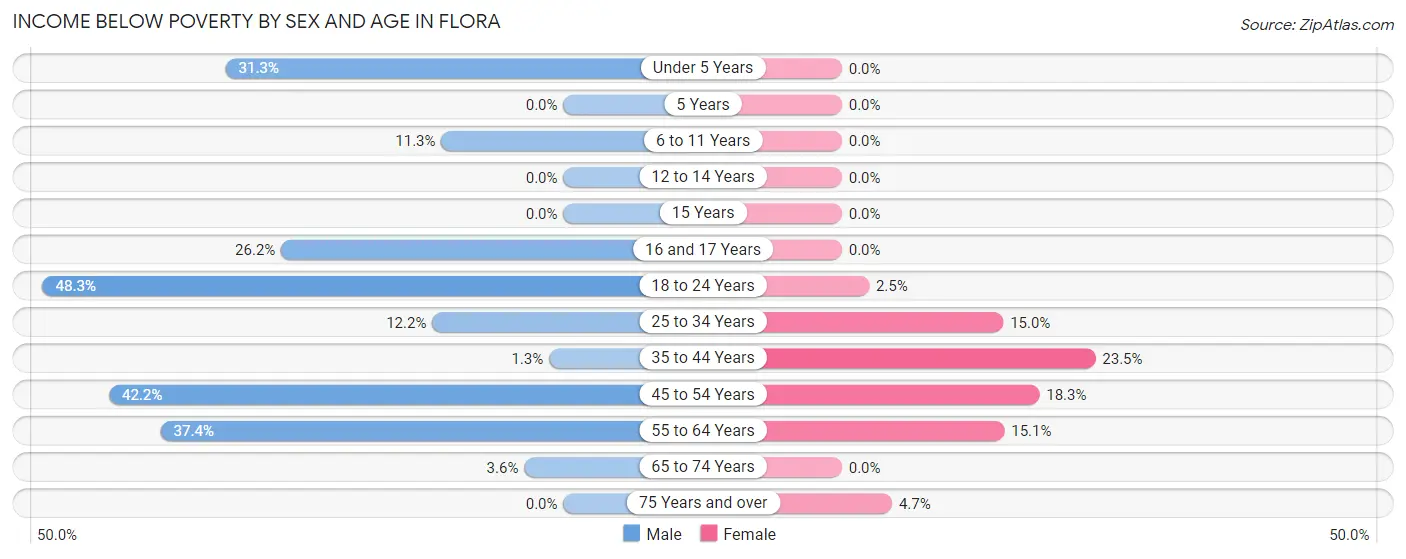
Income Below Poverty by Sex and Age in Flora
With 19.5% poverty level for males and 9.4% for females among the residents of Flora, 18 to 24 year old males and 35 to 44 year old females are the most vulnerable to poverty, with 72 males (48.3%) and 72 females (23.5%) in their respective age groups living below the poverty level.
| Age Bracket | Male | Female |
| Under 5 Years | 21 (31.3%) | 0 (0.0%) |
| 5 Years | 0 (0.0%) | 0 (0.0%) |
| 6 to 11 Years | 24 (11.3%) | 0 (0.0%) |
| 12 to 14 Years | 0 (0.0%) | 0 (0.0%) |
| 15 Years | 0 (0.0%) | 0 (0.0%) |
| 16 and 17 Years | 22 (26.2%) | 0 (0.0%) |
| 18 to 24 Years | 72 (48.3%) | 6 (2.5%) |
| 25 to 34 Years | 41 (12.2%) | 37 (15.0%) |
| 35 to 44 Years | 3 (1.3%) | 72 (23.5%) |
| 45 to 54 Years | 78 (42.2%) | 44 (18.3%) |
| 55 to 64 Years | 145 (37.4%) | 54 (15.1%) |
| 65 to 74 Years | 9 (3.6%) | 0 (0.0%) |
| 75 Years and over | 0 (0.0%) | 18 (4.7%) |
| Total | 415 (19.5%) | 231 (9.4%) |
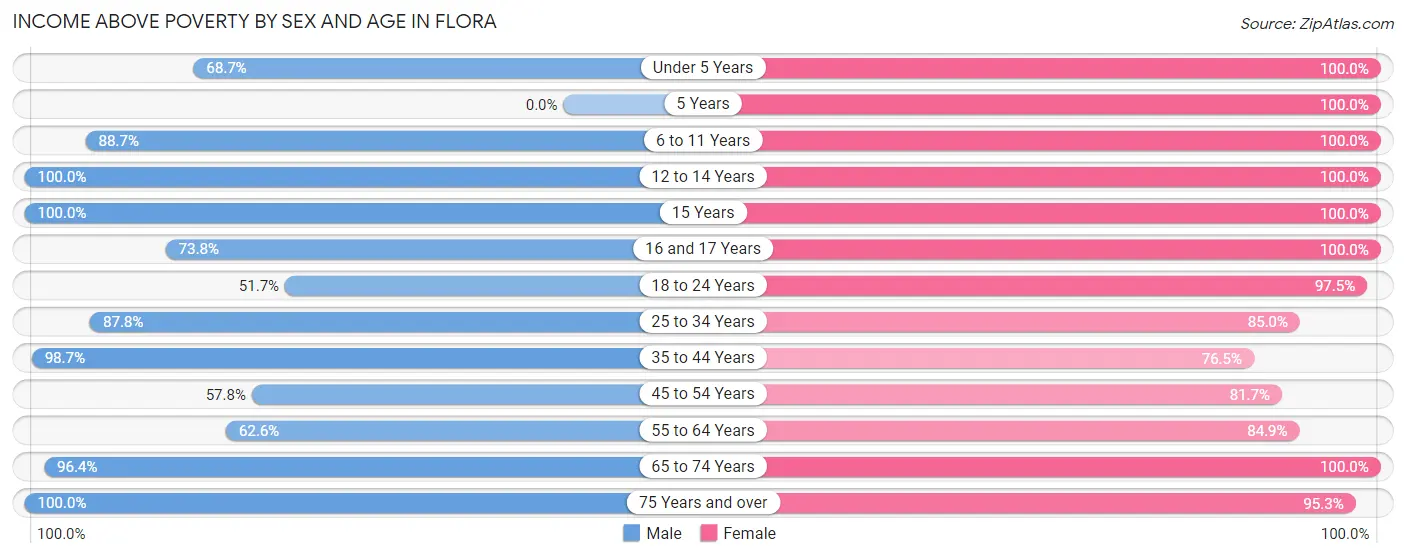
Income Above Poverty by Sex and Age in Flora
According to the poverty statistics in Flora, males aged 12 to 14 years and females aged under 5 years are the age groups that are most secure financially, with 100.0% of males and 100.0% of females in these age groups living above the poverty line.
| Age Bracket | Male | Female |
| Under 5 Years | 46 (68.7%) | 28 (100.0%) |
| 5 Years | 0 (0.0%) | 27 (100.0%) |
| 6 to 11 Years | 188 (88.7%) | 162 (100.0%) |
| 12 to 14 Years | 44 (100.0%) | 163 (100.0%) |
| 15 Years | 14 (100.0%) | 19 (100.0%) |
| 16 and 17 Years | 62 (73.8%) | 46 (100.0%) |
| 18 to 24 Years | 77 (51.7%) | 232 (97.5%) |
| 25 to 34 Years | 296 (87.8%) | 210 (85.0%) |
| 35 to 44 Years | 223 (98.7%) | 234 (76.5%) |
| 45 to 54 Years | 107 (57.8%) | 196 (81.7%) |
| 55 to 64 Years | 243 (62.6%) | 304 (84.9%) |
| 65 to 74 Years | 239 (96.4%) | 229 (100.0%) |
| 75 Years and over | 170 (100.0%) | 368 (95.3%) |
| Total | 1,709 (80.5%) | 2,218 (90.6%) |
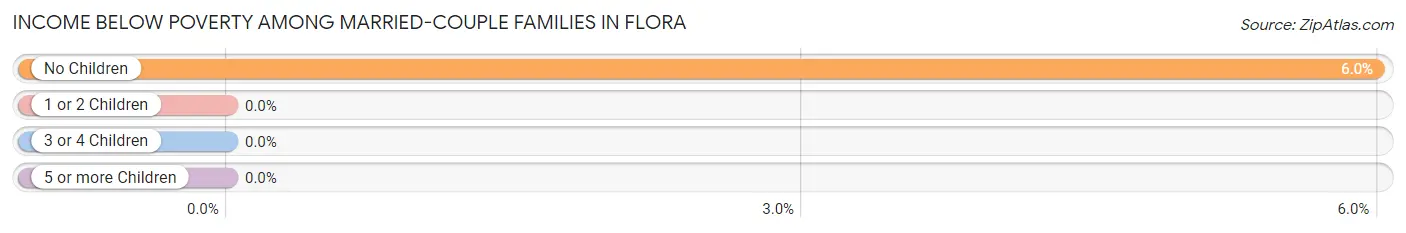
Income Below Poverty Among Married-Couple Families in Flora
The poverty statistics for married-couple families in Flora show that 4.6% or 33 of the total 724 families live below the poverty line. Families with no children have the highest poverty rate of 6.0%, comprising of 33 families. On the other hand, families with 1 or 2 children have the lowest poverty rate of 0.0%, which includes 0 families.
| Children | Above Poverty | Below Poverty |
| No Children | 518 (94.0%) | 33 (6.0%) |
| 1 or 2 Children | 123 (100.0%) | 0 (0.0%) |
| 3 or 4 Children | 50 (100.0%) | 0 (0.0%) |
| 5 or more Children | 0 (0.0%) | 0 (0.0%) |
| Total | 691 (95.4%) | 33 (4.6%) |
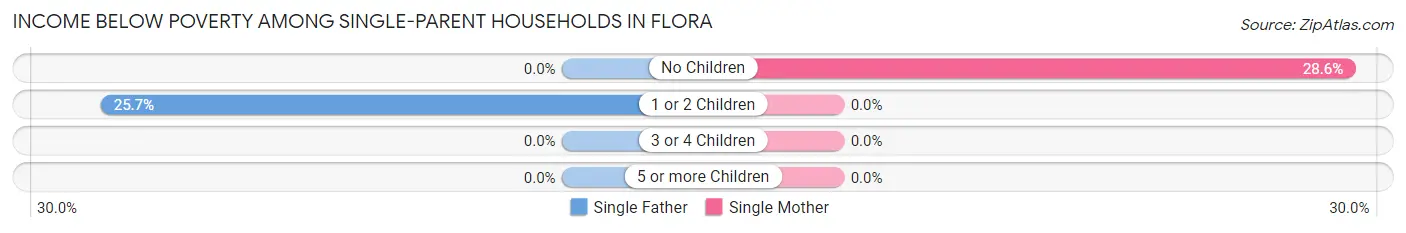
Income Below Poverty Among Single-Parent Households in Flora
According to the poverty data in Flora, 25.7% or 35 single-father households and 5.1% or 8 single-mother households are living below the poverty line. Among single-father households, those with 1 or 2 children have the highest poverty rate, with 35 households (25.7%) experiencing poverty. Likewise, among single-mother households, those with no children have the highest poverty rate, with 8 households (28.6%) falling below the poverty line.
| Children | Single Father | Single Mother |
| No Children | 0 (0.0%) | 8 (28.6%) |
| 1 or 2 Children | 35 (25.7%) | 0 (0.0%) |
| 3 or 4 Children | 0 (0.0%) | 0 (0.0%) |
| 5 or more Children | 0 (0.0%) | 0 (0.0%) |
| Total | 35 (25.7%) | 8 (5.1%) |
Income Below Poverty Among Married-Couple vs Single-Parent Households in Flora
The poverty data for Flora shows that 33 of the married-couple family households (4.6%) and 43 of the single-parent households (14.6%) are living below the poverty level. Within the married-couple family households, those with no children have the highest poverty rate, with 33 households (6.0%) falling below the poverty line. Among the single-parent households, those with no children have the highest poverty rate, with 8 household (28.6%) living below poverty.
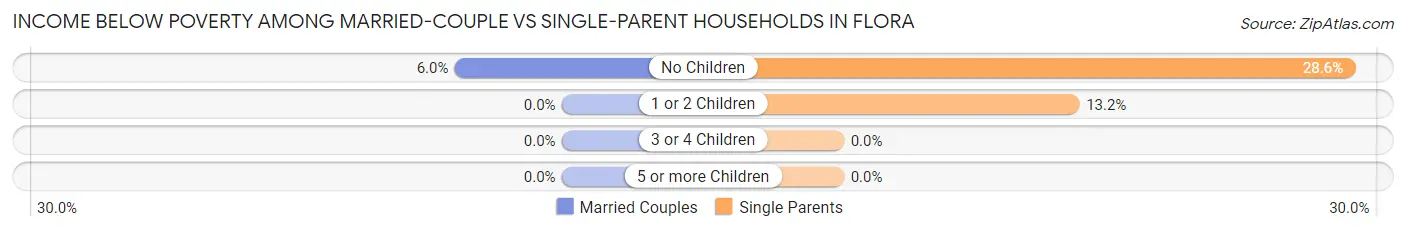
| Children | Married-Couple Families | Single-Parent Households |
| No Children | 33 (6.0%) | 8 (28.6%) |
| 1 or 2 Children | 0 (0.0%) | 35 (13.2%) |
| 3 or 4 Children | 0 (0.0%) | 0 (0.0%) |
| 5 or more Children | 0 (0.0%) | 0 (0.0%) |
| Total | 33 (4.6%) | 43 (14.6%) |
Employment Characteristics in Flora
Employment by Class of Employer in Flora
Among the 1,924 employed individuals in Flora, private company employees (1,468 | 76.3%), not-for-profit organizations (127 | 6.6%), and local government employees (124 | 6.4%) make up the most common classes of employment.
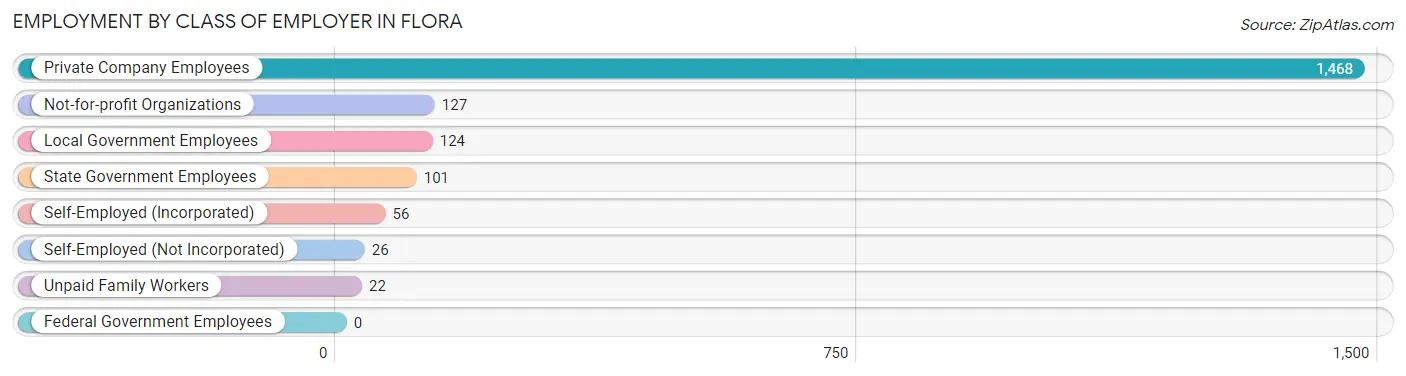
| Employer Class | # Employees | % Employees |
| Private Company Employees | 1,468 | 76.3% |
| Self-Employed (Incorporated) | 56 | 2.9% |
| Self-Employed (Not Incorporated) | 26 | 1.3% |
| Not-for-profit Organizations | 127 | 6.6% |
| Local Government Employees | 124 | 6.4% |
| State Government Employees | 101 | 5.2% |
| Federal Government Employees | 0 | 0.0% |
| Unpaid Family Workers | 22 | 1.1% |
| Total | 1,924 | 100.0% |
Employment Status by Age in Flora
According to the labor force statistics for Flora, out of the total population over 16 years of age (3,965), 53.2% or 2,109 individuals are in the labor force, with 6.8% or 143 of them unemployed. The age group with the highest labor force participation rate is 30 to 34 years, with 94.5% or 324 individuals in the labor force. Within the labor force, the 25 to 29 years age range has the highest percentage of unemployed individuals, with 25.2% or 54 of them being unemployed.
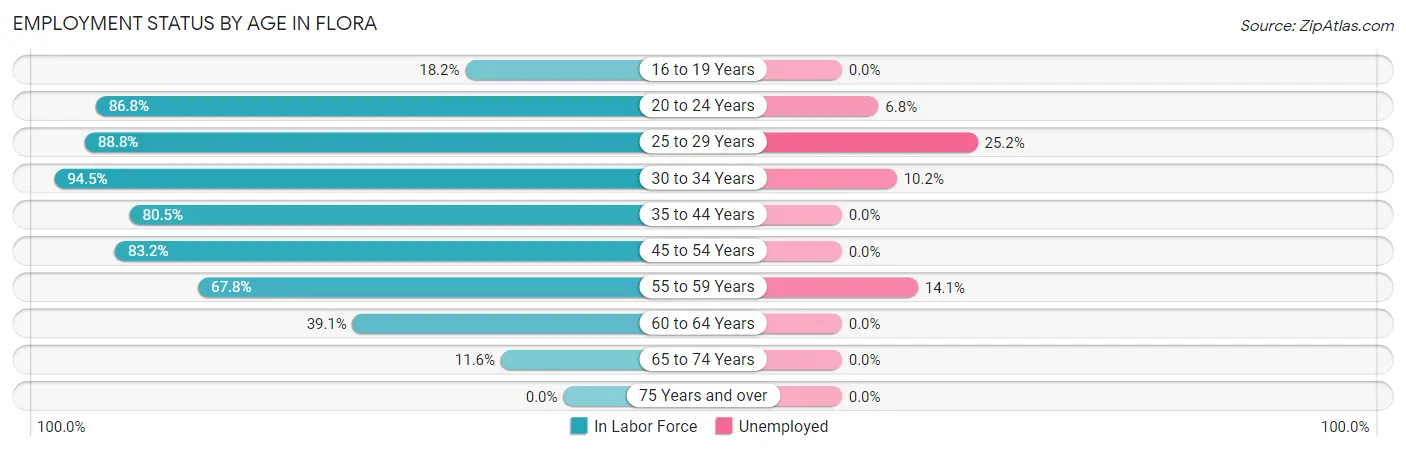
| Age Bracket | In Labor Force | Unemployed |
| 16 to 19 Years | 40 (18.2%) | 0 (0.0%) |
| 20 to 24 Years | 263 (86.8%) | 18 (6.8%) |
| 25 to 29 Years | 214 (88.8%) | 54 (25.2%) |
| 30 to 34 Years | 324 (94.5%) | 33 (10.2%) |
| 35 to 44 Years | 428 (80.5%) | 0 (0.0%) |
| 45 to 54 Years | 361 (83.2%) | 0 (0.0%) |
| 55 to 59 Years | 276 (67.8%) | 39 (14.1%) |
| 60 to 64 Years | 143 (39.1%) | 0 (0.0%) |
| 65 to 74 Years | 62 (11.6%) | 0 (0.0%) |
| 75 Years and over | 0 (0.0%) | 0 (0.0%) |
| Total | 2,109 (53.2%) | 143 (6.8%) |
Employment Status by Educational Attainment in Flora
According to labor force statistics for Flora, 75.2% of individuals (1,747) out of the total population between 25 and 64 years of age (2,323) are in the labor force, with 7.2% or 126 of them being unemployed. The group with the highest labor force participation rate are those with the educational attainment of bachelor's degree or higher, with 93.9% or 399 individuals in the labor force. Within the labor force, individuals with high school diploma education have the highest percentage of unemployment, with 9.4% or 52 of them being unemployed.
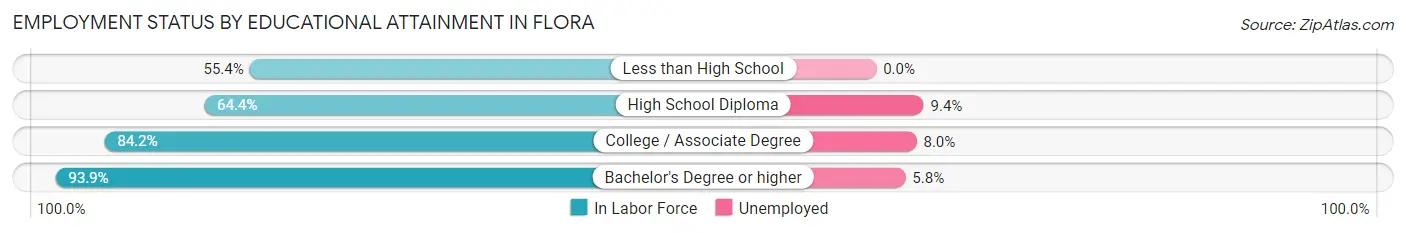
| Educational Attainment | In Labor Force | Unemployed |
| Less than High School | 155 (55.4%) | 0 (0.0%) |
| High School Diploma | 553 (64.4%) | 81 (9.4%) |
| College / Associate Degree | 639 (84.2%) | 61 (8.0%) |
| Bachelor's Degree or higher | 399 (93.9%) | 25 (5.8%) |
| Total | 1,747 (75.2%) | 167 (7.2%) |
Employment Occupations by Sex in Flora
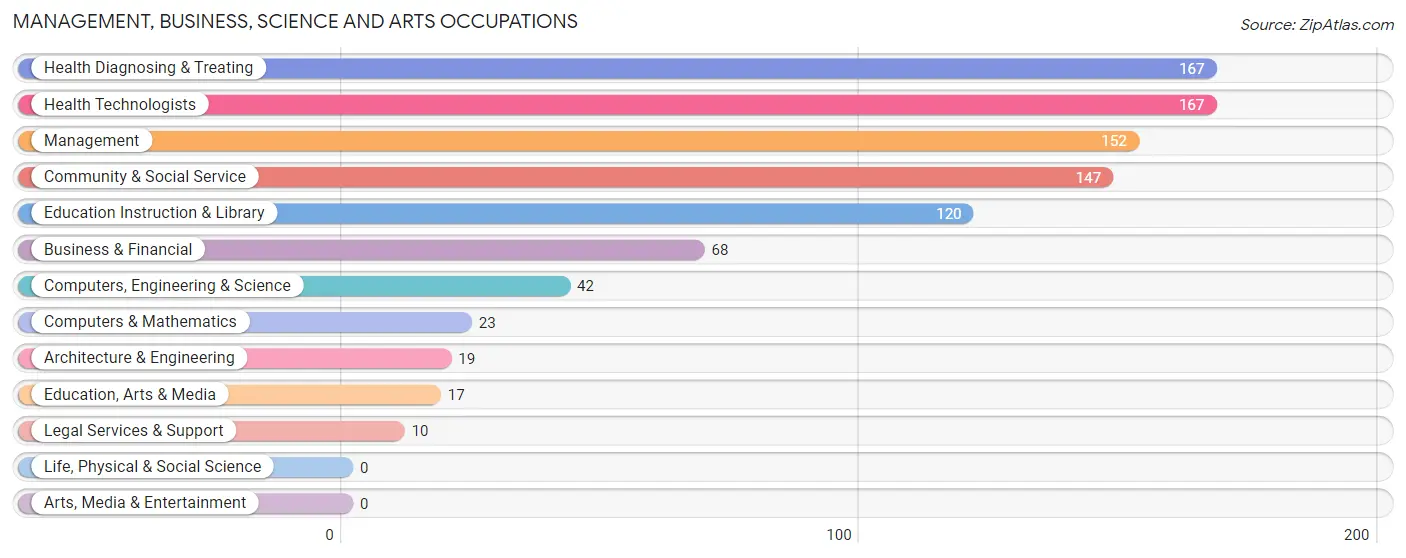
Management, Business, Science and Arts Occupations
The most common Management, Business, Science and Arts occupations in Flora are Health Diagnosing & Treating (167 | 8.5%), Health Technologists (167 | 8.5%), Management (152 | 7.7%), Community & Social Service (147 | 7.5%), and Education Instruction & Library (120 | 6.1%).
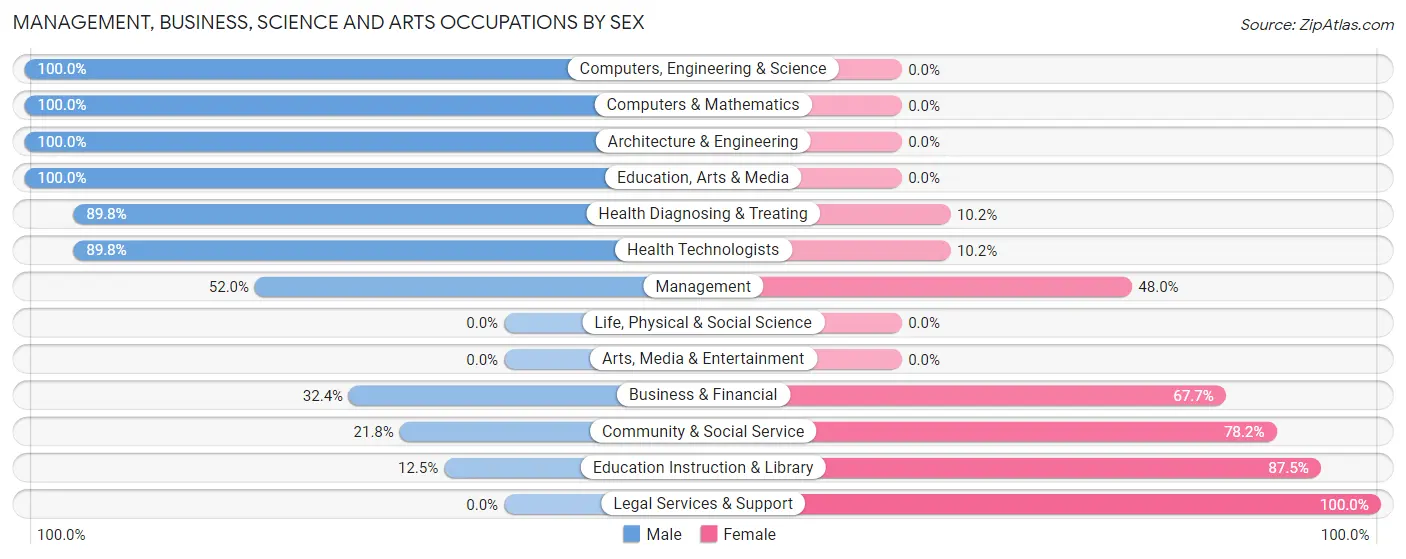
Management, Business, Science and Arts Occupations by Sex
Within the Management, Business, Science and Arts occupations in Flora, the most male-oriented occupations are Computers, Engineering & Science (100.0%), Computers & Mathematics (100.0%), and Architecture & Engineering (100.0%), while the most female-oriented occupations are Legal Services & Support (100.0%), Education Instruction & Library (87.5%), and Community & Social Service (78.2%).
| Occupation | Male | Female |
| Management | 79 (52.0%) | 73 (48.0%) |
| Business & Financial | 22 (32.4%) | 46 (67.6%) |
| Computers, Engineering & Science | 42 (100.0%) | 0 (0.0%) |
| Computers & Mathematics | 23 (100.0%) | 0 (0.0%) |
| Architecture & Engineering | 19 (100.0%) | 0 (0.0%) |
| Life, Physical & Social Science | 0 (0.0%) | 0 (0.0%) |
| Community & Social Service | 32 (21.8%) | 115 (78.2%) |
| Education, Arts & Media | 17 (100.0%) | 0 (0.0%) |
| Legal Services & Support | 0 (0.0%) | 10 (100.0%) |
| Education Instruction & Library | 15 (12.5%) | 105 (87.5%) |
| Arts, Media & Entertainment | 0 (0.0%) | 0 (0.0%) |
| Health Diagnosing & Treating | 150 (89.8%) | 17 (10.2%) |
| Health Technologists | 150 (89.8%) | 17 (10.2%) |
| Total (Category) | 325 (56.4%) | 251 (43.6%) |
| Total (Overall) | 949 (48.2%) | 1,018 (51.7%) |
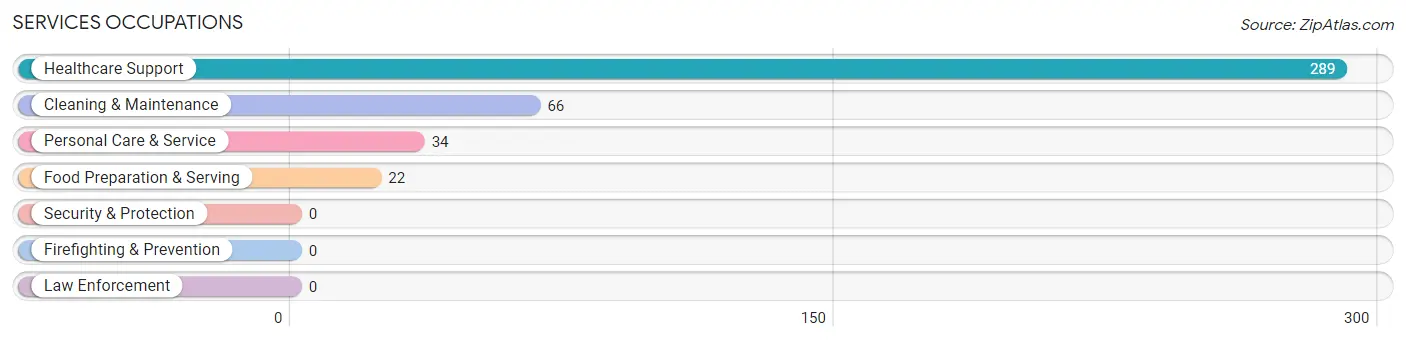
Services Occupations
The most common Services occupations in Flora are Healthcare Support (289 | 14.7%), Cleaning & Maintenance (66 | 3.4%), Personal Care & Service (34 | 1.7%), and Food Preparation & Serving (22 | 1.1%).
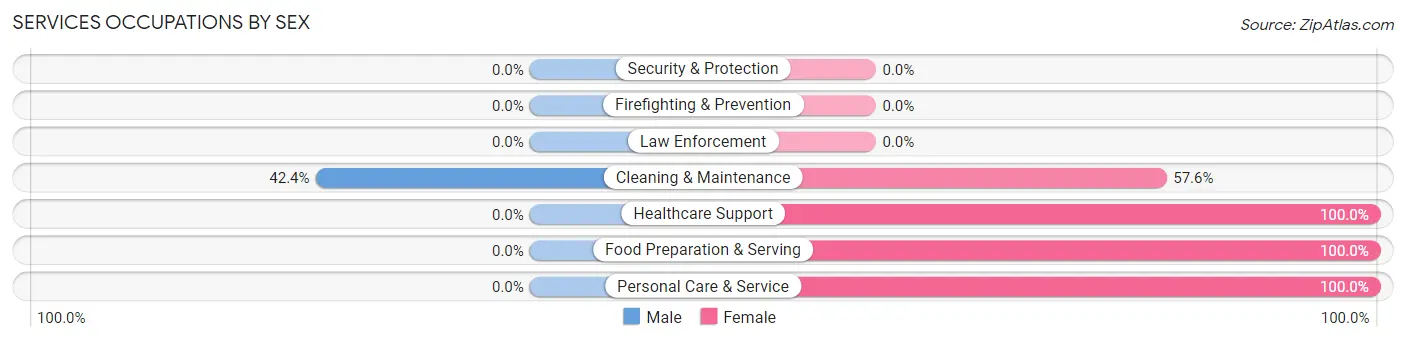
Services Occupations by Sex
| Occupation | Male | Female |
| Healthcare Support | 0 (0.0%) | 289 (100.0%) |
| Security & Protection | 0 (0.0%) | 0 (0.0%) |
| Firefighting & Prevention | 0 (0.0%) | 0 (0.0%) |
| Law Enforcement | 0 (0.0%) | 0 (0.0%) |
| Food Preparation & Serving | 0 (0.0%) | 22 (100.0%) |
| Cleaning & Maintenance | 28 (42.4%) | 38 (57.6%) |
| Personal Care & Service | 0 (0.0%) | 34 (100.0%) |
| Total (Category) | 28 (6.8%) | 383 (93.2%) |
| Total (Overall) | 949 (48.2%) | 1,018 (51.7%) |
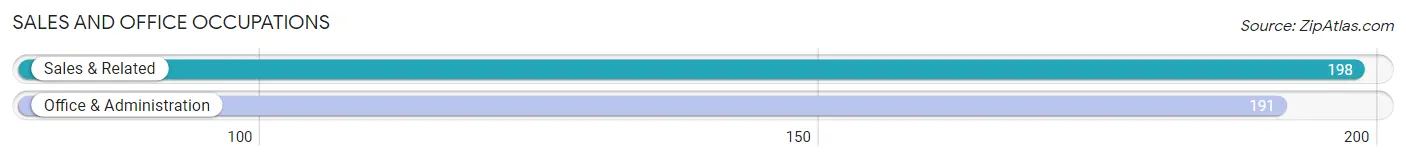
Sales and Office Occupations
The most common Sales and Office occupations in Flora are Sales & Related (198 | 10.1%), and Office & Administration (191 | 9.7%).
Sales and Office Occupations by Sex
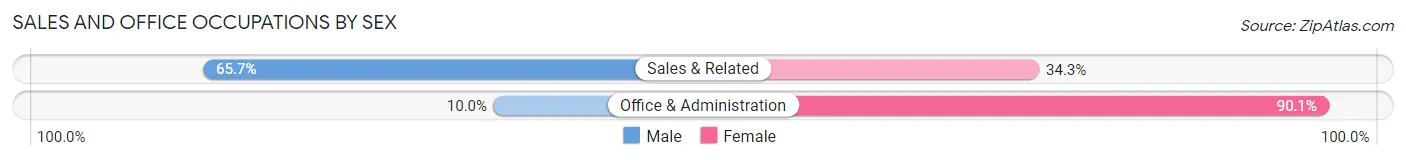
| Occupation | Male | Female |
| Sales & Related | 130 (65.7%) | 68 (34.3%) |
| Office & Administration | 19 (10.0%) | 172 (90.0%) |
| Total (Category) | 149 (38.3%) | 240 (61.7%) |
| Total (Overall) | 949 (48.2%) | 1,018 (51.7%) |
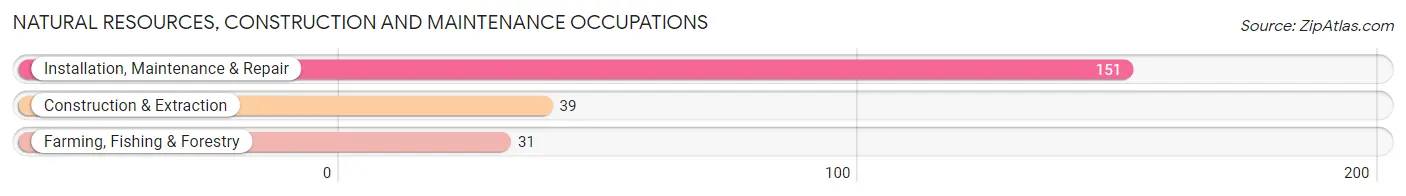
Natural Resources, Construction and Maintenance Occupations
The most common Natural Resources, Construction and Maintenance occupations in Flora are Installation, Maintenance & Repair (151 | 7.7%), Construction & Extraction (39 | 2.0%), and Farming, Fishing & Forestry (31 | 1.6%).
Natural Resources, Construction and Maintenance Occupations by Sex
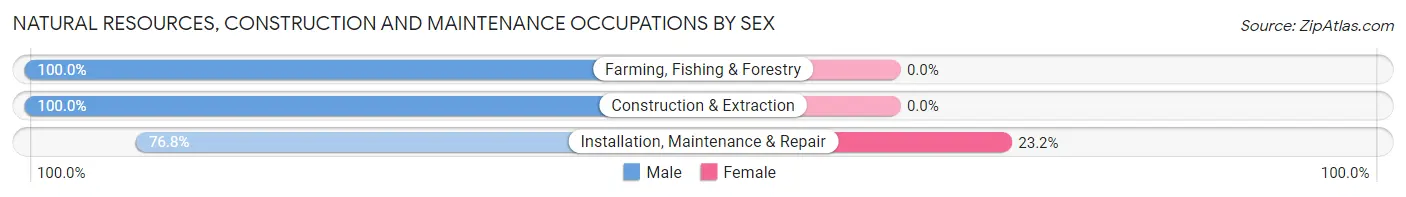
| Occupation | Male | Female |
| Farming, Fishing & Forestry | 31 (100.0%) | 0 (0.0%) |
| Construction & Extraction | 39 (100.0%) | 0 (0.0%) |
| Installation, Maintenance & Repair | 116 (76.8%) | 35 (23.2%) |
| Total (Category) | 186 (84.2%) | 35 (15.8%) |
| Total (Overall) | 949 (48.2%) | 1,018 (51.7%) |
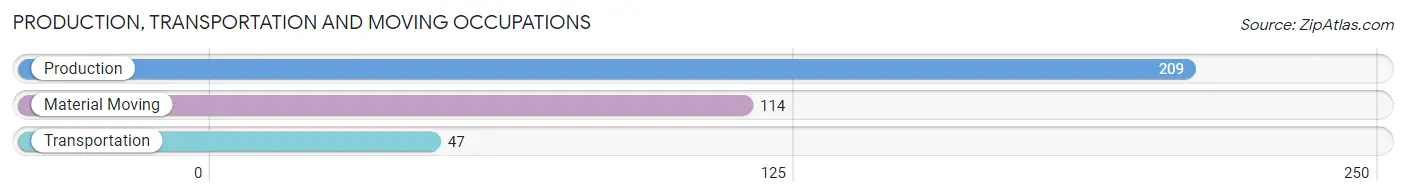
Production, Transportation and Moving Occupations
The most common Production, Transportation and Moving occupations in Flora are Production (209 | 10.6%), Material Moving (114 | 5.8%), and Transportation (47 | 2.4%).
Production, Transportation and Moving Occupations by Sex
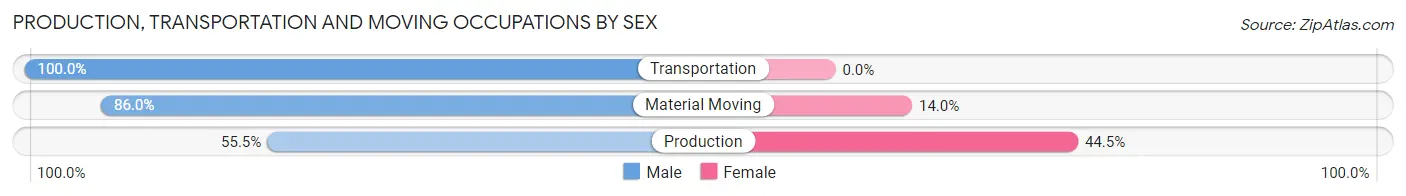
| Occupation | Male | Female |
| Production | 116 (55.5%) | 93 (44.5%) |
| Transportation | 47 (100.0%) | 0 (0.0%) |
| Material Moving | 98 (86.0%) | 16 (14.0%) |
| Total (Category) | 261 (70.5%) | 109 (29.5%) |
| Total (Overall) | 949 (48.2%) | 1,018 (51.7%) |
Employment Industries by Sex in Flora
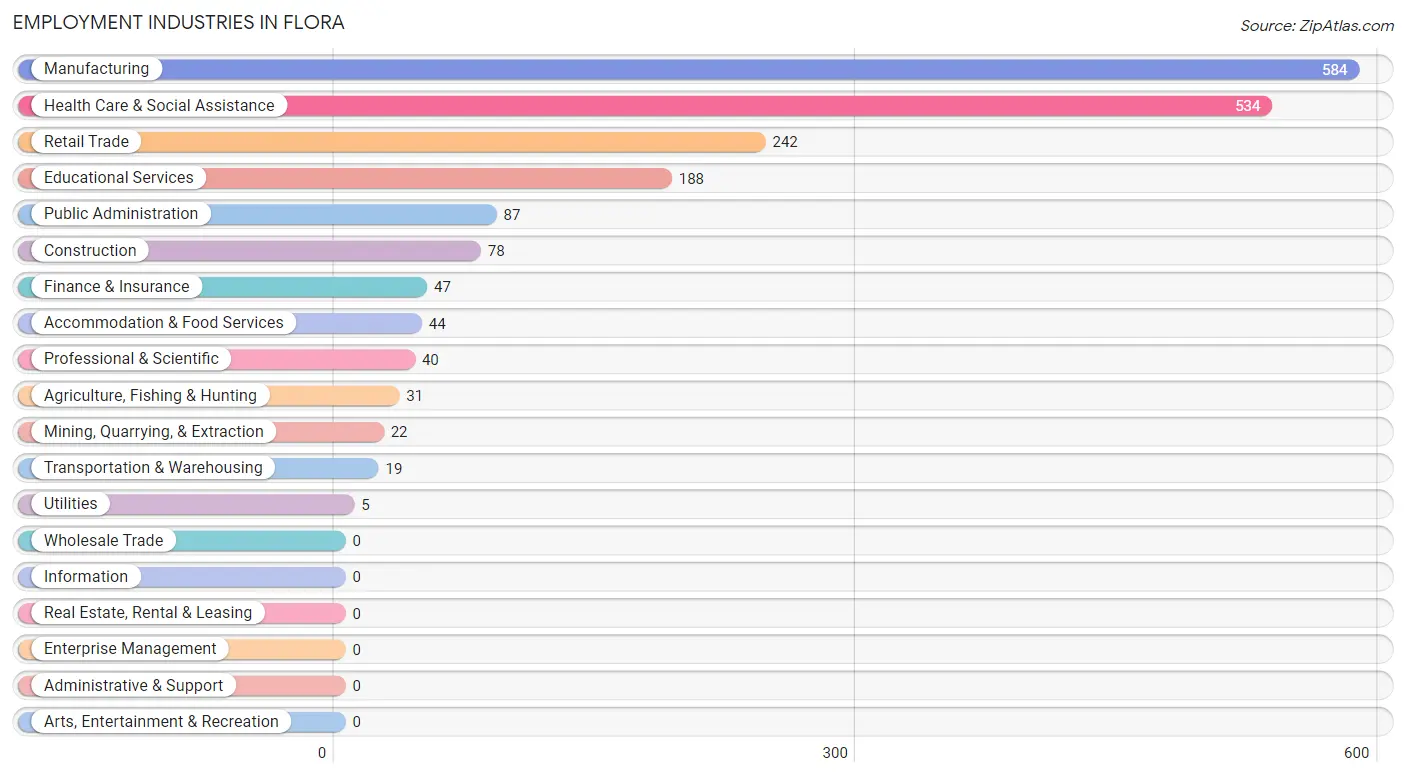
Employment Industries in Flora
The major employment industries in Flora include Manufacturing (584 | 29.7%), Health Care & Social Assistance (534 | 27.2%), Retail Trade (242 | 12.3%), Educational Services (188 | 9.6%), and Public Administration (87 | 4.4%).
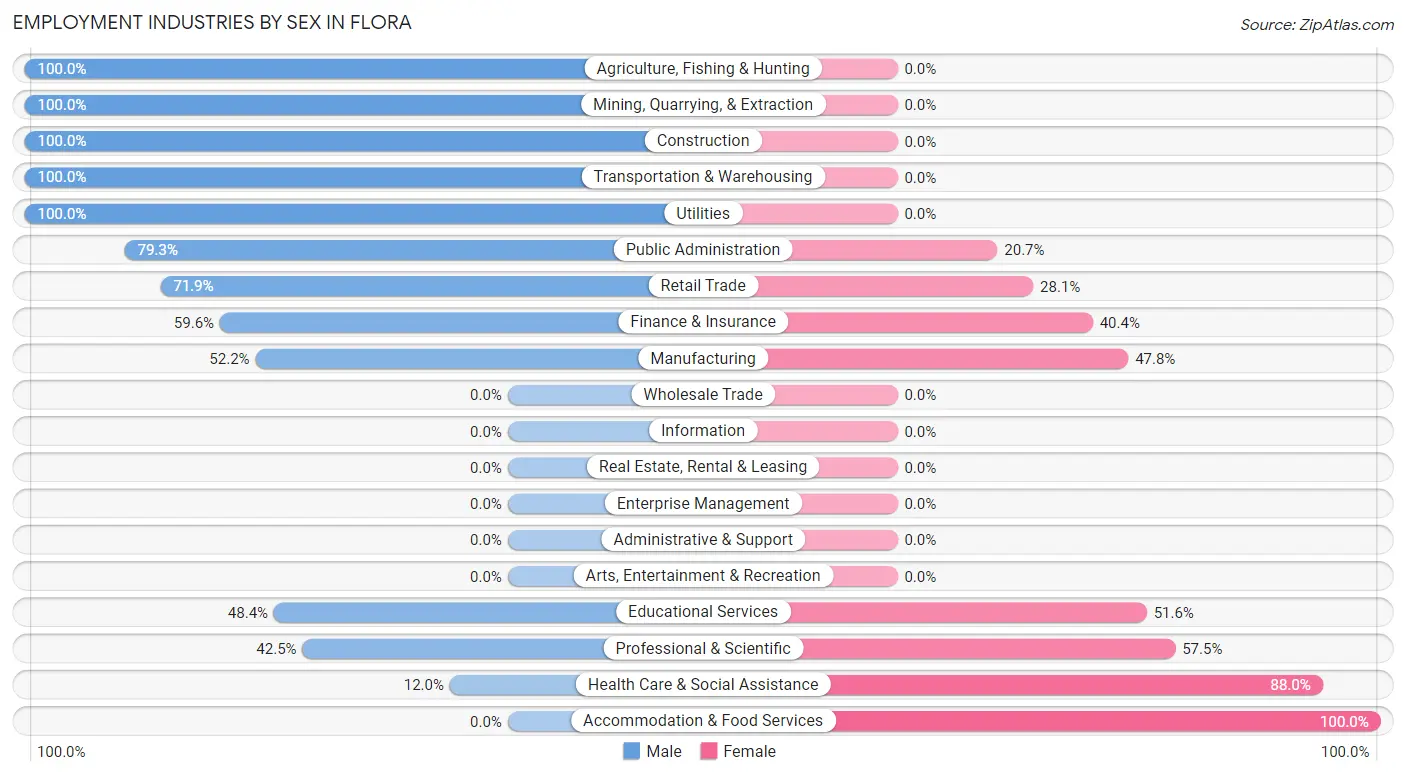
Employment Industries by Sex in Flora
The Flora industries that see more men than women are Agriculture, Fishing & Hunting (100.0%), Mining, Quarrying, & Extraction (100.0%), and Construction (100.0%), whereas the industries that tend to have a higher number of women are Accommodation & Food Services (100.0%), Health Care & Social Assistance (88.0%), and Professional & Scientific (57.5%).
| Industry | Male | Female |
| Agriculture, Fishing & Hunting | 31 (100.0%) | 0 (0.0%) |
| Mining, Quarrying, & Extraction | 22 (100.0%) | 0 (0.0%) |
| Construction | 78 (100.0%) | 0 (0.0%) |
| Manufacturing | 305 (52.2%) | 279 (47.8%) |
| Wholesale Trade | 0 (0.0%) | 0 (0.0%) |
| Retail Trade | 174 (71.9%) | 68 (28.1%) |
| Transportation & Warehousing | 19 (100.0%) | 0 (0.0%) |
| Utilities | 5 (100.0%) | 0 (0.0%) |
| Information | 0 (0.0%) | 0 (0.0%) |
| Finance & Insurance | 28 (59.6%) | 19 (40.4%) |
| Real Estate, Rental & Leasing | 0 (0.0%) | 0 (0.0%) |
| Professional & Scientific | 17 (42.5%) | 23 (57.5%) |
| Enterprise Management | 0 (0.0%) | 0 (0.0%) |
| Administrative & Support | 0 (0.0%) | 0 (0.0%) |
| Educational Services | 91 (48.4%) | 97 (51.6%) |
| Health Care & Social Assistance | 64 (12.0%) | 470 (88.0%) |
| Arts, Entertainment & Recreation | 0 (0.0%) | 0 (0.0%) |
| Accommodation & Food Services | 0 (0.0%) | 44 (100.0%) |
| Public Administration | 69 (79.3%) | 18 (20.7%) |
| Total | 949 (48.2%) | 1,018 (51.7%) |
Education in Flora
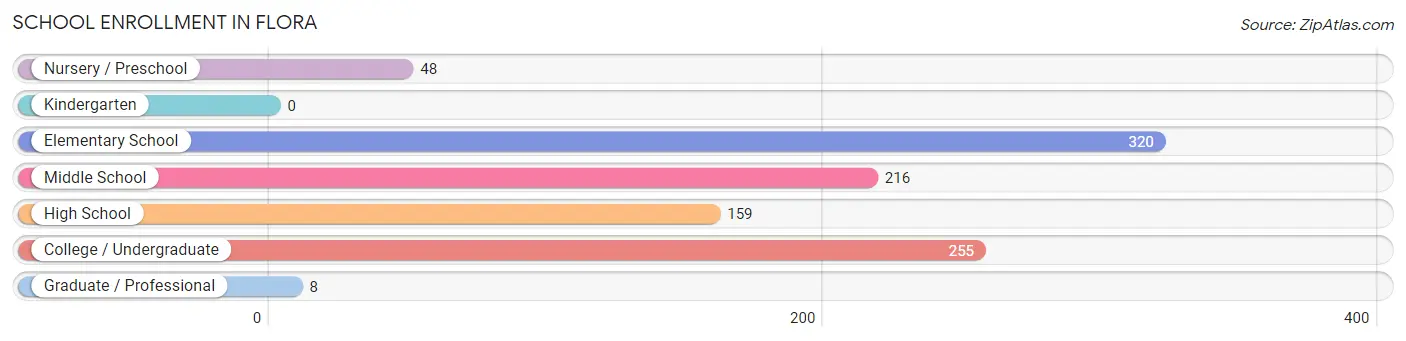
School Enrollment in Flora
The most common levels of schooling among the 1,006 students in Flora are elementary school (320 | 31.8%), college / undergraduate (255 | 25.4%), and middle school (216 | 21.5%).
| School Level | # Students | % Students |
| Nursery / Preschool | 48 | 4.8% |
| Kindergarten | 0 | 0.0% |
| Elementary School | 320 | 31.8% |
| Middle School | 216 | 21.5% |
| High School | 159 | 15.8% |
| College / Undergraduate | 255 | 25.4% |
| Graduate / Professional | 8 | 0.8% |
| Total | 1,006 | 100.0% |
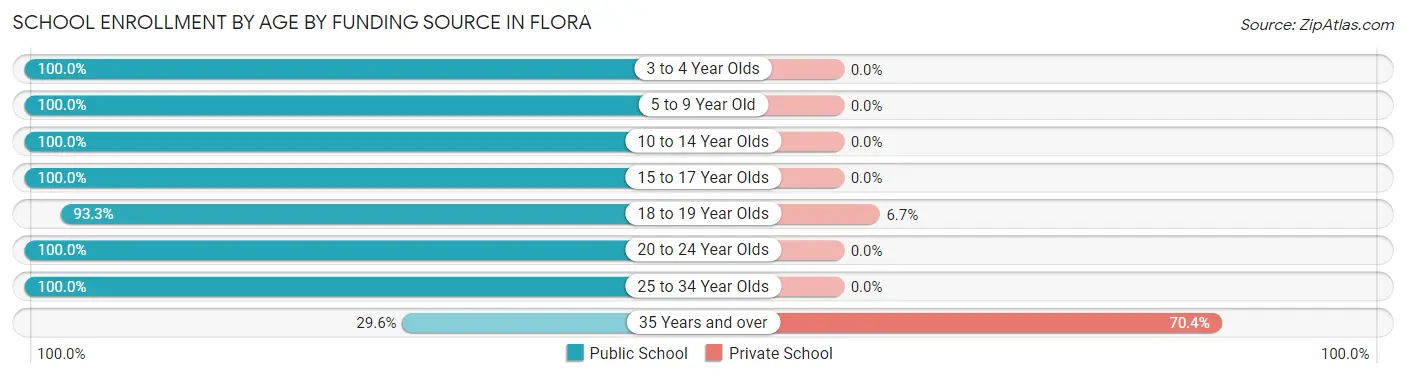
School Enrollment by Age by Funding Source in Flora
Out of a total of 1,006 students who are enrolled in schools in Flora, 25 (2.5%) attend a private institution, while the remaining 981 (97.5%) are enrolled in public schools. The age group of 35 years and over has the highest likelihood of being enrolled in private schools, with 19 (70.4% in the age bracket) enrolled. Conversely, the age group of 3 to 4 year olds has the lowest likelihood of being enrolled in a private school, with 21 (100.0% in the age bracket) attending a public institution.
| Age Bracket | Public School | Private School |
| 3 to 4 Year Olds | 21 (100.0%) | 0 (0.0%) |
| 5 to 9 Year Old | 347 (100.0%) | 0 (0.0%) |
| 10 to 14 Year Olds | 261 (100.0%) | 0 (0.0%) |
| 15 to 17 Year Olds | 95 (100.0%) | 0 (0.0%) |
| 18 to 19 Year Olds | 84 (93.3%) | 6 (6.7%) |
| 20 to 24 Year Olds | 113 (100.0%) | 0 (0.0%) |
| 25 to 34 Year Olds | 52 (100.0%) | 0 (0.0%) |
| 35 Years and over | 8 (29.6%) | 19 (70.4%) |
| Total | 981 (97.5%) | 25 (2.5%) |
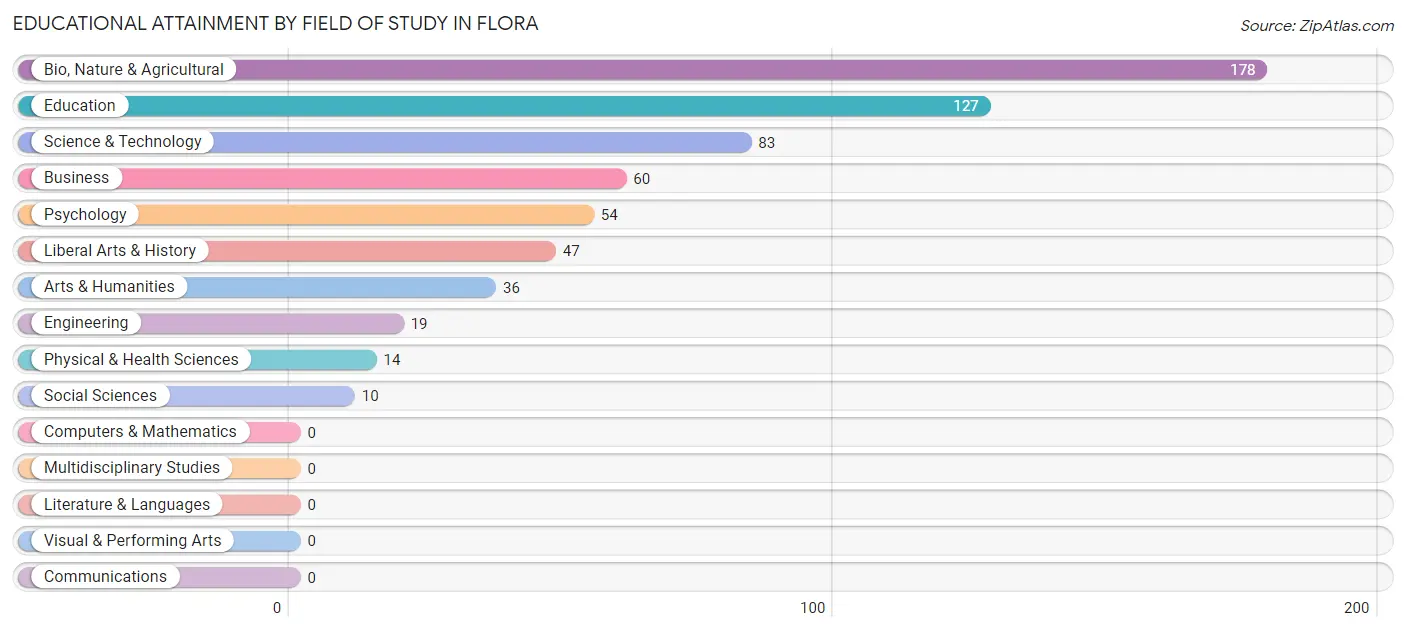
Educational Attainment by Field of Study in Flora
Bio, nature & agricultural (178 | 28.3%), education (127 | 20.2%), science & technology (83 | 13.2%), business (60 | 9.6%), and psychology (54 | 8.6%) are the most common fields of study among 628 individuals in Flora who have obtained a bachelor's degree or higher.
| Field of Study | # Graduates | % Graduates |
| Computers & Mathematics | 0 | 0.0% |
| Bio, Nature & Agricultural | 178 | 28.3% |
| Physical & Health Sciences | 14 | 2.2% |
| Psychology | 54 | 8.6% |
| Social Sciences | 10 | 1.6% |
| Engineering | 19 | 3.0% |
| Multidisciplinary Studies | 0 | 0.0% |
| Science & Technology | 83 | 13.2% |
| Business | 60 | 9.6% |
| Education | 127 | 20.2% |
| Literature & Languages | 0 | 0.0% |
| Liberal Arts & History | 47 | 7.5% |
| Visual & Performing Arts | 0 | 0.0% |
| Communications | 0 | 0.0% |
| Arts & Humanities | 36 | 5.7% |
| Total | 628 | 100.0% |
Transportation & Commute in Flora
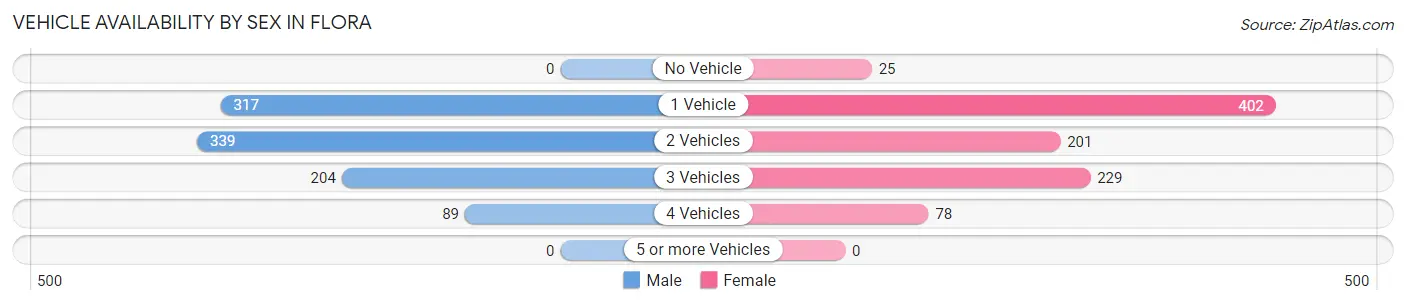
Vehicle Availability by Sex in Flora
The most prevalent vehicle ownership categories in Flora are males with 2 vehicles (339, accounting for 35.7%) and females with 2 vehicles (201, making up 36.3%).
| Vehicles Available | Male | Female |
| No Vehicle | 0 (0.0%) | 25 (2.7%) |
| 1 Vehicle | 317 (33.4%) | 402 (43.0%) |
| 2 Vehicles | 339 (35.7%) | 201 (21.5%) |
| 3 Vehicles | 204 (21.5%) | 229 (24.5%) |
| 4 Vehicles | 89 (9.4%) | 78 (8.3%) |
| 5 or more Vehicles | 0 (0.0%) | 0 (0.0%) |
| Total | 949 (100.0%) | 935 (100.0%) |
Commute Time in Flora
The most frequently occuring commute durations in Flora are 5 to 9 minutes (726 commuters, 39.9%), less than 5 minutes (288 commuters, 15.8%), and 10 to 14 minutes (237 commuters, 13.0%).
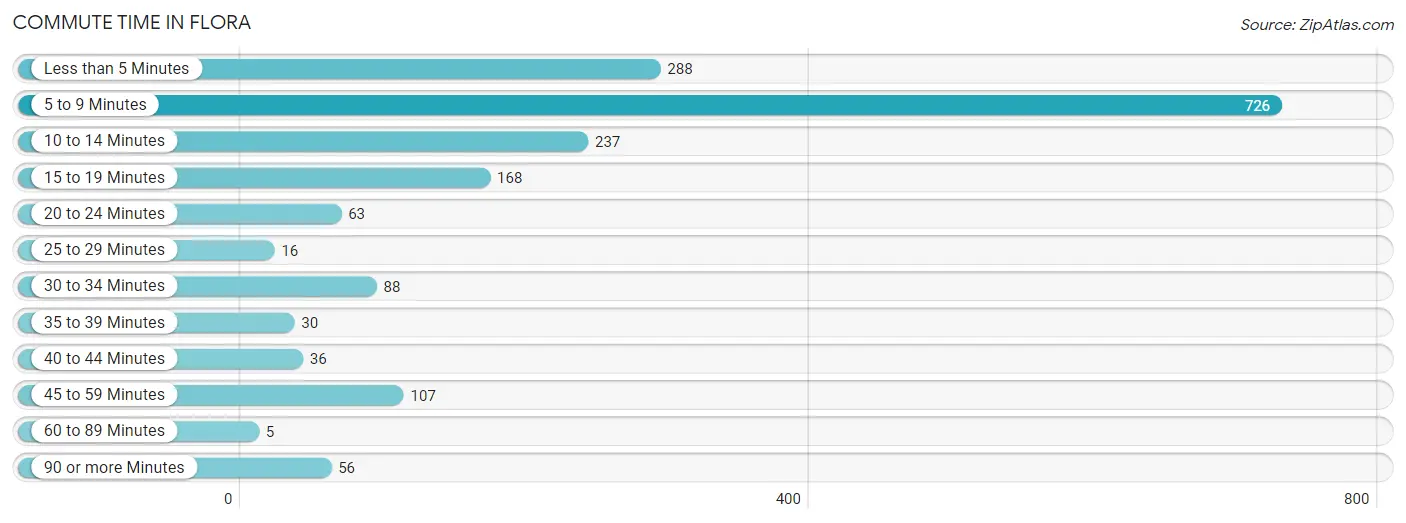
| Commute Time | # Commuters | % Commuters |
| Less than 5 Minutes | 288 | 15.8% |
| 5 to 9 Minutes | 726 | 39.9% |
| 10 to 14 Minutes | 237 | 13.0% |
| 15 to 19 Minutes | 168 | 9.2% |
| 20 to 24 Minutes | 63 | 3.5% |
| 25 to 29 Minutes | 16 | 0.9% |
| 30 to 34 Minutes | 88 | 4.8% |
| 35 to 39 Minutes | 30 | 1.7% |
| 40 to 44 Minutes | 36 | 2.0% |
| 45 to 59 Minutes | 107 | 5.9% |
| 60 to 89 Minutes | 5 | 0.3% |
| 90 or more Minutes | 56 | 3.1% |
Commute Time by Sex in Flora
The most common commute times in Flora are 5 to 9 minutes (358 commuters, 40.3%) for males and 5 to 9 minutes (368 commuters, 39.5%) for females.
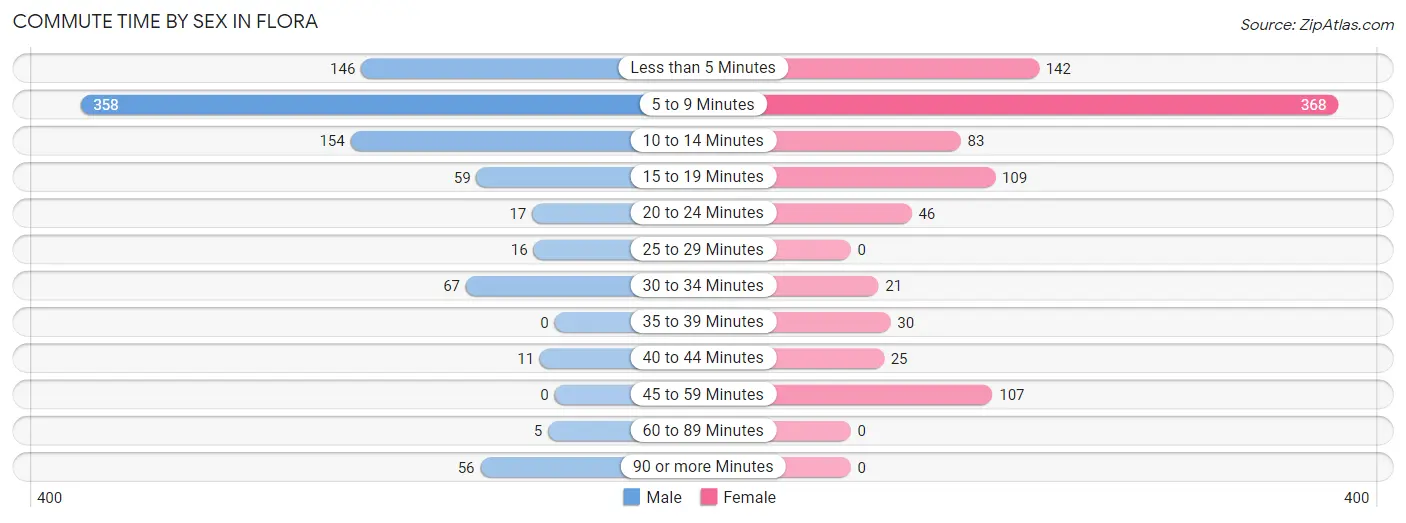
| Commute Time | Male | Female |
| Less than 5 Minutes | 146 (16.4%) | 142 (15.2%) |
| 5 to 9 Minutes | 358 (40.3%) | 368 (39.5%) |
| 10 to 14 Minutes | 154 (17.3%) | 83 (8.9%) |
| 15 to 19 Minutes | 59 (6.6%) | 109 (11.7%) |
| 20 to 24 Minutes | 17 (1.9%) | 46 (4.9%) |
| 25 to 29 Minutes | 16 (1.8%) | 0 (0.0%) |
| 30 to 34 Minutes | 67 (7.5%) | 21 (2.3%) |
| 35 to 39 Minutes | 0 (0.0%) | 30 (3.2%) |
| 40 to 44 Minutes | 11 (1.2%) | 25 (2.7%) |
| 45 to 59 Minutes | 0 (0.0%) | 107 (11.5%) |
| 60 to 89 Minutes | 5 (0.6%) | 0 (0.0%) |
| 90 or more Minutes | 56 (6.3%) | 0 (0.0%) |
Time of Departure to Work by Sex in Flora
The most frequent times of departure to work in Flora are 6:30 AM to 6:59 AM (183, 20.6%) for males and 7:30 AM to 7:59 AM (239, 25.7%) for females.
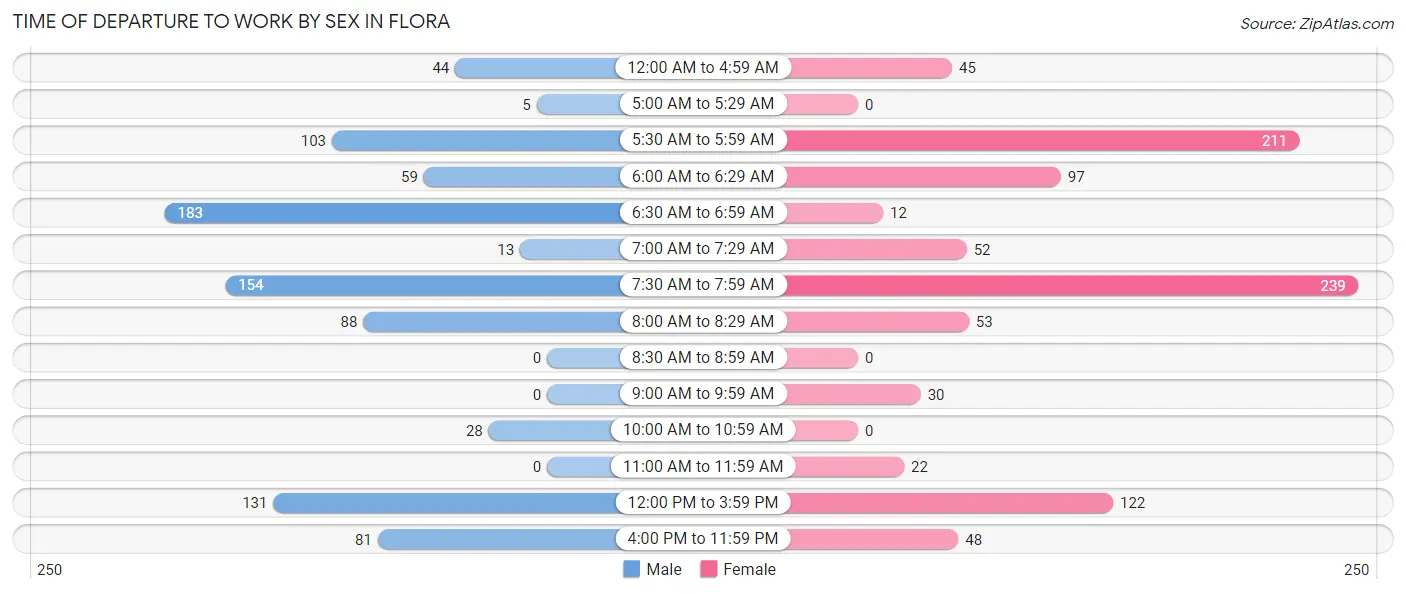
| Time of Departure | Male | Female |
| 12:00 AM to 4:59 AM | 44 (5.0%) | 45 (4.8%) |
| 5:00 AM to 5:29 AM | 5 (0.6%) | 0 (0.0%) |
| 5:30 AM to 5:59 AM | 103 (11.6%) | 211 (22.7%) |
| 6:00 AM to 6:29 AM | 59 (6.6%) | 97 (10.4%) |
| 6:30 AM to 6:59 AM | 183 (20.6%) | 12 (1.3%) |
| 7:00 AM to 7:29 AM | 13 (1.5%) | 52 (5.6%) |
| 7:30 AM to 7:59 AM | 154 (17.3%) | 239 (25.7%) |
| 8:00 AM to 8:29 AM | 88 (9.9%) | 53 (5.7%) |
| 8:30 AM to 8:59 AM | 0 (0.0%) | 0 (0.0%) |
| 9:00 AM to 9:59 AM | 0 (0.0%) | 30 (3.2%) |
| 10:00 AM to 10:59 AM | 28 (3.2%) | 0 (0.0%) |
| 11:00 AM to 11:59 AM | 0 (0.0%) | 22 (2.4%) |
| 12:00 PM to 3:59 PM | 131 (14.7%) | 122 (13.1%) |
| 4:00 PM to 11:59 PM | 81 (9.1%) | 48 (5.2%) |
| Total | 889 (100.0%) | 931 (100.0%) |
Housing Occupancy in Flora
Occupancy by Ownership in Flora
Of the total 2,188 dwellings in Flora, owner-occupied units account for 1,505 (68.8%), while renter-occupied units make up 683 (31.2%).
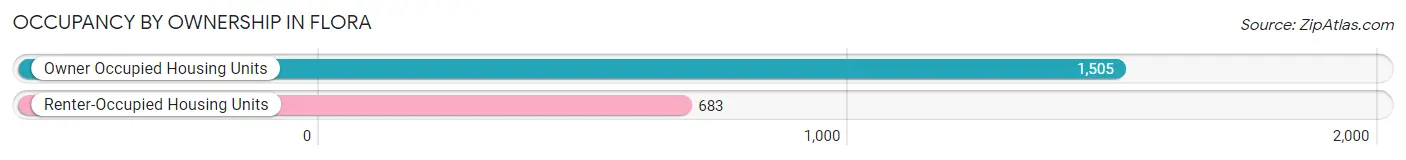
| Occupancy | # Housing Units | % Housing Units |
| Owner Occupied Housing Units | 1,505 | 68.8% |
| Renter-Occupied Housing Units | 683 | 31.2% |
| Total Occupied Housing Units | 2,188 | 100.0% |
Occupancy by Household Size in Flora
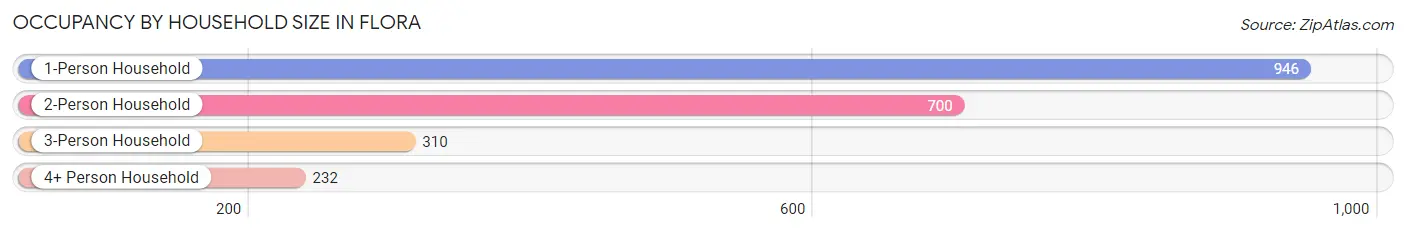
| Household Size | # Housing Units | % Housing Units |
| 1-Person Household | 946 | 43.2% |
| 2-Person Household | 700 | 32.0% |
| 3-Person Household | 310 | 14.2% |
| 4+ Person Household | 232 | 10.6% |
| Total Housing Units | 2,188 | 100.0% |
Occupancy by Ownership by Household Size in Flora
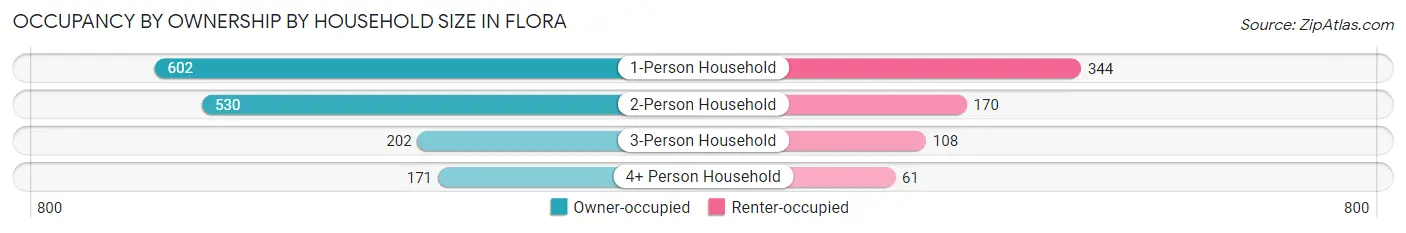
| Household Size | Owner-occupied | Renter-occupied |
| 1-Person Household | 602 (63.6%) | 344 (36.4%) |
| 2-Person Household | 530 (75.7%) | 170 (24.3%) |
| 3-Person Household | 202 (65.2%) | 108 (34.8%) |
| 4+ Person Household | 171 (73.7%) | 61 (26.3%) |
| Total Housing Units | 1,505 (68.8%) | 683 (31.2%) |
Occupancy by Educational Attainment in Flora
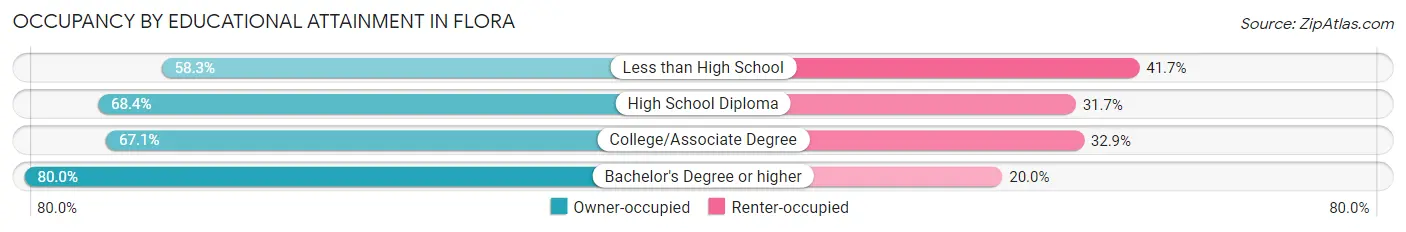
| Household Size | Owner-occupied | Renter-occupied |
| Less than High School | 134 (58.3%) | 96 (41.7%) |
| High School Diploma | 501 (68.3%) | 232 (31.7%) |
| College/Associate Degree | 570 (67.1%) | 280 (32.9%) |
| Bachelor's Degree or higher | 300 (80.0%) | 75 (20.0%) |
Occupancy by Age of Householder in Flora
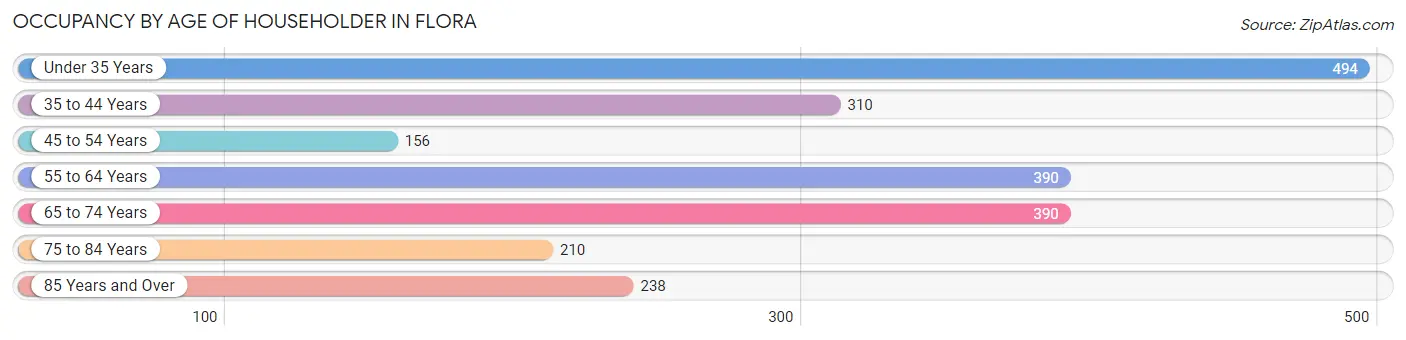
| Age Bracket | # Households | % Households |
| Under 35 Years | 494 | 22.6% |
| 35 to 44 Years | 310 | 14.2% |
| 45 to 54 Years | 156 | 7.1% |
| 55 to 64 Years | 390 | 17.8% |
| 65 to 74 Years | 390 | 17.8% |
| 75 to 84 Years | 210 | 9.6% |
| 85 Years and Over | 238 | 10.9% |
| Total | 2,188 | 100.0% |
Housing Finances in Flora
Median Income by Occupancy in Flora
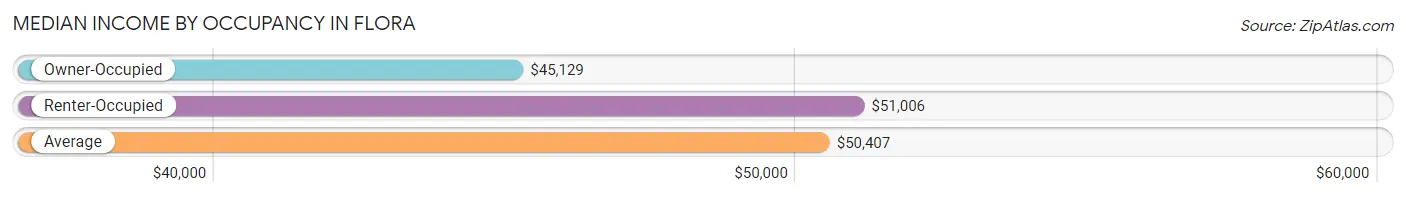
| Occupancy Type | # Households | Median Income |
| Owner-Occupied | 1,505 (68.8%) | $45,129 |
| Renter-Occupied | 683 (31.2%) | $51,006 |
| Average | 2,188 (100.0%) | $50,407 |
Occupancy by Householder Income Bracket in Flora
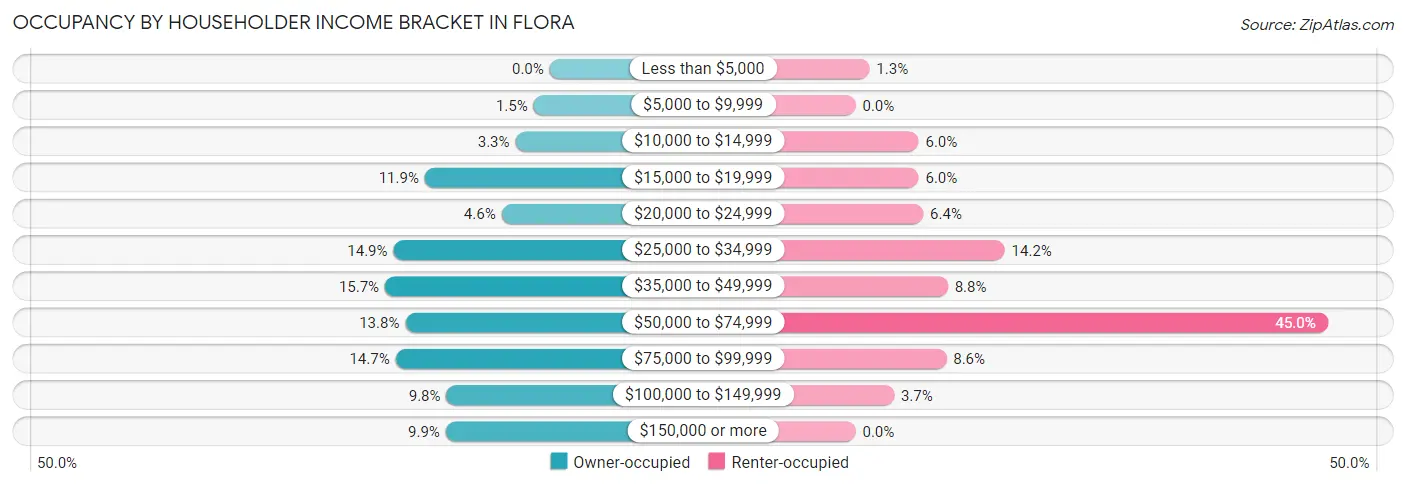
| Income Bracket | Owner-occupied | Renter-occupied |
| Less than $5,000 | 0 (0.0%) | 9 (1.3%) |
| $5,000 to $9,999 | 23 (1.5%) | 0 (0.0%) |
| $10,000 to $14,999 | 49 (3.3%) | 41 (6.0%) |
| $15,000 to $19,999 | 179 (11.9%) | 41 (6.0%) |
| $20,000 to $24,999 | 69 (4.6%) | 44 (6.4%) |
| $25,000 to $34,999 | 224 (14.9%) | 97 (14.2%) |
| $35,000 to $49,999 | 236 (15.7%) | 60 (8.8%) |
| $50,000 to $74,999 | 207 (13.8%) | 307 (45.0%) |
| $75,000 to $99,999 | 221 (14.7%) | 59 (8.6%) |
| $100,000 to $149,999 | 148 (9.8%) | 25 (3.7%) |
| $150,000 or more | 149 (9.9%) | 0 (0.0%) |
| Total | 1,505 (100.0%) | 683 (100.0%) |
Monthly Housing Cost Tiers in Flora
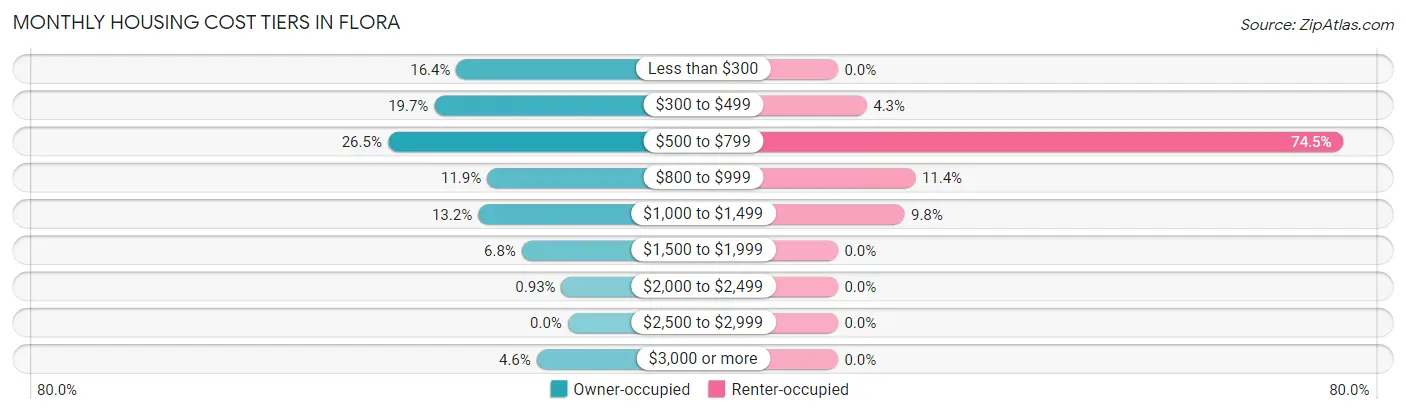
| Monthly Cost | Owner-occupied | Renter-occupied |
| Less than $300 | 247 (16.4%) | 0 (0.0%) |
| $300 to $499 | 296 (19.7%) | 29 (4.3%) |
| $500 to $799 | 399 (26.5%) | 509 (74.5%) |
| $800 to $999 | 179 (11.9%) | 78 (11.4%) |
| $1,000 to $1,499 | 199 (13.2%) | 67 (9.8%) |
| $1,500 to $1,999 | 102 (6.8%) | 0 (0.0%) |
| $2,000 to $2,499 | 14 (0.9%) | 0 (0.0%) |
| $2,500 to $2,999 | 0 (0.0%) | 0 (0.0%) |
| $3,000 or more | 69 (4.6%) | 0 (0.0%) |
| Total | 1,505 (100.0%) | 683 (100.0%) |
Physical Housing Characteristics in Flora
Housing Structures in Flora
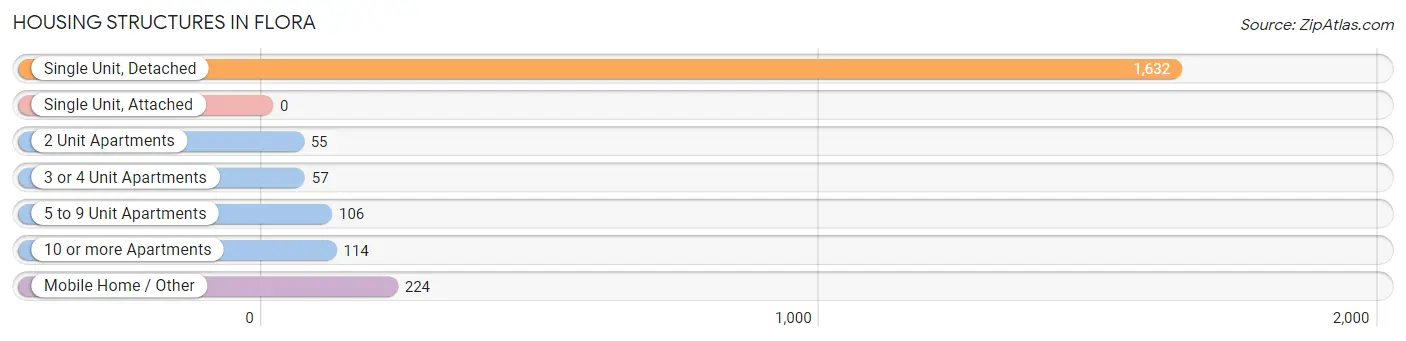
| Structure Type | # Housing Units | % Housing Units |
| Single Unit, Detached | 1,632 | 74.6% |
| Single Unit, Attached | 0 | 0.0% |
| 2 Unit Apartments | 55 | 2.5% |
| 3 or 4 Unit Apartments | 57 | 2.6% |
| 5 to 9 Unit Apartments | 106 | 4.8% |
| 10 or more Apartments | 114 | 5.2% |
| Mobile Home / Other | 224 | 10.2% |
| Total | 2,188 | 100.0% |
Housing Structures by Occupancy in Flora
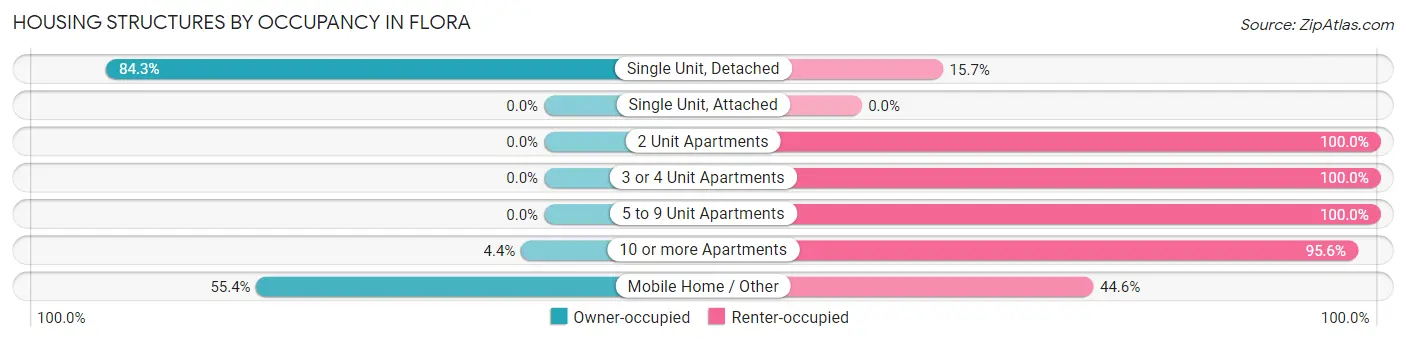
| Structure Type | Owner-occupied | Renter-occupied |
| Single Unit, Detached | 1,376 (84.3%) | 256 (15.7%) |
| Single Unit, Attached | 0 (0.0%) | 0 (0.0%) |
| 2 Unit Apartments | 0 (0.0%) | 55 (100.0%) |
| 3 or 4 Unit Apartments | 0 (0.0%) | 57 (100.0%) |
| 5 to 9 Unit Apartments | 0 (0.0%) | 106 (100.0%) |
| 10 or more Apartments | 5 (4.4%) | 109 (95.6%) |
| Mobile Home / Other | 124 (55.4%) | 100 (44.6%) |
| Total | 1,505 (68.8%) | 683 (31.2%) |
Housing Structures by Number of Rooms in Flora
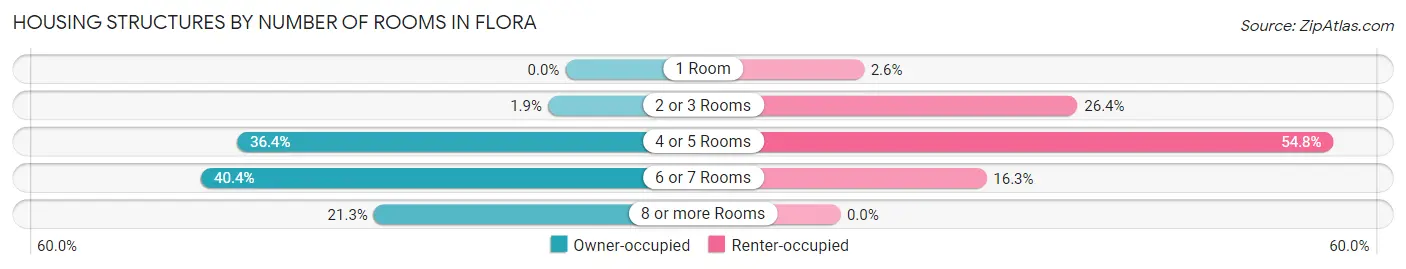
| Number of Rooms | Owner-occupied | Renter-occupied |
| 1 Room | 0 (0.0%) | 18 (2.6%) |
| 2 or 3 Rooms | 29 (1.9%) | 180 (26.4%) |
| 4 or 5 Rooms | 548 (36.4%) | 374 (54.8%) |
| 6 or 7 Rooms | 608 (40.4%) | 111 (16.3%) |
| 8 or more Rooms | 320 (21.3%) | 0 (0.0%) |
| Total | 1,505 (100.0%) | 683 (100.0%) |
Housing Structure by Heating Type in Flora
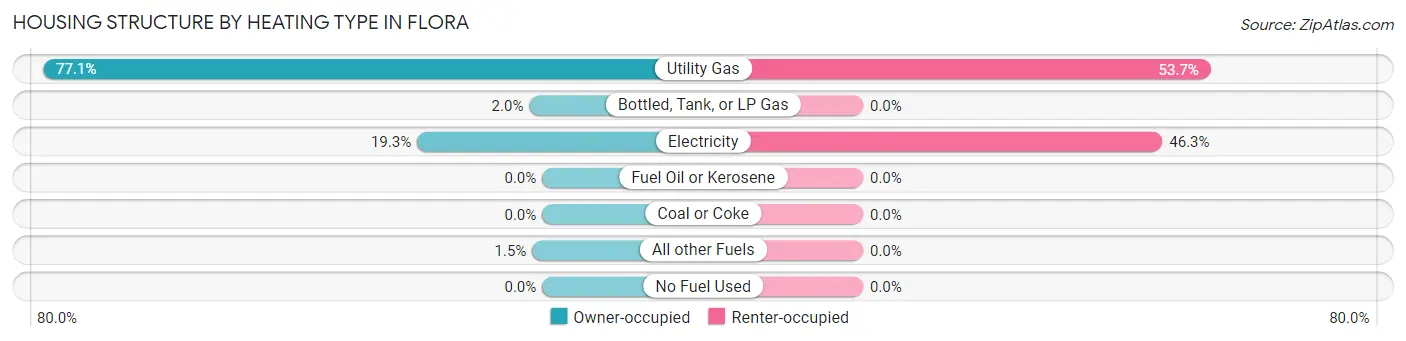
| Heating Type | Owner-occupied | Renter-occupied |
| Utility Gas | 1,161 (77.1%) | 367 (53.7%) |
| Bottled, Tank, or LP Gas | 30 (2.0%) | 0 (0.0%) |
| Electricity | 291 (19.3%) | 316 (46.3%) |
| Fuel Oil or Kerosene | 0 (0.0%) | 0 (0.0%) |
| Coal or Coke | 0 (0.0%) | 0 (0.0%) |
| All other Fuels | 23 (1.5%) | 0 (0.0%) |
| No Fuel Used | 0 (0.0%) | 0 (0.0%) |
| Total | 1,505 (100.0%) | 683 (100.0%) |
Household Vehicle Usage in Flora
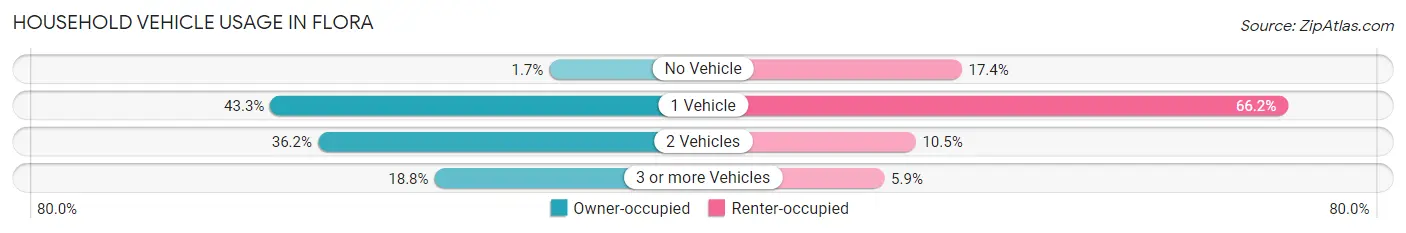
| Vehicles per Household | Owner-occupied | Renter-occupied |
| No Vehicle | 25 (1.7%) | 119 (17.4%) |
| 1 Vehicle | 652 (43.3%) | 452 (66.2%) |
| 2 Vehicles | 545 (36.2%) | 72 (10.5%) |
| 3 or more Vehicles | 283 (18.8%) | 40 (5.9%) |
| Total | 1,505 (100.0%) | 683 (100.0%) |
Real Estate & Mortgages in Flora
Real Estate and Mortgage Overview in Flora
| Characteristic | Without Mortgage | With Mortgage |
| Housing Units | 793 | 712 |
| Median Property Value | $69,900 | $113,300 |
| Median Household Income | $36,813 | $91 |
| Monthly Housing Costs | $432 | $69 |
| Real Estate Taxes | $896 | $0 |
Property Value by Mortgage Status in Flora
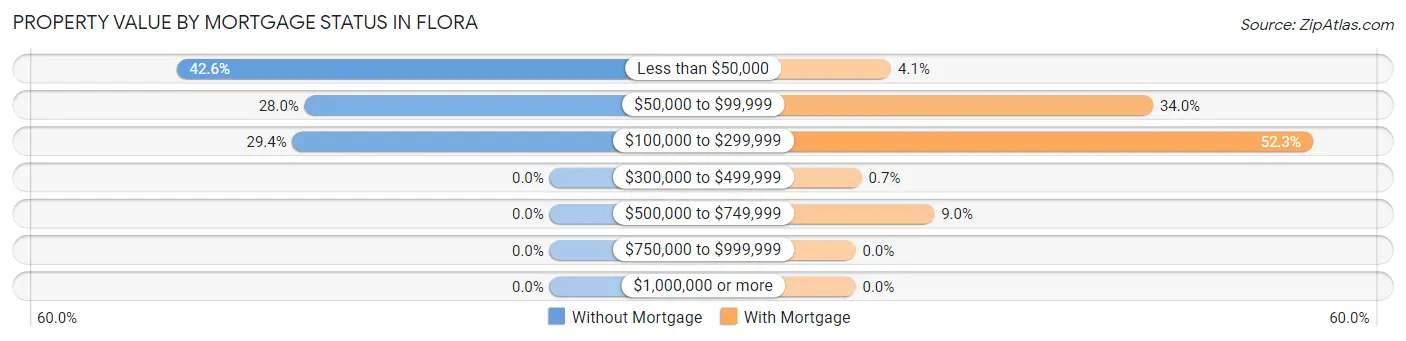
| Property Value | Without Mortgage | With Mortgage |
| Less than $50,000 | 338 (42.6%) | 29 (4.1%) |
| $50,000 to $99,999 | 222 (28.0%) | 242 (34.0%) |
| $100,000 to $299,999 | 233 (29.4%) | 372 (52.2%) |
| $300,000 to $499,999 | 0 (0.0%) | 5 (0.7%) |
| $500,000 to $749,999 | 0 (0.0%) | 64 (9.0%) |
| $750,000 to $999,999 | 0 (0.0%) | 0 (0.0%) |
| $1,000,000 or more | 0 (0.0%) | 0 (0.0%) |
| Total | 793 (100.0%) | 712 (100.0%) |
Household Income by Mortgage Status in Flora
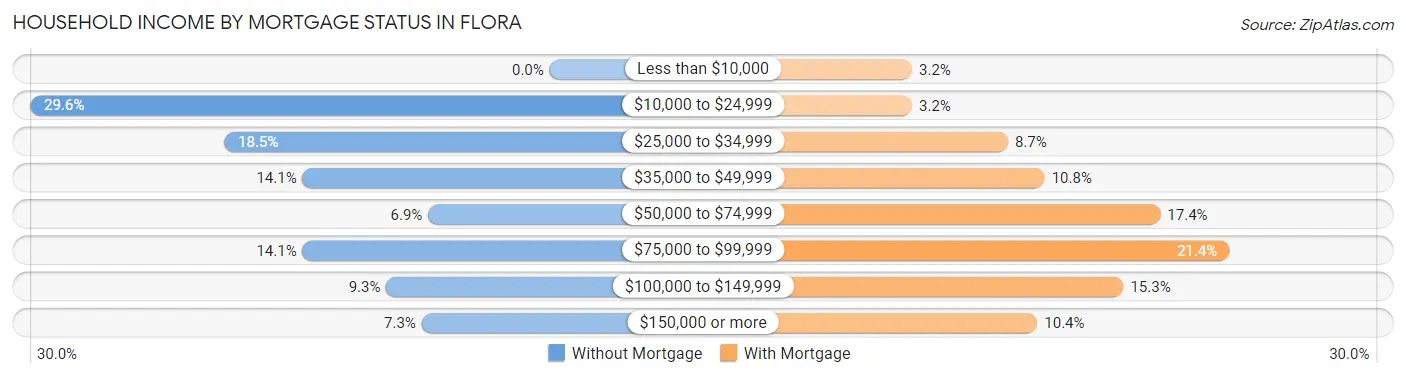
| Household Income | Without Mortgage | With Mortgage |
| Less than $10,000 | 0 (0.0%) | 23 (3.2%) |
| $10,000 to $24,999 | 235 (29.6%) | 23 (3.2%) |
| $25,000 to $34,999 | 147 (18.5%) | 62 (8.7%) |
| $35,000 to $49,999 | 112 (14.1%) | 77 (10.8%) |
| $50,000 to $74,999 | 55 (6.9%) | 124 (17.4%) |
| $75,000 to $99,999 | 112 (14.1%) | 152 (21.3%) |
| $100,000 to $149,999 | 74 (9.3%) | 109 (15.3%) |
| $150,000 or more | 58 (7.3%) | 74 (10.4%) |
| Total | 793 (100.0%) | 712 (100.0%) |
Property Value to Household Income Ratio in Flora
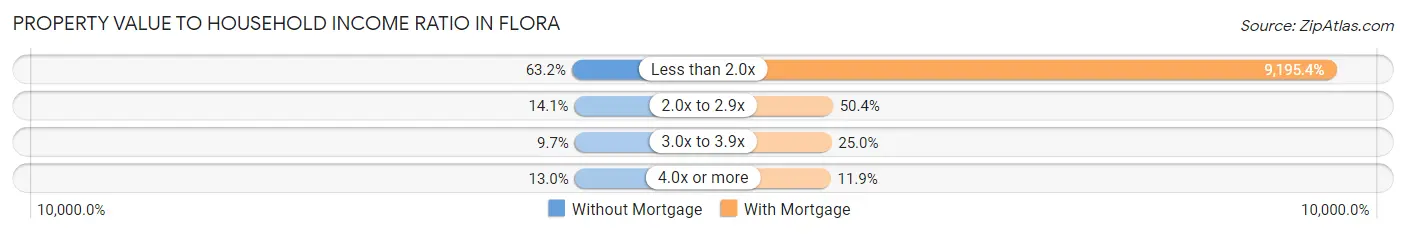
| Value-to-Income Ratio | Without Mortgage | With Mortgage |
| Less than 2.0x | 501 (63.2%) | 65,471 (9,195.4%) |
| 2.0x to 2.9x | 112 (14.1%) | 359 (50.4%) |
| 3.0x to 3.9x | 77 (9.7%) | 178 (25.0%) |
| 4.0x or more | 103 (13.0%) | 85 (11.9%) |
| Total | 793 (100.0%) | 712 (100.0%) |
Real Estate Taxes by Mortgage Status in Flora
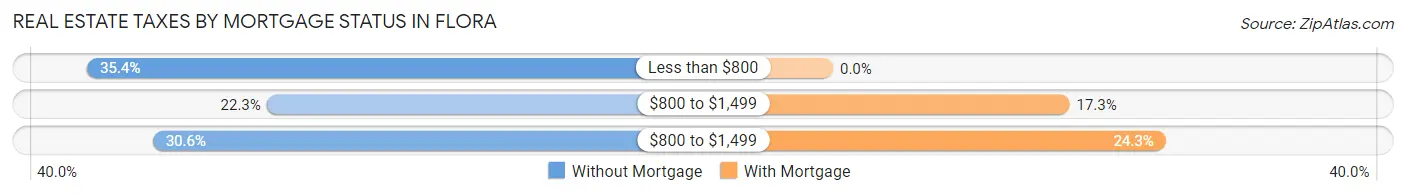
| Property Taxes | Without Mortgage | With Mortgage |
| Less than $800 | 281 (35.4%) | 0 (0.0%) |
| $800 to $1,499 | 177 (22.3%) | 123 (17.3%) |
| $800 to $1,499 | 243 (30.6%) | 173 (24.3%) |
| Total | 793 (100.0%) | 712 (100.0%) |
Health & Disability in Flora
Health Insurance Coverage by Age in Flora
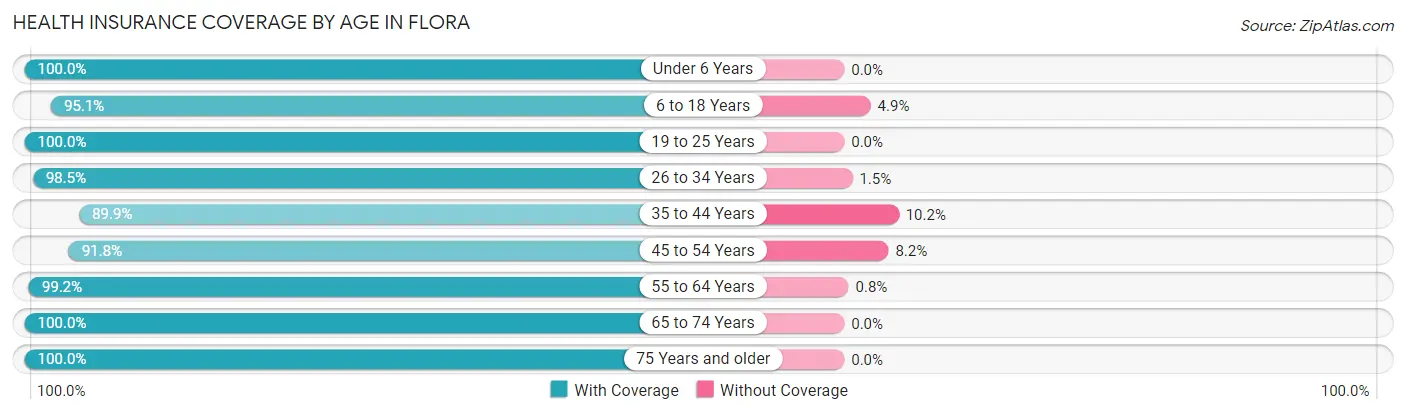
| Age Bracket | With Coverage | Without Coverage |
| Under 6 Years | 122 (100.0%) | 0 (0.0%) |
| 6 to 18 Years | 793 (95.1%) | 41 (4.9%) |
| 19 to 25 Years | 359 (100.0%) | 0 (0.0%) |
| 26 to 34 Years | 520 (98.5%) | 8 (1.5%) |
| 35 to 44 Years | 478 (89.8%) | 54 (10.2%) |
| 45 to 54 Years | 390 (91.8%) | 35 (8.2%) |
| 55 to 64 Years | 740 (99.2%) | 6 (0.8%) |
| 65 to 74 Years | 477 (100.0%) | 0 (0.0%) |
| 75 Years and older | 556 (100.0%) | 0 (0.0%) |
| Total | 4,435 (96.9%) | 144 (3.1%) |
Health Insurance Coverage by Citizenship Status in Flora
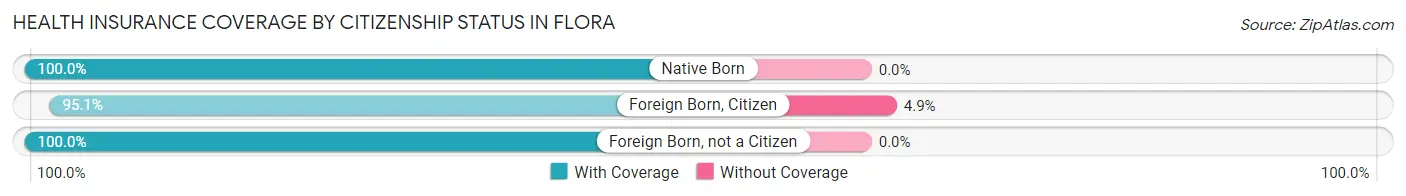
| Citizenship Status | With Coverage | Without Coverage |
| Native Born | 122 (100.0%) | 0 (0.0%) |
| Foreign Born, Citizen | 793 (95.1%) | 41 (4.9%) |
| Foreign Born, not a Citizen | 359 (100.0%) | 0 (0.0%) |
Health Insurance Coverage by Household Income in Flora
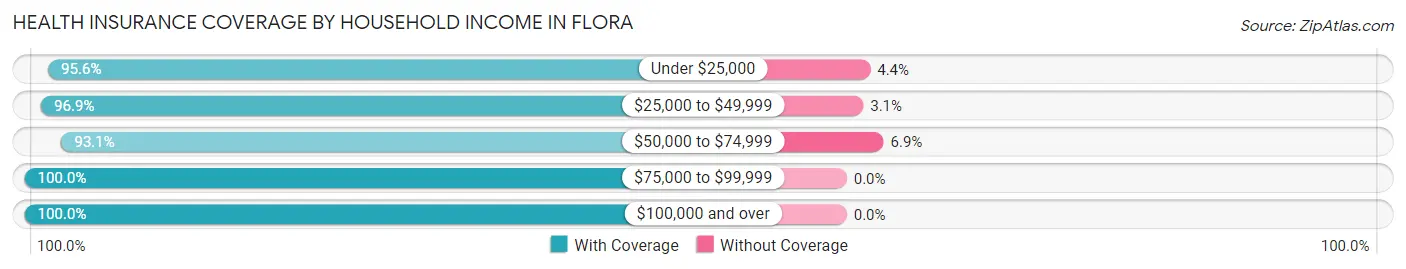
| Household Income | With Coverage | Without Coverage |
| Under $25,000 | 608 (95.6%) | 28 (4.4%) |
| $25,000 to $49,999 | 1,288 (96.9%) | 41 (3.1%) |
| $50,000 to $74,999 | 1,014 (93.1%) | 75 (6.9%) |
| $75,000 to $99,999 | 654 (100.0%) | 0 (0.0%) |
| $100,000 and over | 794 (100.0%) | 0 (0.0%) |
Public vs Private Health Insurance Coverage by Age in Flora
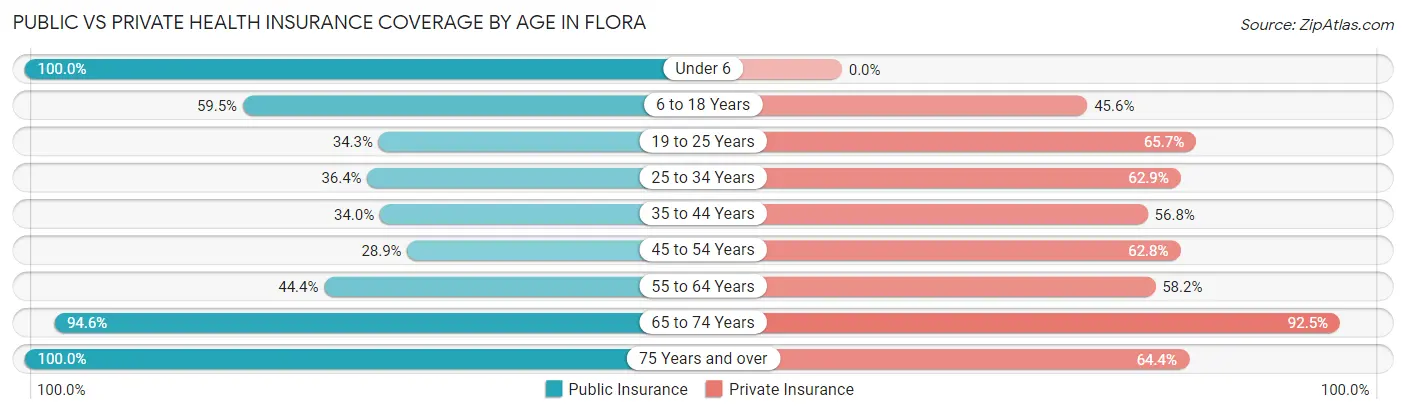
| Age Bracket | Public Insurance | Private Insurance |
| Under 6 | 122 (100.0%) | 0 (0.0%) |
| 6 to 18 Years | 496 (59.5%) | 380 (45.6%) |
| 19 to 25 Years | 123 (34.3%) | 236 (65.7%) |
| 25 to 34 Years | 192 (36.4%) | 332 (62.9%) |
| 35 to 44 Years | 181 (34.0%) | 302 (56.8%) |
| 45 to 54 Years | 123 (28.9%) | 267 (62.8%) |
| 55 to 64 Years | 331 (44.4%) | 434 (58.2%) |
| 65 to 74 Years | 451 (94.6%) | 441 (92.4%) |
| 75 Years and over | 556 (100.0%) | 358 (64.4%) |
| Total | 2,575 (56.2%) | 2,750 (60.1%) |
Disability Status by Sex by Age in Flora
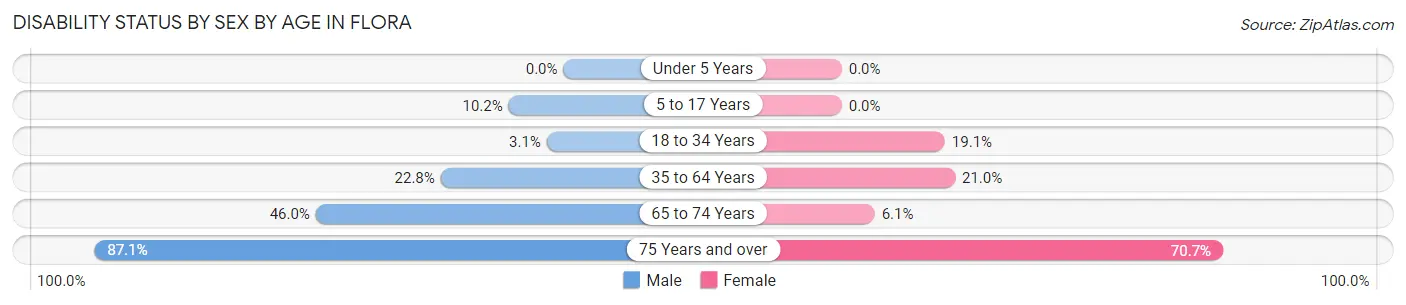
| Age Bracket | Male | Female |
| Under 5 Years | 0 (0.0%) | 0 (0.0%) |
| 5 to 17 Years | 36 (10.2%) | 0 (0.0%) |
| 18 to 34 Years | 15 (3.1%) | 94 (19.1%) |
| 35 to 64 Years | 182 (22.8%) | 190 (21.0%) |
| 65 to 74 Years | 114 (46.0%) | 14 (6.1%) |
| 75 Years and over | 148 (87.1%) | 273 (70.7%) |
Disability Class by Sex by Age in Flora
Disability Class: Hearing Difficulty
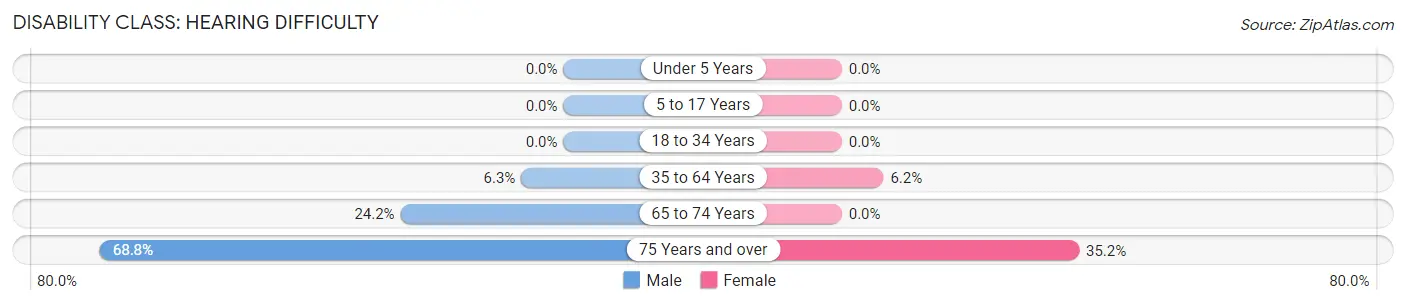
| Age Bracket | Male | Female |
| Under 5 Years | 0 (0.0%) | 0 (0.0%) |
| 5 to 17 Years | 0 (0.0%) | 0 (0.0%) |
| 18 to 34 Years | 0 (0.0%) | 0 (0.0%) |
| 35 to 64 Years | 50 (6.3%) | 56 (6.2%) |
| 65 to 74 Years | 60 (24.2%) | 0 (0.0%) |
| 75 Years and over | 117 (68.8%) | 136 (35.2%) |
Disability Class: Vision Difficulty
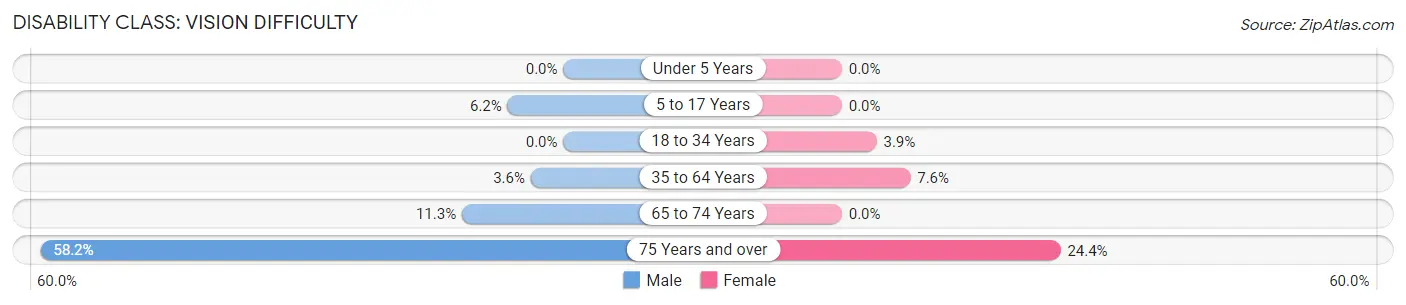
| Age Bracket | Male | Female |
| Under 5 Years | 0 (0.0%) | 0 (0.0%) |
| 5 to 17 Years | 22 (6.2%) | 0 (0.0%) |
| 18 to 34 Years | 0 (0.0%) | 19 (3.9%) |
| 35 to 64 Years | 29 (3.6%) | 69 (7.6%) |
| 65 to 74 Years | 28 (11.3%) | 0 (0.0%) |
| 75 Years and over | 99 (58.2%) | 94 (24.3%) |
Disability Class: Cognitive Difficulty
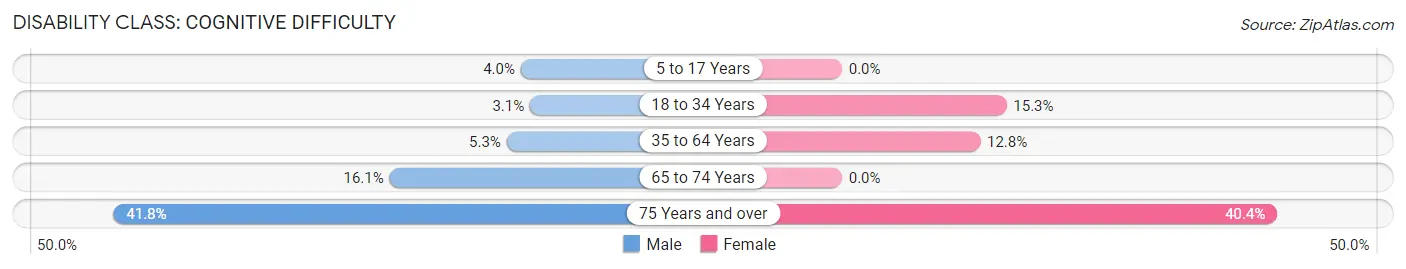
| Age Bracket | Male | Female |
| 5 to 17 Years | 14 (4.0%) | 0 (0.0%) |
| 18 to 34 Years | 15 (3.1%) | 75 (15.3%) |
| 35 to 64 Years | 42 (5.3%) | 116 (12.8%) |
| 65 to 74 Years | 40 (16.1%) | 0 (0.0%) |
| 75 Years and over | 71 (41.8%) | 156 (40.4%) |
Disability Class: Ambulatory Difficulty
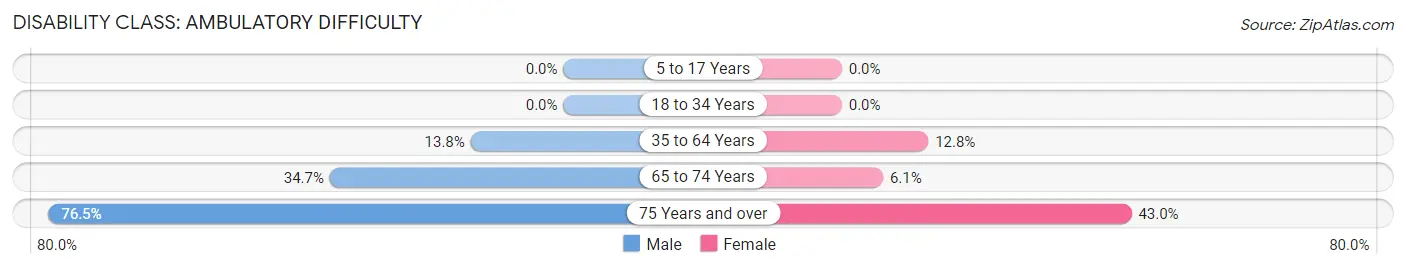
| Age Bracket | Male | Female |
| 5 to 17 Years | 0 (0.0%) | 0 (0.0%) |
| 18 to 34 Years | 0 (0.0%) | 0 (0.0%) |
| 35 to 64 Years | 110 (13.8%) | 116 (12.8%) |
| 65 to 74 Years | 86 (34.7%) | 14 (6.1%) |
| 75 Years and over | 130 (76.5%) | 166 (43.0%) |
Disability Class: Self-Care Difficulty
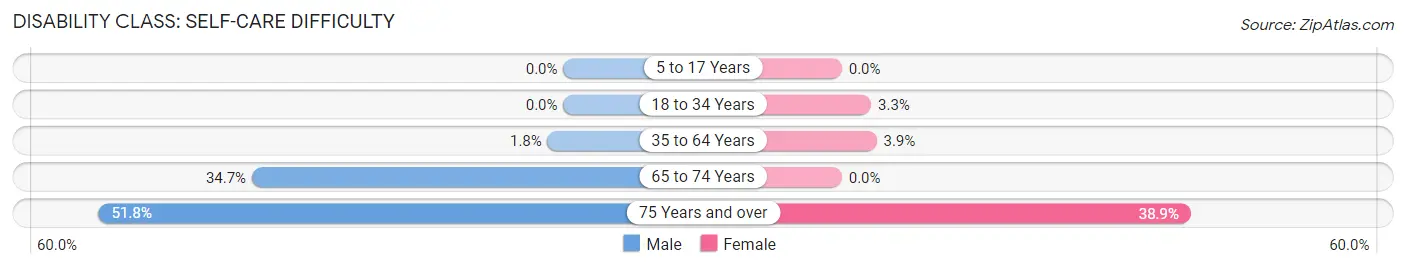
| Age Bracket | Male | Female |
| 5 to 17 Years | 0 (0.0%) | 0 (0.0%) |
| 18 to 34 Years | 0 (0.0%) | 16 (3.3%) |
| 35 to 64 Years | 14 (1.8%) | 35 (3.9%) |
| 65 to 74 Years | 86 (34.7%) | 0 (0.0%) |
| 75 Years and over | 88 (51.8%) | 150 (38.9%) |
Technology Access in Flora
Computing Device Access in Flora
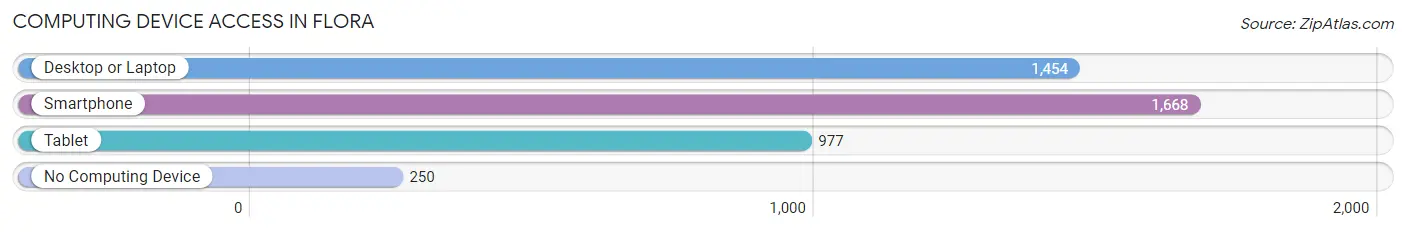
| Device Type | # Households | % Households |
| Desktop or Laptop | 1,454 | 66.4% |
| Smartphone | 1,668 | 76.2% |
| Tablet | 977 | 44.7% |
| No Computing Device | 250 | 11.4% |
| Total | 2,188 | 100.0% |
Internet Access in Flora
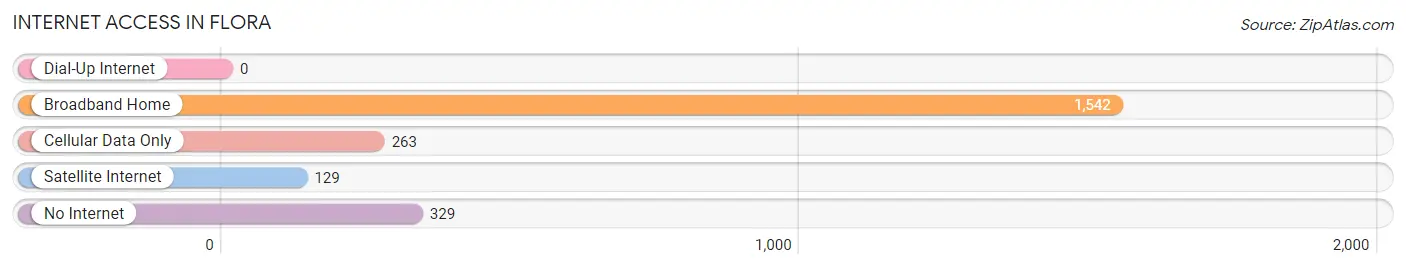
| Internet Type | # Households | % Households |
| Dial-Up Internet | 0 | 0.0% |
| Broadband Home | 1,542 | 70.5% |
| Cellular Data Only | 263 | 12.0% |
| Satellite Internet | 129 | 5.9% |
| No Internet | 329 | 15.0% |
| Total | 2,188 | 100.0% |
Flora Summary
Flora, Illinois is a small city located in Clay County, Illinois. It is situated in the southeastern part of the state, about 40 miles east of St. Louis, Missouri. The city has a population of 5,912 people, according to the 2010 census.
History
Flora was founded in 1854 by a group of settlers from Kentucky and Tennessee. The city was named after the daughter of one of the settlers, Flora Ann Smith. The city was incorporated in 1859 and was the first city in Clay County.
In the late 19th century, Flora was a thriving agricultural center. The city was home to several grain elevators, a flour mill, and a canning factory. The city also had a large number of stores and businesses.
In the early 20th century, the city experienced a period of growth and prosperity. The city was home to several factories, including a shoe factory, a furniture factory, and a brick factory. The city also had a number of banks, hotels, and other businesses.
Geography
Flora is located in southeastern Illinois, about 40 miles east of St. Louis, Missouri. The city is situated in the western part of Clay County, on the banks of the Little Wabash River. The city has a total area of 2.2 square miles, all of which is land.
The city is located in a flat, open area of the Midwest. The climate is humid continental, with hot, humid summers and cold, snowy winters. The average annual temperature is 54 degrees Fahrenheit.
Economy
Flora’s economy is largely based on agriculture and manufacturing. The city is home to several grain elevators, a flour mill, and a canning factory. The city also has a number of stores and businesses.
The city is also home to several manufacturing companies, including a shoe factory, a furniture factory, and a brick factory. The city also has a number of banks, hotels, and other businesses.
Demographics
According to the 2010 census, Flora has a population of 5,912 people. The city has a median household income of $37,945 and a median family income of $45,945. The city has a poverty rate of 17.3%.
The city is predominantly white, with a population that is 94.3% white, 2.2% African American, 0.7% Asian, 0.3% Native American, and 2.5% other. The city also has a large Hispanic population, with a population that is 8.3% Hispanic or Latino.
Conclusion
Flora, Illinois is a small city located in Clay County, Illinois. It is situated in the southeastern part of the state, about 40 miles east of St. Louis, Missouri. The city has a population of 5,912 people, according to the 2010 census. The city’s economy is largely based on agriculture and manufacturing, and the city is home to several grain elevators, a flour mill, and a canning factory. The city is predominantly white, with a population that is 94.3% white, 2.2% African American, 0.7% Asian, 0.3% Native American, and 2.5% other. The city also has a large Hispanic population, with a population that is 8.3% Hispanic or Latino.
Common Questions
What is the Total Population of Flora?
Total Population of Flora is 4,701.
What is the Total Male Population of Flora?
Total Male Population of Flora is 2,166.
What is the Total Female Population of Flora?
Total Female Population of Flora is 2,535.
What is the Ratio of Males per 100 Females in Flora?
There are 85.44 Males per 100 Females in Flora.
What is the Ratio of Females per 100 Males in Flora?
There are 117.04 Females per 100 Males in Flora.
What is the Median Population Age in Flora?
Median Population Age in Flora is 43.7 Years.
What is the Average Family Size in Flora
Average Family Size in Flora is 2.8 People.
What is the Average Household Size in Flora
Average Household Size in Flora is 2.1 People.
What is Per Capita Income in Flora?
Per Capita income in Flora is $29,968.
What is the Median Family Income in Flora?
Median Family Income in Flora is $65,036.
What is the Median Household income in Flora?
Median Household Income in Flora is $50,407.
What is Income or Wage Gap in Flora?
Income or Wage Gap in Flora is 37.6%.
Women in Flora earn 62.4 cents for every dollar earned by a man.
What is Inequality or Gini Index in Flora?
Inequality or Gini Index in Flora is 0.41.
How Large is the Labor Force in Flora?
There are 2,109 People in the Labor Forcein in Flora.
What is the Percentage of People in the Labor Force in Flora?
53.2% of People are in the Labor Force in Flora.
What is the Unemployment Rate in Flora?
Unemployment Rate in Flora is 6.8%.