Cities with the Lowest Poverty Level Among Single Mothers in Washington
RELATED REPORTS & OPTIONS
Lowest Poverty | Single Mother
Washington
Compare Cities
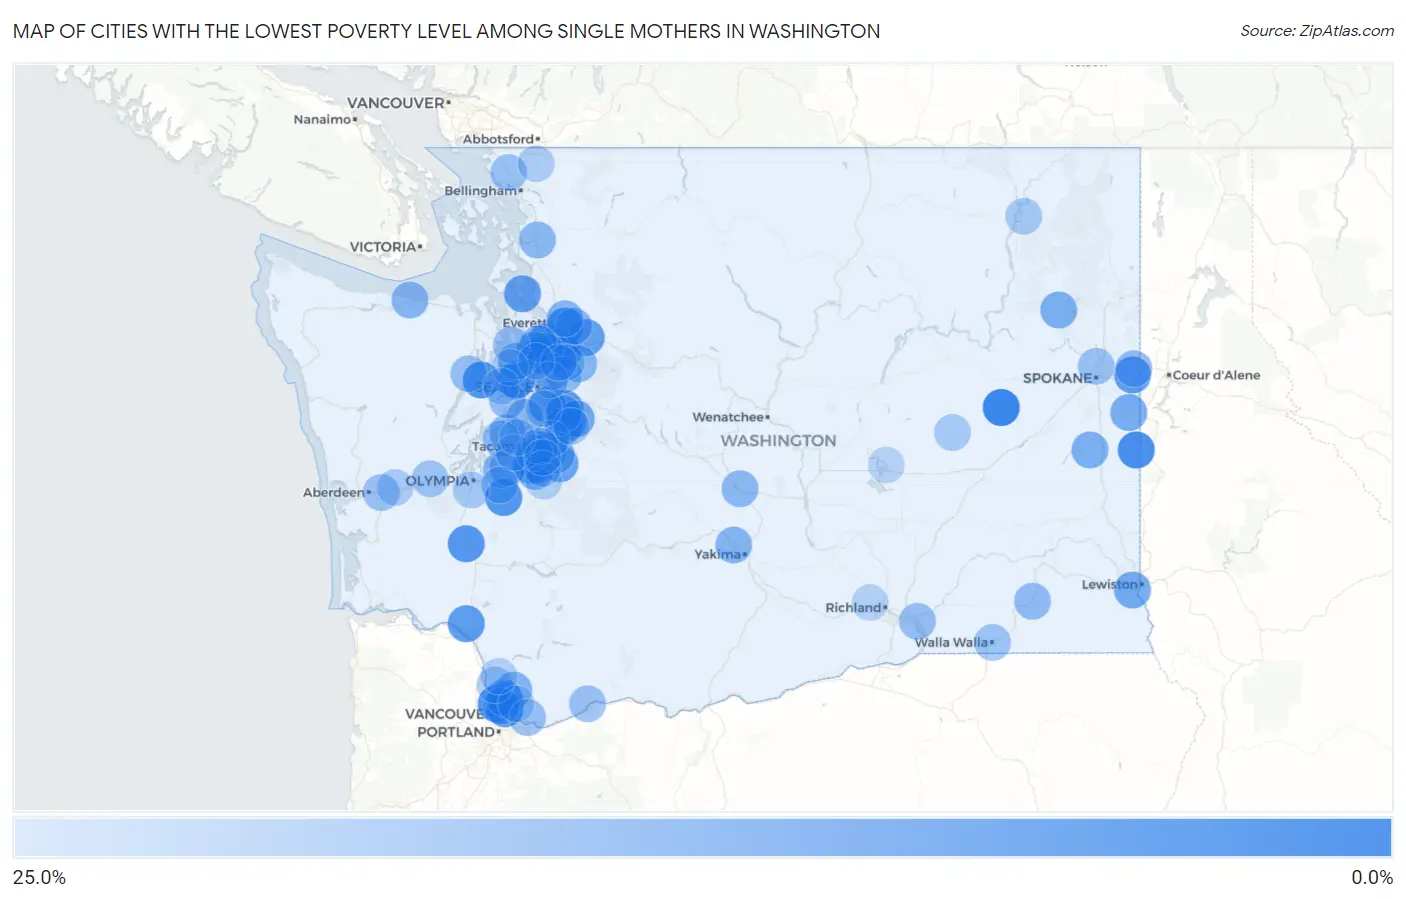
Map of Cities with the Lowest Poverty Level Among Single Mothers in Washington
25.0%
0.0%
Cities with the Lowest Poverty Level Among Single Mothers in Washington
| City | Single Mother Poverty | vs State | vs National | |
| 1. | Harrington | 2.3% | 28.2%(-25.9)#1 | 33.1%(-30.8)#47 |
| 2. | Bainbridge Island | 3.5% | 28.2%(-24.7)#2 | 33.1%(-29.6)#133 |
| 3. | Summit | 4.0% | 28.2%(-24.2)#3 | 33.1%(-29.1)#181 |
| 4. | Tekoa | 4.7% | 28.2%(-23.5)#4 | 33.1%(-28.5)#245 |
| 5. | Lake Shore | 5.0% | 28.2%(-23.2)#5 | 33.1%(-28.1)#286 |
| 6. | Clover Creek | 5.7% | 28.2%(-22.5)#6 | 33.1%(-27.4)#395 |
| 7. | Bunk Foss | 6.0% | 28.2%(-22.2)#7 | 33.1%(-27.2)#429 |
| 8. | Seabeck | 6.1% | 28.2%(-22.1)#8 | 33.1%(-27.0)#455 |
| 9. | Shadow Lake | 6.3% | 28.2%(-21.8)#9 | 33.1%(-26.8)#491 |
| 10. | Yelm | 6.4% | 28.2%(-21.8)#10 | 33.1%(-26.8)#493 |
| 11. | Clearview | 6.5% | 28.2%(-21.7)#11 | 33.1%(-26.6)#514 |
| 12. | Minnehaha | 6.7% | 28.2%(-21.5)#12 | 33.1%(-26.5)#551 |
| 13. | Chehalis | 6.7% | 28.2%(-21.5)#13 | 33.1%(-26.4)#554 |
| 14. | East Renton Highlands | 7.1% | 28.2%(-21.0)#14 | 33.1%(-26.0)#606 |
| 15. | Maltby | 7.3% | 28.2%(-20.9)#15 | 33.1%(-25.8)#655 |
| 16. | Bryn Mawr Skyway | 7.4% | 28.2%(-20.8)#16 | 33.1%(-25.8)#662 |
| 17. | Longview Heights | 7.7% | 28.2%(-20.5)#17 | 33.1%(-25.4)#715 |
| 18. | Liberty Lake | 8.2% | 28.2%(-20.0)#18 | 33.1%(-24.9)#821 |
| 19. | Covington | 8.3% | 28.2%(-19.8)#19 | 33.1%(-24.8)#834 |
| 20. | Camano | 8.4% | 28.2%(-19.8)#20 | 33.1%(-24.8)#864 |
| 21. | Lake Stickney | 8.4% | 28.2%(-19.8)#21 | 33.1%(-24.8)#865 |
| 22. | Brier | 8.6% | 28.2%(-19.6)#22 | 33.1%(-24.5)#903 |
| 23. | Woods Creek | 8.7% | 28.2%(-19.4)#23 | 33.1%(-24.4)#931 |
| 24. | Bothell East | 9.3% | 28.2%(-18.9)#24 | 33.1%(-23.8)#1,038 |
| 25. | Mountlake Terrace | 9.8% | 28.2%(-18.4)#25 | 33.1%(-23.4)#1,121 |
| 26. | Alderwood Manor | 9.9% | 28.2%(-18.3)#26 | 33.1%(-23.3)#1,139 |
| 27. | Prairie Ridge | 10.0% | 28.2%(-18.2)#27 | 33.1%(-23.2)#1,150 |
| 28. | Summit View | 10.3% | 28.2%(-17.9)#28 | 33.1%(-22.9)#1,224 |
| 29. | Edgewood | 10.7% | 28.2%(-17.5)#29 | 33.1%(-22.5)#1,319 |
| 30. | Hobart | 11.1% | 28.2%(-17.1)#30 | 33.1%(-22.0)#1,396 |
| 31. | Clarkston Heights Vineland | 11.4% | 28.2%(-16.8)#31 | 33.1%(-21.8)#1,482 |
| 32. | Sumner | 11.7% | 28.2%(-16.5)#32 | 33.1%(-21.5)#1,542 |
| 33. | Rockford | 11.8% | 28.2%(-16.4)#33 | 33.1%(-21.4)#1,572 |
| 34. | Frederickson | 12.4% | 28.2%(-15.8)#34 | 33.1%(-20.8)#1,691 |
| 35. | Bonney Lake | 12.4% | 28.2%(-15.8)#35 | 33.1%(-20.7)#1,698 |
| 36. | Springdale | 12.5% | 28.2%(-15.7)#36 | 33.1%(-20.6)#1,740 |
| 37. | Malden | 12.5% | 28.2%(-15.7)#37 | 33.1%(-20.6)#1,762 |
| 38. | Edmonds | 12.7% | 28.2%(-15.5)#38 | 33.1%(-20.5)#1,785 |
| 39. | Kirkland | 13.0% | 28.2%(-15.2)#39 | 33.1%(-20.1)#1,856 |
| 40. | Indianola | 13.7% | 28.2%(-14.5)#40 | 33.1%(-19.4)#2,025 |
| 41. | Battle Ground | 13.8% | 28.2%(-14.4)#41 | 33.1%(-19.3)#2,054 |
| 42. | Snohomish | 13.8% | 28.2%(-14.3)#42 | 33.1%(-19.3)#2,056 |
| 43. | Barberton | 14.0% | 28.2%(-14.2)#43 | 33.1%(-19.2)#2,076 |
| 44. | Gleed | 14.2% | 28.2%(-14.0)#44 | 33.1%(-18.9)#2,123 |
| 45. | Duvall | 14.3% | 28.2%(-13.9)#45 | 33.1%(-18.8)#2,138 |
| 46. | Lake Stevens | 14.3% | 28.2%(-13.9)#46 | 33.1%(-18.8)#2,206 |
| 47. | Port Angeles | 14.4% | 28.2%(-13.8)#47 | 33.1%(-18.8)#2,213 |
| 48. | Dupont | 14.4% | 28.2%(-13.8)#48 | 33.1%(-18.8)#2,220 |
| 49. | Vashon | 14.6% | 28.2%(-13.6)#49 | 33.1%(-18.5)#2,260 |
| 50. | Ellensburg | 14.6% | 28.2%(-13.6)#50 | 33.1%(-18.5)#2,264 |
| 51. | Gig Harbor | 14.7% | 28.2%(-13.4)#51 | 33.1%(-18.4)#2,287 |
| 52. | Burlington | 14.9% | 28.2%(-13.3)#52 | 33.1%(-18.3)#2,317 |
| 53. | Redmond | 15.0% | 28.2%(-13.2)#53 | 33.1%(-18.1)#2,357 |
| 54. | Otis Orchards East Farms | 15.4% | 28.2%(-12.8)#54 | 33.1%(-17.8)#2,409 |
| 55. | Dayton | 15.6% | 28.2%(-12.6)#55 | 33.1%(-17.5)#2,484 |
| 56. | Fife | 15.6% | 28.2%(-12.5)#56 | 33.1%(-17.5)#2,501 |
| 57. | Mount Vista | 15.7% | 28.2%(-12.5)#57 | 33.1%(-17.4)#2,510 |
| 58. | Parkwood | 15.8% | 28.2%(-12.4)#58 | 33.1%(-17.3)#2,523 |
| 59. | Artondale | 15.9% | 28.2%(-12.3)#59 | 33.1%(-17.3)#2,561 |
| 60. | North Fort Lewis | 15.9% | 28.2%(-12.3)#60 | 33.1%(-17.2)#2,567 |
| 61. | Meadowdale | 16.0% | 28.2%(-12.2)#61 | 33.1%(-17.1)#2,588 |
| 62. | Hazel Dell | 16.3% | 28.2%(-11.9)#62 | 33.1%(-16.9)#2,647 |
| 63. | Camas | 16.6% | 28.2%(-11.6)#63 | 33.1%(-16.5)#2,709 |
| 64. | Burbank | 16.7% | 28.2%(-11.5)#64 | 33.1%(-16.5)#2,723 |
| 65. | Brinnon | 16.7% | 28.2%(-11.5)#65 | 33.1%(-16.5)#2,755 |
| 66. | Nisqually Indian Community | 16.7% | 28.2%(-11.5)#66 | 33.1%(-16.5)#2,771 |
| 67. | Central Park | 16.8% | 28.2%(-11.3)#67 | 33.1%(-16.3)#2,833 |
| 68. | Maple Heights Lake Desire | 16.9% | 28.2%(-11.3)#68 | 33.1%(-16.2)#2,845 |
| 69. | Stevenson | 17.1% | 28.2%(-11.1)#69 | 33.1%(-16.1)#2,878 |
| 70. | Port Gamble Tribal Community | 17.1% | 28.2%(-11.1)#70 | 33.1%(-16.1)#2,881 |
| 71. | Ferndale | 17.2% | 28.2%(-11.0)#71 | 33.1%(-15.9)#2,913 |
| 72. | Cottage Lake | 17.2% | 28.2%(-11.0)#72 | 33.1%(-15.9)#2,914 |
| 73. | Town And Country | 17.2% | 28.2%(-10.9)#73 | 33.1%(-15.9)#2,915 |
| 74. | Walla Walla | 17.5% | 28.2%(-10.6)#74 | 33.1%(-15.6)#2,972 |
| 75. | Mccleary | 17.8% | 28.2%(-10.4)#75 | 33.1%(-15.4)#3,030 |
| 76. | Yarrow Point | 18.2% | 28.2%(-10.00)#76 | 33.1%(-15.0)#3,132 |
| 77. | Woodinville | 18.3% | 28.2%(-9.86)#77 | 33.1%(-14.8)#3,198 |
| 78. | Auburn | 18.6% | 28.2%(-9.63)#78 | 33.1%(-14.6)#3,242 |
| 79. | Waller | 18.6% | 28.2%(-9.62)#79 | 33.1%(-14.6)#3,243 |
| 80. | Maple Valley | 18.7% | 28.2%(-9.45)#80 | 33.1%(-14.4)#3,281 |
| 81. | Suquamish | 18.8% | 28.2%(-9.37)#81 | 33.1%(-14.3)#3,321 |
| 82. | Tumwater | 18.9% | 28.2%(-9.30)#82 | 33.1%(-14.3)#3,344 |
| 83. | University Place | 19.0% | 28.2%(-9.14)#83 | 33.1%(-14.1)#3,374 |
| 84. | Kettle Falls | 19.0% | 28.2%(-9.13)#84 | 33.1%(-14.1)#3,380 |
| 85. | Odessa | 19.0% | 28.2%(-9.13)#85 | 33.1%(-14.1)#3,388 |
| 86. | Milton | 19.1% | 28.2%(-9.04)#86 | 33.1%(-14.0)#3,406 |
| 87. | Ridgefield | 19.2% | 28.2%(-9.00)#87 | 33.1%(-14.0)#3,411 |
| 88. | Montesano | 19.5% | 28.2%(-8.68)#88 | 33.1%(-13.6)#3,492 |
| 89. | Shoreline | 19.8% | 28.2%(-8.40)#89 | 33.1%(-13.4)#3,547 |
| 90. | Tukwila | 20.0% | 28.2%(-8.18)#90 | 33.1%(-13.1)#3,584 |
| 91. | Everson | 20.0% | 28.2%(-8.18)#91 | 33.1%(-13.1)#3,594 |
| 92. | Graham | 20.3% | 28.2%(-7.83)#92 | 33.1%(-12.8)#3,750 |
| 93. | Tracyton | 20.5% | 28.2%(-7.67)#93 | 33.1%(-12.6)#3,792 |
| 94. | South Hill | 20.6% | 28.2%(-7.59)#94 | 33.1%(-12.5)#3,815 |
| 95. | Orchards | 20.8% | 28.2%(-7.42)#95 | 33.1%(-12.4)#3,865 |
| 96. | La Center | 20.8% | 28.2%(-7.40)#96 | 33.1%(-12.4)#3,869 |
| 97. | Ruston | 20.8% | 28.2%(-7.35)#97 | 33.1%(-12.3)#3,888 |
| 98. | Moses Lake | 21.2% | 28.2%(-6.93)#98 | 33.1%(-11.9)#3,997 |
| 99. | Puyallup | 21.3% | 28.2%(-6.91)#99 | 33.1%(-11.9)#4,000 |
| 100. | West Richland | 21.4% | 28.2%(-6.80)#100 | 33.1%(-11.8)#4,020 |
Common Questions
What are the Top 10 Cities with the Lowest Poverty Level Among Single Mothers in Washington?
Top 10 Cities with the Lowest Poverty Level Among Single Mothers in Washington are:
#1
2.3%
#2
3.5%
#3
4.0%
#4
4.7%
#5
5.0%
#6
5.7%
#7
6.0%
#8
6.1%
#9
6.3%
#10
6.4%
What city has the Lowest Poverty Level Among Single Mothers in Washington?
Harrington has the Lowest Poverty Level Among Single Mothers in Washington with 2.3%.
What is the Poverty Level Among Single Mothers in the State of Washington?
Poverty Level Among Single Mothers in Washington is 28.2%.
What is the Poverty Level Among Single Mothers in the United States?
Poverty Level Among Single Mothers in the United States is 33.1%.