Belle Prairie City, IL
Belle Prairie City Map
Belle Prairie City Overview
56
TOTAL POPULATION
27
MALE POPULATION
29
FEMALE POPULATION
93.10
MALES / 100 FEMALES
107.41
FEMALES / 100 MALES
40.6
MEDIAN AGE
3.0
AVG FAMILY SIZE
2.8
AVG HOUSEHOLD SIZE
$31,807
PER CAPITA INCOME
45.3%
WAGE / INCOME GAP [ % ]
54.7¢/ $1
WAGE / INCOME GAP [ $ ]
0.38
INEQUALITY / GINI INDEX
26
LABOR FORCE [ PEOPLE ]
61.9%
PERCENT IN LABOR FORCE
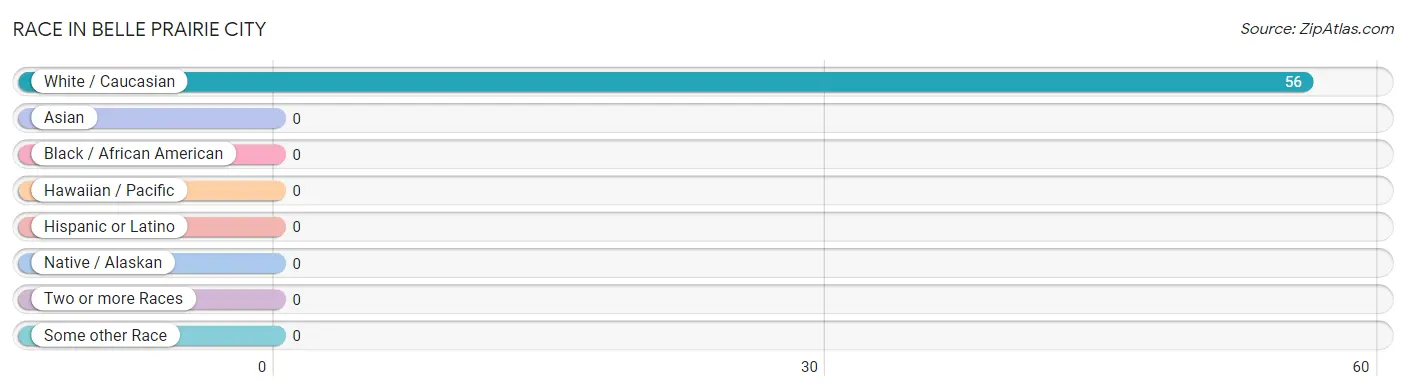
Race in Belle Prairie City
The most populous races in Belle Prairie City are , and White / Caucasian (56 | 100.0%).
| Race | # Population | % Population |
| Asian | 0 | 0.0% |
| Black / African American | 0 | 0.0% |
| Hawaiian / Pacific | 0 | 0.0% |
| Hispanic or Latino | 0 | 0.0% |
| Native / Alaskan | 0 | 0.0% |
| White / Caucasian | 56 | 100.0% |
| Two or more Races | 0 | 0.0% |
| Some other Race | 0 | 0.0% |
| Total | 56 | 100.0% |
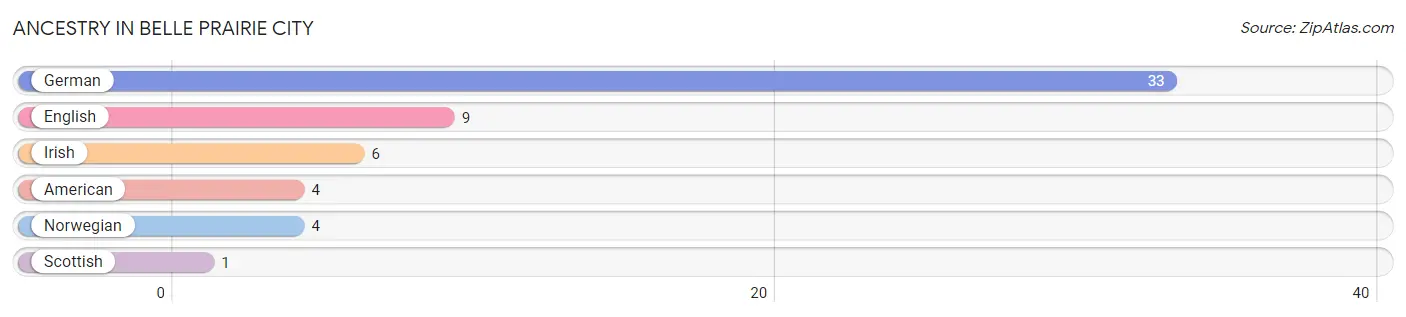
Ancestry in Belle Prairie City
The most populous ancestries reported in Belle Prairie City are German (33 | 58.9%), English (9 | 16.1%), Irish (6 | 10.7%), American (4 | 7.1%), and Norwegian (4 | 7.1%), together accounting for 100.0% of all Belle Prairie City residents.
| Ancestry | # Population | % Population |
| American | 4 | 7.1% |
| English | 9 | 16.1% |
| German | 33 | 58.9% |
| Irish | 6 | 10.7% |
| Norwegian | 4 | 7.1% |
| Scottish | 1 | 1.8% | View All 6 Rows |
Immigrants in Belle Prairie City

| Immigration Origin | # Population | % Population | View All 0 Rows |
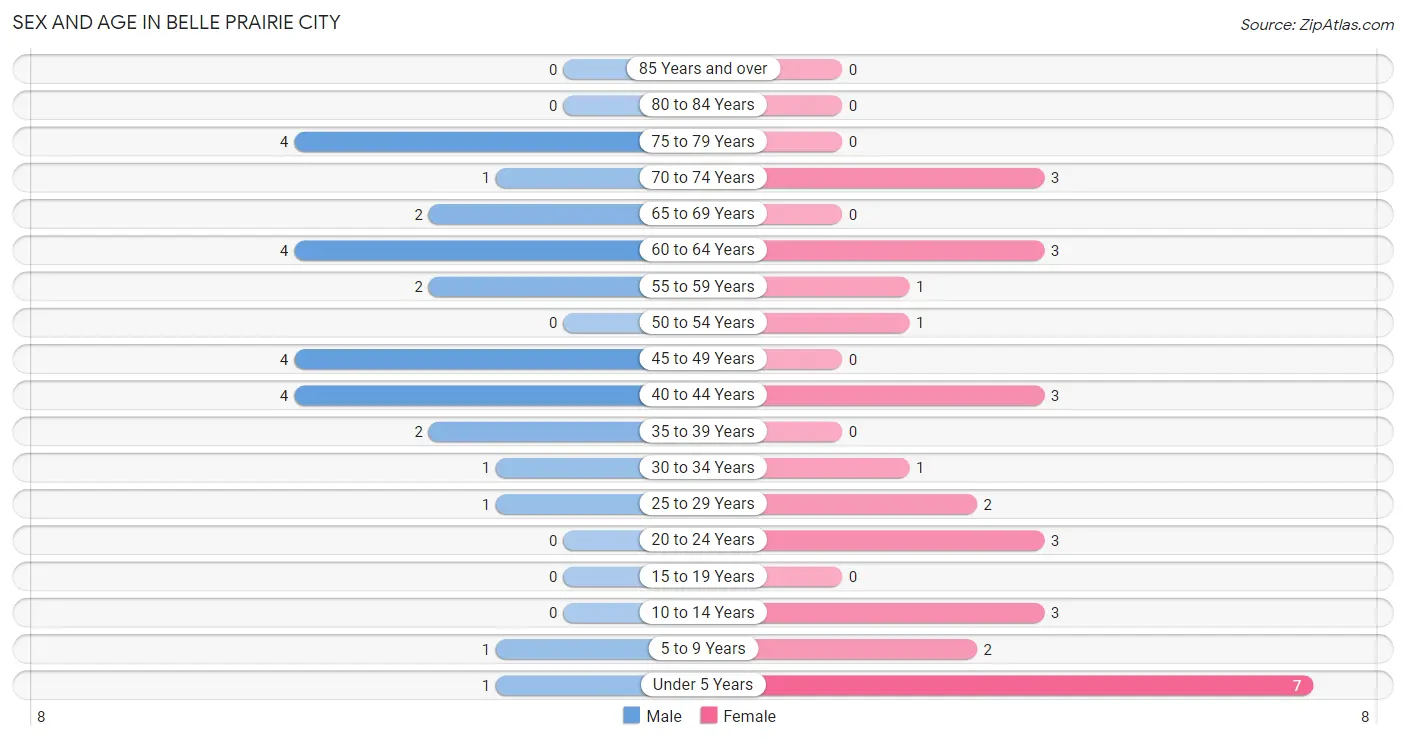
Sex and Age in Belle Prairie City
Sex and Age in Belle Prairie City
The most populous age groups in Belle Prairie City are 40 to 44 Years (4 | 14.8%) for men and Under 5 Years (7 | 24.1%) for women.
| Age Bracket | Male | Female |
| Under 5 Years | 1 (3.7%) | 7 (24.1%) |
| 5 to 9 Years | 1 (3.7%) | 2 (6.9%) |
| 10 to 14 Years | 0 (0.0%) | 3 (10.3%) |
| 15 to 19 Years | 0 (0.0%) | 0 (0.0%) |
| 20 to 24 Years | 0 (0.0%) | 3 (10.3%) |
| 25 to 29 Years | 1 (3.7%) | 2 (6.9%) |
| 30 to 34 Years | 1 (3.7%) | 1 (3.5%) |
| 35 to 39 Years | 2 (7.4%) | 0 (0.0%) |
| 40 to 44 Years | 4 (14.8%) | 3 (10.3%) |
| 45 to 49 Years | 4 (14.8%) | 0 (0.0%) |
| 50 to 54 Years | 0 (0.0%) | 1 (3.5%) |
| 55 to 59 Years | 2 (7.4%) | 1 (3.5%) |
| 60 to 64 Years | 4 (14.8%) | 3 (10.3%) |
| 65 to 69 Years | 2 (7.4%) | 0 (0.0%) |
| 70 to 74 Years | 1 (3.7%) | 3 (10.3%) |
| 75 to 79 Years | 4 (14.8%) | 0 (0.0%) |
| 80 to 84 Years | 0 (0.0%) | 0 (0.0%) |
| 85 Years and over | 0 (0.0%) | 0 (0.0%) |
| Total | 27 (100.0%) | 29 (100.0%) |
Families and Households in Belle Prairie City
Median Family Size in Belle Prairie City
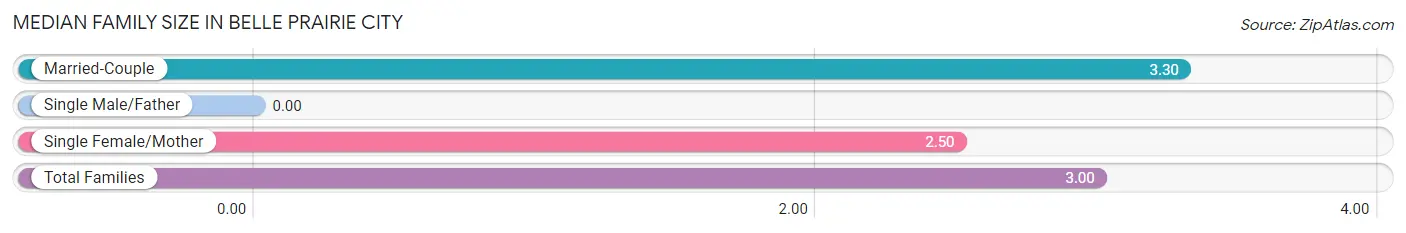
| Family Type | # Families | Family Size |
| Married-Couple | 10 (62.5%) | 3.30 |
| Single Male/Father | 0 (0.0%) | - |
| Single Female/Mother | 6 (37.5%) | 2.50 |
| Total Families | 16 (100.0%) | 3.00 |
Median Household Size in Belle Prairie City
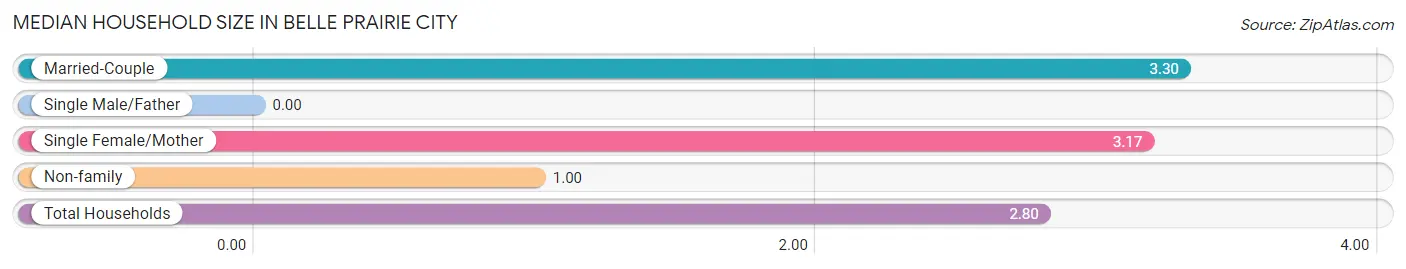
| Household Type | # Households | Household Size |
| Married-Couple | 10 (50.0%) | 3.30 |
| Single Male/Father | 0 (0.0%) | - |
| Single Female/Mother | 6 (30.0%) | 3.17 |
| Non-family | 4 (20.0%) | 1.00 |
| Total Households | 20 (100.0%) | 2.80 |
Household Size by Marriage Status in Belle Prairie City
Out of a total of 20 households in Belle Prairie City, 16 (80.0%) are family households, while 4 (20.0%) are nonfamily households. The most numerous type of family households are 2-person households, comprising 10, and the most common type of nonfamily households are 1-person households, comprising 4.
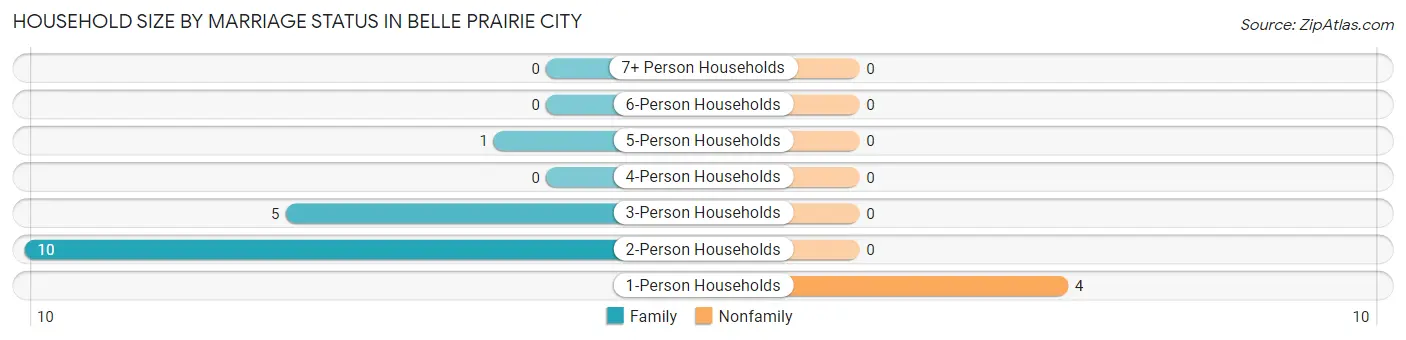
| Household Size | Family Households | Nonfamily Households |
| 1-Person Households | - | 4 (20.0%) |
| 2-Person Households | 10 (50.0%) | 0 (0.0%) |
| 3-Person Households | 5 (25.0%) | 0 (0.0%) |
| 4-Person Households | 0 (0.0%) | 0 (0.0%) |
| 5-Person Households | 1 (5.0%) | 0 (0.0%) |
| 6-Person Households | 0 (0.0%) | 0 (0.0%) |
| 7+ Person Households | 0 (0.0%) | 0 (0.0%) |
| Total | 16 (80.0%) | 4 (20.0%) |
Female Fertility in Belle Prairie City
Fertility by Age in Belle Prairie City
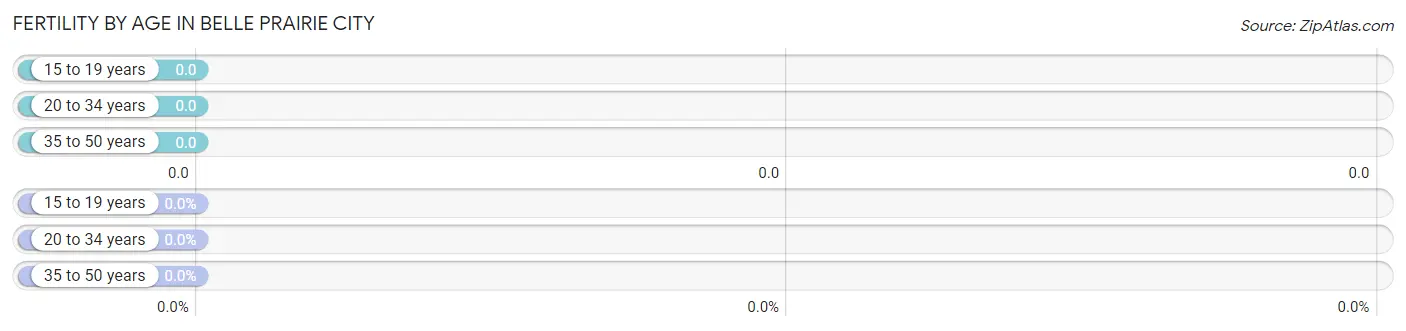
| Age Bracket | Women with Births | Births / 1,000 Women |
| 15 to 19 years | 0 (0.0%) | 0.0 |
| 20 to 34 years | 0 (0.0%) | 0.0 |
| 35 to 50 years | 0 (0.0%) | 0.0 |
| Total | 0 (0.0%) | 0.0 |
Fertility by Age by Marriage Status in Belle Prairie City
| Age Bracket | Married | Unmarried |
| 15 to 19 years | 0 (0.0%) | 0 (0.0%) |
| 20 to 34 years | 0 (0.0%) | 0 (0.0%) |
| 35 to 50 years | 0 (0.0%) | 0 (0.0%) |
| Total | 0 (0.0%) | 0 (0.0%) |
Fertility by Education in Belle Prairie City
| Educational Attainment | Women with Births | Births / 1,000 Women |
| Less than High School | 0 (0.0%) | 0.0 |
| High School Diploma | 0 (0.0%) | 0.0 |
| College or Associate's Degree | 0 (0.0%) | 0.0 |
| Bachelor's Degree | 0 (0.0%) | 0.0 |
| Graduate Degree | 0 (0.0%) | 0.0 |
| Total | 0 (0.0%) | 0.0 |
Fertility by Education by Marriage Status in Belle Prairie City
| Educational Attainment | Married | Unmarried |
| Less than High School | 0 (0.0%) | 0 (0.0%) |
| High School Diploma | 0 (0.0%) | 0 (0.0%) |
| College or Associate's Degree | 0 (0.0%) | 0 (0.0%) |
| Bachelor's Degree | 0 (0.0%) | 0 (0.0%) |
| Graduate Degree | 0 (0.0%) | 0 (0.0%) |
| Total | 0 (0.0%) | 0 (0.0%) |
Income in Belle Prairie City
Income Overview in Belle Prairie City
| Characteristic | Number | Measure |
| Per Capita Income | 56 | $31,807 |
| Median Family Income | 16 | $0 |
| Mean Family Income | 16 | $63,638 |
| Median Household Income | 20 | $0 |
| Mean Household Income | 20 | $66,330 |
| Income Deficit | 16 | $0 |
| Wage / Income Gap (%) | 56 | 45.34% |
| Wage / Income Gap ($) | 56 | 54.66¢ per $1 |
| Gini / Inequality Index | 56 | 0.38 |
Earnings by Sex in Belle Prairie City
Average Earnings in Belle Prairie City are $53,750, $69,375 for men and $37,917 for women, a difference of 45.3%.
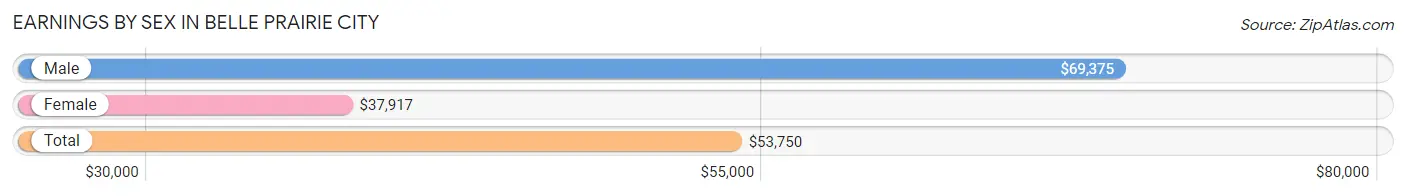
| Sex | Number | Average Earnings |
| Male | 17 (60.7%) | $69,375 |
| Female | 11 (39.3%) | $37,917 |
| Total | 28 (100.0%) | $53,750 |
Earnings by Sex by Income Bracket in Belle Prairie City
The most common earnings brackets in Belle Prairie City are $65,000 to $74,999 for men (6 | 35.3%) and $10,000 to $12,499 for women (3 | 27.3%).
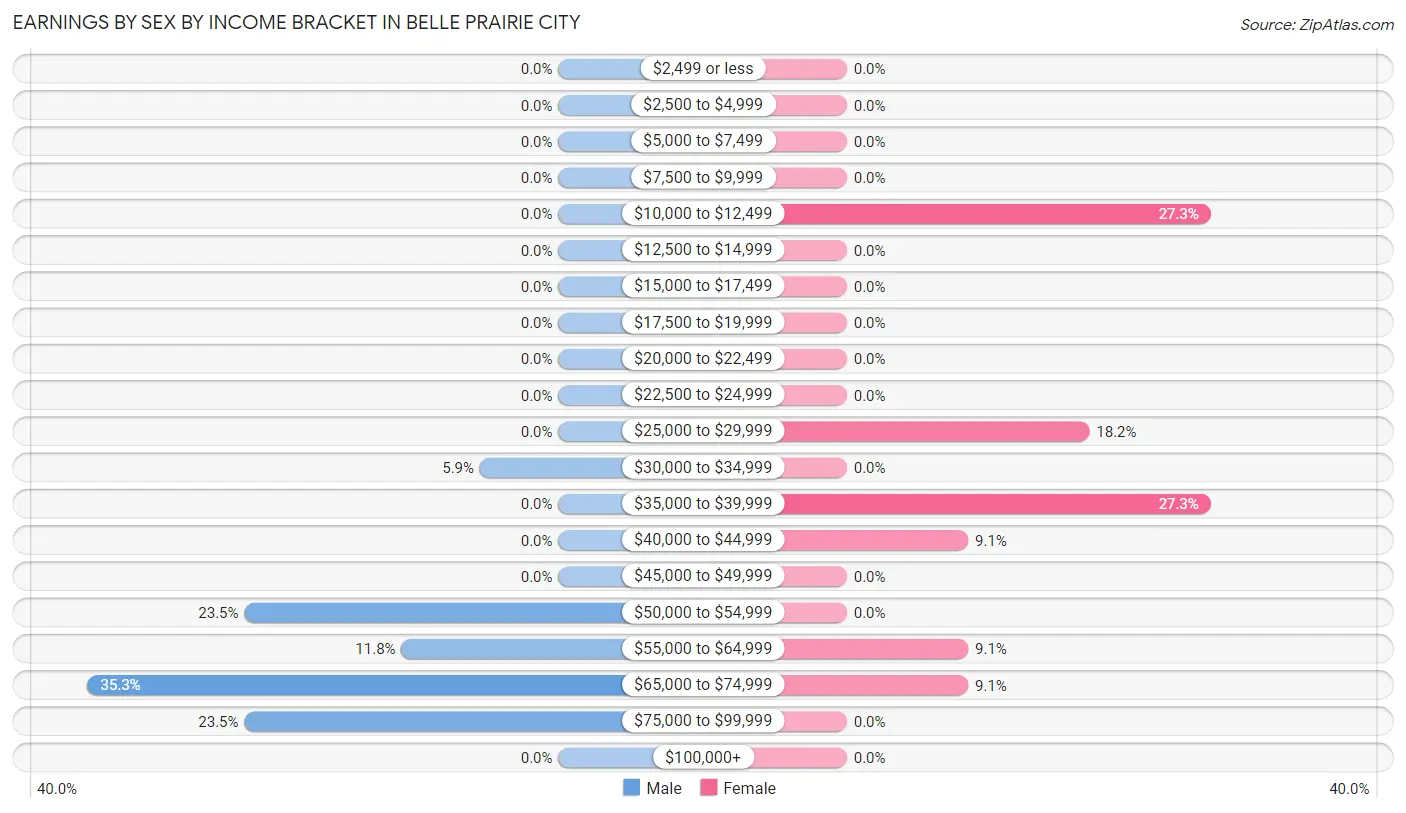
| Income | Male | Female |
| $2,499 or less | 0 (0.0%) | 0 (0.0%) |
| $2,500 to $4,999 | 0 (0.0%) | 0 (0.0%) |
| $5,000 to $7,499 | 0 (0.0%) | 0 (0.0%) |
| $7,500 to $9,999 | 0 (0.0%) | 0 (0.0%) |
| $10,000 to $12,499 | 0 (0.0%) | 3 (27.3%) |
| $12,500 to $14,999 | 0 (0.0%) | 0 (0.0%) |
| $15,000 to $17,499 | 0 (0.0%) | 0 (0.0%) |
| $17,500 to $19,999 | 0 (0.0%) | 0 (0.0%) |
| $20,000 to $22,499 | 0 (0.0%) | 0 (0.0%) |
| $22,500 to $24,999 | 0 (0.0%) | 0 (0.0%) |
| $25,000 to $29,999 | 0 (0.0%) | 2 (18.2%) |
| $30,000 to $34,999 | 1 (5.9%) | 0 (0.0%) |
| $35,000 to $39,999 | 0 (0.0%) | 3 (27.3%) |
| $40,000 to $44,999 | 0 (0.0%) | 1 (9.1%) |
| $45,000 to $49,999 | 0 (0.0%) | 0 (0.0%) |
| $50,000 to $54,999 | 4 (23.5%) | 0 (0.0%) |
| $55,000 to $64,999 | 2 (11.8%) | 1 (9.1%) |
| $65,000 to $74,999 | 6 (35.3%) | 1 (9.1%) |
| $75,000 to $99,999 | 4 (23.5%) | 0 (0.0%) |
| $100,000+ | 0 (0.0%) | 0 (0.0%) |
| Total | 17 (100.0%) | 11 (100.0%) |
Earnings by Sex by Educational Attainment in Belle Prairie City
Average earnings in Belle Prairie City are $69,375 for men and $39,167 for women, a difference of 43.5%. Men with an educational attainment of high school diploma enjoy the highest average annual earnings of $56,250, while those with high school diploma education earn the least with $56,250. Women with an educational attainment of college or associate's degree earn the most with the average annual earnings of $39,167, while those with college or associate's degree education have the smallest earnings of $39,167.
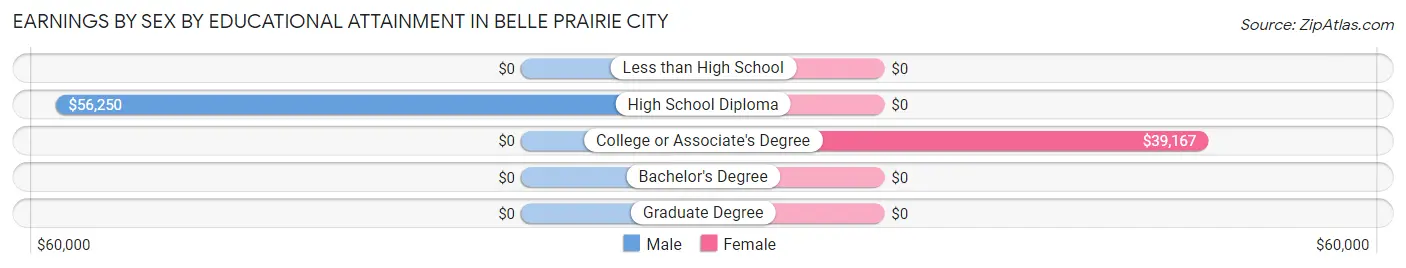
| Educational Attainment | Male Income | Female Income |
| Less than High School | - | - |
| High School Diploma | $56,250 | $0 |
| College or Associate's Degree | - | - |
| Bachelor's Degree | - | - |
| Graduate Degree | - | - |
| Total | $69,375 | $39,167 |
Family Income in Belle Prairie City
Family Income Brackets in Belle Prairie City
According to the Belle Prairie City family income data, there are 6 families falling into the $35,000 to $49,999 income range, which is the most common income bracket and makes up 37.5% of all families.
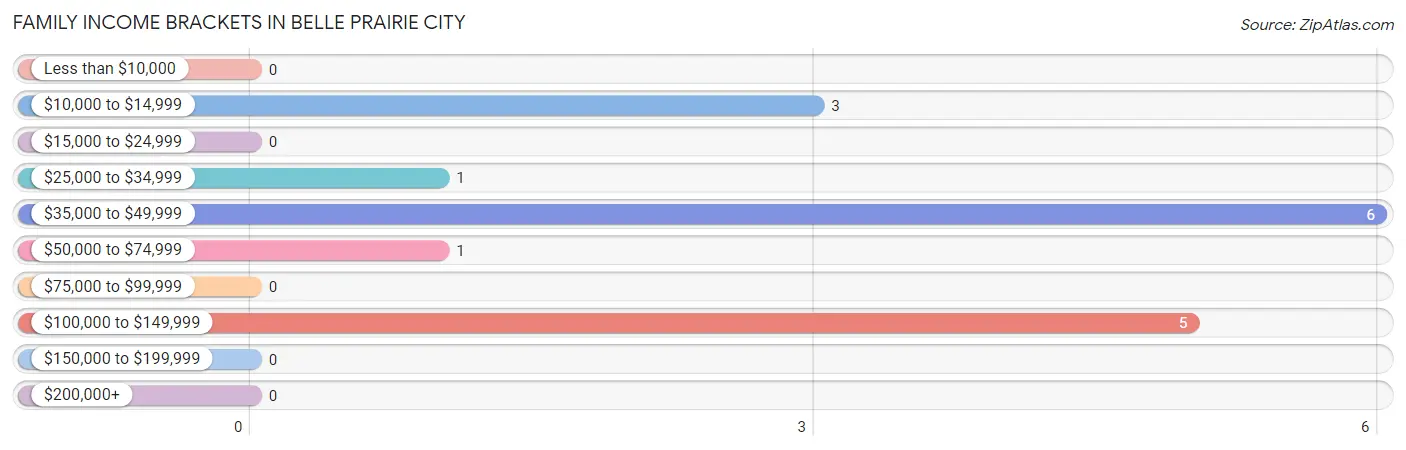
| Income Bracket | # Families | % Families |
| Less than $10,000 | 0 | 0.0% |
| $10,000 to $14,999 | 3 | 18.8% |
| $15,000 to $24,999 | 0 | 0.0% |
| $25,000 to $34,999 | 1 | 6.3% |
| $35,000 to $49,999 | 6 | 37.5% |
| $50,000 to $74,999 | 1 | 6.3% |
| $75,000 to $99,999 | 0 | 0.0% |
| $100,000 to $149,999 | 5 | 31.3% |
| $150,000 to $199,999 | 0 | 0.0% |
| $200,000+ | 0 | 0.0% |
Family Income by Famaliy Size in Belle Prairie City
| Income Bracket | # Families | Median Income |
| 2-Person Families | 13 (81.2%) | $0 |
| 3-Person Families | 2 (12.5%) | $0 |
| 4-Person Families | 0 (0.0%) | $0 |
| 5-Person Families | 1 (6.2%) | $0 |
| 6-Person Families | 0 (0.0%) | $0 |
| 7+ Person Families | 0 (0.0%) | $0 |
| Total | 16 (100.0%) | $0 |
Family Income by Number of Earners in Belle Prairie City
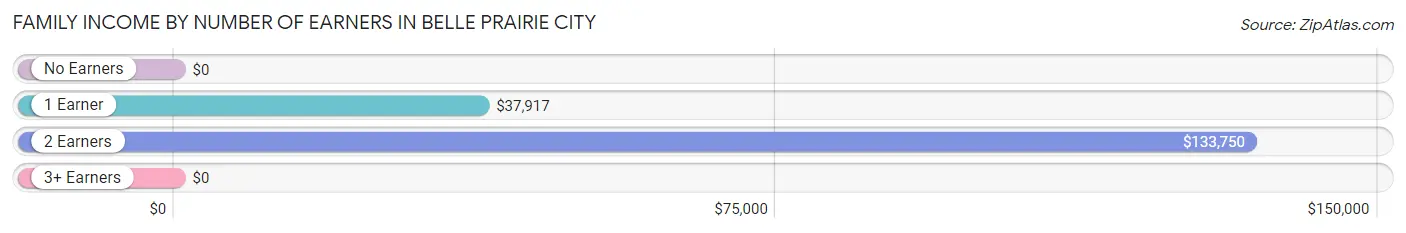
| Number of Earners | # Families | Median Income |
| No Earners | 3 (18.8%) | $0 |
| 1 Earner | 9 (56.2%) | $37,917 |
| 2 Earners | 4 (25.0%) | $133,750 |
| 3+ Earners | 0 (0.0%) | $0 |
| Total | 16 (100.0%) | $0 |
Household Income in Belle Prairie City
Household Income Brackets in Belle Prairie City
With 5 households falling in the category, the $100,000 to $149,999 income range is the most frequent in Belle Prairie City, accounting for 25.0% of all households.
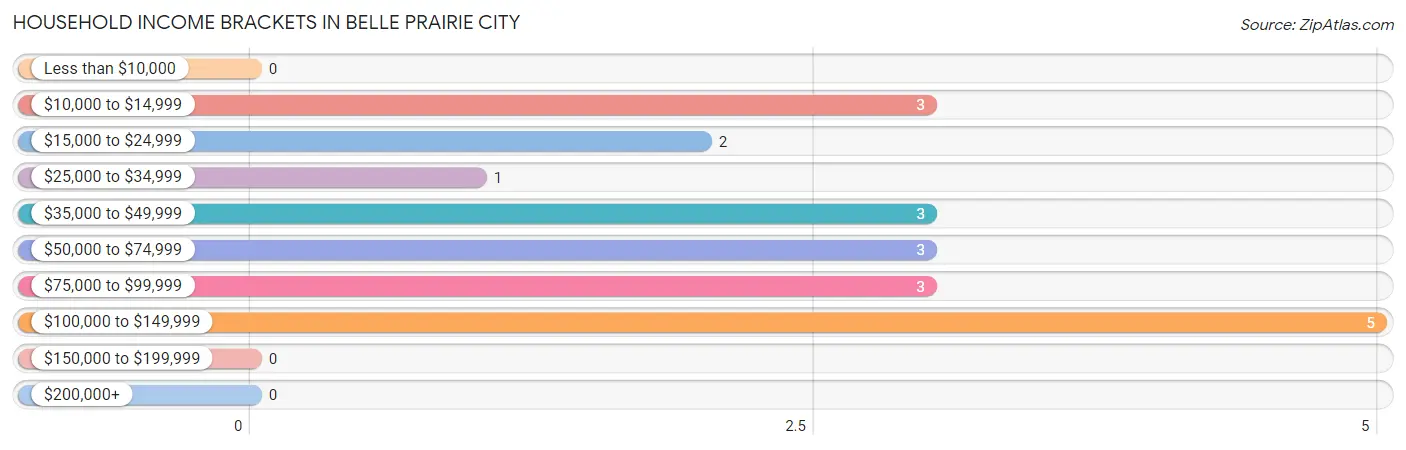
| Income Bracket | # Households | % Households |
| Less than $10,000 | 0 | 0.0% |
| $10,000 to $14,999 | 3 | 15.0% |
| $15,000 to $24,999 | 2 | 10.0% |
| $25,000 to $34,999 | 1 | 5.0% |
| $35,000 to $49,999 | 3 | 15.0% |
| $50,000 to $74,999 | 3 | 15.0% |
| $75,000 to $99,999 | 3 | 15.0% |
| $100,000 to $149,999 | 5 | 25.0% |
| $150,000 to $199,999 | 0 | 0.0% |
| $200,000+ | 0 | 0.0% |
Household Income by Householder Age in Belle Prairie City
The median household income in Belle Prairie City is $0, with the highest median household income of $123,750 found in the 45 to 64 years age bracket for the primary householder. A total of 7 households (35.0%) fall into this category. Meanwhile, the 15 to 24 years age bracket for the primary householder has the lowest median household income of $0, with 3 households (15.0%) in this group.
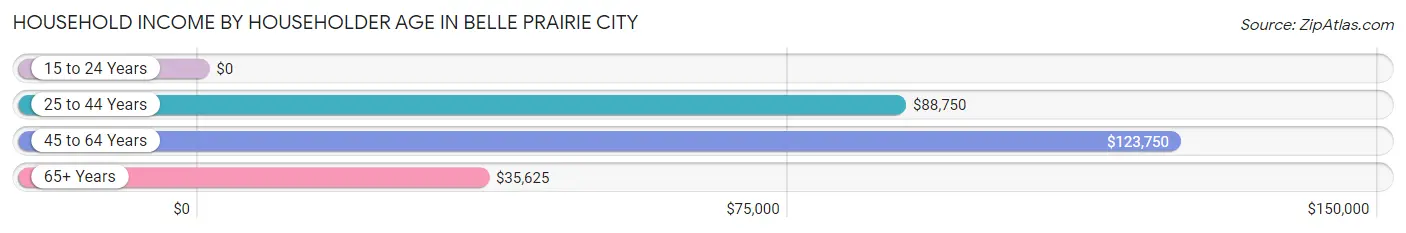
| Income Bracket | # Households | Median Income |
| 15 to 24 Years | 3 (15.0%) | $0 |
| 25 to 44 Years | 5 (25.0%) | $88,750 |
| 45 to 64 Years | 7 (35.0%) | $123,750 |
| 65+ Years | 5 (25.0%) | $35,625 |
| Total | 20 (100.0%) | $0 |
Poverty in Belle Prairie City
Income Below Poverty by Sex and Age in Belle Prairie City
With 11.1% poverty level for males and 44.8% for females among the residents of Belle Prairie City, under 5 year old males and 5 year old females are the most vulnerable to poverty, with 1 males (100.0%) and 2 females (100.0%) in their respective age groups living below the poverty level.
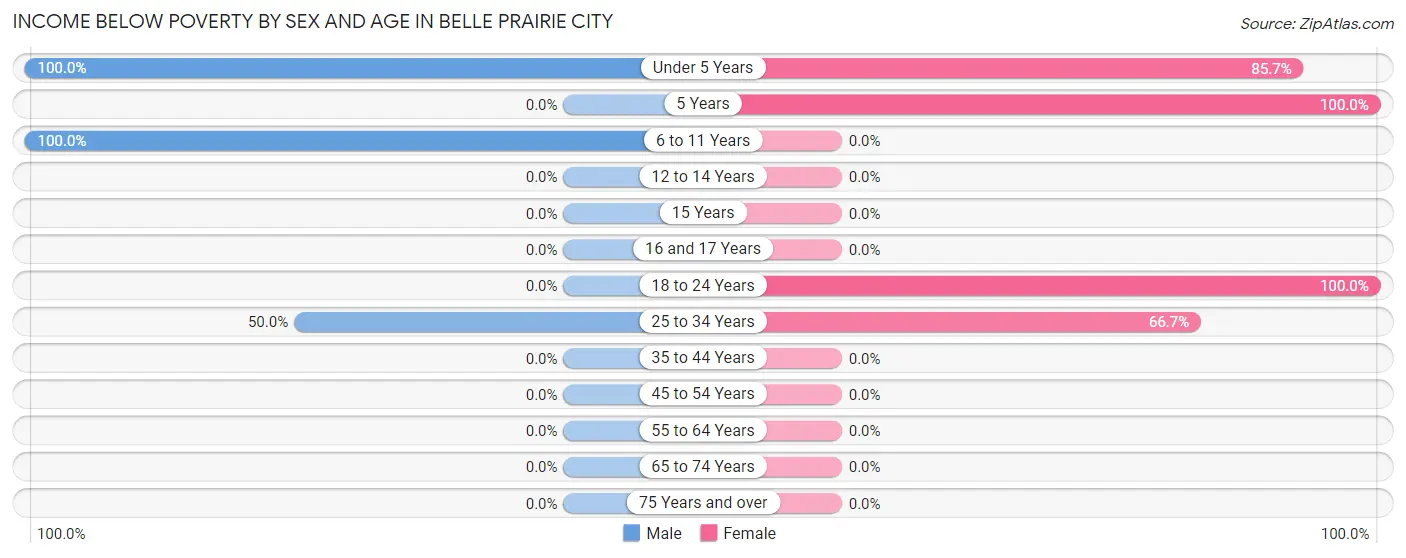
| Age Bracket | Male | Female |
| Under 5 Years | 1 (100.0%) | 6 (85.7%) |
| 5 Years | 0 (0.0%) | 2 (100.0%) |
| 6 to 11 Years | 1 (100.0%) | 0 (0.0%) |
| 12 to 14 Years | 0 (0.0%) | 0 (0.0%) |
| 15 Years | 0 (0.0%) | 0 (0.0%) |
| 16 and 17 Years | 0 (0.0%) | 0 (0.0%) |
| 18 to 24 Years | 0 (0.0%) | 3 (100.0%) |
| 25 to 34 Years | 1 (50.0%) | 2 (66.7%) |
| 35 to 44 Years | 0 (0.0%) | 0 (0.0%) |
| 45 to 54 Years | 0 (0.0%) | 0 (0.0%) |
| 55 to 64 Years | 0 (0.0%) | 0 (0.0%) |
| 65 to 74 Years | 0 (0.0%) | 0 (0.0%) |
| 75 Years and over | 0 (0.0%) | 0 (0.0%) |
| Total | 3 (11.1%) | 13 (44.8%) |
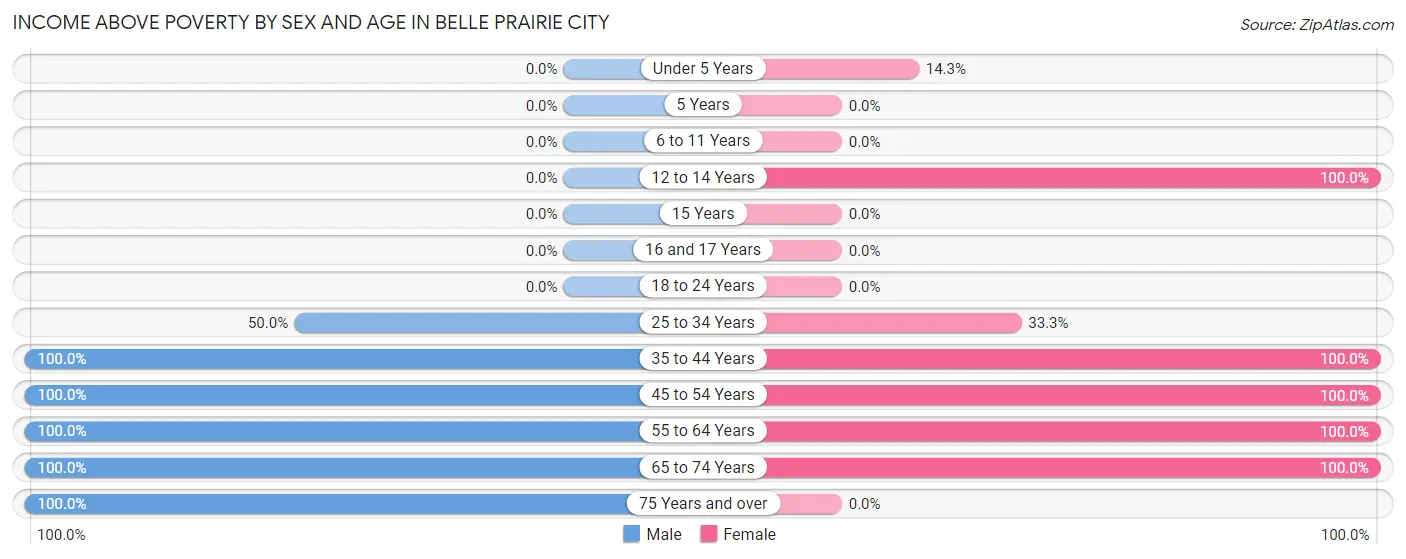
Income Above Poverty by Sex and Age in Belle Prairie City
According to the poverty statistics in Belle Prairie City, males aged 35 to 44 years and females aged 12 to 14 years are the age groups that are most secure financially, with 100.0% of males and 100.0% of females in these age groups living above the poverty line.
| Age Bracket | Male | Female |
| Under 5 Years | 0 (0.0%) | 1 (14.3%) |
| 5 Years | 0 (0.0%) | 0 (0.0%) |
| 6 to 11 Years | 0 (0.0%) | 0 (0.0%) |
| 12 to 14 Years | 0 (0.0%) | 3 (100.0%) |
| 15 Years | 0 (0.0%) | 0 (0.0%) |
| 16 and 17 Years | 0 (0.0%) | 0 (0.0%) |
| 18 to 24 Years | 0 (0.0%) | 0 (0.0%) |
| 25 to 34 Years | 1 (50.0%) | 1 (33.3%) |
| 35 to 44 Years | 6 (100.0%) | 3 (100.0%) |
| 45 to 54 Years | 4 (100.0%) | 1 (100.0%) |
| 55 to 64 Years | 6 (100.0%) | 4 (100.0%) |
| 65 to 74 Years | 3 (100.0%) | 3 (100.0%) |
| 75 Years and over | 4 (100.0%) | 0 (0.0%) |
| Total | 24 (88.9%) | 16 (55.2%) |
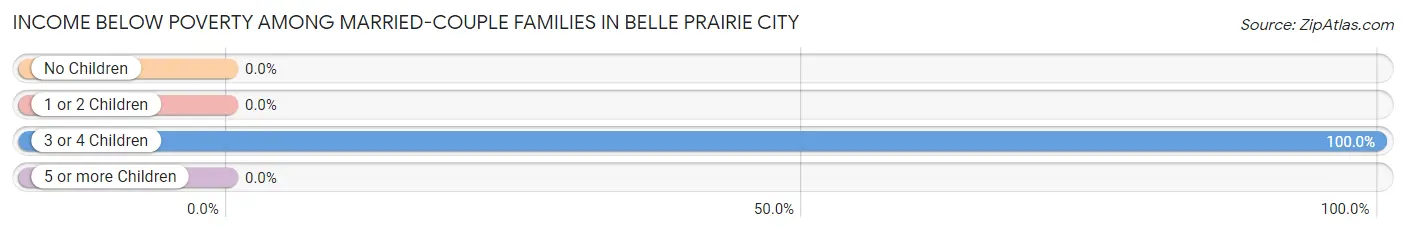
Income Below Poverty Among Married-Couple Families in Belle Prairie City
The poverty statistics for married-couple families in Belle Prairie City show that 10.0% or 1 of the total 10 families live below the poverty line. Families with 3 or 4 children have the highest poverty rate of 100.0%, comprising of 1 families. On the other hand, families with no children have the lowest poverty rate of 0.0%, which includes 0 families.
| Children | Above Poverty | Below Poverty |
| No Children | 8 (100.0%) | 0 (0.0%) |
| 1 or 2 Children | 1 (100.0%) | 0 (0.0%) |
| 3 or 4 Children | 0 (0.0%) | 1 (100.0%) |
| 5 or more Children | 0 (0.0%) | 0 (0.0%) |
| Total | 9 (90.0%) | 1 (10.0%) |
Income Below Poverty Among Single-Parent Households in Belle Prairie City
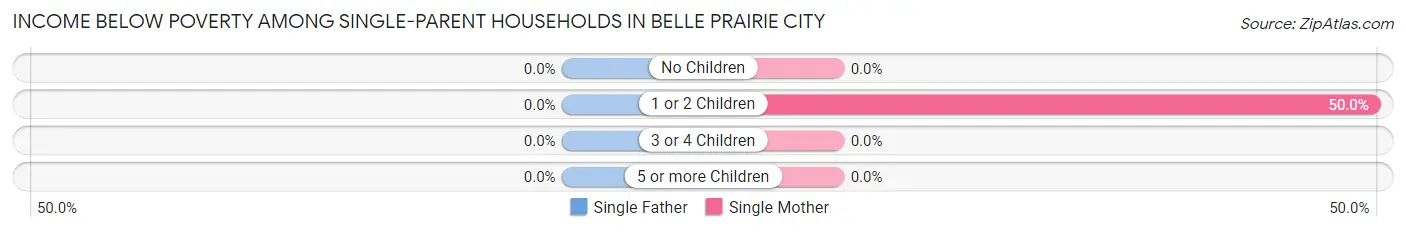
| Children | Single Father | Single Mother |
| No Children | 0 (0.0%) | 0 (0.0%) |
| 1 or 2 Children | 0 (0.0%) | 3 (50.0%) |
| 3 or 4 Children | 0 (0.0%) | 0 (0.0%) |
| 5 or more Children | 0 (0.0%) | 0 (0.0%) |
| Total | 0 (0.0%) | 3 (50.0%) |
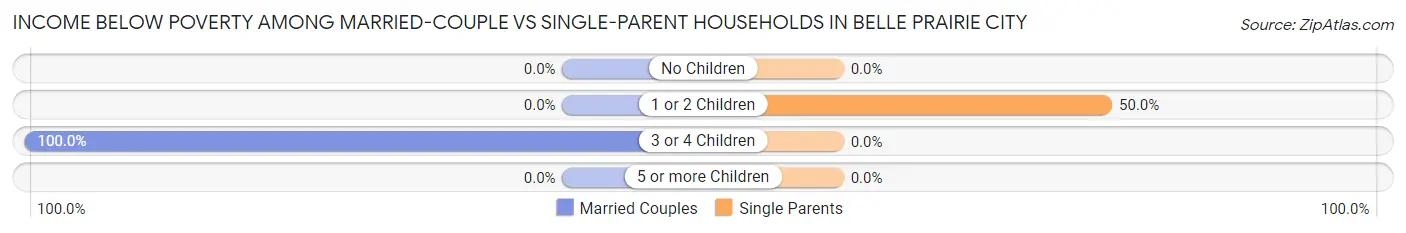
Income Below Poverty Among Married-Couple vs Single-Parent Households in Belle Prairie City
The poverty data for Belle Prairie City shows that 1 of the married-couple family households (10.0%) and 3 of the single-parent households (50.0%) are living below the poverty level. Within the married-couple family households, those with 3 or 4 children have the highest poverty rate, with 1 households (100.0%) falling below the poverty line. Among the single-parent households, those with 1 or 2 children have the highest poverty rate, with 3 household (50.0%) living below poverty.
| Children | Married-Couple Families | Single-Parent Households |
| No Children | 0 (0.0%) | 0 (0.0%) |
| 1 or 2 Children | 0 (0.0%) | 3 (50.0%) |
| 3 or 4 Children | 1 (100.0%) | 0 (0.0%) |
| 5 or more Children | 0 (0.0%) | 0 (0.0%) |
| Total | 1 (10.0%) | 3 (50.0%) |
Employment Characteristics in Belle Prairie City
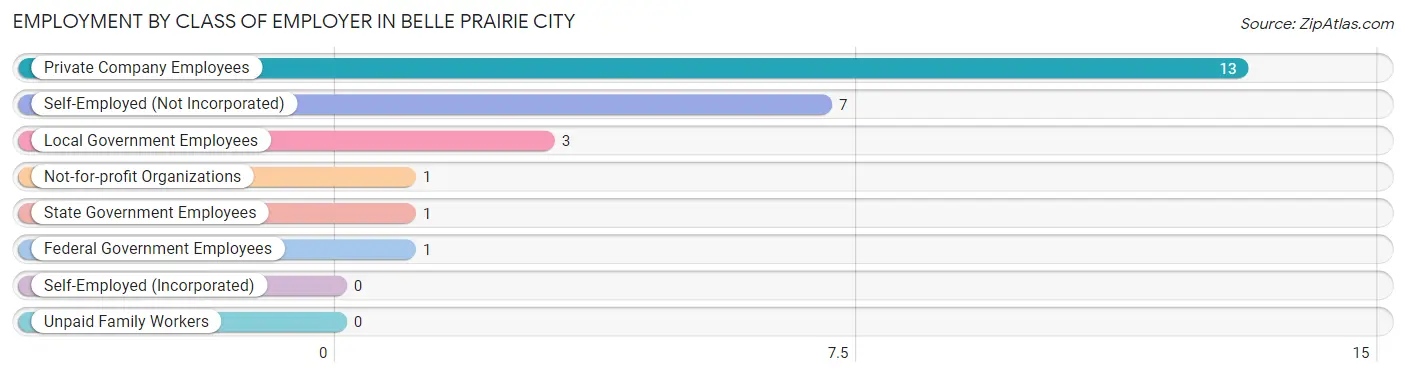
Employment by Class of Employer in Belle Prairie City
Among the 26 employed individuals in Belle Prairie City, private company employees (13 | 50.0%), self-employed (not incorporated) (7 | 26.9%), and local government employees (3 | 11.5%) make up the most common classes of employment.
| Employer Class | # Employees | % Employees |
| Private Company Employees | 13 | 50.0% |
| Self-Employed (Incorporated) | 0 | 0.0% |
| Self-Employed (Not Incorporated) | 7 | 26.9% |
| Not-for-profit Organizations | 1 | 3.8% |
| Local Government Employees | 3 | 11.5% |
| State Government Employees | 1 | 3.8% |
| Federal Government Employees | 1 | 3.8% |
| Unpaid Family Workers | 0 | 0.0% |
| Total | 26 | 100.0% |
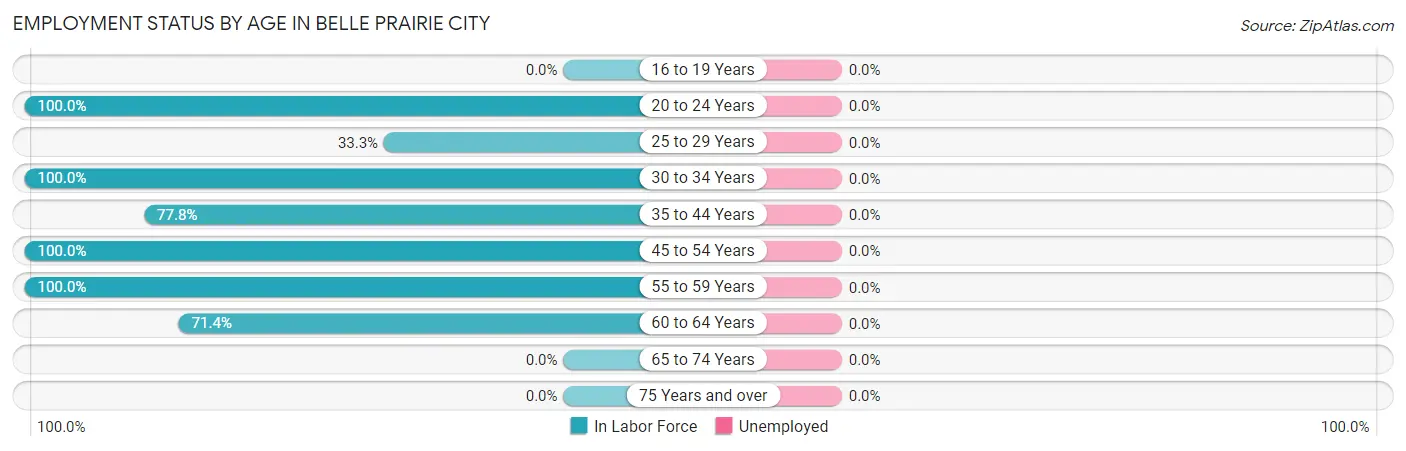
Employment Status by Age in Belle Prairie City
| Age Bracket | In Labor Force | Unemployed |
| 16 to 19 Years | 0 (0.0%) | 0 (0.0%) |
| 20 to 24 Years | 3 (100.0%) | 0 (0.0%) |
| 25 to 29 Years | 1 (33.3%) | 0 (0.0%) |
| 30 to 34 Years | 2 (100.0%) | 0 (0.0%) |
| 35 to 44 Years | 7 (77.8%) | 0 (0.0%) |
| 45 to 54 Years | 5 (100.0%) | 0 (0.0%) |
| 55 to 59 Years | 3 (100.0%) | 0 (0.0%) |
| 60 to 64 Years | 5 (71.4%) | 0 (0.0%) |
| 65 to 74 Years | 0 (0.0%) | 0 (0.0%) |
| 75 Years and over | 0 (0.0%) | 0 (0.0%) |
| Total | 26 (61.9%) | 0 (0.0%) |
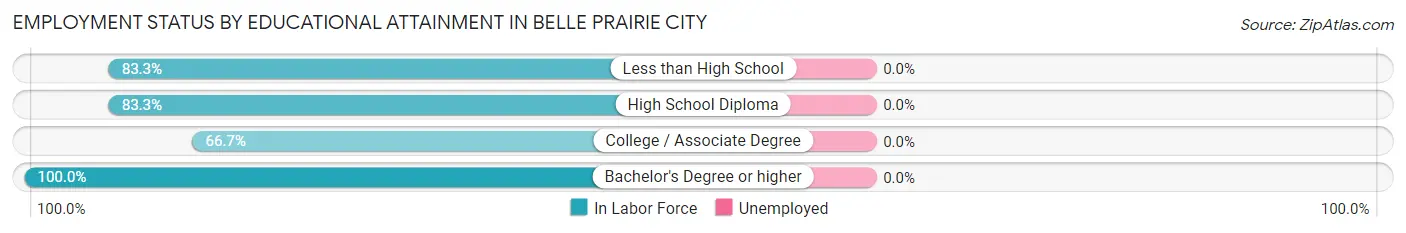
Employment Status by Educational Attainment in Belle Prairie City
| Educational Attainment | In Labor Force | Unemployed |
| Less than High School | 5 (83.3%) | 0 (0.0%) |
| High School Diploma | 10 (83.3%) | 0 (0.0%) |
| College / Associate Degree | 6 (66.7%) | 0 (0.0%) |
| Bachelor's Degree or higher | 2 (100.0%) | 0 (0.0%) |
| Total | 23 (79.3%) | 0 (0.0%) |
Employment Occupations by Sex in Belle Prairie City
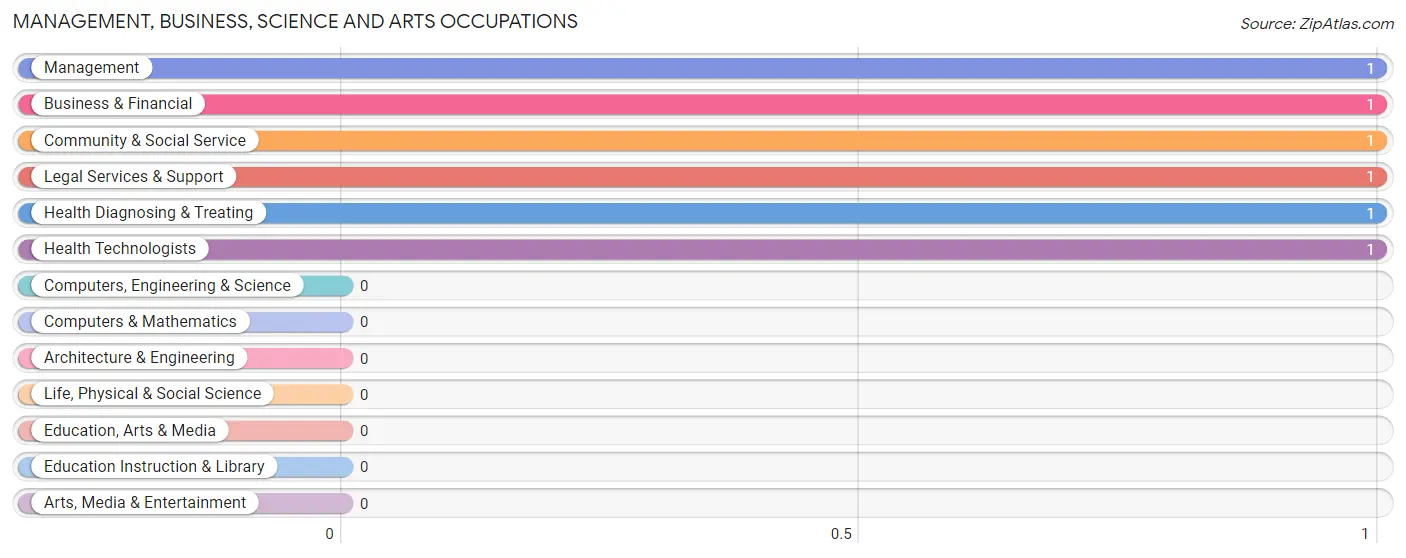
Management, Business, Science and Arts Occupations
The most common Management, Business, Science and Arts occupations in Belle Prairie City are Management (1 | 3.8%), Business & Financial (1 | 3.8%), Community & Social Service (1 | 3.8%), Legal Services & Support (1 | 3.8%), and Health Diagnosing & Treating (1 | 3.8%).
Management, Business, Science and Arts Occupations by Sex
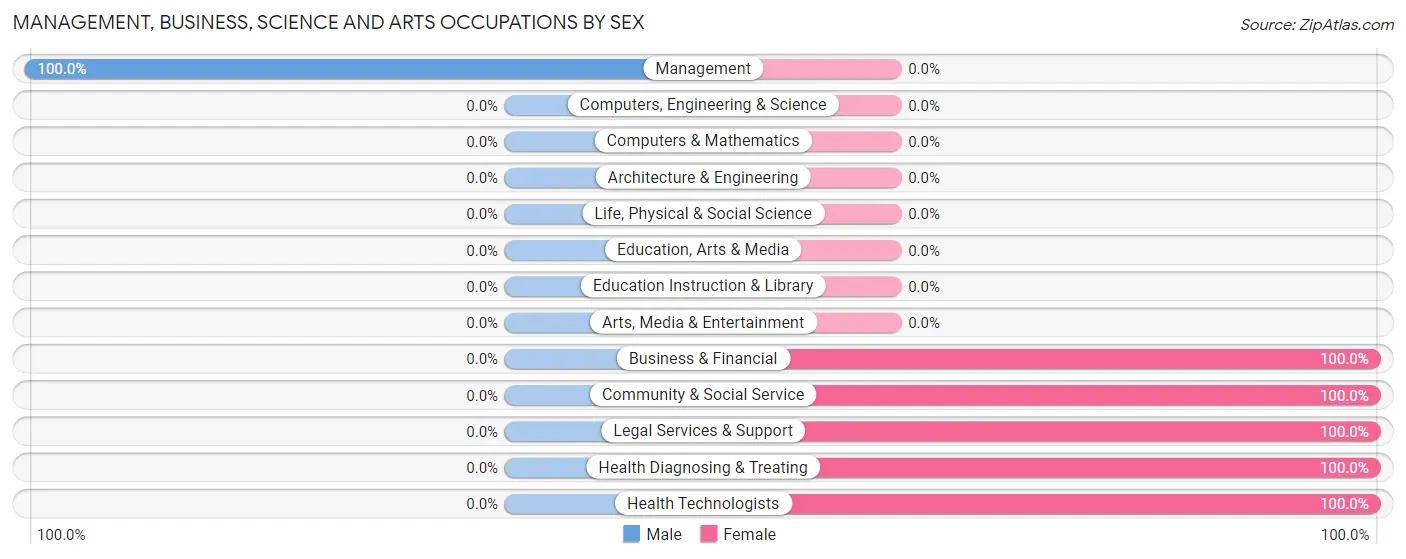
| Occupation | Male | Female |
| Management | 1 (100.0%) | 0 (0.0%) |
| Business & Financial | 0 (0.0%) | 1 (100.0%) |
| Computers, Engineering & Science | 0 (0.0%) | 0 (0.0%) |
| Computers & Mathematics | 0 (0.0%) | 0 (0.0%) |
| Architecture & Engineering | 0 (0.0%) | 0 (0.0%) |
| Life, Physical & Social Science | 0 (0.0%) | 0 (0.0%) |
| Community & Social Service | 0 (0.0%) | 1 (100.0%) |
| Education, Arts & Media | 0 (0.0%) | 0 (0.0%) |
| Legal Services & Support | 0 (0.0%) | 1 (100.0%) |
| Education Instruction & Library | 0 (0.0%) | 0 (0.0%) |
| Arts, Media & Entertainment | 0 (0.0%) | 0 (0.0%) |
| Health Diagnosing & Treating | 0 (0.0%) | 1 (100.0%) |
| Health Technologists | 0 (0.0%) | 1 (100.0%) |
| Total (Category) | 1 (25.0%) | 3 (75.0%) |
| Total (Overall) | 15 (57.7%) | 11 (42.3%) |
Services Occupations
The most common Services occupations in Belle Prairie City are Security & Protection (1 | 3.8%), Law Enforcement (1 | 3.8%), and Food Preparation & Serving (1 | 3.8%).
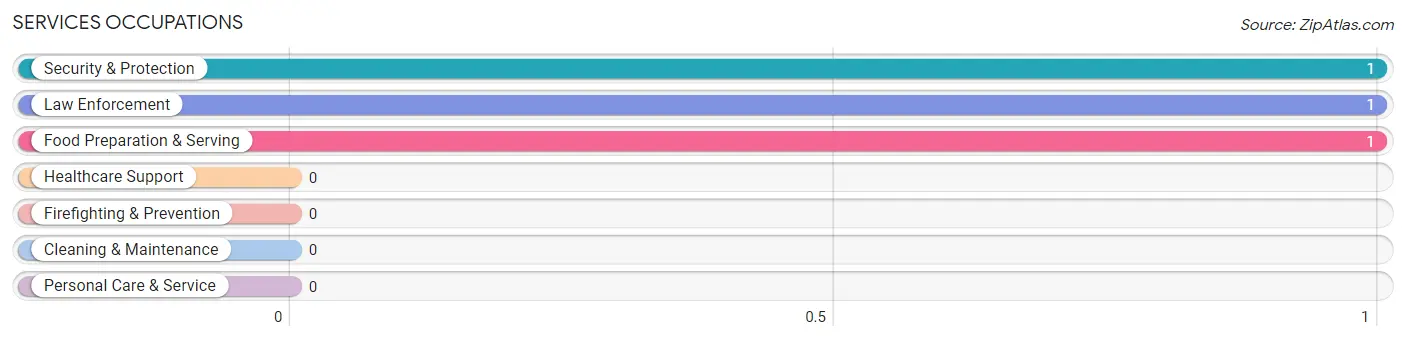
Services Occupations by Sex
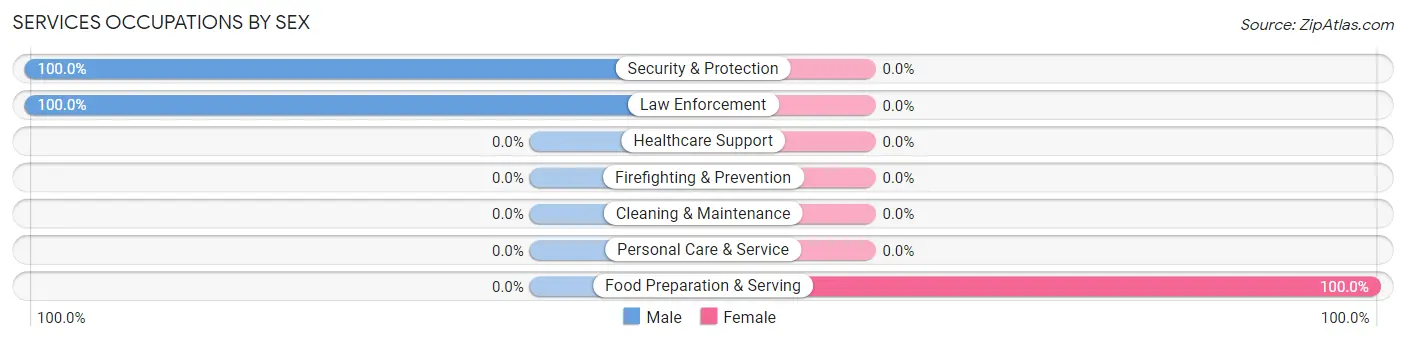
| Occupation | Male | Female |
| Healthcare Support | 0 (0.0%) | 0 (0.0%) |
| Security & Protection | 1 (100.0%) | 0 (0.0%) |
| Firefighting & Prevention | 0 (0.0%) | 0 (0.0%) |
| Law Enforcement | 1 (100.0%) | 0 (0.0%) |
| Food Preparation & Serving | 0 (0.0%) | 1 (100.0%) |
| Cleaning & Maintenance | 0 (0.0%) | 0 (0.0%) |
| Personal Care & Service | 0 (0.0%) | 0 (0.0%) |
| Total (Category) | 1 (50.0%) | 1 (50.0%) |
| Total (Overall) | 15 (57.7%) | 11 (42.3%) |
Sales and Office Occupations
The most common Sales and Office occupations in Belle Prairie City are , and Office & Administration (7 | 26.9%).

Sales and Office Occupations by Sex

| Occupation | Male | Female |
| Sales & Related | 0 (0.0%) | 0 (0.0%) |
| Office & Administration | 0 (0.0%) | 7 (100.0%) |
| Total (Category) | 0 (0.0%) | 7 (100.0%) |
| Total (Overall) | 15 (57.7%) | 11 (42.3%) |
Natural Resources, Construction and Maintenance Occupations
The most common Natural Resources, Construction and Maintenance occupations in Belle Prairie City are Farming, Fishing & Forestry (4 | 15.4%), Construction & Extraction (2 | 7.7%), and Installation, Maintenance & Repair (2 | 7.7%).

Natural Resources, Construction and Maintenance Occupations by Sex

| Occupation | Male | Female |
| Farming, Fishing & Forestry | 4 (100.0%) | 0 (0.0%) |
| Construction & Extraction | 2 (100.0%) | 0 (0.0%) |
| Installation, Maintenance & Repair | 2 (100.0%) | 0 (0.0%) |
| Total (Category) | 8 (100.0%) | 0 (0.0%) |
| Total (Overall) | 15 (57.7%) | 11 (42.3%) |
Production, Transportation and Moving Occupations
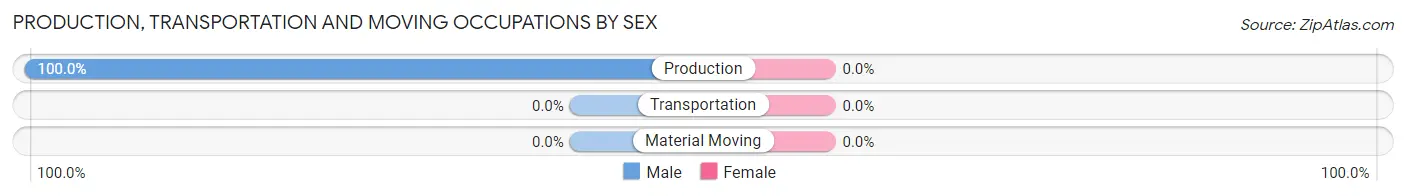
The most common Production, Transportation and Moving occupations in Belle Prairie City are , and Production (5 | 19.2%).
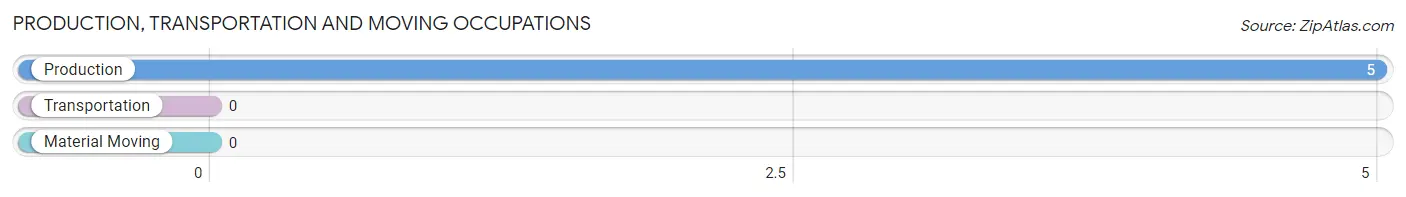
Production, Transportation and Moving Occupations by Sex
| Occupation | Male | Female |
| Production | 5 (100.0%) | 0 (0.0%) |
| Transportation | 0 (0.0%) | 0 (0.0%) |
| Material Moving | 0 (0.0%) | 0 (0.0%) |
| Total (Category) | 5 (100.0%) | 0 (0.0%) |
| Total (Overall) | 15 (57.7%) | 11 (42.3%) |
Employment Industries by Sex in Belle Prairie City
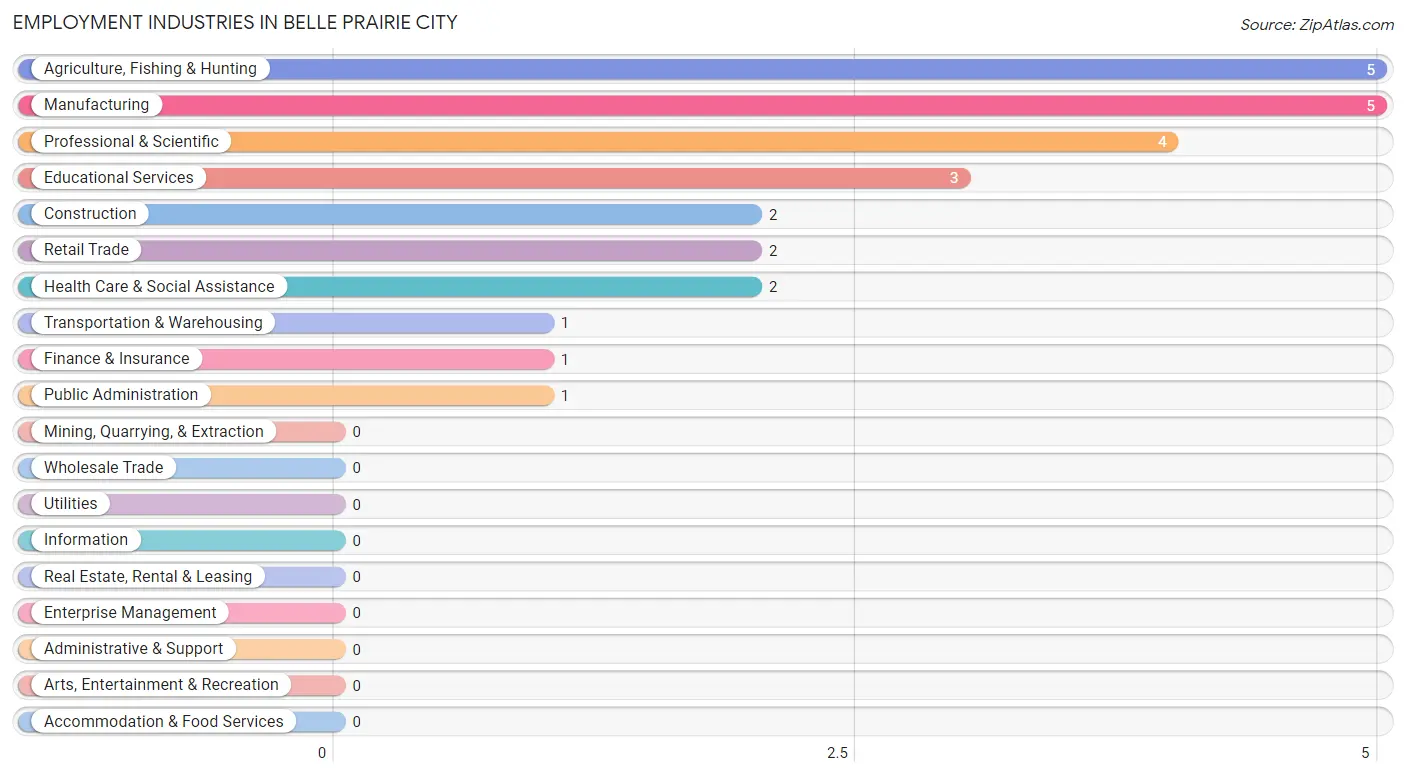
Employment Industries in Belle Prairie City
The major employment industries in Belle Prairie City include Agriculture, Fishing & Hunting (5 | 19.2%), Manufacturing (5 | 19.2%), Professional & Scientific (4 | 15.4%), Educational Services (3 | 11.5%), and Construction (2 | 7.7%).
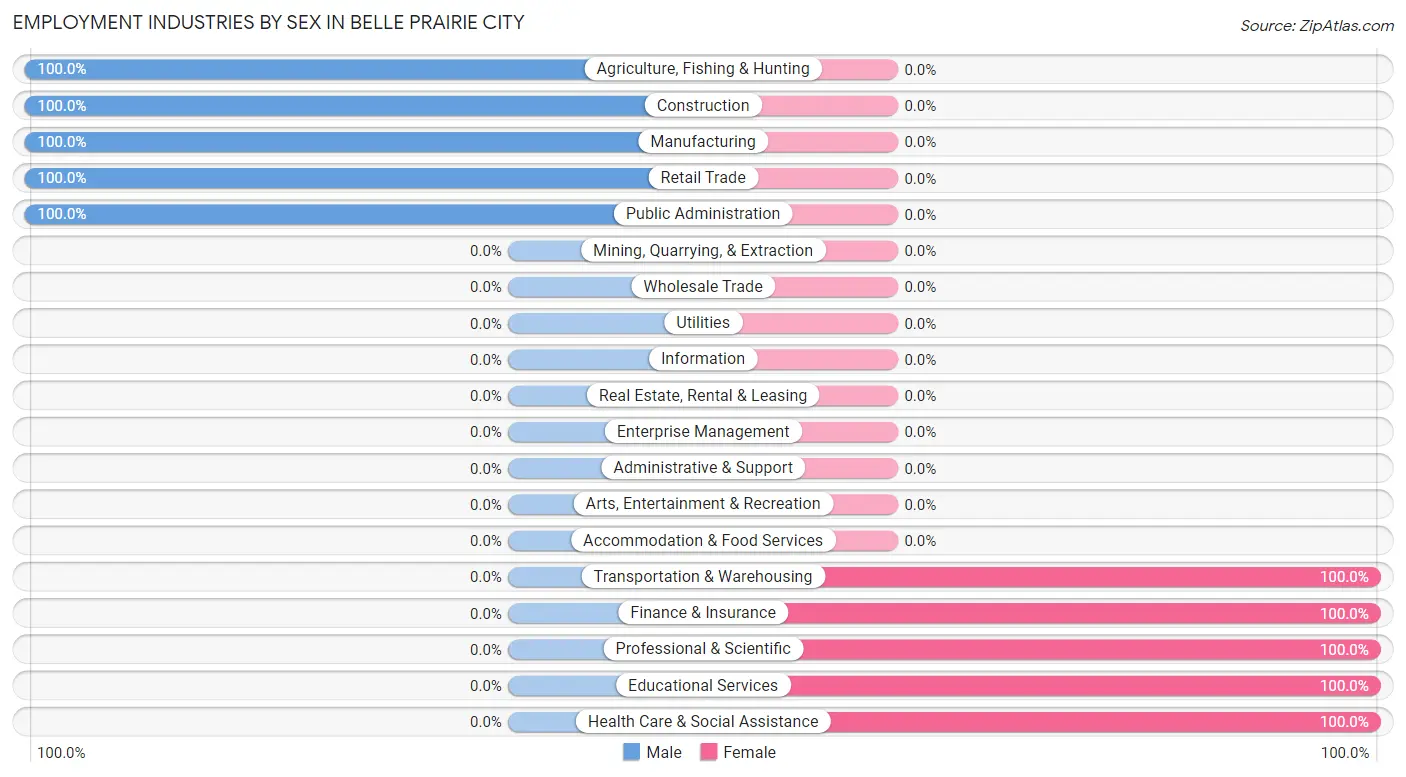
Employment Industries by Sex in Belle Prairie City
The Belle Prairie City industries that see more men than women are Agriculture, Fishing & Hunting (100.0%), Construction (100.0%), and Manufacturing (100.0%), whereas the industries that tend to have a higher number of women are Transportation & Warehousing (100.0%), Finance & Insurance (100.0%), and Professional & Scientific (100.0%).
| Industry | Male | Female |
| Agriculture, Fishing & Hunting | 5 (100.0%) | 0 (0.0%) |
| Mining, Quarrying, & Extraction | 0 (0.0%) | 0 (0.0%) |
| Construction | 2 (100.0%) | 0 (0.0%) |
| Manufacturing | 5 (100.0%) | 0 (0.0%) |
| Wholesale Trade | 0 (0.0%) | 0 (0.0%) |
| Retail Trade | 2 (100.0%) | 0 (0.0%) |
| Transportation & Warehousing | 0 (0.0%) | 1 (100.0%) |
| Utilities | 0 (0.0%) | 0 (0.0%) |
| Information | 0 (0.0%) | 0 (0.0%) |
| Finance & Insurance | 0 (0.0%) | 1 (100.0%) |
| Real Estate, Rental & Leasing | 0 (0.0%) | 0 (0.0%) |
| Professional & Scientific | 0 (0.0%) | 4 (100.0%) |
| Enterprise Management | 0 (0.0%) | 0 (0.0%) |
| Administrative & Support | 0 (0.0%) | 0 (0.0%) |
| Educational Services | 0 (0.0%) | 3 (100.0%) |
| Health Care & Social Assistance | 0 (0.0%) | 2 (100.0%) |
| Arts, Entertainment & Recreation | 0 (0.0%) | 0 (0.0%) |
| Accommodation & Food Services | 0 (0.0%) | 0 (0.0%) |
| Public Administration | 1 (100.0%) | 0 (0.0%) |
| Total | 15 (57.7%) | 11 (42.3%) |
Education in Belle Prairie City
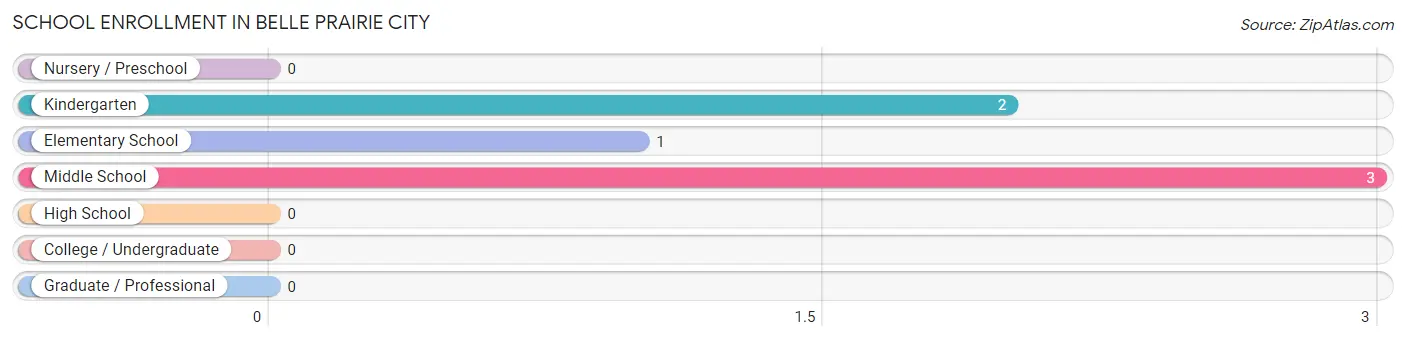
School Enrollment in Belle Prairie City
The most common levels of schooling among the 6 students in Belle Prairie City are middle school (3 | 50.0%), kindergarten (2 | 33.3%), and elementary school (1 | 16.7%).
| School Level | # Students | % Students |
| Nursery / Preschool | 0 | 0.0% |
| Kindergarten | 2 | 33.3% |
| Elementary School | 1 | 16.7% |
| Middle School | 3 | 50.0% |
| High School | 0 | 0.0% |
| College / Undergraduate | 0 | 0.0% |
| Graduate / Professional | 0 | 0.0% |
| Total | 6 | 100.0% |
School Enrollment by Age by Funding Source in Belle Prairie City
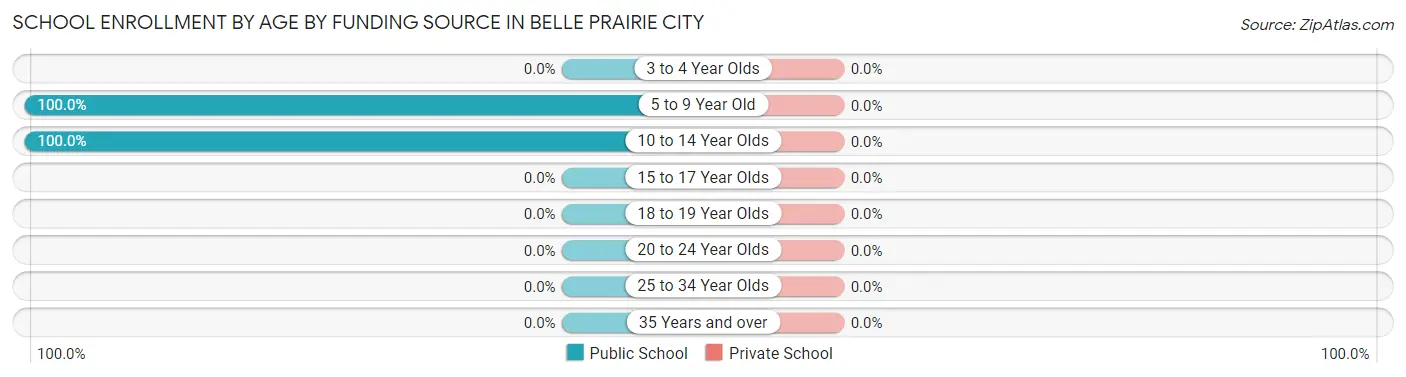
| Age Bracket | Public School | Private School |
| 3 to 4 Year Olds | 0 (0.0%) | 0 (0.0%) |
| 5 to 9 Year Old | 3 (100.0%) | 0 (0.0%) |
| 10 to 14 Year Olds | 3 (100.0%) | 0 (0.0%) |
| 15 to 17 Year Olds | 0 (0.0%) | 0 (0.0%) |
| 18 to 19 Year Olds | 0 (0.0%) | 0 (0.0%) |
| 20 to 24 Year Olds | 0 (0.0%) | 0 (0.0%) |
| 25 to 34 Year Olds | 0 (0.0%) | 0 (0.0%) |
| 35 Years and over | 0 (0.0%) | 0 (0.0%) |
| Total | 6 (100.0%) | 0 (0.0%) |
Educational Attainment by Field of Study in Belle Prairie City
Education (2 | 66.7%), and arts & humanities (1 | 33.3%) are the most common fields of study among 3 individuals in Belle Prairie City who have obtained a bachelor's degree or higher.
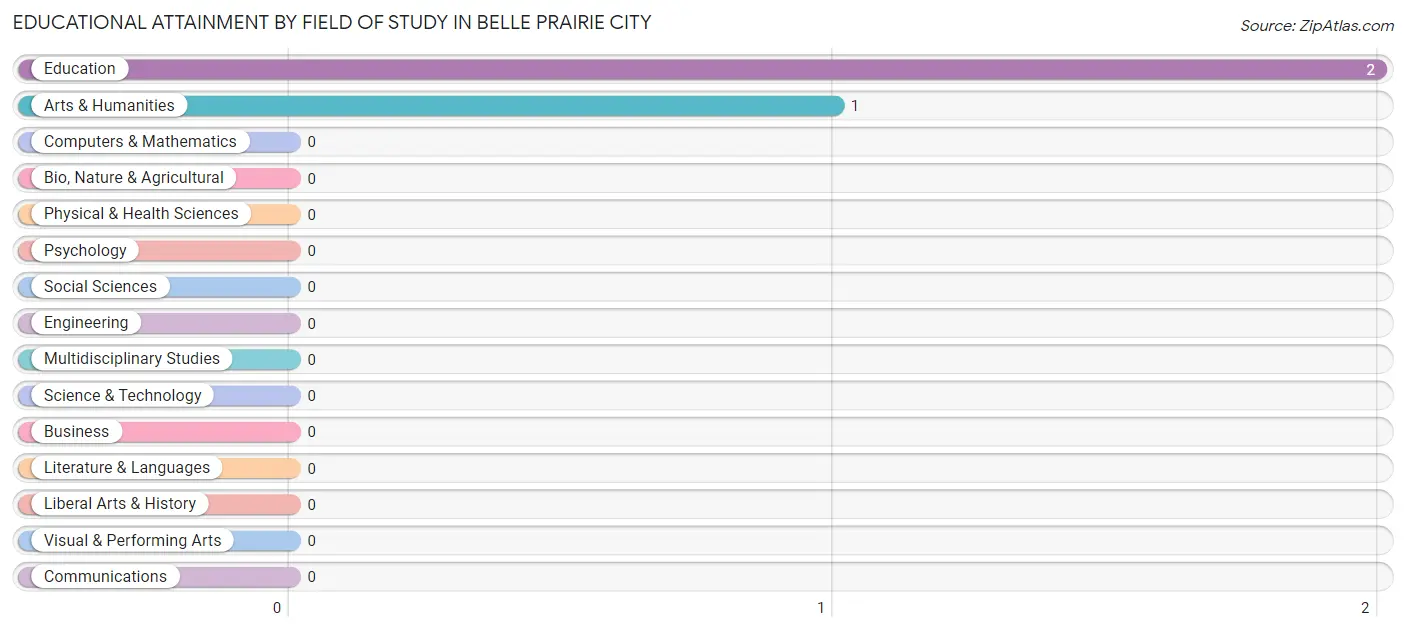
| Field of Study | # Graduates | % Graduates |
| Computers & Mathematics | 0 | 0.0% |
| Bio, Nature & Agricultural | 0 | 0.0% |
| Physical & Health Sciences | 0 | 0.0% |
| Psychology | 0 | 0.0% |
| Social Sciences | 0 | 0.0% |
| Engineering | 0 | 0.0% |
| Multidisciplinary Studies | 0 | 0.0% |
| Science & Technology | 0 | 0.0% |
| Business | 0 | 0.0% |
| Education | 2 | 66.7% |
| Literature & Languages | 0 | 0.0% |
| Liberal Arts & History | 0 | 0.0% |
| Visual & Performing Arts | 0 | 0.0% |
| Communications | 0 | 0.0% |
| Arts & Humanities | 1 | 33.3% |
| Total | 3 | 100.0% |
Transportation & Commute in Belle Prairie City
Vehicle Availability by Sex in Belle Prairie City
The most prevalent vehicle ownership categories in Belle Prairie City are males with 2 vehicles (9, accounting for 60.0%) and females with 2 vehicles (5, making up 81.8%).
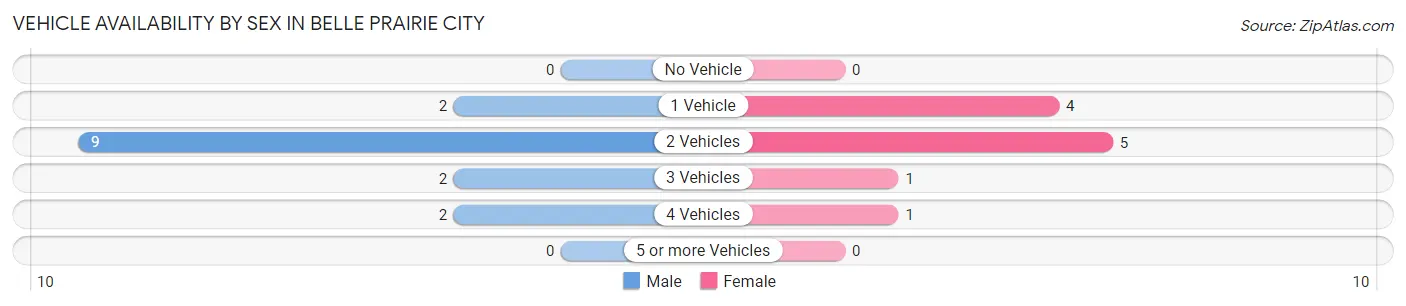
| Vehicles Available | Male | Female |
| No Vehicle | 0 (0.0%) | 0 (0.0%) |
| 1 Vehicle | 2 (13.3%) | 4 (36.4%) |
| 2 Vehicles | 9 (60.0%) | 5 (45.5%) |
| 3 Vehicles | 2 (13.3%) | 1 (9.1%) |
| 4 Vehicles | 2 (13.3%) | 1 (9.1%) |
| 5 or more Vehicles | 0 (0.0%) | 0 (0.0%) |
| Total | 15 (100.0%) | 11 (100.0%) |
Commute Time in Belle Prairie City
The most frequently occuring commute durations in Belle Prairie City are 15 to 19 minutes (8 commuters, 30.8%), 20 to 24 minutes (8 commuters, 30.8%), and 30 to 34 minutes (4 commuters, 15.4%).
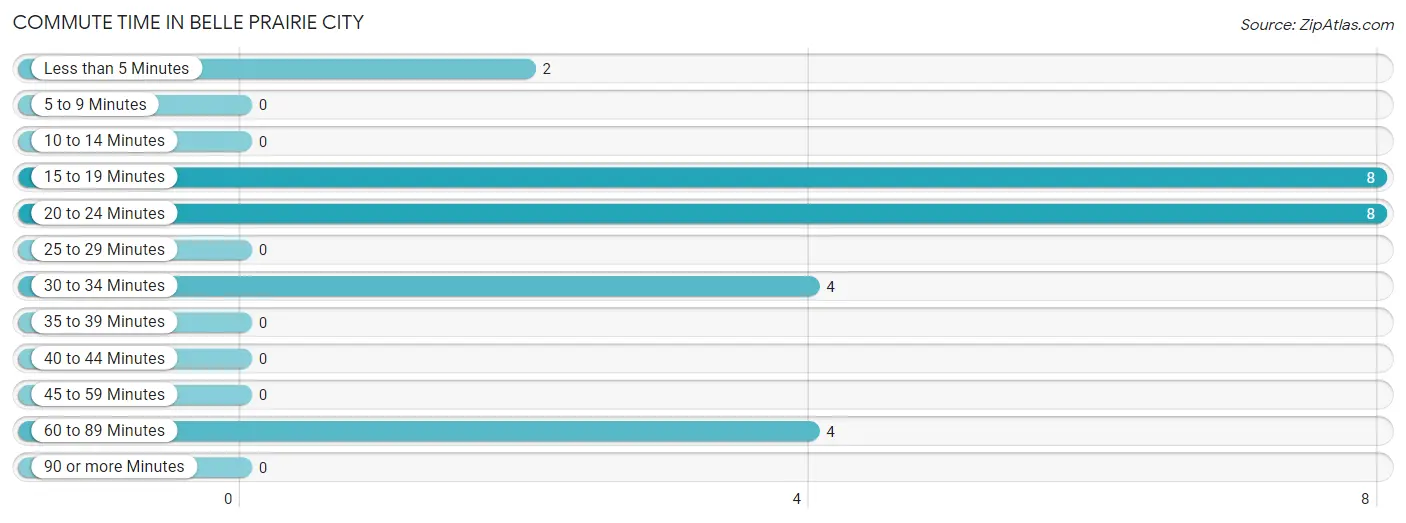
| Commute Time | # Commuters | % Commuters |
| Less than 5 Minutes | 2 | 7.7% |
| 5 to 9 Minutes | 0 | 0.0% |
| 10 to 14 Minutes | 0 | 0.0% |
| 15 to 19 Minutes | 8 | 30.8% |
| 20 to 24 Minutes | 8 | 30.8% |
| 25 to 29 Minutes | 0 | 0.0% |
| 30 to 34 Minutes | 4 | 15.4% |
| 35 to 39 Minutes | 0 | 0.0% |
| 40 to 44 Minutes | 0 | 0.0% |
| 45 to 59 Minutes | 0 | 0.0% |
| 60 to 89 Minutes | 4 | 15.4% |
| 90 or more Minutes | 0 | 0.0% |
Commute Time by Sex in Belle Prairie City
The most common commute times in Belle Prairie City are 20 to 24 minutes (6 commuters, 40.0%) for males and 15 to 19 minutes (8 commuters, 72.7%) for females.
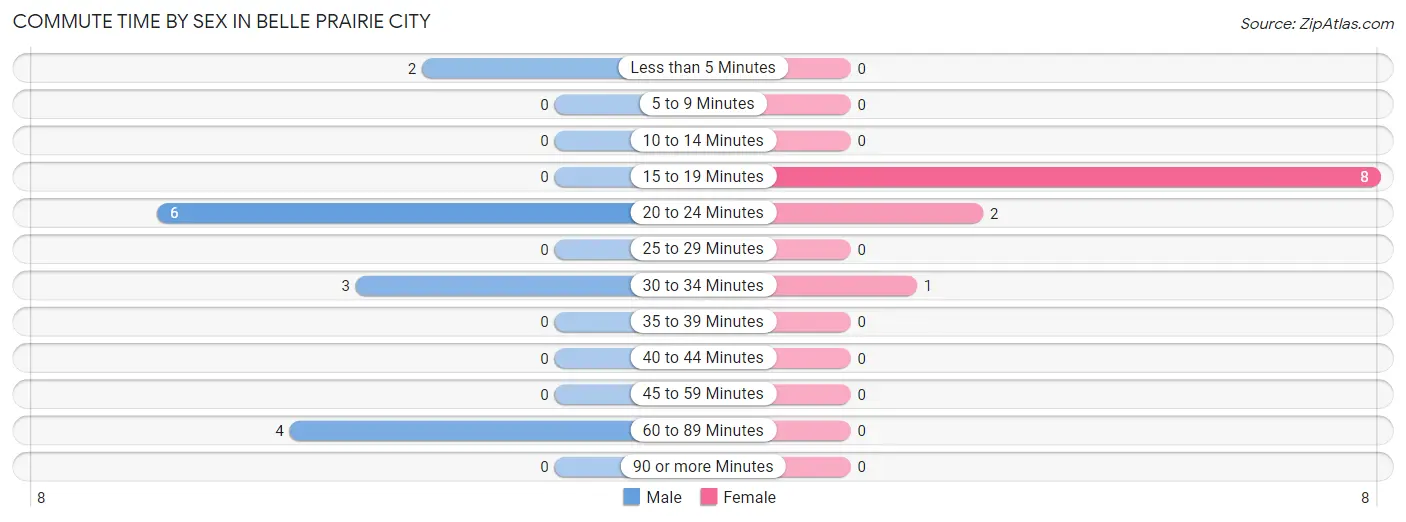
| Commute Time | Male | Female |
| Less than 5 Minutes | 2 (13.3%) | 0 (0.0%) |
| 5 to 9 Minutes | 0 (0.0%) | 0 (0.0%) |
| 10 to 14 Minutes | 0 (0.0%) | 0 (0.0%) |
| 15 to 19 Minutes | 0 (0.0%) | 8 (72.7%) |
| 20 to 24 Minutes | 6 (40.0%) | 2 (18.2%) |
| 25 to 29 Minutes | 0 (0.0%) | 0 (0.0%) |
| 30 to 34 Minutes | 3 (20.0%) | 1 (9.1%) |
| 35 to 39 Minutes | 0 (0.0%) | 0 (0.0%) |
| 40 to 44 Minutes | 0 (0.0%) | 0 (0.0%) |
| 45 to 59 Minutes | 0 (0.0%) | 0 (0.0%) |
| 60 to 89 Minutes | 4 (26.7%) | 0 (0.0%) |
| 90 or more Minutes | 0 (0.0%) | 0 (0.0%) |
Time of Departure to Work by Sex in Belle Prairie City
The most frequent times of departure to work in Belle Prairie City are 5:30 AM to 5:59 AM (4, 26.7%) for males and 7:30 AM to 7:59 AM (5, 45.5%) for females.
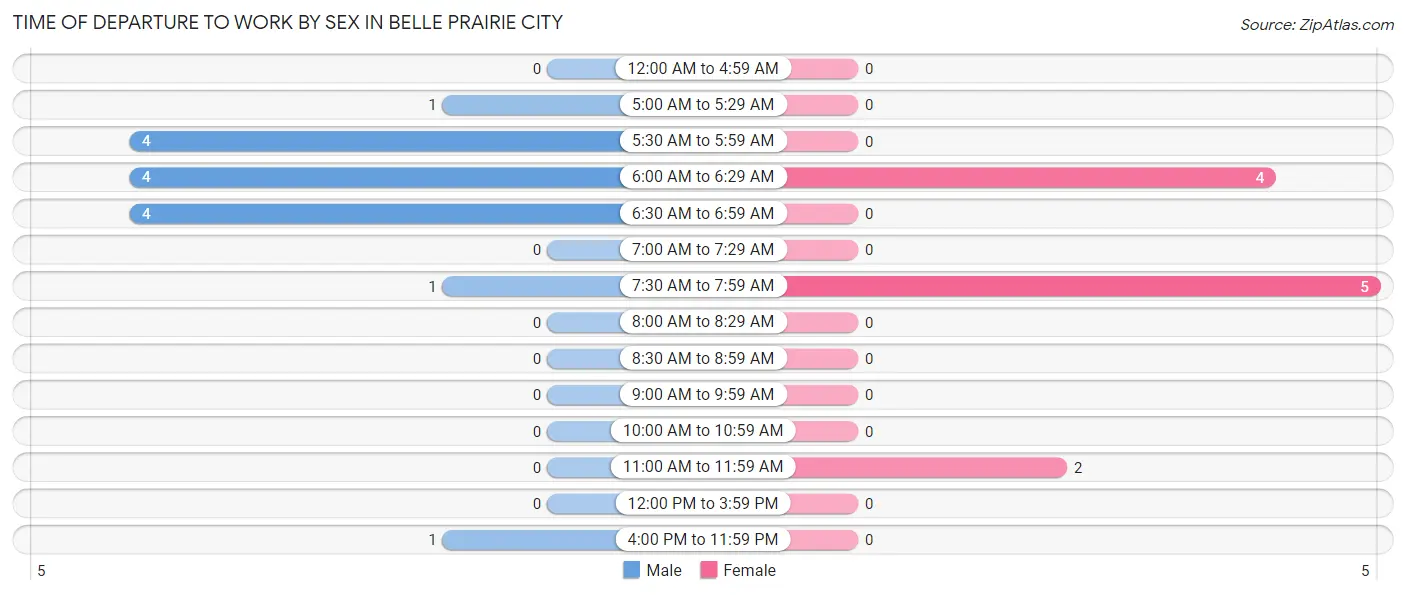
| Time of Departure | Male | Female |
| 12:00 AM to 4:59 AM | 0 (0.0%) | 0 (0.0%) |
| 5:00 AM to 5:29 AM | 1 (6.7%) | 0 (0.0%) |
| 5:30 AM to 5:59 AM | 4 (26.7%) | 0 (0.0%) |
| 6:00 AM to 6:29 AM | 4 (26.7%) | 4 (36.4%) |
| 6:30 AM to 6:59 AM | 4 (26.7%) | 0 (0.0%) |
| 7:00 AM to 7:29 AM | 0 (0.0%) | 0 (0.0%) |
| 7:30 AM to 7:59 AM | 1 (6.7%) | 5 (45.5%) |
| 8:00 AM to 8:29 AM | 0 (0.0%) | 0 (0.0%) |
| 8:30 AM to 8:59 AM | 0 (0.0%) | 0 (0.0%) |
| 9:00 AM to 9:59 AM | 0 (0.0%) | 0 (0.0%) |
| 10:00 AM to 10:59 AM | 0 (0.0%) | 0 (0.0%) |
| 11:00 AM to 11:59 AM | 0 (0.0%) | 2 (18.2%) |
| 12:00 PM to 3:59 PM | 0 (0.0%) | 0 (0.0%) |
| 4:00 PM to 11:59 PM | 1 (6.7%) | 0 (0.0%) |
| Total | 15 (100.0%) | 11 (100.0%) |
Housing Occupancy in Belle Prairie City
Occupancy by Ownership in Belle Prairie City
Of the total 20 dwellings in Belle Prairie City, owner-occupied units account for 20 (100.0%), while renter-occupied units make up 0 (0.0%).
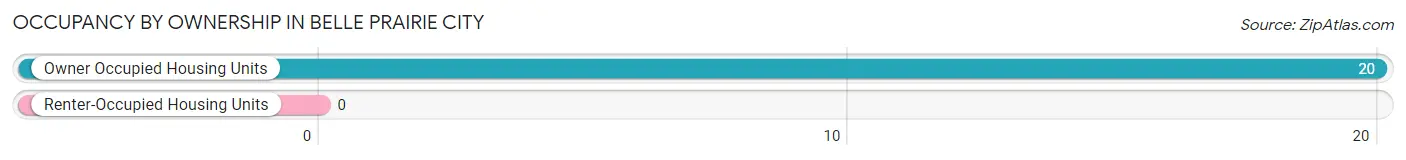
| Occupancy | # Housing Units | % Housing Units |
| Owner Occupied Housing Units | 20 | 100.0% |
| Renter-Occupied Housing Units | 0 | 0.0% |
| Total Occupied Housing Units | 20 | 100.0% |
Occupancy by Household Size in Belle Prairie City
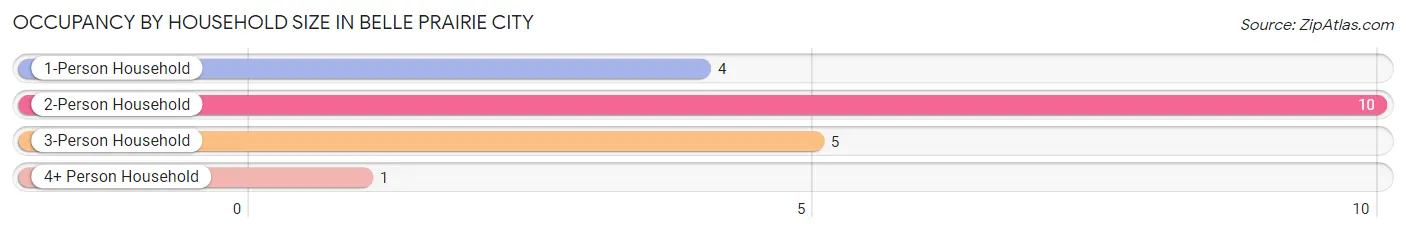
| Household Size | # Housing Units | % Housing Units |
| 1-Person Household | 4 | 20.0% |
| 2-Person Household | 10 | 50.0% |
| 3-Person Household | 5 | 25.0% |
| 4+ Person Household | 1 | 5.0% |
| Total Housing Units | 20 | 100.0% |
Occupancy by Ownership by Household Size in Belle Prairie City
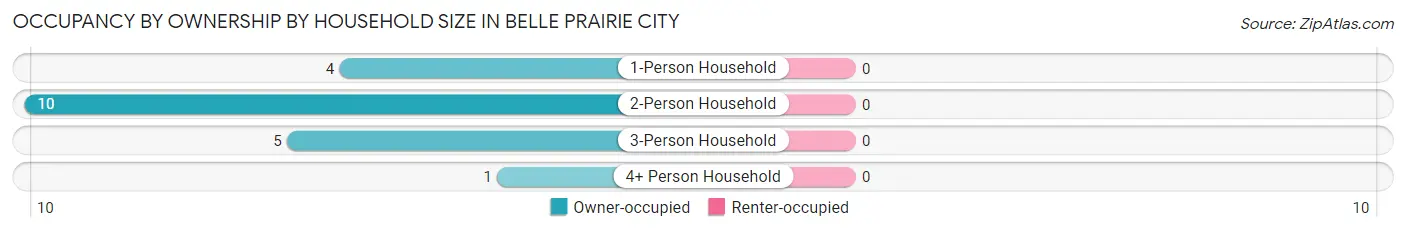
| Household Size | Owner-occupied | Renter-occupied |
| 1-Person Household | 4 (100.0%) | 0 (0.0%) |
| 2-Person Household | 10 (100.0%) | 0 (0.0%) |
| 3-Person Household | 5 (100.0%) | 0 (0.0%) |
| 4+ Person Household | 1 (100.0%) | 0 (0.0%) |
| Total Housing Units | 20 (100.0%) | 0 (0.0%) |
Occupancy by Educational Attainment in Belle Prairie City
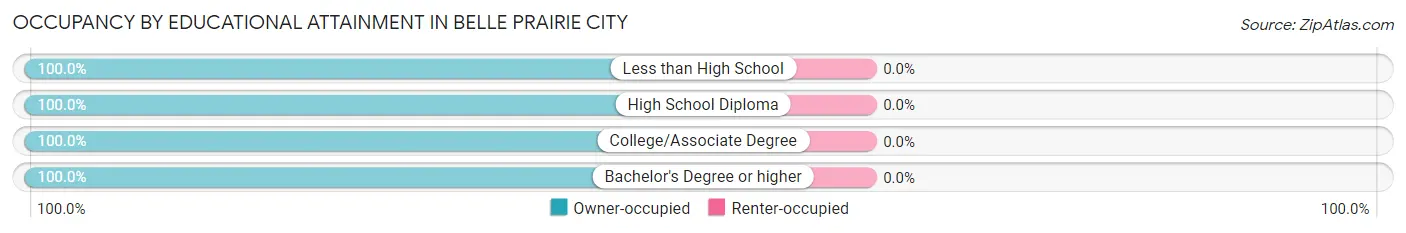
| Household Size | Owner-occupied | Renter-occupied |
| Less than High School | 3 (100.0%) | 0 (0.0%) |
| High School Diploma | 5 (100.0%) | 0 (0.0%) |
| College/Associate Degree | 10 (100.0%) | 0 (0.0%) |
| Bachelor's Degree or higher | 2 (100.0%) | 0 (0.0%) |
Occupancy by Age of Householder in Belle Prairie City
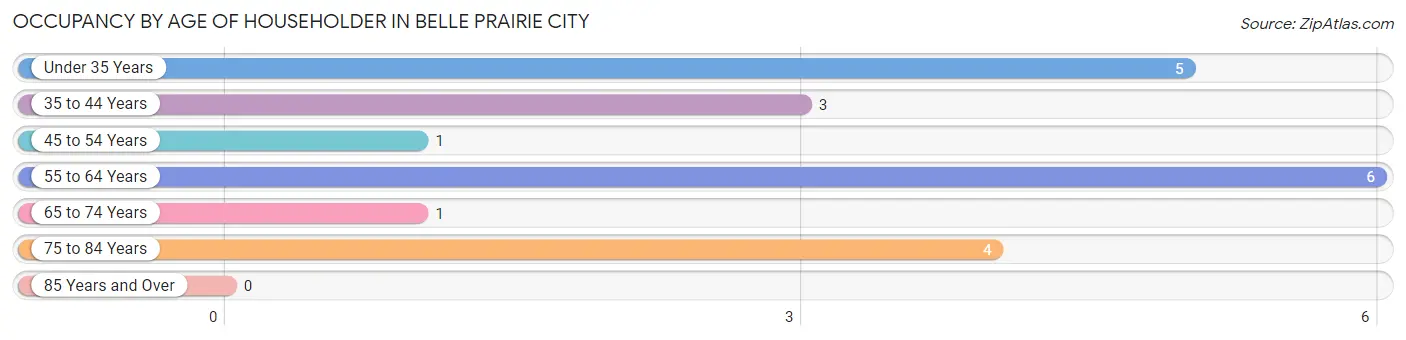
| Age Bracket | # Households | % Households |
| Under 35 Years | 5 | 25.0% |
| 35 to 44 Years | 3 | 15.0% |
| 45 to 54 Years | 1 | 5.0% |
| 55 to 64 Years | 6 | 30.0% |
| 65 to 74 Years | 1 | 5.0% |
| 75 to 84 Years | 4 | 20.0% |
| 85 Years and Over | 0 | 0.0% |
| Total | 20 | 100.0% |
Housing Finances in Belle Prairie City
Median Income by Occupancy in Belle Prairie City
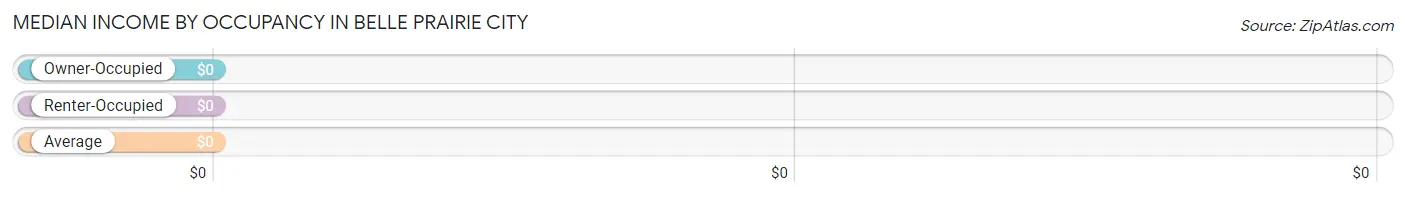
| Occupancy Type | # Households | Median Income |
| Owner-Occupied | 20 (100.0%) | $0 |
| Renter-Occupied | 0 (0.0%) | $0 |
| Average | 20 (100.0%) | $0 |
Occupancy by Householder Income Bracket in Belle Prairie City
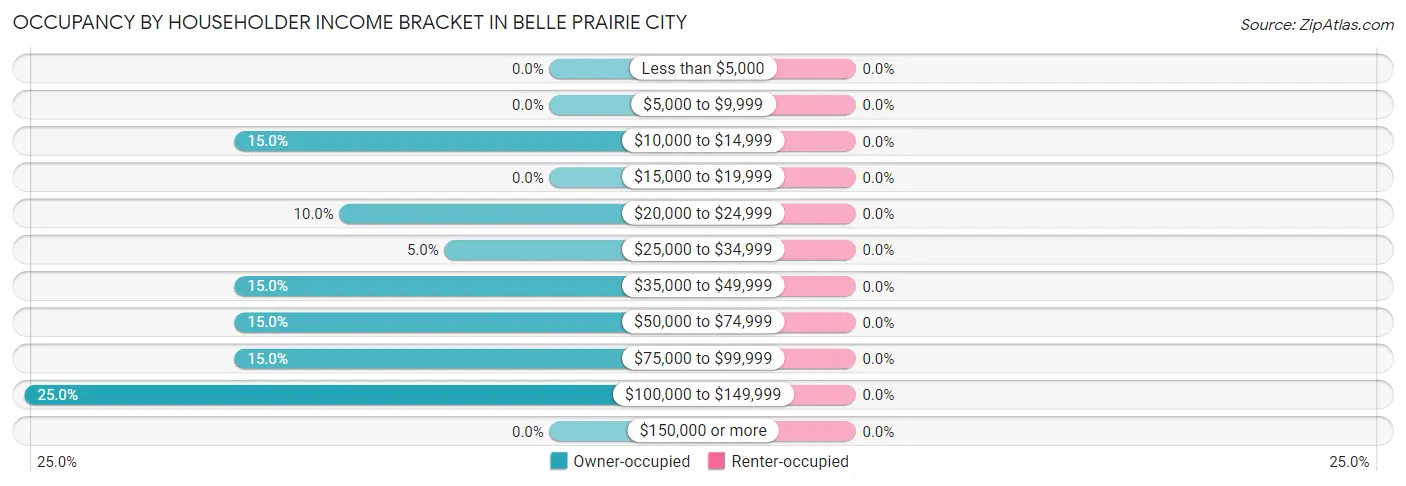
| Income Bracket | Owner-occupied | Renter-occupied |
| Less than $5,000 | 0 (0.0%) | 0 (0.0%) |
| $5,000 to $9,999 | 0 (0.0%) | 0 (0.0%) |
| $10,000 to $14,999 | 3 (15.0%) | 0 (0.0%) |
| $15,000 to $19,999 | 0 (0.0%) | 0 (0.0%) |
| $20,000 to $24,999 | 2 (10.0%) | 0 (0.0%) |
| $25,000 to $34,999 | 1 (5.0%) | 0 (0.0%) |
| $35,000 to $49,999 | 3 (15.0%) | 0 (0.0%) |
| $50,000 to $74,999 | 3 (15.0%) | 0 (0.0%) |
| $75,000 to $99,999 | 3 (15.0%) | 0 (0.0%) |
| $100,000 to $149,999 | 5 (25.0%) | 0 (0.0%) |
| $150,000 or more | 0 (0.0%) | 0 (0.0%) |
| Total | 20 (100.0%) | 0 (0.0%) |
Monthly Housing Cost Tiers in Belle Prairie City
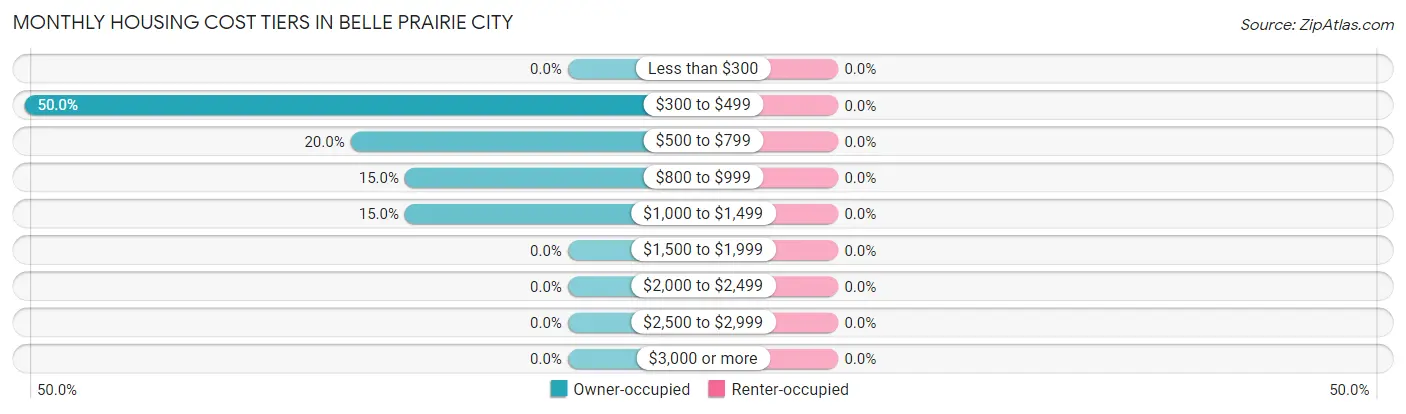
| Monthly Cost | Owner-occupied | Renter-occupied |
| Less than $300 | 0 (0.0%) | 0 (0.0%) |
| $300 to $499 | 10 (50.0%) | 0 (0.0%) |
| $500 to $799 | 4 (20.0%) | 0 (0.0%) |
| $800 to $999 | 3 (15.0%) | 0 (0.0%) |
| $1,000 to $1,499 | 3 (15.0%) | 0 (0.0%) |
| $1,500 to $1,999 | 0 (0.0%) | 0 (0.0%) |
| $2,000 to $2,499 | 0 (0.0%) | 0 (0.0%) |
| $2,500 to $2,999 | 0 (0.0%) | 0 (0.0%) |
| $3,000 or more | 0 (0.0%) | 0 (0.0%) |
| Total | 20 (100.0%) | 0 (0.0%) |
Physical Housing Characteristics in Belle Prairie City
Housing Structures in Belle Prairie City
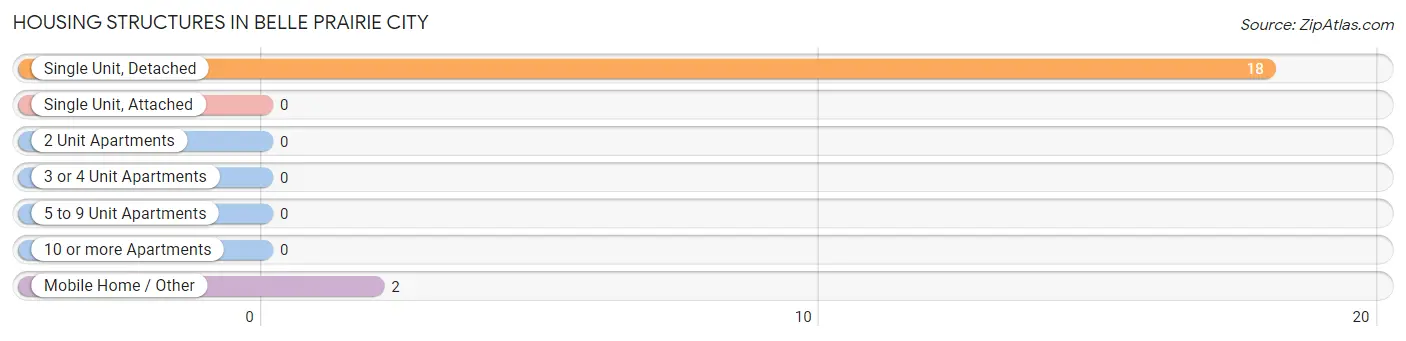
| Structure Type | # Housing Units | % Housing Units |
| Single Unit, Detached | 18 | 90.0% |
| Single Unit, Attached | 0 | 0.0% |
| 2 Unit Apartments | 0 | 0.0% |
| 3 or 4 Unit Apartments | 0 | 0.0% |
| 5 to 9 Unit Apartments | 0 | 0.0% |
| 10 or more Apartments | 0 | 0.0% |
| Mobile Home / Other | 2 | 10.0% |
| Total | 20 | 100.0% |
Housing Structures by Occupancy in Belle Prairie City
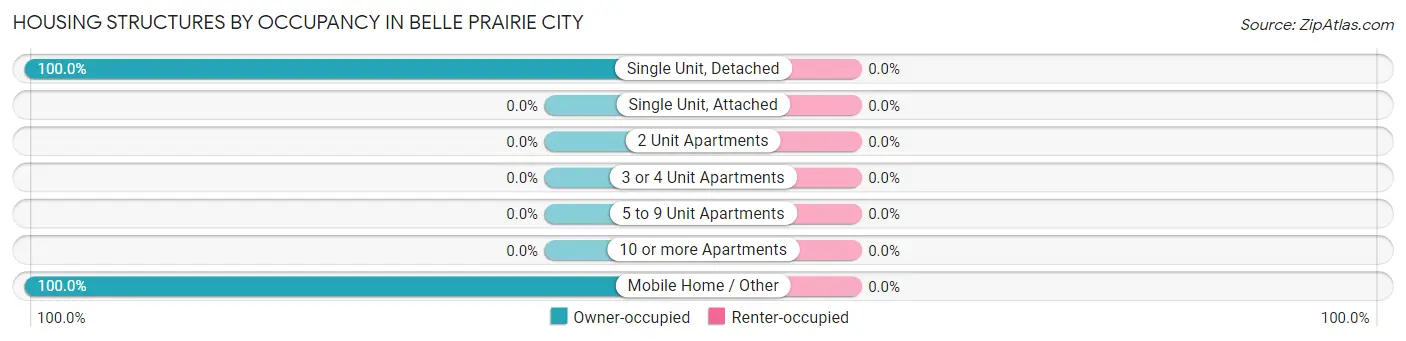
| Structure Type | Owner-occupied | Renter-occupied |
| Single Unit, Detached | 18 (100.0%) | 0 (0.0%) |
| Single Unit, Attached | 0 (0.0%) | 0 (0.0%) |
| 2 Unit Apartments | 0 (0.0%) | 0 (0.0%) |
| 3 or 4 Unit Apartments | 0 (0.0%) | 0 (0.0%) |
| 5 to 9 Unit Apartments | 0 (0.0%) | 0 (0.0%) |
| 10 or more Apartments | 0 (0.0%) | 0 (0.0%) |
| Mobile Home / Other | 2 (100.0%) | 0 (0.0%) |
| Total | 20 (100.0%) | 0 (0.0%) |
Housing Structures by Number of Rooms in Belle Prairie City
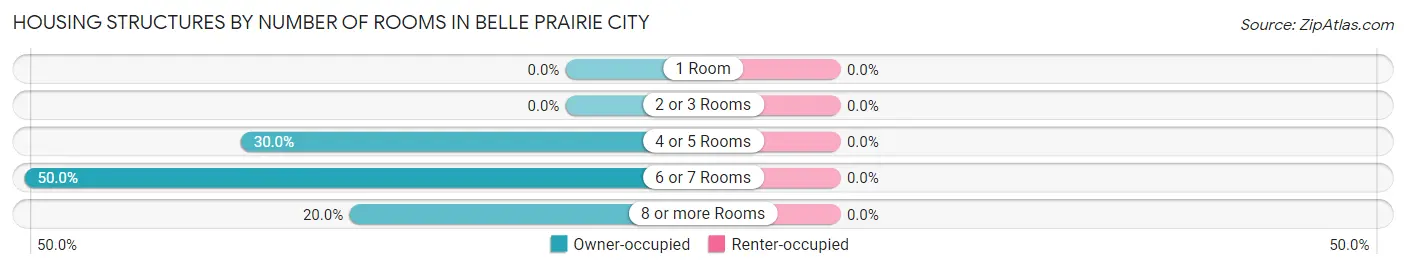
| Number of Rooms | Owner-occupied | Renter-occupied |
| 1 Room | 0 (0.0%) | 0 (0.0%) |
| 2 or 3 Rooms | 0 (0.0%) | 0 (0.0%) |
| 4 or 5 Rooms | 6 (30.0%) | 0 (0.0%) |
| 6 or 7 Rooms | 10 (50.0%) | 0 (0.0%) |
| 8 or more Rooms | 4 (20.0%) | 0 (0.0%) |
| Total | 20 (100.0%) | 0 (0.0%) |
Housing Structure by Heating Type in Belle Prairie City
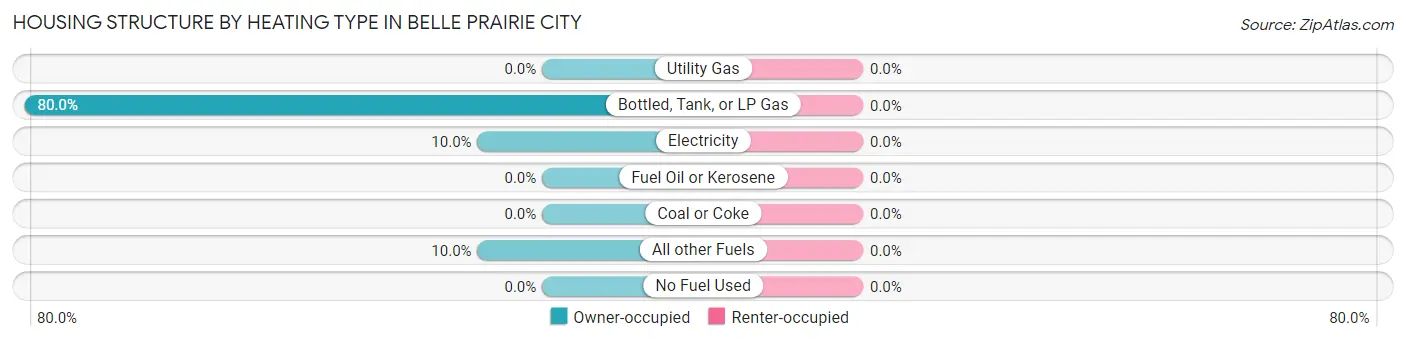
| Heating Type | Owner-occupied | Renter-occupied |
| Utility Gas | 0 (0.0%) | 0 (0.0%) |
| Bottled, Tank, or LP Gas | 16 (80.0%) | 0 (0.0%) |
| Electricity | 2 (10.0%) | 0 (0.0%) |
| Fuel Oil or Kerosene | 0 (0.0%) | 0 (0.0%) |
| Coal or Coke | 0 (0.0%) | 0 (0.0%) |
| All other Fuels | 2 (10.0%) | 0 (0.0%) |
| No Fuel Used | 0 (0.0%) | 0 (0.0%) |
| Total | 20 (100.0%) | 0 (0.0%) |
Household Vehicle Usage in Belle Prairie City
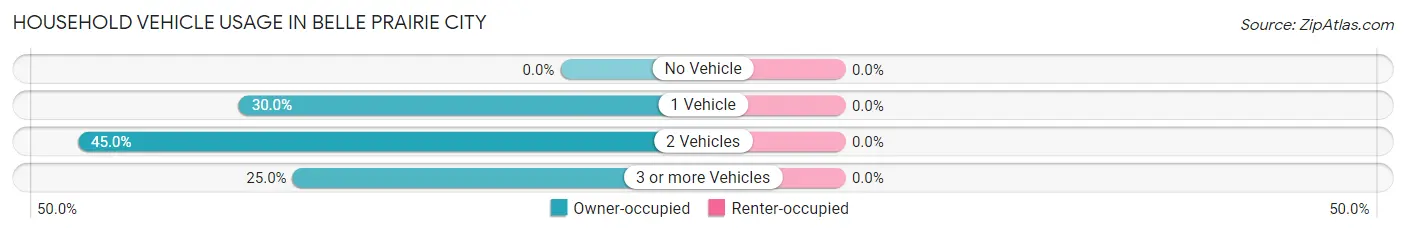
| Vehicles per Household | Owner-occupied | Renter-occupied |
| No Vehicle | 0 (0.0%) | 0 (0.0%) |
| 1 Vehicle | 6 (30.0%) | 0 (0.0%) |
| 2 Vehicles | 9 (45.0%) | 0 (0.0%) |
| 3 or more Vehicles | 5 (25.0%) | 0 (0.0%) |
| Total | 20 (100.0%) | 0 (0.0%) |
Real Estate & Mortgages in Belle Prairie City
Real Estate and Mortgage Overview in Belle Prairie City
| Characteristic | Without Mortgage | With Mortgage |
| Housing Units | 13 | 7 |
| Median Property Value | $112,500 | $81,700 |
| Median Household Income | - | - |
| Monthly Housing Costs | $488 | $0 |
| Real Estate Taxes | - | - |
Property Value by Mortgage Status in Belle Prairie City
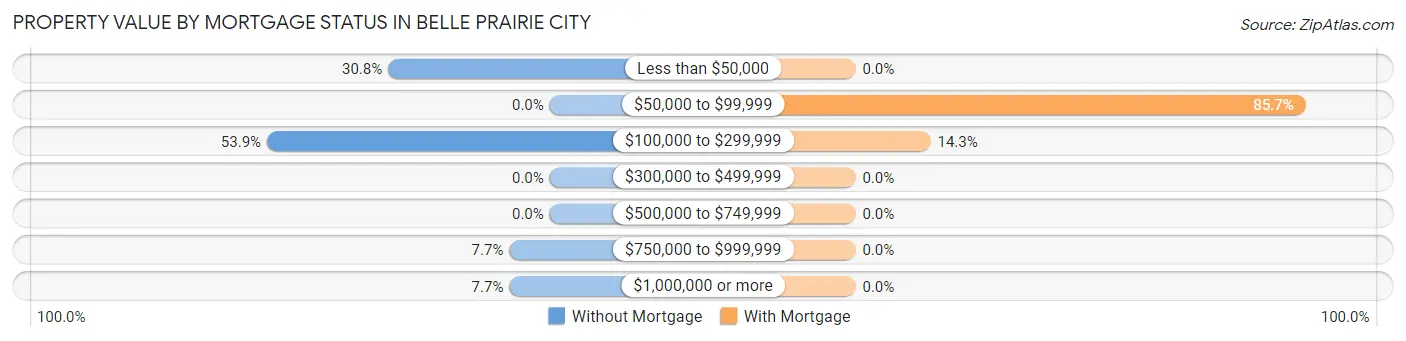
| Property Value | Without Mortgage | With Mortgage |
| Less than $50,000 | 4 (30.8%) | 0 (0.0%) |
| $50,000 to $99,999 | 0 (0.0%) | 6 (85.7%) |
| $100,000 to $299,999 | 7 (53.8%) | 1 (14.3%) |
| $300,000 to $499,999 | 0 (0.0%) | 0 (0.0%) |
| $500,000 to $749,999 | 0 (0.0%) | 0 (0.0%) |
| $750,000 to $999,999 | 1 (7.7%) | 0 (0.0%) |
| $1,000,000 or more | 1 (7.7%) | 0 (0.0%) |
| Total | 13 (100.0%) | 7 (100.0%) |
Household Income by Mortgage Status in Belle Prairie City
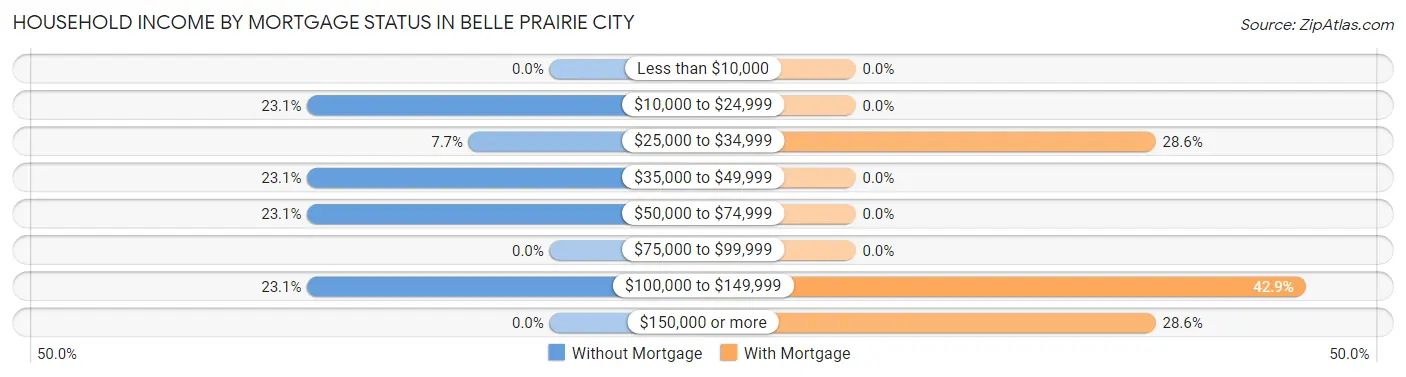
| Household Income | Without Mortgage | With Mortgage |
| Less than $10,000 | 0 (0.0%) | 0 (0.0%) |
| $10,000 to $24,999 | 3 (23.1%) | 0 (0.0%) |
| $25,000 to $34,999 | 1 (7.7%) | 2 (28.6%) |
| $35,000 to $49,999 | 3 (23.1%) | 0 (0.0%) |
| $50,000 to $74,999 | 3 (23.1%) | 0 (0.0%) |
| $75,000 to $99,999 | 0 (0.0%) | 0 (0.0%) |
| $100,000 to $149,999 | 3 (23.1%) | 3 (42.9%) |
| $150,000 or more | 0 (0.0%) | 2 (28.6%) |
| Total | 13 (100.0%) | 7 (100.0%) |
Property Value to Household Income Ratio in Belle Prairie City
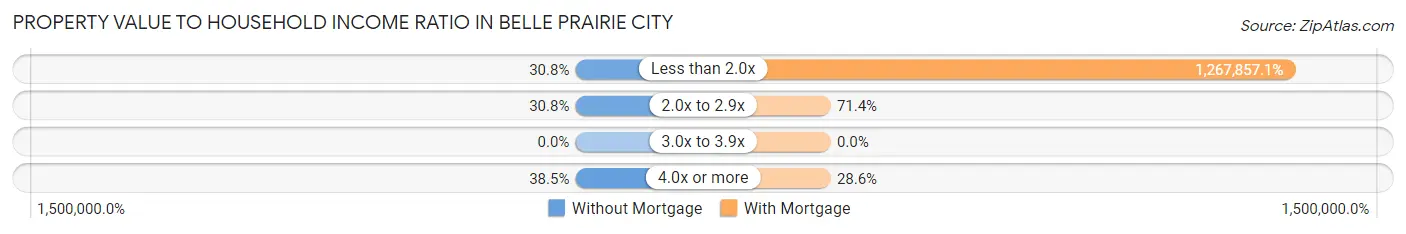
| Value-to-Income Ratio | Without Mortgage | With Mortgage |
| Less than 2.0x | 4 (30.8%) | 88,750 (1,267,857.1%) |
| 2.0x to 2.9x | 4 (30.8%) | 5 (71.4%) |
| 3.0x to 3.9x | 0 (0.0%) | 0 (0.0%) |
| 4.0x or more | 5 (38.5%) | 2 (28.6%) |
| Total | 13 (100.0%) | 7 (100.0%) |
Real Estate Taxes by Mortgage Status in Belle Prairie City
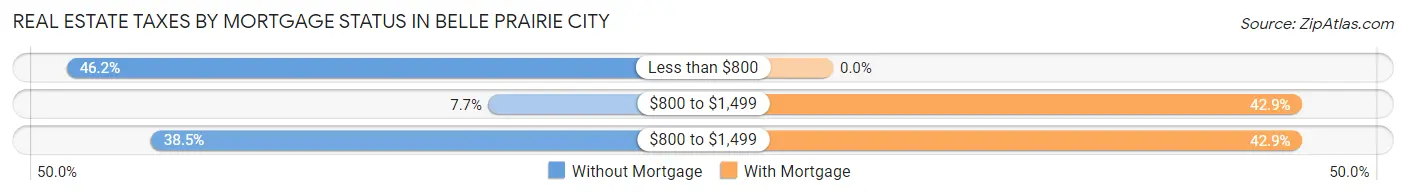
| Property Taxes | Without Mortgage | With Mortgage |
| Less than $800 | 6 (46.2%) | 0 (0.0%) |
| $800 to $1,499 | 1 (7.7%) | 3 (42.9%) |
| $800 to $1,499 | 5 (38.5%) | 3 (42.9%) |
| Total | 13 (100.0%) | 7 (100.0%) |
Health & Disability in Belle Prairie City
Health Insurance Coverage by Age in Belle Prairie City
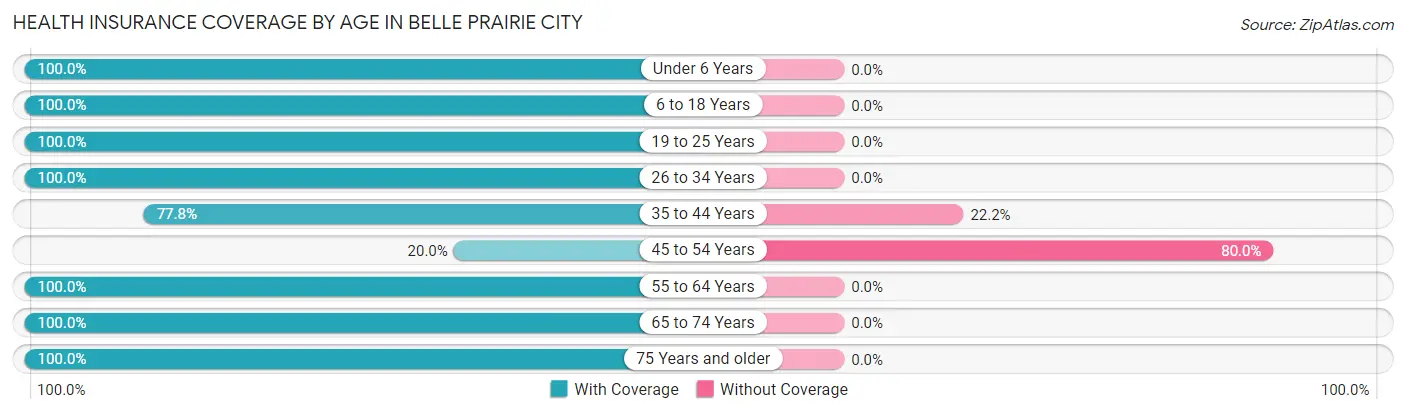
| Age Bracket | With Coverage | Without Coverage |
| Under 6 Years | 10 (100.0%) | 0 (0.0%) |
| 6 to 18 Years | 4 (100.0%) | 0 (0.0%) |
| 19 to 25 Years | 3 (100.0%) | 0 (0.0%) |
| 26 to 34 Years | 5 (100.0%) | 0 (0.0%) |
| 35 to 44 Years | 7 (77.8%) | 2 (22.2%) |
| 45 to 54 Years | 1 (20.0%) | 4 (80.0%) |
| 55 to 64 Years | 10 (100.0%) | 0 (0.0%) |
| 65 to 74 Years | 6 (100.0%) | 0 (0.0%) |
| 75 Years and older | 4 (100.0%) | 0 (0.0%) |
| Total | 50 (89.3%) | 6 (10.7%) |
Health Insurance Coverage by Citizenship Status in Belle Prairie City

| Citizenship Status | With Coverage | Without Coverage |
| Native Born | 10 (100.0%) | 0 (0.0%) |
| Foreign Born, Citizen | 4 (100.0%) | 0 (0.0%) |
| Foreign Born, not a Citizen | 3 (100.0%) | 0 (0.0%) |
Health Insurance Coverage by Household Income in Belle Prairie City
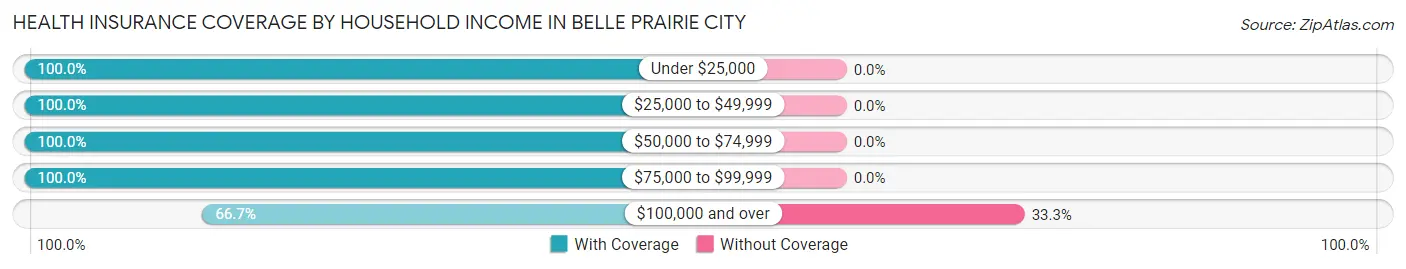
| Household Income | With Coverage | Without Coverage |
| Under $25,000 | 11 (100.0%) | 0 (0.0%) |
| $25,000 to $49,999 | 13 (100.0%) | 0 (0.0%) |
| $50,000 to $74,999 | 4 (100.0%) | 0 (0.0%) |
| $75,000 to $99,999 | 10 (100.0%) | 0 (0.0%) |
| $100,000 and over | 12 (66.7%) | 6 (33.3%) |
Public vs Private Health Insurance Coverage by Age in Belle Prairie City
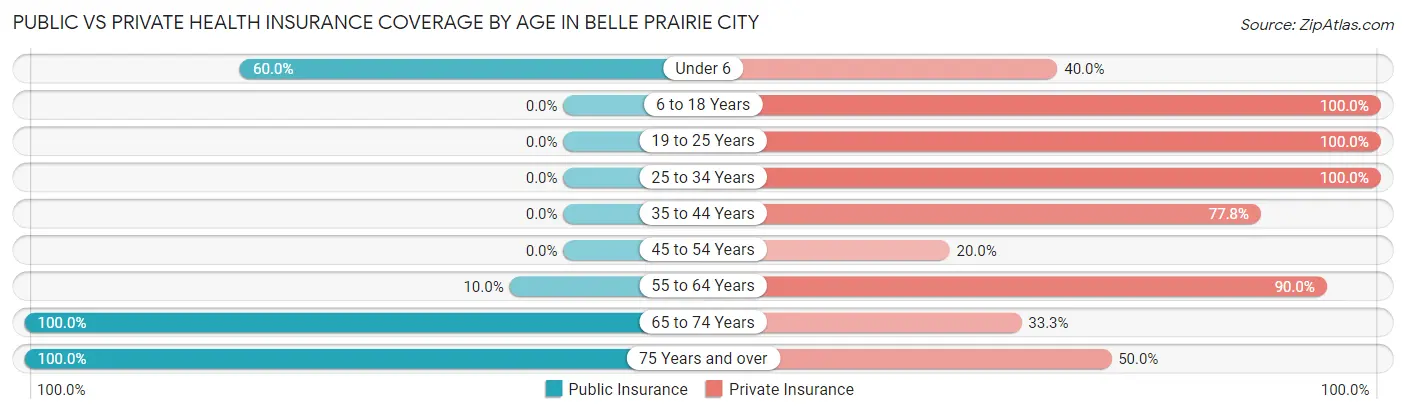
| Age Bracket | Public Insurance | Private Insurance |
| Under 6 | 6 (60.0%) | 4 (40.0%) |
| 6 to 18 Years | 0 (0.0%) | 4 (100.0%) |
| 19 to 25 Years | 0 (0.0%) | 3 (100.0%) |
| 25 to 34 Years | 0 (0.0%) | 5 (100.0%) |
| 35 to 44 Years | 0 (0.0%) | 7 (77.8%) |
| 45 to 54 Years | 0 (0.0%) | 1 (20.0%) |
| 55 to 64 Years | 1 (10.0%) | 9 (90.0%) |
| 65 to 74 Years | 6 (100.0%) | 2 (33.3%) |
| 75 Years and over | 4 (100.0%) | 2 (50.0%) |
| Total | 17 (30.4%) | 37 (66.1%) |
Disability Status by Sex by Age in Belle Prairie City
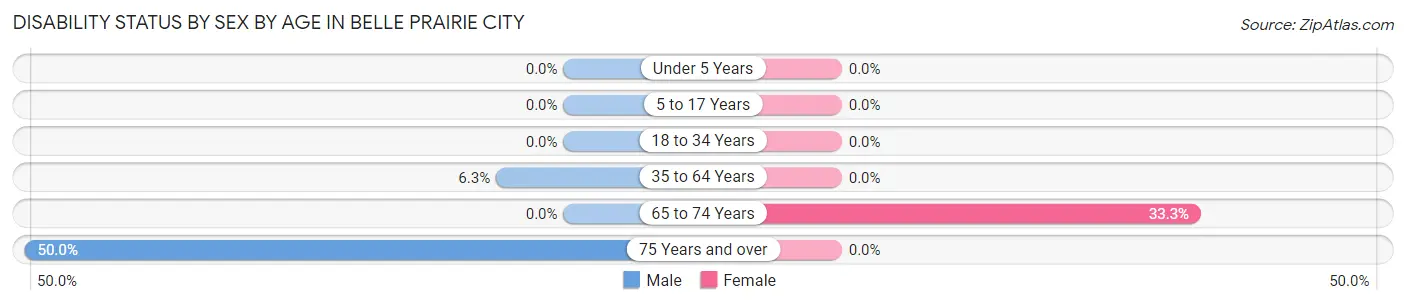
| Age Bracket | Male | Female |
| Under 5 Years | 0 (0.0%) | 0 (0.0%) |
| 5 to 17 Years | 0 (0.0%) | 0 (0.0%) |
| 18 to 34 Years | 0 (0.0%) | 0 (0.0%) |
| 35 to 64 Years | 1 (6.2%) | 0 (0.0%) |
| 65 to 74 Years | 0 (0.0%) | 1 (33.3%) |
| 75 Years and over | 2 (50.0%) | 0 (0.0%) |
Disability Class by Sex by Age in Belle Prairie City
Disability Class: Hearing Difficulty
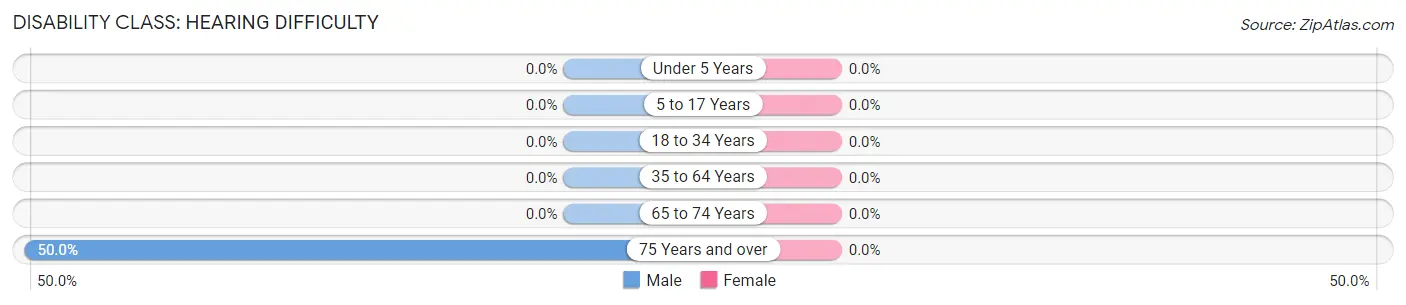
| Age Bracket | Male | Female |
| Under 5 Years | 0 (0.0%) | 0 (0.0%) |
| 5 to 17 Years | 0 (0.0%) | 0 (0.0%) |
| 18 to 34 Years | 0 (0.0%) | 0 (0.0%) |
| 35 to 64 Years | 0 (0.0%) | 0 (0.0%) |
| 65 to 74 Years | 0 (0.0%) | 0 (0.0%) |
| 75 Years and over | 2 (50.0%) | 0 (0.0%) |
Disability Class: Vision Difficulty
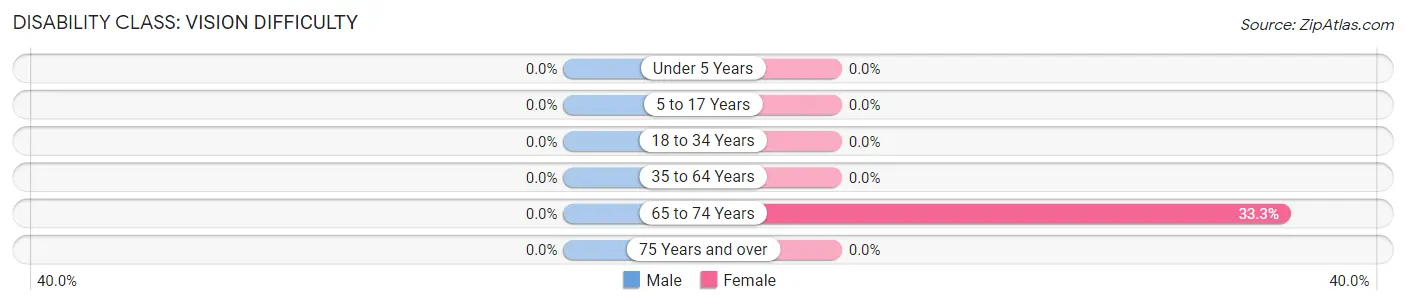
| Age Bracket | Male | Female |
| Under 5 Years | 0 (0.0%) | 0 (0.0%) |
| 5 to 17 Years | 0 (0.0%) | 0 (0.0%) |
| 18 to 34 Years | 0 (0.0%) | 0 (0.0%) |
| 35 to 64 Years | 0 (0.0%) | 0 (0.0%) |
| 65 to 74 Years | 0 (0.0%) | 1 (33.3%) |
| 75 Years and over | 0 (0.0%) | 0 (0.0%) |
Disability Class: Cognitive Difficulty

| Age Bracket | Male | Female |
| 5 to 17 Years | 0 (0.0%) | 0 (0.0%) |
| 18 to 34 Years | 0 (0.0%) | 0 (0.0%) |
| 35 to 64 Years | 0 (0.0%) | 0 (0.0%) |
| 65 to 74 Years | 0 (0.0%) | 0 (0.0%) |
| 75 Years and over | 0 (0.0%) | 0 (0.0%) |
Disability Class: Ambulatory Difficulty
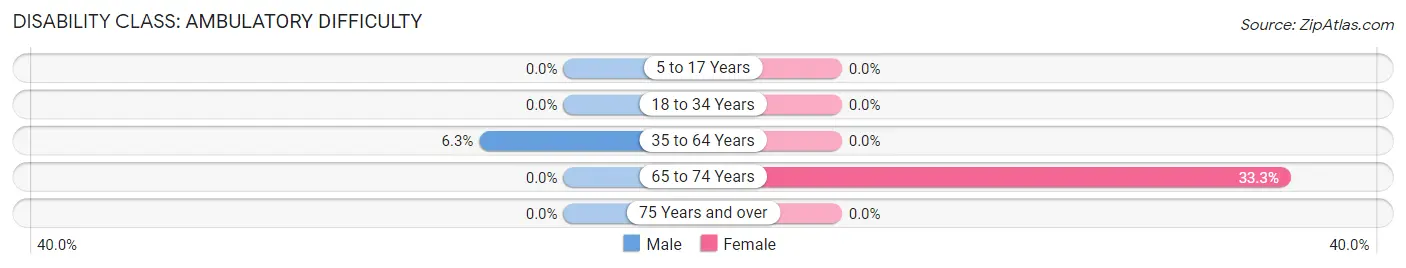
| Age Bracket | Male | Female |
| 5 to 17 Years | 0 (0.0%) | 0 (0.0%) |
| 18 to 34 Years | 0 (0.0%) | 0 (0.0%) |
| 35 to 64 Years | 1 (6.2%) | 0 (0.0%) |
| 65 to 74 Years | 0 (0.0%) | 1 (33.3%) |
| 75 Years and over | 0 (0.0%) | 0 (0.0%) |
Disability Class: Self-Care Difficulty
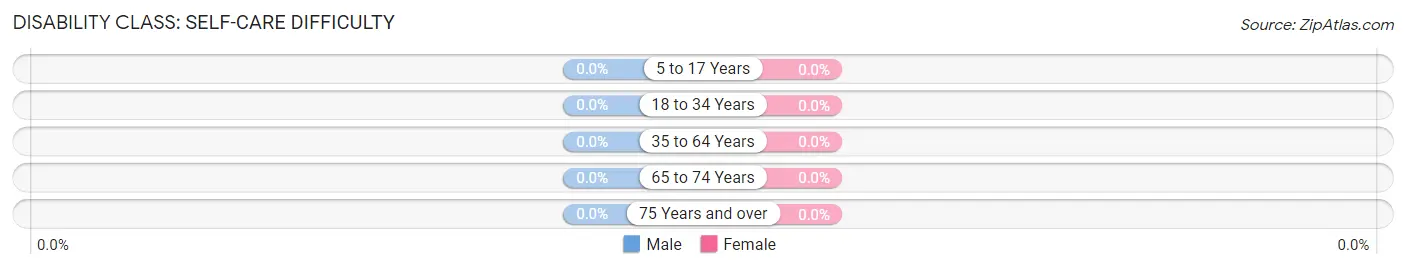
| Age Bracket | Male | Female |
| 5 to 17 Years | 0 (0.0%) | 0 (0.0%) |
| 18 to 34 Years | 0 (0.0%) | 0 (0.0%) |
| 35 to 64 Years | 0 (0.0%) | 0 (0.0%) |
| 65 to 74 Years | 0 (0.0%) | 0 (0.0%) |
| 75 Years and over | 0 (0.0%) | 0 (0.0%) |
Technology Access in Belle Prairie City
Computing Device Access in Belle Prairie City
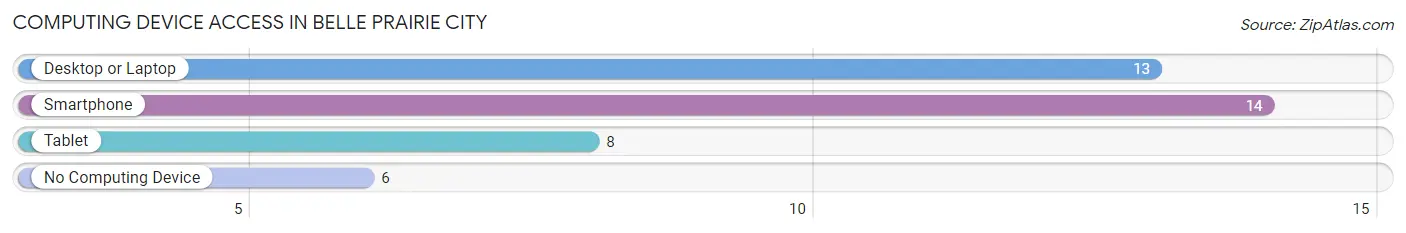
| Device Type | # Households | % Households |
| Desktop or Laptop | 13 | 65.0% |
| Smartphone | 14 | 70.0% |
| Tablet | 8 | 40.0% |
| No Computing Device | 6 | 30.0% |
| Total | 20 | 100.0% |
Internet Access in Belle Prairie City
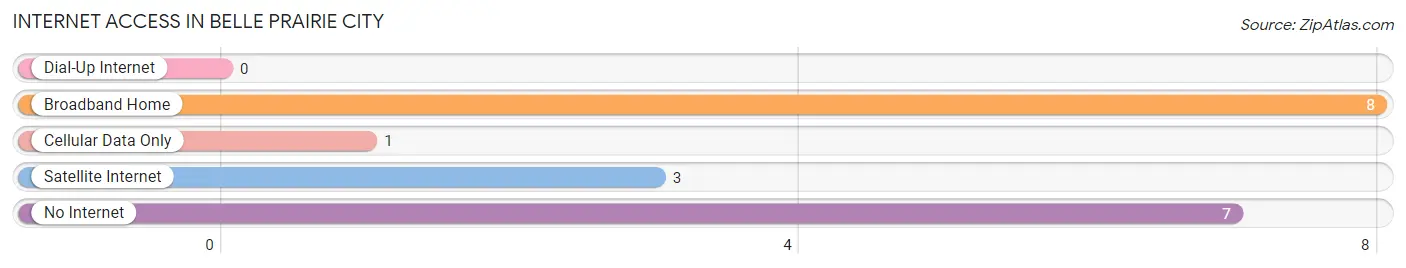
| Internet Type | # Households | % Households |
| Dial-Up Internet | 0 | 0.0% |
| Broadband Home | 8 | 40.0% |
| Cellular Data Only | 1 | 5.0% |
| Satellite Internet | 3 | 15.0% |
| No Internet | 7 | 35.0% |
| Total | 20 | 100.0% |
Belle Prairie City Summary
Belle Prairie City is a small city located in the state of Illinois. It is situated in the northern part of the state, in the county of LaSalle. The city has a population of approximately 2,000 people and is located on the banks of the Illinois River.
History
Belle Prairie City was founded in 1836 by a group of settlers from the nearby town of Ottawa. The settlers were looking for a place to settle and start a new life. The city was named after the nearby Belle Prairie Creek, which was named after the French word for beautiful prairie. The city was incorporated in 1837 and was the first city in LaSalle County.
The city was an important stop on the Illinois and Michigan Canal, which was built in the early 19th century to connect the Great Lakes to the Mississippi River. The canal was a major transportation route for goods and people, and it helped to spur the growth of the city.
In the late 19th century, the city was a major center for the lumber industry. The city was home to several sawmills and lumber yards, and the lumber industry was a major source of employment for the city.
The city was also home to several factories, including a paper mill, a flour mill, and a brickyard. These factories provided employment for many of the city’s residents.
Geography
Belle Prairie City is located in the northern part of the state of Illinois. It is situated in the county of LaSalle, on the banks of the Illinois River. The city is located about 50 miles west of Chicago.
The city is located in a flat, open area, with rolling hills and prairies. The city is surrounded by farmland and is home to several small lakes and ponds.
Economy
The economy of Belle Prairie City is largely based on agriculture and manufacturing. The city is home to several farms, which produce a variety of crops, including corn, soybeans, and wheat. The city is also home to several factories, which produce a variety of products, including paper, flour, and bricks.
The city is also home to several small businesses, including restaurants, retail stores, and service providers. The city is also home to several tourist attractions, including the Illinois and Michigan Canal, which is a popular destination for visitors.
Demographics
As of the 2010 census, the population of Belle Prairie City was 2,000 people. The city is predominantly white, with a small African American population. The median household income in the city is $45,000, and the median age is 40 years old.
Conclusion
Belle Prairie City is a small city located in the northern part of the state of Illinois. The city was founded in 1836 and was an important stop on the Illinois and Michigan Canal. The city is home to several farms and factories, and is a popular tourist destination. The city has a population of approximately 2,000 people, and the median household income is $45,000.
Common Questions
What is the Total Population of Belle Prairie City?
Total Population of Belle Prairie City is 56.
What is the Total Male Population of Belle Prairie City?
Total Male Population of Belle Prairie City is 27.
What is the Total Female Population of Belle Prairie City?
Total Female Population of Belle Prairie City is 29.
What is the Ratio of Males per 100 Females in Belle Prairie City?
There are 93.10 Males per 100 Females in Belle Prairie City.
What is the Ratio of Females per 100 Males in Belle Prairie City?
There are 107.41 Females per 100 Males in Belle Prairie City.
What is the Median Population Age in Belle Prairie City?
Median Population Age in Belle Prairie City is 40.6 Years.
What is the Average Family Size in Belle Prairie City
Average Family Size in Belle Prairie City is 3.0 People.
What is the Average Household Size in Belle Prairie City
Average Household Size in Belle Prairie City is 2.8 People.
What is Per Capita Income in Belle Prairie City?
Per Capita income in Belle Prairie City is $31,807.
What is Income or Wage Gap in Belle Prairie City?
Income or Wage Gap in Belle Prairie City is 45.3%.
Women in Belle Prairie City earn 54.7 cents for every dollar earned by a man.
What is Inequality or Gini Index in Belle Prairie City?
Inequality or Gini Index in Belle Prairie City is 0.38.
How Large is the Labor Force in Belle Prairie City?
There are 26 People in the Labor Forcein in Belle Prairie City.
What is the Percentage of People in the Labor Force in Belle Prairie City?
61.9% of People are in the Labor Force in Belle Prairie City.