Laguna Park, TX
Laguna Park Map
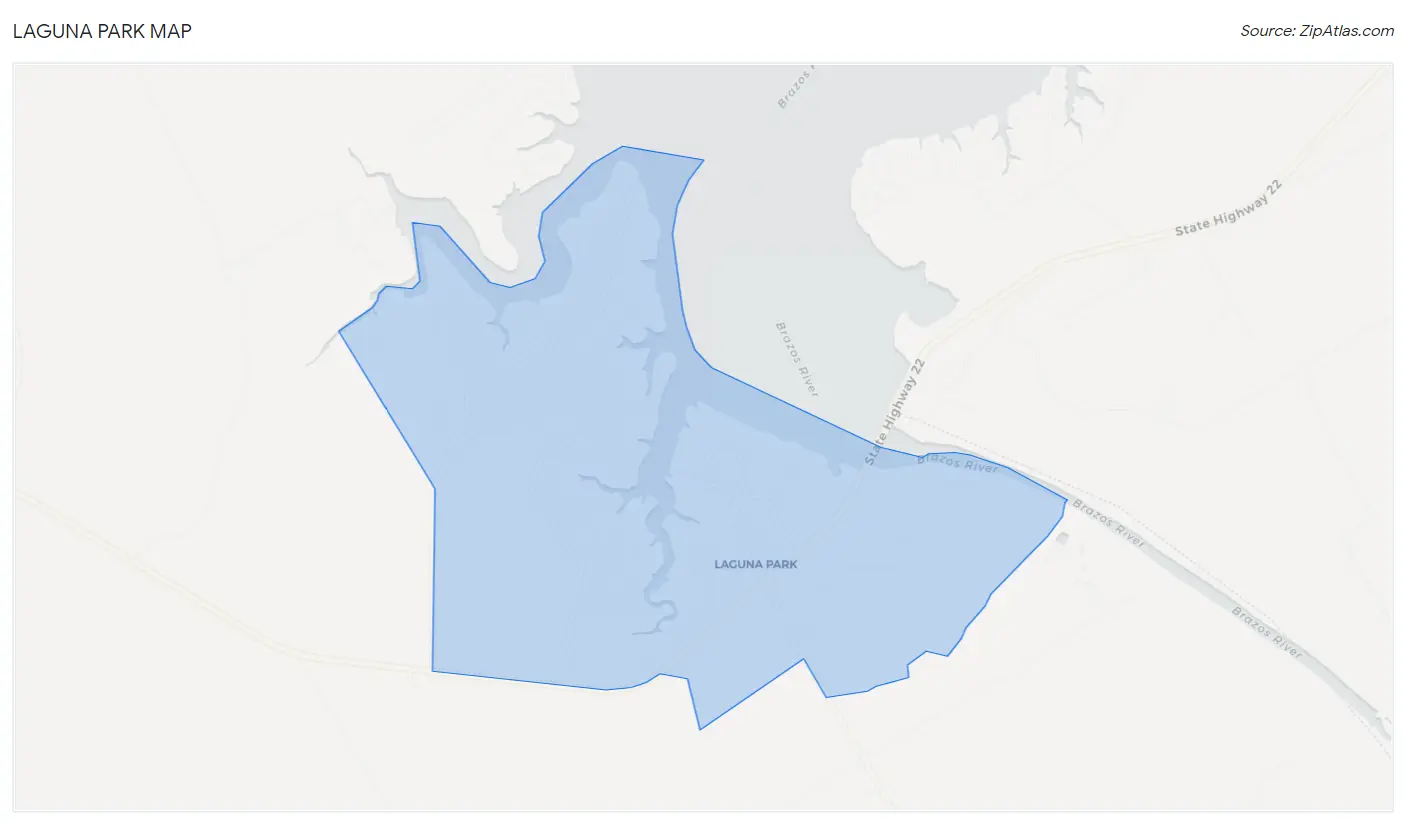
Laguna Park Overview
1,536
TOTAL POPULATION
761
MALE POPULATION
775
FEMALE POPULATION
98.19
MALES / 100 FEMALES
101.84
FEMALES / 100 MALES
51.2
MEDIAN AGE
3.1
AVG FAMILY SIZE
2.7
AVG HOUSEHOLD SIZE
$37,840
PER CAPITA INCOME
$78,220
AVG FAMILY INCOME
$71,959
AVG HOUSEHOLD INCOME
70.6%
WAGE / INCOME GAP [ % ]
29.4¢/ $1
WAGE / INCOME GAP [ $ ]
0.47
INEQUALITY / GINI INDEX
465
LABOR FORCE [ PEOPLE ]
41.0%
PERCENT IN LABOR FORCE
4.3%
UNEMPLOYMENT RATE
Laguna Park Area Codes
Race in Laguna Park
The most populous races in Laguna Park are White / Caucasian (1,453 | 94.6%), Two or more Races (50 | 3.3%), and Asian (31 | 2.0%).
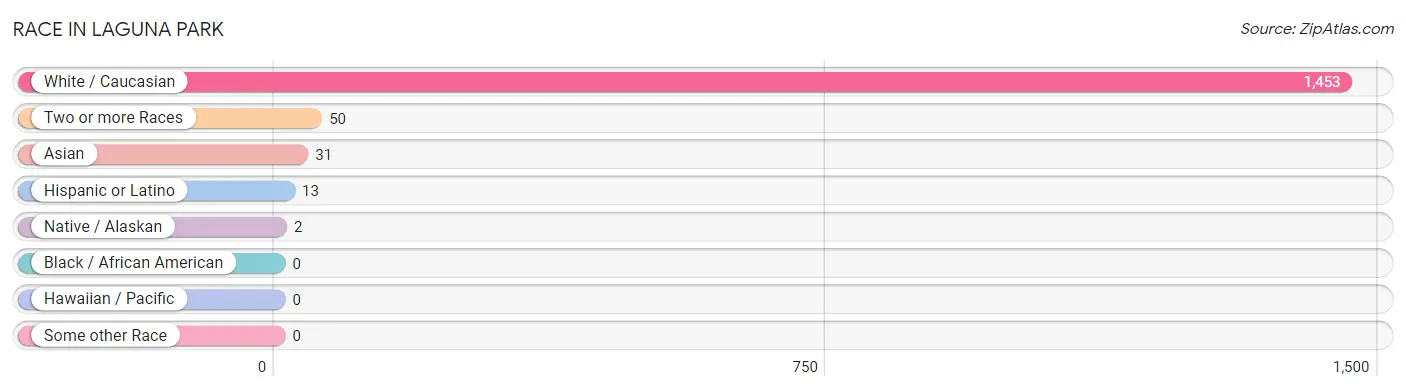
| Race | # Population | % Population |
| Asian | 31 | 2.0% |
| Black / African American | 0 | 0.0% |
| Hawaiian / Pacific | 0 | 0.0% |
| Hispanic or Latino | 13 | 0.9% |
| Native / Alaskan | 2 | 0.1% |
| White / Caucasian | 1,453 | 94.6% |
| Two or more Races | 50 | 3.3% |
| Some other Race | 0 | 0.0% |
| Total | 1,536 | 100.0% |
Ancestry in Laguna Park
The most populous ancestries reported in Laguna Park are Irish (298 | 19.4%), German (257 | 16.7%), English (142 | 9.2%), American (60 | 3.9%), and Scottish (39 | 2.5%), together accounting for 51.8% of all Laguna Park residents.
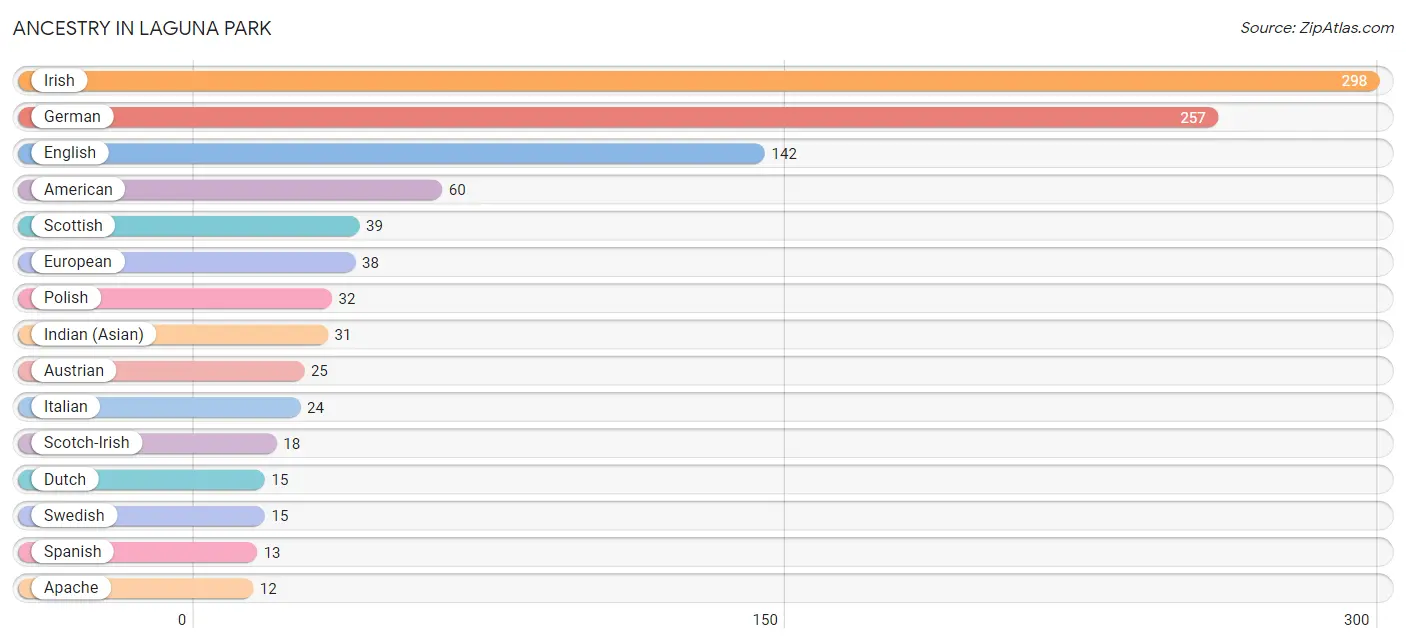
| Ancestry | # Population | % Population |
| American | 60 | 3.9% |
| Apache | 12 | 0.8% |
| Austrian | 25 | 1.6% |
| British | 11 | 0.7% |
| Cajun | 7 | 0.5% |
| Canadian | 4 | 0.3% |
| Czech | 12 | 0.8% |
| Czechoslovakian | 4 | 0.3% |
| Dutch | 15 | 1.0% |
| Dutch West Indian | 7 | 0.5% |
| English | 142 | 9.2% |
| European | 38 | 2.5% |
| French | 9 | 0.6% |
| French Canadian | 7 | 0.5% |
| German | 257 | 16.7% |
| Indian (Asian) | 31 | 2.0% |
| Irish | 298 | 19.4% |
| Italian | 24 | 1.6% |
| Jamaican | 3 | 0.2% |
| Lithuanian | 8 | 0.5% |
| Norwegian | 6 | 0.4% |
| Polish | 32 | 2.1% |
| Scandinavian | 12 | 0.8% |
| Scotch-Irish | 18 | 1.2% |
| Scottish | 39 | 2.5% |
| Spanish | 13 | 0.9% |
| Swedish | 15 | 1.0% |
| Welsh | 2 | 0.1% | View All 28 Rows |
Immigrants in Laguna Park
The most numerous immigrant groups reported in Laguna Park came from Asia (35 | 2.3%), China (35 | 2.3%), Eastern Asia (35 | 2.3%), Taiwan (31 | 2.0%), and Europe (26 | 1.7%), together accounting for 10.5% of all Laguna Park residents.
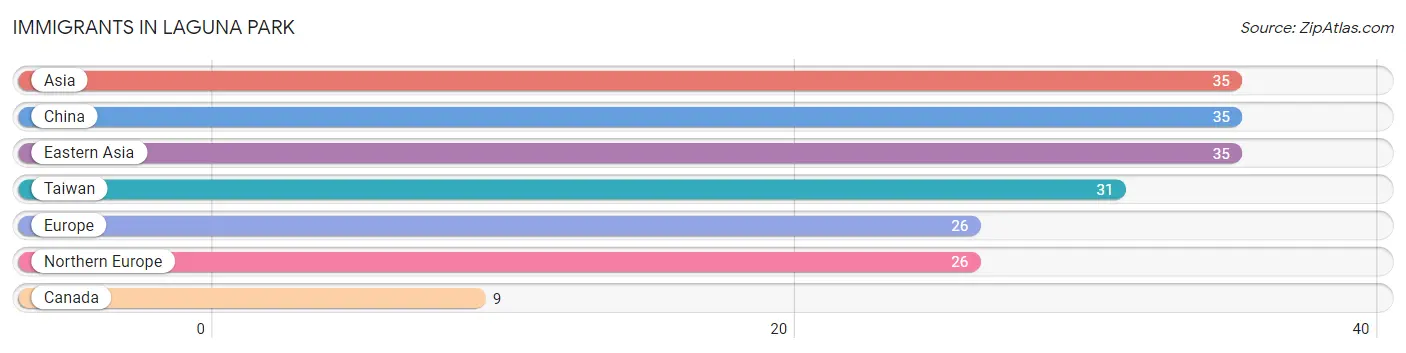
| Immigration Origin | # Population | % Population |
| Asia | 35 | 2.3% |
| Canada | 9 | 0.6% |
| China | 35 | 2.3% |
| Eastern Asia | 35 | 2.3% |
| Europe | 26 | 1.7% |
| Northern Europe | 26 | 1.7% |
| Taiwan | 31 | 2.0% | View All 7 Rows |
Sex and Age in Laguna Park
Sex and Age in Laguna Park
The most populous age groups in Laguna Park are 75 to 79 Years (113 | 14.8%) for men and 10 to 14 Years (98 | 12.7%) for women.
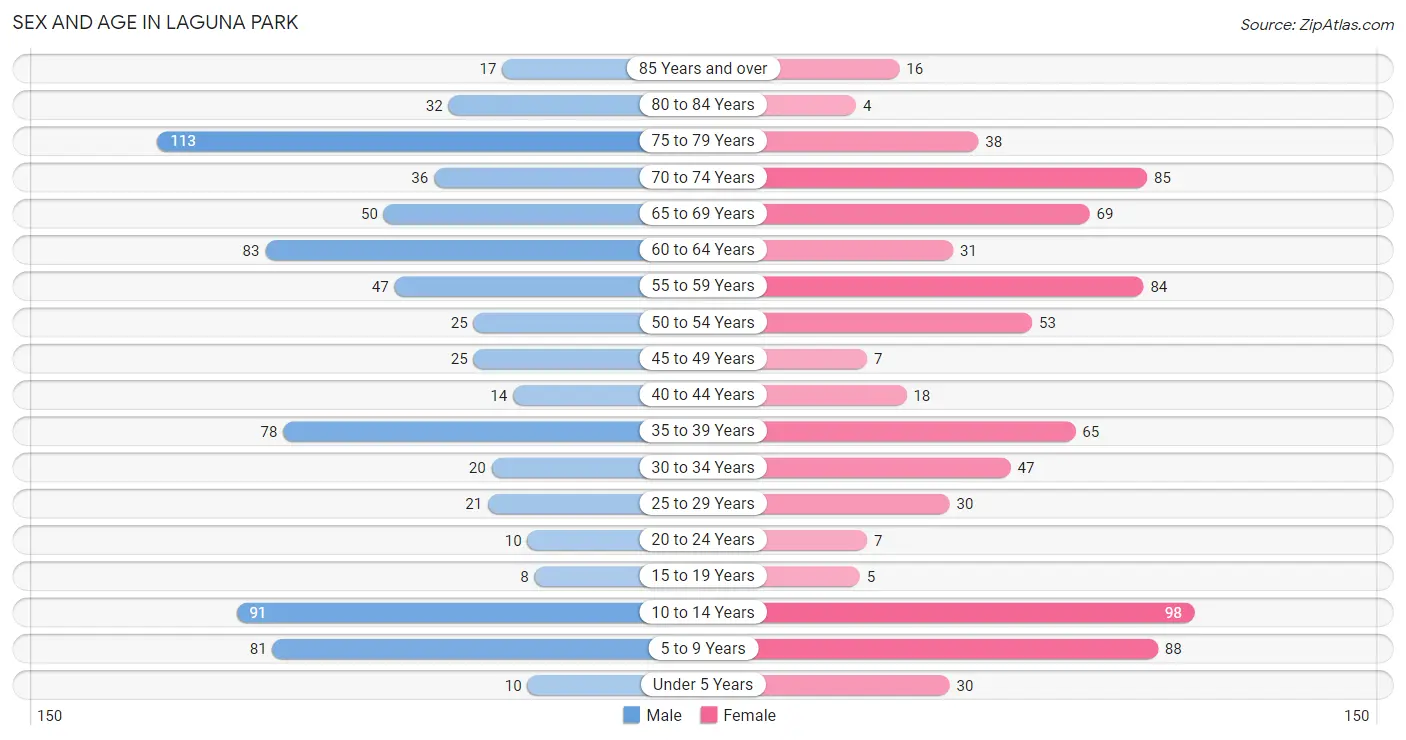
| Age Bracket | Male | Female |
| Under 5 Years | 10 (1.3%) | 30 (3.9%) |
| 5 to 9 Years | 81 (10.6%) | 88 (11.4%) |
| 10 to 14 Years | 91 (12.0%) | 98 (12.7%) |
| 15 to 19 Years | 8 (1.1%) | 5 (0.6%) |
| 20 to 24 Years | 10 (1.3%) | 7 (0.9%) |
| 25 to 29 Years | 21 (2.8%) | 30 (3.9%) |
| 30 to 34 Years | 20 (2.6%) | 47 (6.1%) |
| 35 to 39 Years | 78 (10.2%) | 65 (8.4%) |
| 40 to 44 Years | 14 (1.8%) | 18 (2.3%) |
| 45 to 49 Years | 25 (3.3%) | 7 (0.9%) |
| 50 to 54 Years | 25 (3.3%) | 53 (6.8%) |
| 55 to 59 Years | 47 (6.2%) | 84 (10.8%) |
| 60 to 64 Years | 83 (10.9%) | 31 (4.0%) |
| 65 to 69 Years | 50 (6.6%) | 69 (8.9%) |
| 70 to 74 Years | 36 (4.7%) | 85 (11.0%) |
| 75 to 79 Years | 113 (14.8%) | 38 (4.9%) |
| 80 to 84 Years | 32 (4.2%) | 4 (0.5%) |
| 85 Years and over | 17 (2.2%) | 16 (2.1%) |
| Total | 761 (100.0%) | 775 (100.0%) |
Families and Households in Laguna Park
Median Family Size in Laguna Park
The median family size in Laguna Park is 3.15 persons per family, with single male/father families (9 | 2.1%) accounting for the largest median family size of 3.56 persons per family. On the other hand, single female/mother families (29 | 6.7%) represent the smallest median family size with 3.10 persons per family.
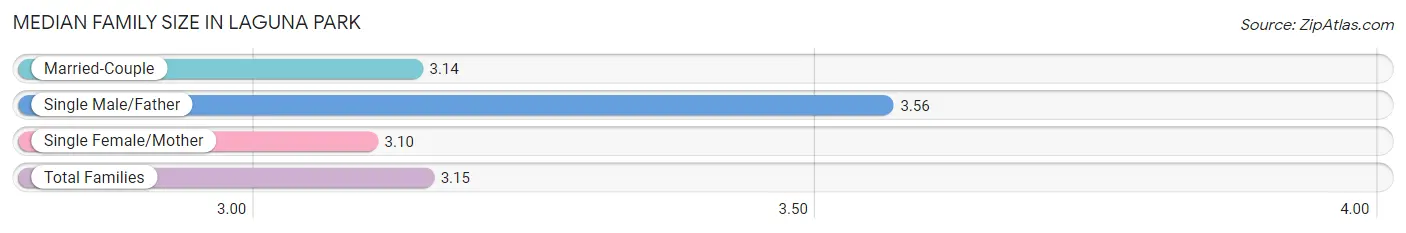
| Family Type | # Families | Family Size |
| Married-Couple | 396 (91.2%) | 3.14 |
| Single Male/Father | 9 (2.1%) | 3.56 |
| Single Female/Mother | 29 (6.7%) | 3.10 |
| Total Families | 434 (100.0%) | 3.15 |
Median Household Size in Laguna Park
The median household size in Laguna Park is 2.74 persons per household, with single male/father households (9 | 1.6%) accounting for the largest median household size of 4.67 persons per household. non-family households (126 | 22.5%) represent the smallest median household size with 1.08 persons per household.
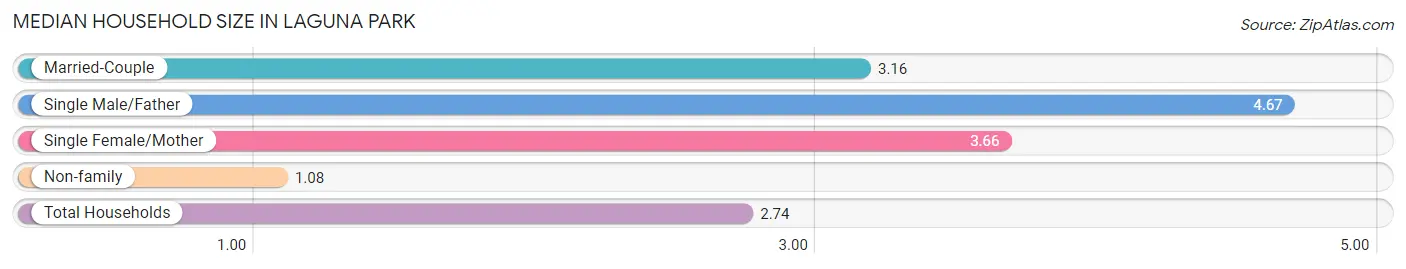
| Household Type | # Households | Household Size |
| Married-Couple | 396 (70.7%) | 3.16 |
| Single Male/Father | 9 (1.6%) | 4.67 |
| Single Female/Mother | 29 (5.2%) | 3.66 |
| Non-family | 126 (22.5%) | 1.08 |
| Total Households | 560 (100.0%) | 2.74 |
Household Size by Marriage Status in Laguna Park
Out of a total of 560 households in Laguna Park, 434 (77.5%) are family households, while 126 (22.5%) are nonfamily households. The most numerous type of family households are 2-person households, comprising 247, and the most common type of nonfamily households are 1-person households, comprising 115.
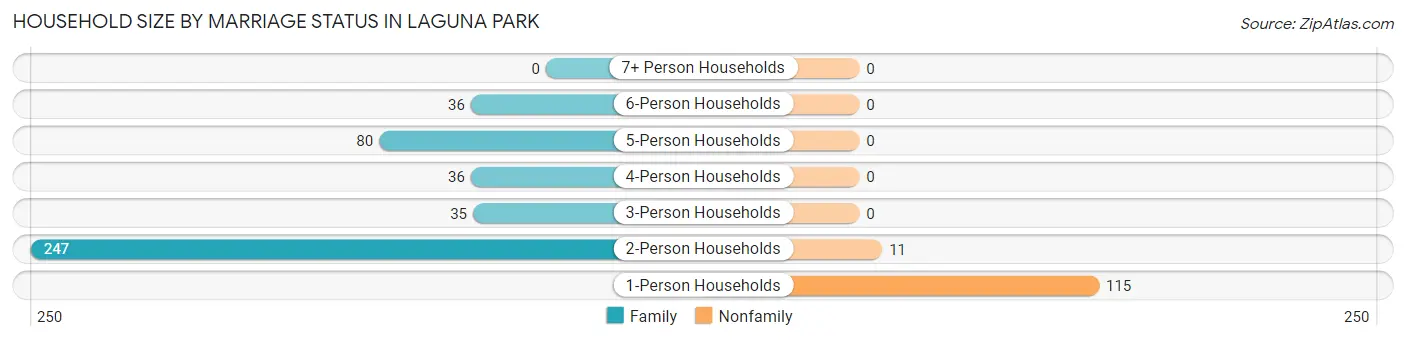
| Household Size | Family Households | Nonfamily Households |
| 1-Person Households | - | 115 (20.5%) |
| 2-Person Households | 247 (44.1%) | 11 (2.0%) |
| 3-Person Households | 35 (6.2%) | 0 (0.0%) |
| 4-Person Households | 36 (6.4%) | 0 (0.0%) |
| 5-Person Households | 80 (14.3%) | 0 (0.0%) |
| 6-Person Households | 36 (6.4%) | 0 (0.0%) |
| 7+ Person Households | 0 (0.0%) | 0 (0.0%) |
| Total | 434 (77.5%) | 126 (22.5%) |
Female Fertility in Laguna Park
Fertility by Age in Laguna Park
Average fertility rate in Laguna Park is 43.0 births per 1,000 women. Women in the age bracket of 20 to 34 years have the highest fertility rate with 95.0 births per 1,000 women. Women in the age bracket of 20 to 34 years acount for 100.0% of all women with births.
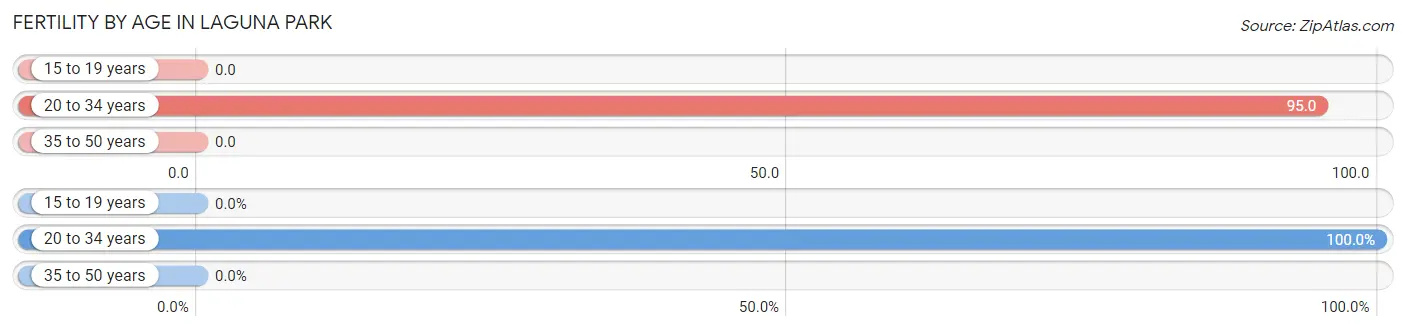
| Age Bracket | Women with Births | Births / 1,000 Women |
| 15 to 19 years | 0 (0.0%) | 0.0 |
| 20 to 34 years | 8 (100.0%) | 95.0 |
| 35 to 50 years | 0 (0.0%) | 0.0 |
| Total | 8 (100.0%) | 43.0 |
Fertility by Age by Marriage Status in Laguna Park
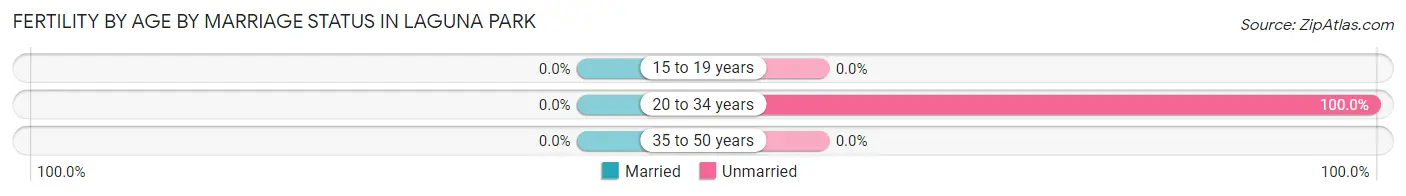
| Age Bracket | Married | Unmarried |
| 15 to 19 years | 0 (0.0%) | 0 (0.0%) |
| 20 to 34 years | 0 (0.0%) | 8 (100.0%) |
| 35 to 50 years | 0 (0.0%) | 0 (0.0%) |
| Total | 0 (0.0%) | 8 (100.0%) |
Fertility by Education in Laguna Park
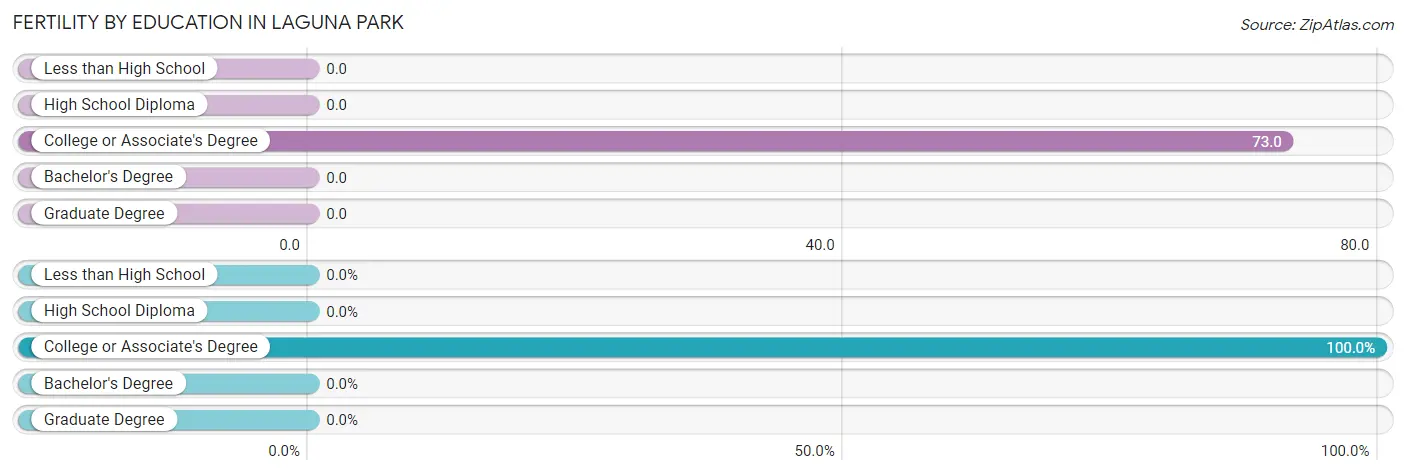
| Educational Attainment | Women with Births | Births / 1,000 Women |
| Less than High School | 0 (0.0%) | 0.0 |
| High School Diploma | 0 (0.0%) | 0.0 |
| College or Associate's Degree | 8 (100.0%) | 73.0 |
| Bachelor's Degree | 0 (0.0%) | 0.0 |
| Graduate Degree | 0 (0.0%) | 0.0 |
| Total | 8 (100.0%) | 43.0 |
Fertility by Education by Marriage Status in Laguna Park
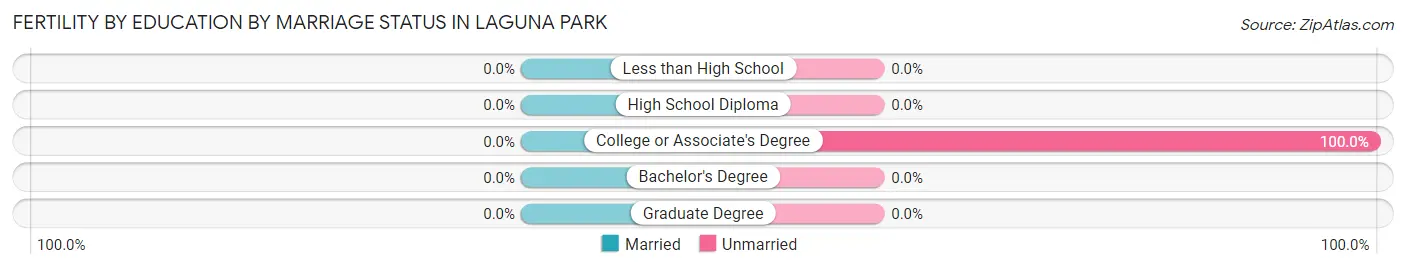
| Educational Attainment | Married | Unmarried |
| Less than High School | 0 (0.0%) | 0 (0.0%) |
| High School Diploma | 0 (0.0%) | 0 (0.0%) |
| College or Associate's Degree | 0 (0.0%) | 8 (100.0%) |
| Bachelor's Degree | 0 (0.0%) | 0 (0.0%) |
| Graduate Degree | 0 (0.0%) | 0 (0.0%) |
| Total | 0 (0.0%) | 8 (100.0%) |
Income in Laguna Park
Income Overview in Laguna Park
Per Capita Income in Laguna Park is $37,840, while median incomes of families and households are $78,220 and $71,959 respectively.
| Characteristic | Number | Measure |
| Per Capita Income | 1,536 | $37,840 |
| Median Family Income | 434 | $78,220 |
| Mean Family Income | 434 | $112,101 |
| Median Household Income | 560 | $71,959 |
| Mean Household Income | 560 | $102,189 |
| Income Deficit | 434 | $0 |
| Wage / Income Gap (%) | 1,536 | 70.61% |
| Wage / Income Gap ($) | 1,536 | 29.39¢ per $1 |
| Gini / Inequality Index | 1,536 | 0.47 |
Earnings by Sex in Laguna Park
Average Earnings in Laguna Park are $46,250, $68,750 for men and $20,208 for women, a difference of 70.6%.
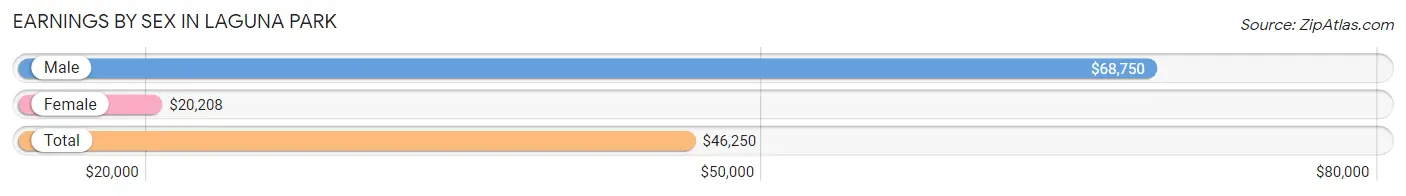
| Sex | Number | Average Earnings |
| Male | 270 (56.4%) | $68,750 |
| Female | 209 (43.6%) | $20,208 |
| Total | 479 (100.0%) | $46,250 |
Earnings by Sex by Income Bracket in Laguna Park
The most common earnings brackets in Laguna Park are $100,000+ for men (63 | 23.3%) and $2,499 or less for women (34 | 16.3%).
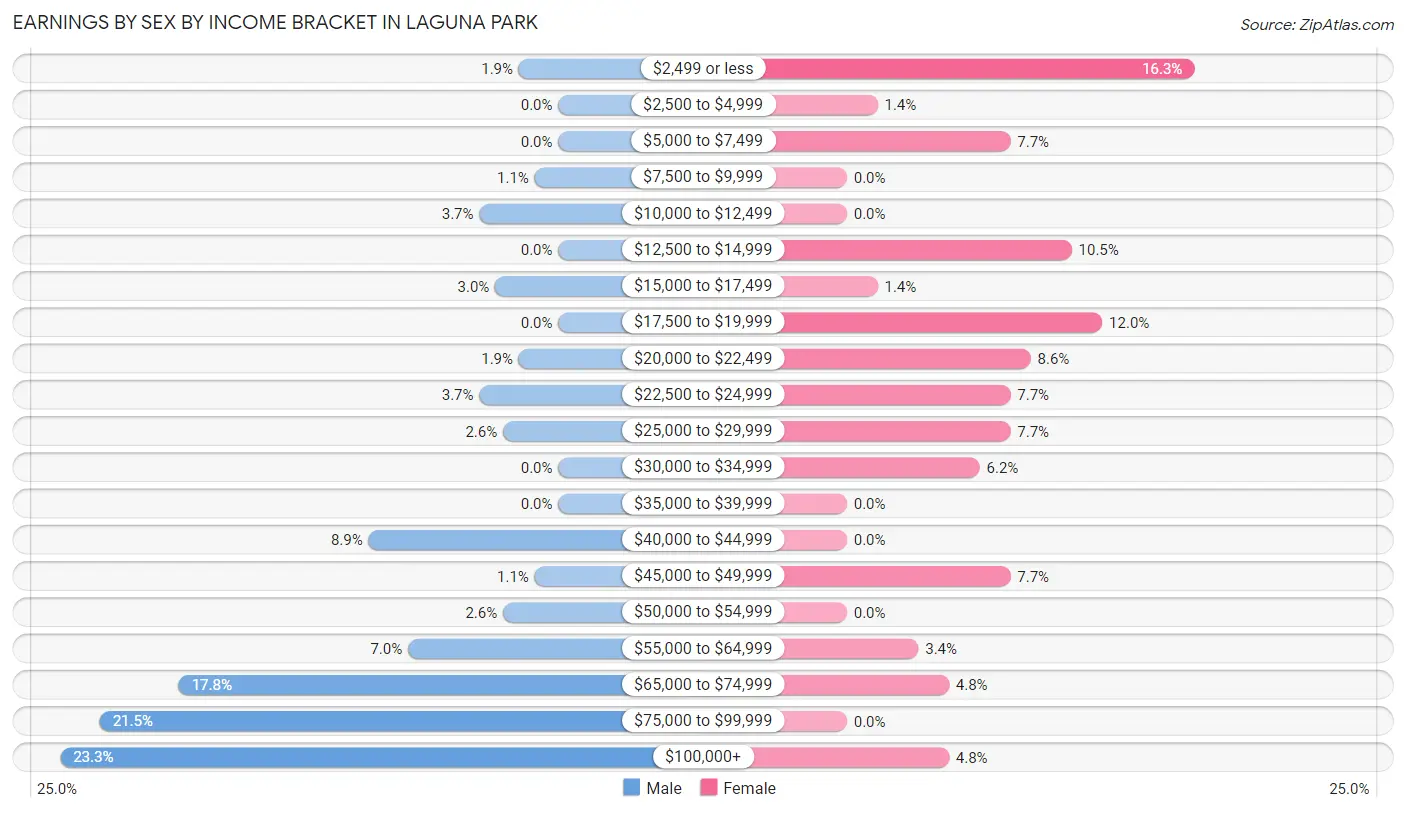
| Income | Male | Female |
| $2,499 or less | 5 (1.8%) | 34 (16.3%) |
| $2,500 to $4,999 | 0 (0.0%) | 3 (1.4%) |
| $5,000 to $7,499 | 0 (0.0%) | 16 (7.7%) |
| $7,500 to $9,999 | 3 (1.1%) | 0 (0.0%) |
| $10,000 to $12,499 | 10 (3.7%) | 0 (0.0%) |
| $12,500 to $14,999 | 0 (0.0%) | 22 (10.5%) |
| $15,000 to $17,499 | 8 (3.0%) | 3 (1.4%) |
| $17,500 to $19,999 | 0 (0.0%) | 25 (12.0%) |
| $20,000 to $22,499 | 5 (1.8%) | 18 (8.6%) |
| $22,500 to $24,999 | 10 (3.7%) | 16 (7.7%) |
| $25,000 to $29,999 | 7 (2.6%) | 16 (7.7%) |
| $30,000 to $34,999 | 0 (0.0%) | 13 (6.2%) |
| $35,000 to $39,999 | 0 (0.0%) | 0 (0.0%) |
| $40,000 to $44,999 | 24 (8.9%) | 0 (0.0%) |
| $45,000 to $49,999 | 3 (1.1%) | 16 (7.7%) |
| $50,000 to $54,999 | 7 (2.6%) | 0 (0.0%) |
| $55,000 to $64,999 | 19 (7.0%) | 7 (3.4%) |
| $65,000 to $74,999 | 48 (17.8%) | 10 (4.8%) |
| $75,000 to $99,999 | 58 (21.5%) | 0 (0.0%) |
| $100,000+ | 63 (23.3%) | 10 (4.8%) |
| Total | 270 (100.0%) | 209 (100.0%) |
Earnings by Sex by Educational Attainment in Laguna Park
Average earnings in Laguna Park are $69,196 for men and $20,694 for women, a difference of 70.1%. Men with an educational attainment of graduate degree enjoy the highest average annual earnings of $195,667, while those with college or associate's degree education earn the least with $69,450. Women with an educational attainment of college or associate's degree earn the most with the average annual earnings of $24,722, while those with high school diploma education have the smallest earnings of $19,250.
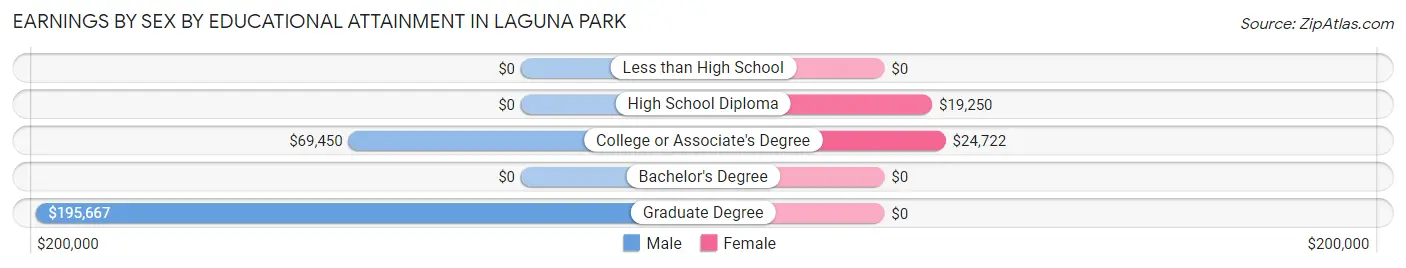
| Educational Attainment | Male Income | Female Income |
| Less than High School | - | - |
| High School Diploma | - | - |
| College or Associate's Degree | $69,450 | $24,722 |
| Bachelor's Degree | - | - |
| Graduate Degree | $195,667 | $0 |
| Total | $69,196 | $20,694 |
Family Income in Laguna Park
Family Income Brackets in Laguna Park
According to the Laguna Park family income data, there are 119 families falling into the $75,000 to $99,999 income range, which is the most common income bracket and makes up 27.4% of all families.
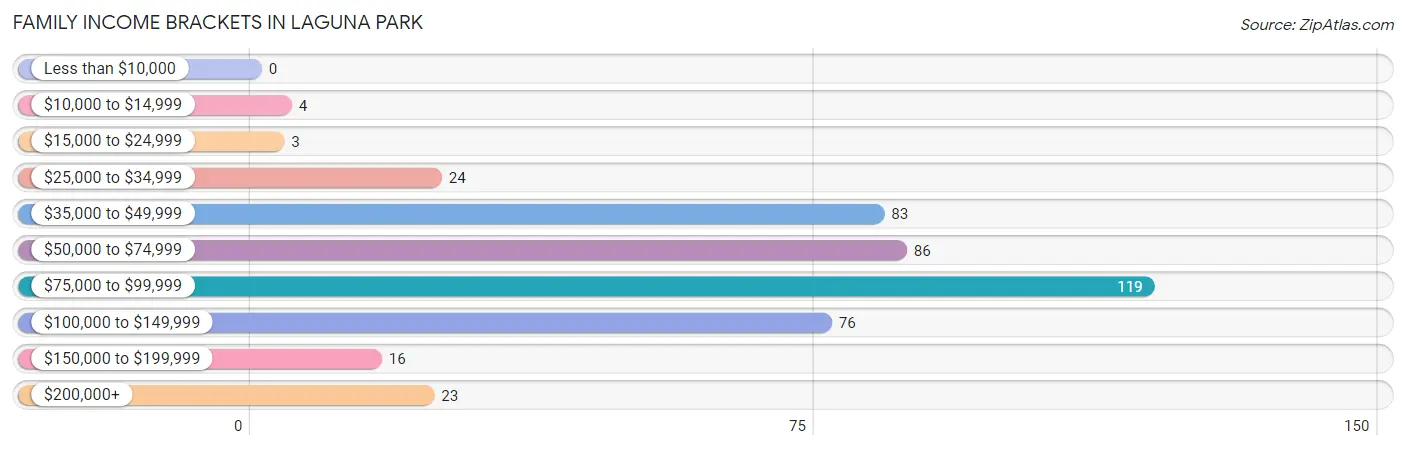
| Income Bracket | # Families | % Families |
| Less than $10,000 | 0 | 0.0% |
| $10,000 to $14,999 | 4 | 0.9% |
| $15,000 to $24,999 | 3 | 0.7% |
| $25,000 to $34,999 | 24 | 5.5% |
| $35,000 to $49,999 | 83 | 19.1% |
| $50,000 to $74,999 | 86 | 19.8% |
| $75,000 to $99,999 | 119 | 27.4% |
| $100,000 to $149,999 | 76 | 17.5% |
| $150,000 to $199,999 | 16 | 3.7% |
| $200,000+ | 23 | 5.3% |
Family Income by Famaliy Size in Laguna Park
3-person families (55 | 12.7%) account for the highest median family income in Laguna Park with $90,125 per family, while 2-person families (251 | 57.8%) have the highest median income of $40,312 per family member.
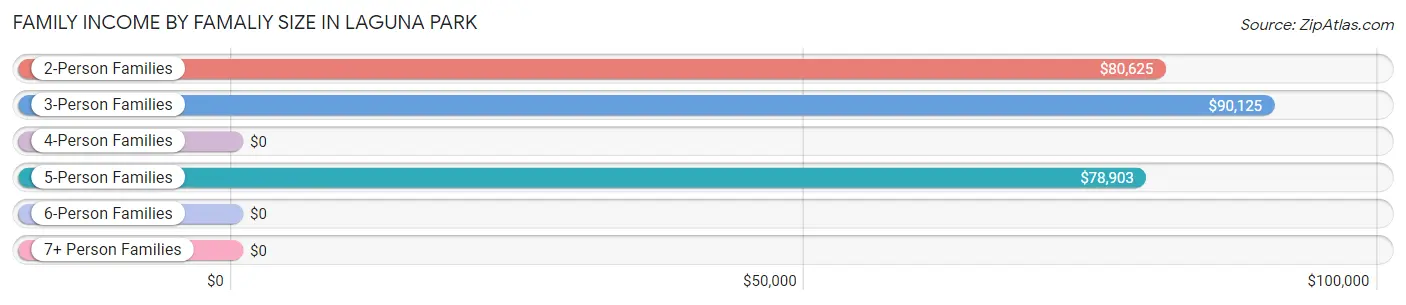
| Income Bracket | # Families | Median Income |
| 2-Person Families | 251 (57.8%) | $80,625 |
| 3-Person Families | 55 (12.7%) | $90,125 |
| 4-Person Families | 12 (2.8%) | $0 |
| 5-Person Families | 83 (19.1%) | $78,903 |
| 6-Person Families | 33 (7.6%) | $0 |
| 7+ Person Families | 0 (0.0%) | $0 |
| Total | 434 (100.0%) | $78,220 |
Family Income by Number of Earners in Laguna Park
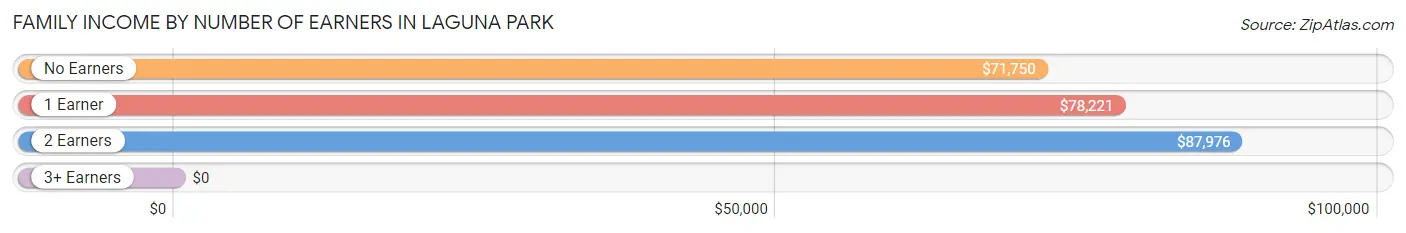
| Number of Earners | # Families | Median Income |
| No Earners | 147 (33.9%) | $71,750 |
| 1 Earner | 170 (39.2%) | $78,221 |
| 2 Earners | 106 (24.4%) | $87,976 |
| 3+ Earners | 11 (2.5%) | $0 |
| Total | 434 (100.0%) | $78,220 |
Household Income in Laguna Park
Household Income Brackets in Laguna Park
With 128 households falling in the category, the $35,000 to $49,999 income range is the most frequent in Laguna Park, accounting for 22.9% of all households.
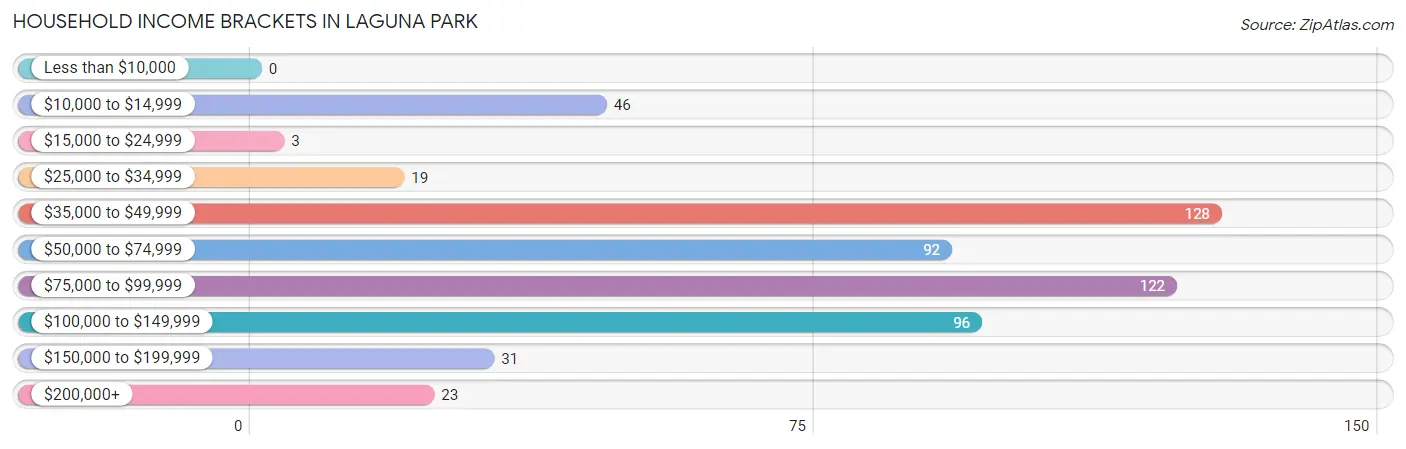
| Income Bracket | # Households | % Households |
| Less than $10,000 | 0 | 0.0% |
| $10,000 to $14,999 | 46 | 8.2% |
| $15,000 to $24,999 | 3 | 0.5% |
| $25,000 to $34,999 | 19 | 3.4% |
| $35,000 to $49,999 | 128 | 22.9% |
| $50,000 to $74,999 | 92 | 16.4% |
| $75,000 to $99,999 | 122 | 21.8% |
| $100,000 to $149,999 | 96 | 17.1% |
| $150,000 to $199,999 | 31 | 5.5% |
| $200,000+ | 23 | 4.1% |
Household Income by Householder Age in Laguna Park
The median household income in Laguna Park is $71,959, with the highest median household income of $79,464 found in the 25 to 44 years age bracket for the primary householder. A total of 119 households (21.2%) fall into this category.
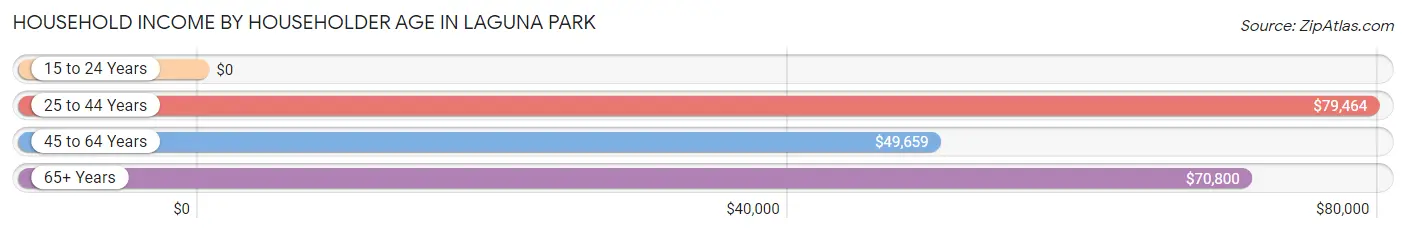
| Income Bracket | # Households | Median Income |
| 15 to 24 Years | 0 (0.0%) | $0 |
| 25 to 44 Years | 119 (21.2%) | $79,464 |
| 45 to 64 Years | 169 (30.2%) | $49,659 |
| 65+ Years | 272 (48.6%) | $70,800 |
| Total | 560 (100.0%) | $71,959 |
Poverty in Laguna Park
Income Below Poverty by Sex and Age in Laguna Park
With 8.2% poverty level for males and 27.4% for females among the residents of Laguna Park, 55 to 64 year old males and 15 year old females are the most vulnerable to poverty, with 36 males (27.7%) and 5 females (100.0%) in their respective age groups living below the poverty level.
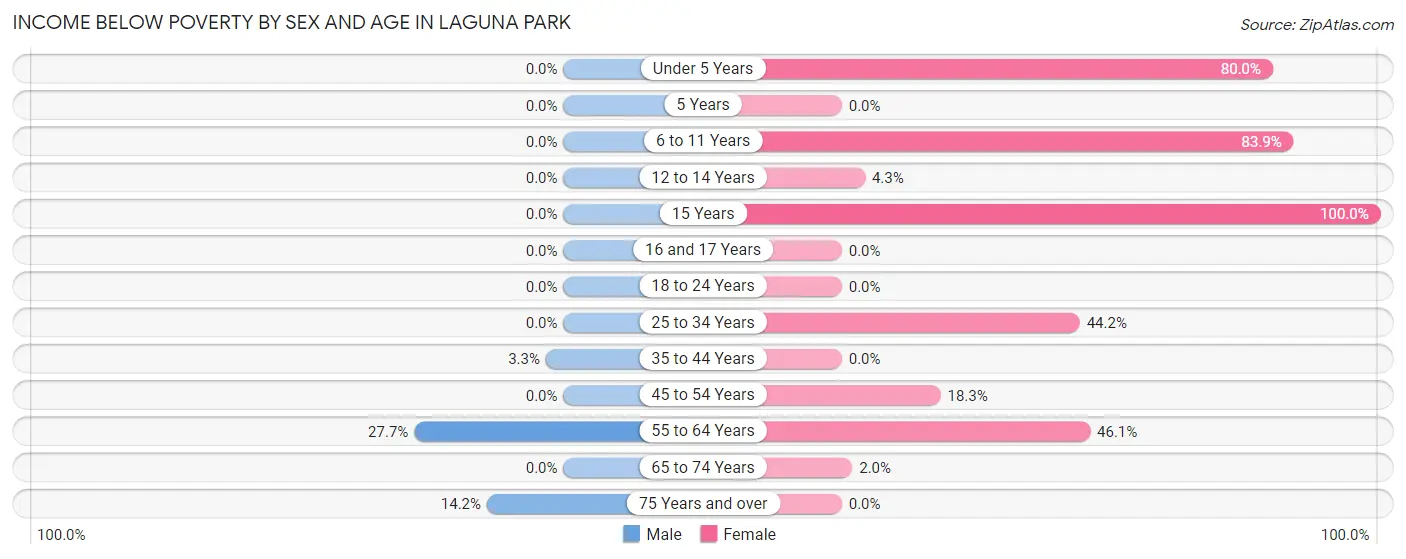
| Age Bracket | Male | Female |
| Under 5 Years | 0 (0.0%) | 24 (80.0%) |
| 5 Years | 0 (0.0%) | 0 (0.0%) |
| 6 to 11 Years | 0 (0.0%) | 78 (83.9%) |
| 12 to 14 Years | 0 (0.0%) | 4 (4.3%) |
| 15 Years | 0 (0.0%) | 5 (100.0%) |
| 16 and 17 Years | 0 (0.0%) | 0 (0.0%) |
| 18 to 24 Years | 0 (0.0%) | 0 (0.0%) |
| 25 to 34 Years | 0 (0.0%) | 34 (44.2%) |
| 35 to 44 Years | 3 (3.3%) | 0 (0.0%) |
| 45 to 54 Years | 0 (0.0%) | 11 (18.3%) |
| 55 to 64 Years | 36 (27.7%) | 53 (46.1%) |
| 65 to 74 Years | 0 (0.0%) | 3 (1.9%) |
| 75 Years and over | 23 (14.2%) | 0 (0.0%) |
| Total | 62 (8.2%) | 212 (27.4%) |
Income Above Poverty by Sex and Age in Laguna Park
According to the poverty statistics in Laguna Park, males aged under 5 years and females aged 18 to 24 years are the age groups that are most secure financially, with 100.0% of males and 100.0% of females in these age groups living above the poverty line.
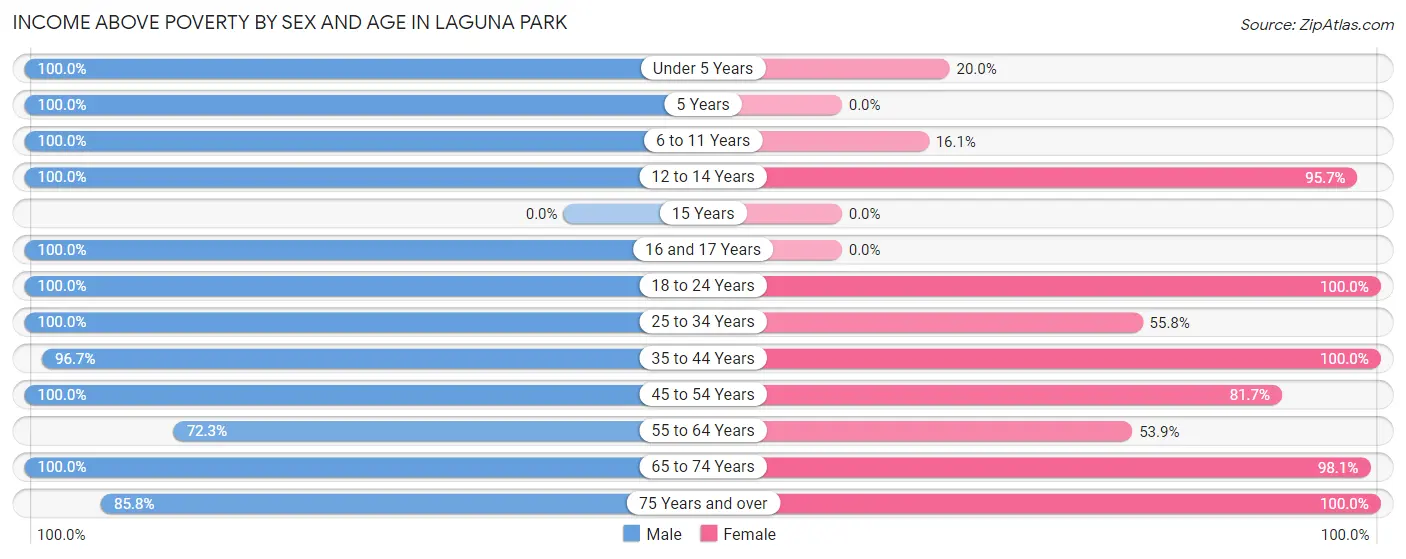
| Age Bracket | Male | Female |
| Under 5 Years | 10 (100.0%) | 6 (20.0%) |
| 5 Years | 23 (100.0%) | 0 (0.0%) |
| 6 to 11 Years | 76 (100.0%) | 15 (16.1%) |
| 12 to 14 Years | 73 (100.0%) | 89 (95.7%) |
| 15 Years | 0 (0.0%) | 0 (0.0%) |
| 16 and 17 Years | 8 (100.0%) | 0 (0.0%) |
| 18 to 24 Years | 10 (100.0%) | 7 (100.0%) |
| 25 to 34 Years | 41 (100.0%) | 43 (55.8%) |
| 35 to 44 Years | 89 (96.7%) | 83 (100.0%) |
| 45 to 54 Years | 50 (100.0%) | 49 (81.7%) |
| 55 to 64 Years | 94 (72.3%) | 62 (53.9%) |
| 65 to 74 Years | 86 (100.0%) | 151 (98.1%) |
| 75 Years and over | 139 (85.8%) | 58 (100.0%) |
| Total | 699 (91.8%) | 563 (72.7%) |
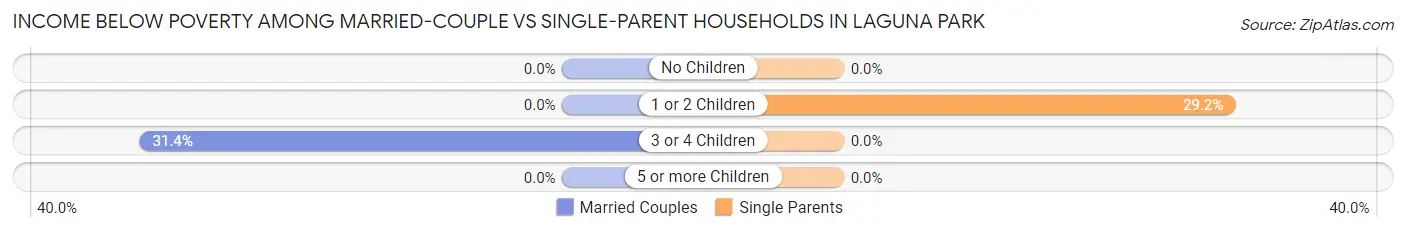
Income Below Poverty Among Married-Couple Families in Laguna Park
The poverty statistics for married-couple families in Laguna Park show that 8.3% or 33 of the total 396 families live below the poverty line. Families with 3 or 4 children have the highest poverty rate of 31.4%, comprising of 33 families. On the other hand, families with no children have the lowest poverty rate of 0.0%, which includes 0 families.
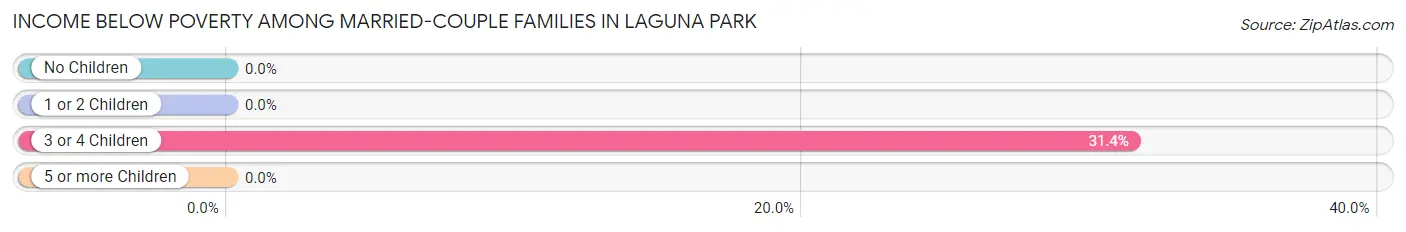
| Children | Above Poverty | Below Poverty |
| No Children | 275 (100.0%) | 0 (0.0%) |
| 1 or 2 Children | 16 (100.0%) | 0 (0.0%) |
| 3 or 4 Children | 72 (68.6%) | 33 (31.4%) |
| 5 or more Children | 0 (0.0%) | 0 (0.0%) |
| Total | 363 (91.7%) | 33 (8.3%) |
Income Below Poverty Among Single-Parent Households in Laguna Park
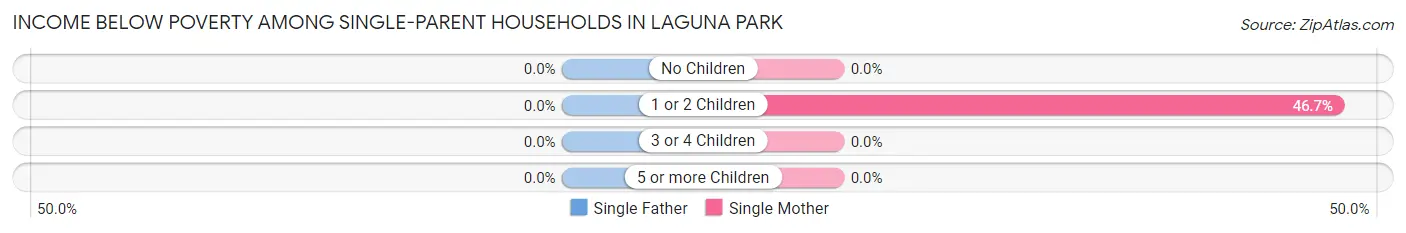
| Children | Single Father | Single Mother |
| No Children | 0 (0.0%) | 0 (0.0%) |
| 1 or 2 Children | 0 (0.0%) | 7 (46.7%) |
| 3 or 4 Children | 0 (0.0%) | 0 (0.0%) |
| 5 or more Children | 0 (0.0%) | 0 (0.0%) |
| Total | 0 (0.0%) | 7 (24.1%) |
Income Below Poverty Among Married-Couple vs Single-Parent Households in Laguna Park
The poverty data for Laguna Park shows that 33 of the married-couple family households (8.3%) and 7 of the single-parent households (18.4%) are living below the poverty level. Within the married-couple family households, those with 3 or 4 children have the highest poverty rate, with 33 households (31.4%) falling below the poverty line. Among the single-parent households, those with 1 or 2 children have the highest poverty rate, with 7 household (29.2%) living below poverty.
| Children | Married-Couple Families | Single-Parent Households |
| No Children | 0 (0.0%) | 0 (0.0%) |
| 1 or 2 Children | 0 (0.0%) | 7 (29.2%) |
| 3 or 4 Children | 33 (31.4%) | 0 (0.0%) |
| 5 or more Children | 0 (0.0%) | 0 (0.0%) |
| Total | 33 (8.3%) | 7 (18.4%) |
Employment Characteristics in Laguna Park
Employment by Class of Employer in Laguna Park
Among the 436 employed individuals in Laguna Park, private company employees (303 | 69.5%), not-for-profit organizations (38 | 8.7%), and self-employed (not incorporated) (28 | 6.4%) make up the most common classes of employment.
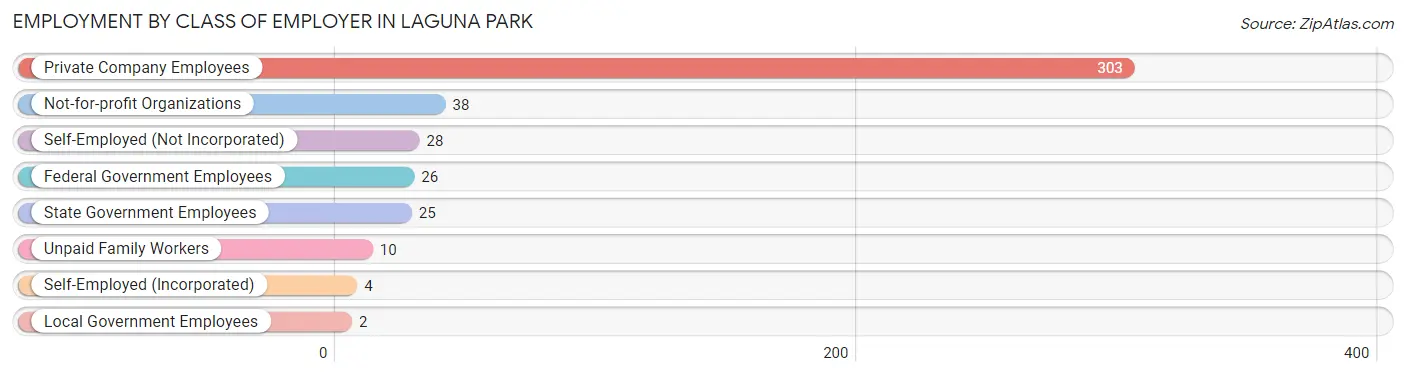
| Employer Class | # Employees | % Employees |
| Private Company Employees | 303 | 69.5% |
| Self-Employed (Incorporated) | 4 | 0.9% |
| Self-Employed (Not Incorporated) | 28 | 6.4% |
| Not-for-profit Organizations | 38 | 8.7% |
| Local Government Employees | 2 | 0.5% |
| State Government Employees | 25 | 5.7% |
| Federal Government Employees | 26 | 6.0% |
| Unpaid Family Workers | 10 | 2.3% |
| Total | 436 | 100.0% |
Employment Status by Age in Laguna Park
According to the labor force statistics for Laguna Park, out of the total population over 16 years of age (1,133), 41.0% or 465 individuals are in the labor force, with 4.3% or 20 of them unemployed. The age group with the highest labor force participation rate is 20 to 24 years, with 100.0% or 17 individuals in the labor force. Within the labor force, the 55 to 59 years age range has the highest percentage of unemployed individuals, with 15.1% or 11 of them being unemployed.
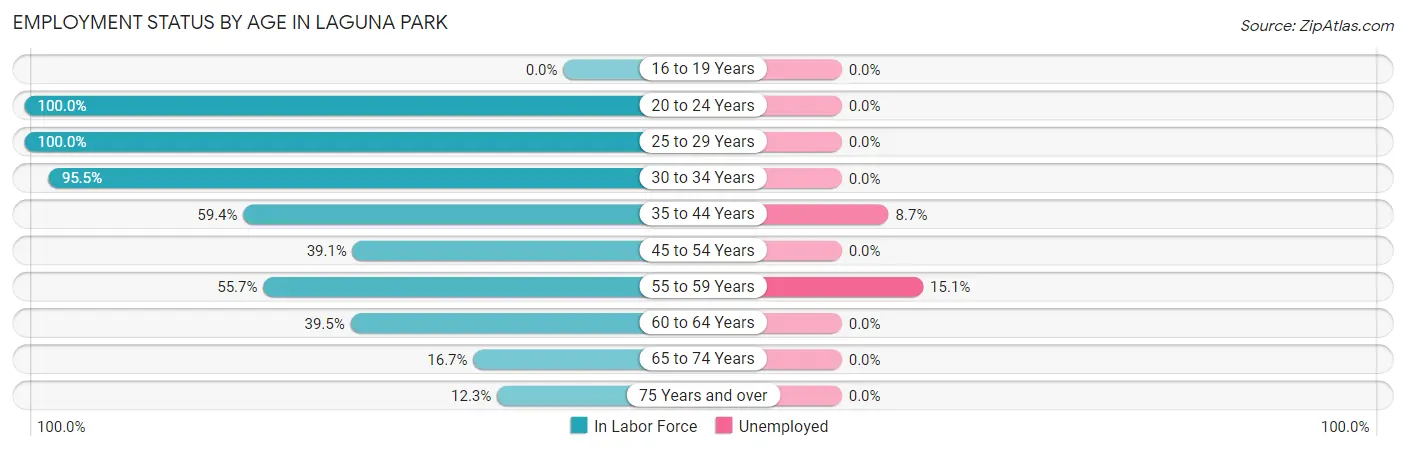
| Age Bracket | In Labor Force | Unemployed |
| 16 to 19 Years | 0 (0.0%) | 0 (0.0%) |
| 20 to 24 Years | 17 (100.0%) | 0 (0.0%) |
| 25 to 29 Years | 51 (100.0%) | 0 (0.0%) |
| 30 to 34 Years | 64 (95.5%) | 0 (0.0%) |
| 35 to 44 Years | 104 (59.4%) | 9 (8.7%) |
| 45 to 54 Years | 43 (39.1%) | 0 (0.0%) |
| 55 to 59 Years | 73 (55.7%) | 11 (15.1%) |
| 60 to 64 Years | 45 (39.5%) | 0 (0.0%) |
| 65 to 74 Years | 40 (16.7%) | 0 (0.0%) |
| 75 Years and over | 27 (12.3%) | 0 (0.0%) |
| Total | 465 (41.0%) | 20 (4.3%) |
Employment Status by Educational Attainment in Laguna Park
According to labor force statistics for Laguna Park, 58.6% of individuals (380) out of the total population between 25 and 64 years of age (648) are in the labor force, with 5.3% or 20 of them being unemployed. The group with the highest labor force participation rate are those with the educational attainment of bachelor's degree or higher, with 76.2% or 64 individuals in the labor force. Within the labor force, individuals with less than high school education have the highest percentage of unemployment, with 19.6% or 9 of them being unemployed.
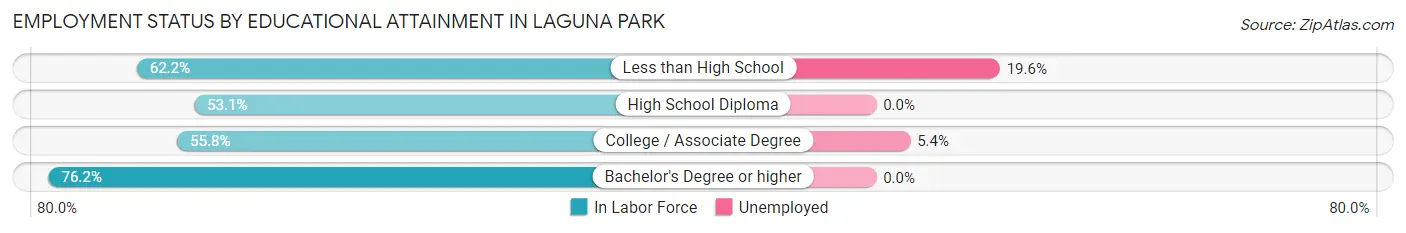
| Educational Attainment | In Labor Force | Unemployed |
| Less than High School | 46 (62.2%) | 15 (19.6%) |
| High School Diploma | 68 (53.1%) | 0 (0.0%) |
| College / Associate Degree | 202 (55.8%) | 20 (5.4%) |
| Bachelor's Degree or higher | 64 (76.2%) | 0 (0.0%) |
| Total | 380 (58.6%) | 34 (5.3%) |
Employment Occupations by Sex in Laguna Park
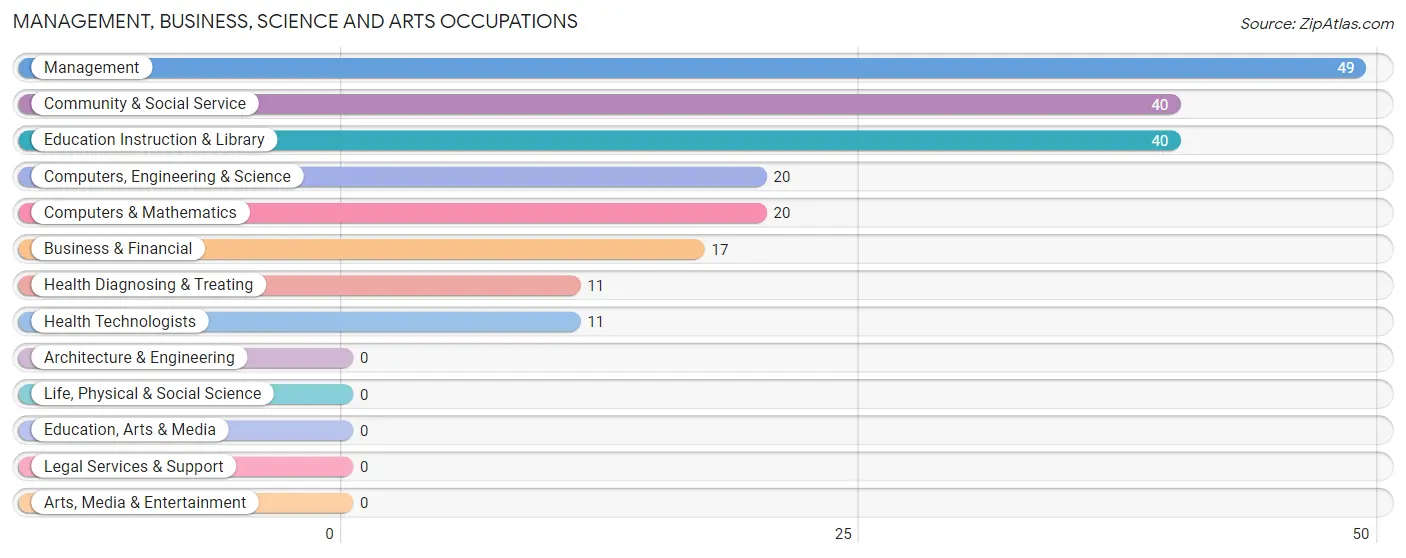
Management, Business, Science and Arts Occupations
The most common Management, Business, Science and Arts occupations in Laguna Park are Management (49 | 11.0%), Community & Social Service (40 | 9.0%), Education Instruction & Library (40 | 9.0%), Computers, Engineering & Science (20 | 4.5%), and Computers & Mathematics (20 | 4.5%).
Management, Business, Science and Arts Occupations by Sex
Within the Management, Business, Science and Arts occupations in Laguna Park, the most male-oriented occupations are Computers, Engineering & Science (100.0%), Computers & Mathematics (100.0%), and Health Diagnosing & Treating (100.0%), while the most female-oriented occupations are Business & Financial (100.0%), Community & Social Service (57.5%), and Education Instruction & Library (57.5%).
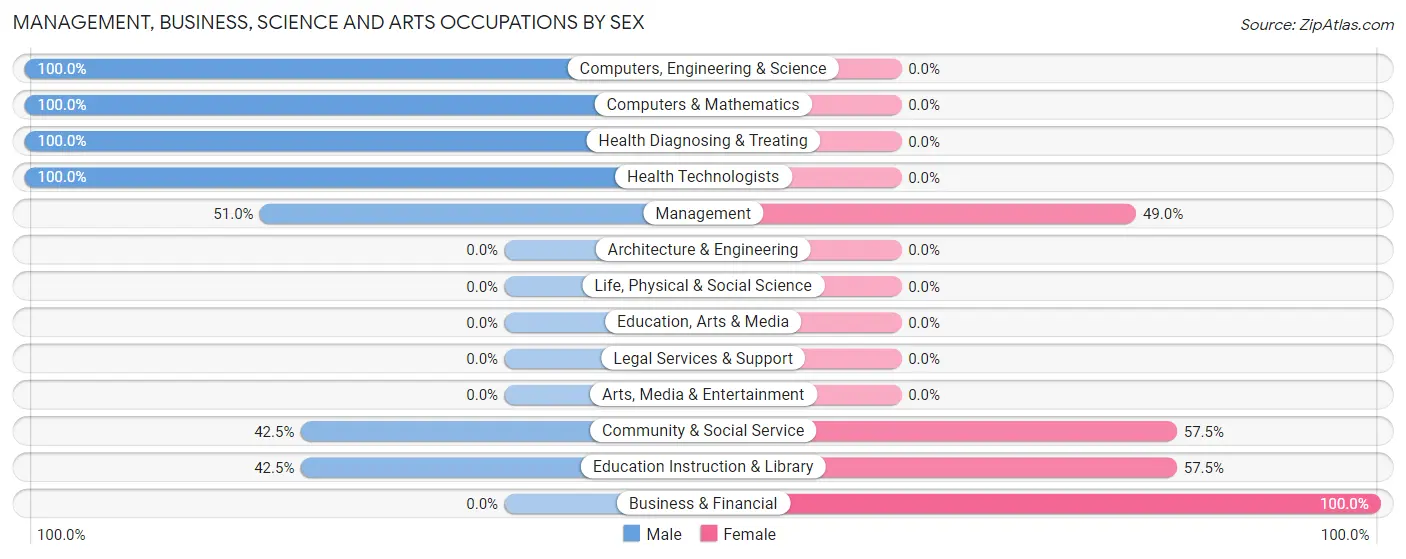
| Occupation | Male | Female |
| Management | 25 (51.0%) | 24 (49.0%) |
| Business & Financial | 0 (0.0%) | 17 (100.0%) |
| Computers, Engineering & Science | 20 (100.0%) | 0 (0.0%) |
| Computers & Mathematics | 20 (100.0%) | 0 (0.0%) |
| Architecture & Engineering | 0 (0.0%) | 0 (0.0%) |
| Life, Physical & Social Science | 0 (0.0%) | 0 (0.0%) |
| Community & Social Service | 17 (42.5%) | 23 (57.5%) |
| Education, Arts & Media | 0 (0.0%) | 0 (0.0%) |
| Legal Services & Support | 0 (0.0%) | 0 (0.0%) |
| Education Instruction & Library | 17 (42.5%) | 23 (57.5%) |
| Arts, Media & Entertainment | 0 (0.0%) | 0 (0.0%) |
| Health Diagnosing & Treating | 11 (100.0%) | 0 (0.0%) |
| Health Technologists | 11 (100.0%) | 0 (0.0%) |
| Total (Category) | 73 (53.3%) | 64 (46.7%) |
| Total (Overall) | 250 (56.3%) | 194 (43.7%) |
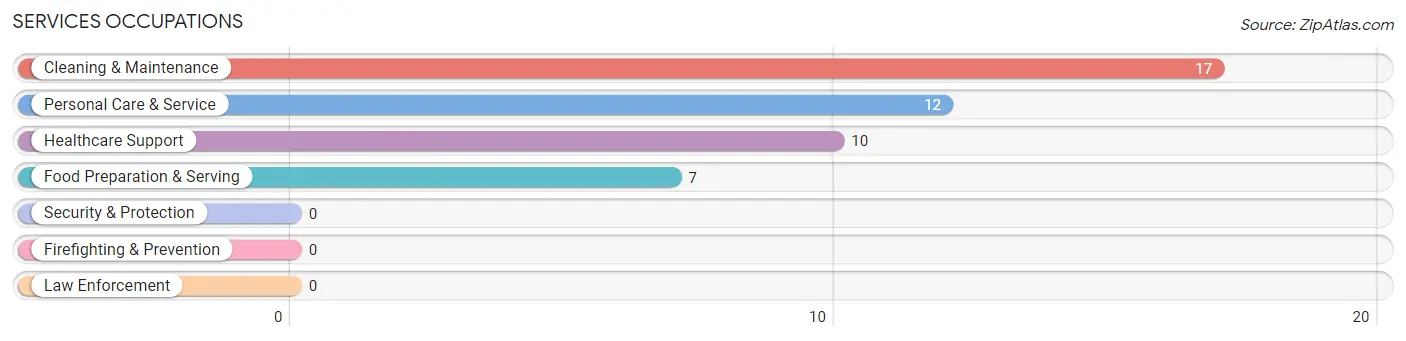
Services Occupations
The most common Services occupations in Laguna Park are Cleaning & Maintenance (17 | 3.8%), Personal Care & Service (12 | 2.7%), Healthcare Support (10 | 2.2%), and Food Preparation & Serving (7 | 1.6%).
Services Occupations by Sex
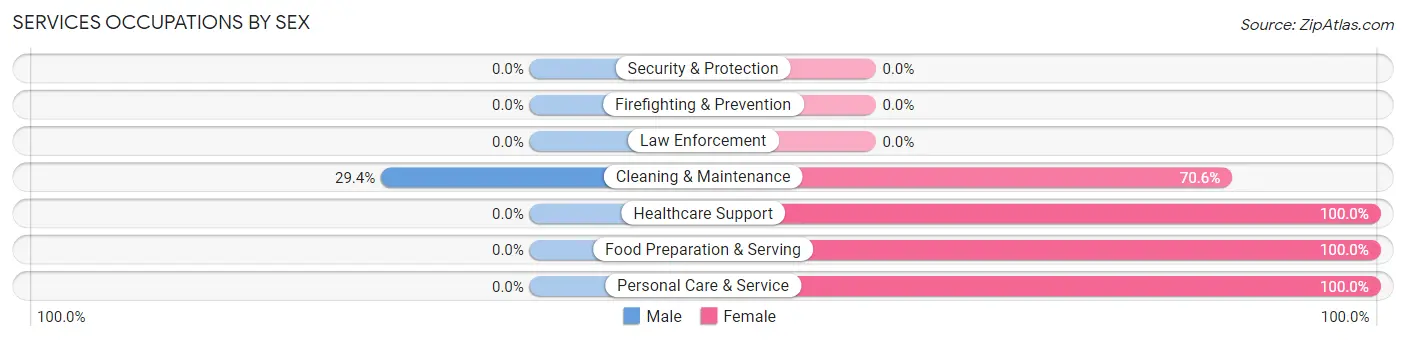
| Occupation | Male | Female |
| Healthcare Support | 0 (0.0%) | 10 (100.0%) |
| Security & Protection | 0 (0.0%) | 0 (0.0%) |
| Firefighting & Prevention | 0 (0.0%) | 0 (0.0%) |
| Law Enforcement | 0 (0.0%) | 0 (0.0%) |
| Food Preparation & Serving | 0 (0.0%) | 7 (100.0%) |
| Cleaning & Maintenance | 5 (29.4%) | 12 (70.6%) |
| Personal Care & Service | 0 (0.0%) | 12 (100.0%) |
| Total (Category) | 5 (10.9%) | 41 (89.1%) |
| Total (Overall) | 250 (56.3%) | 194 (43.7%) |
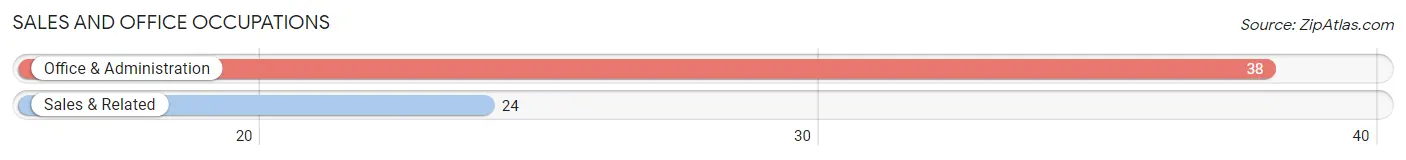
Sales and Office Occupations
The most common Sales and Office occupations in Laguna Park are Office & Administration (38 | 8.6%), and Sales & Related (24 | 5.4%).
Sales and Office Occupations by Sex
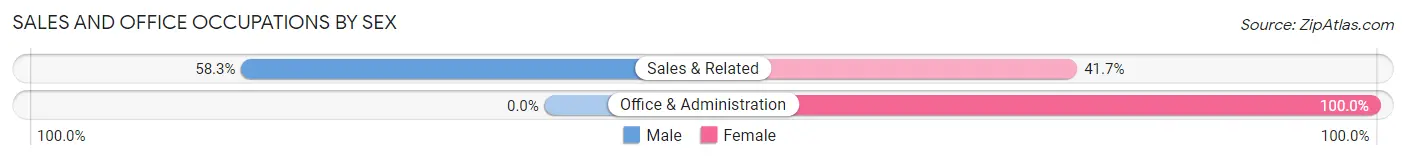
| Occupation | Male | Female |
| Sales & Related | 14 (58.3%) | 10 (41.7%) |
| Office & Administration | 0 (0.0%) | 38 (100.0%) |
| Total (Category) | 14 (22.6%) | 48 (77.4%) |
| Total (Overall) | 250 (56.3%) | 194 (43.7%) |
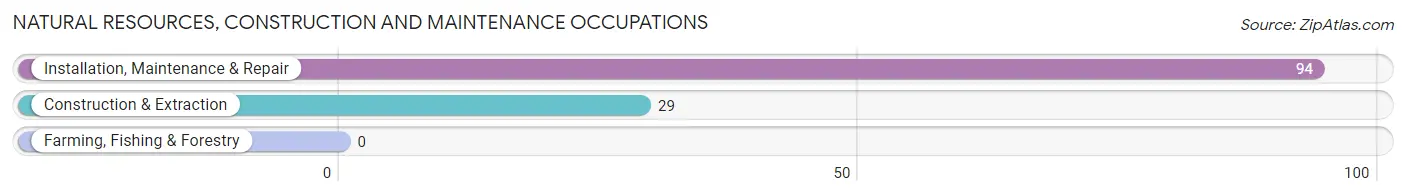
Natural Resources, Construction and Maintenance Occupations
The most common Natural Resources, Construction and Maintenance occupations in Laguna Park are Installation, Maintenance & Repair (94 | 21.2%), and Construction & Extraction (29 | 6.5%).
Natural Resources, Construction and Maintenance Occupations by Sex
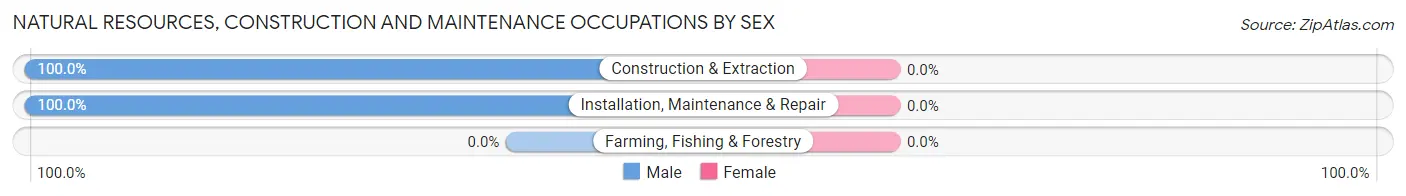
| Occupation | Male | Female |
| Farming, Fishing & Forestry | 0 (0.0%) | 0 (0.0%) |
| Construction & Extraction | 29 (100.0%) | 0 (0.0%) |
| Installation, Maintenance & Repair | 94 (100.0%) | 0 (0.0%) |
| Total (Category) | 123 (100.0%) | 0 (0.0%) |
| Total (Overall) | 250 (56.3%) | 194 (43.7%) |
Production, Transportation and Moving Occupations
The most common Production, Transportation and Moving occupations in Laguna Park are Production (65 | 14.6%), and Transportation (11 | 2.5%).
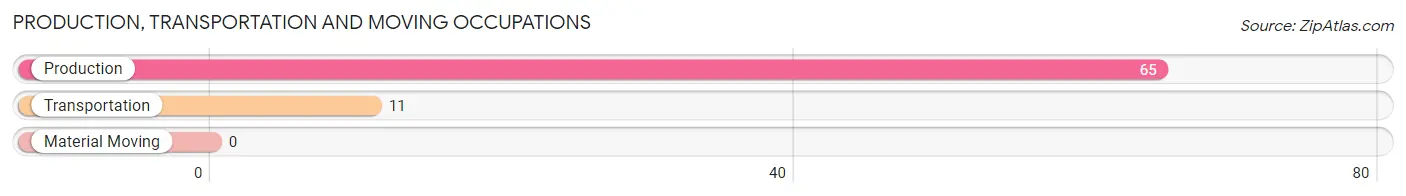
Production, Transportation and Moving Occupations by Sex
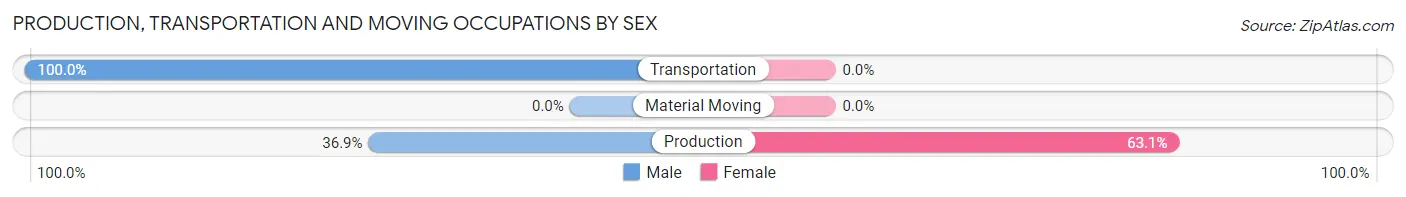
| Occupation | Male | Female |
| Production | 24 (36.9%) | 41 (63.1%) |
| Transportation | 11 (100.0%) | 0 (0.0%) |
| Material Moving | 0 (0.0%) | 0 (0.0%) |
| Total (Category) | 35 (46.1%) | 41 (53.9%) |
| Total (Overall) | 250 (56.3%) | 194 (43.7%) |
Employment Industries by Sex in Laguna Park
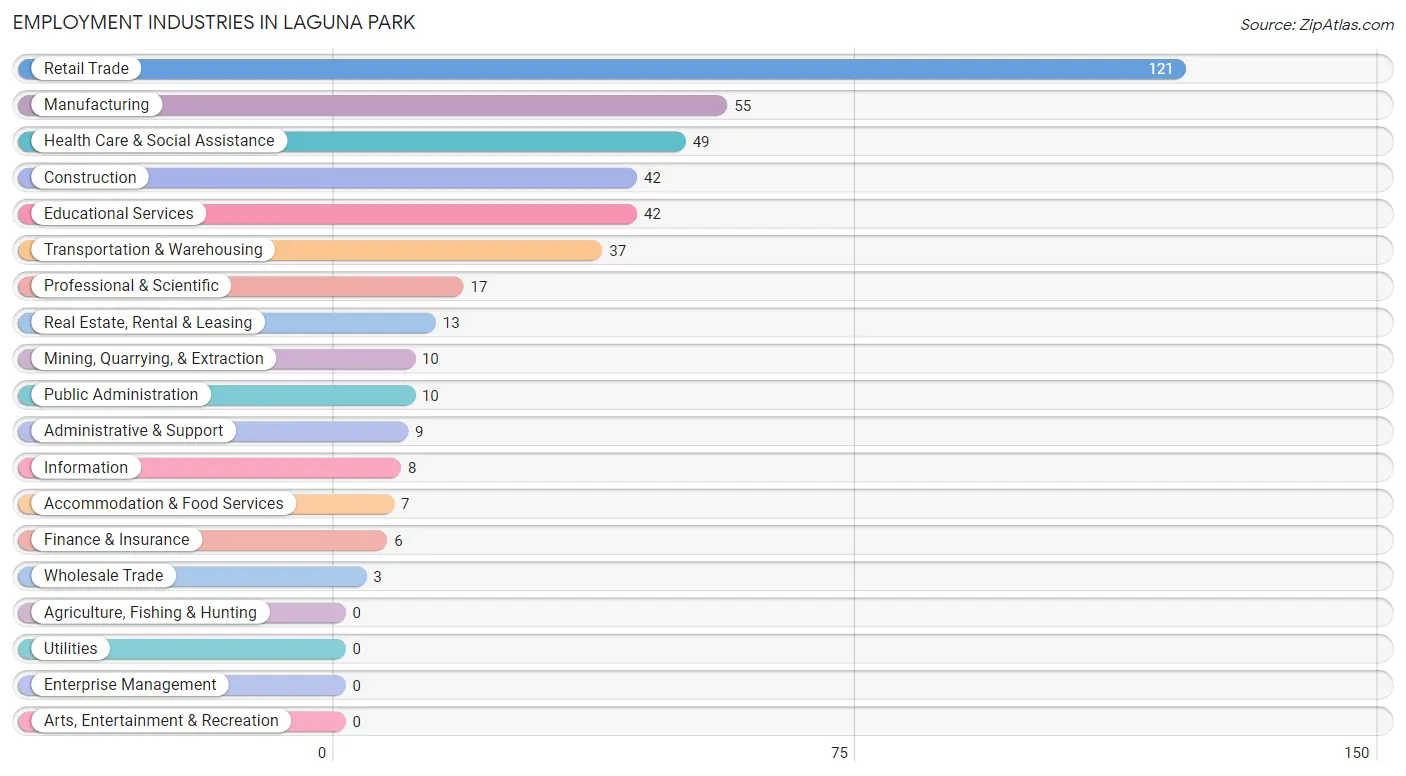
Employment Industries in Laguna Park
The major employment industries in Laguna Park include Retail Trade (121 | 27.3%), Manufacturing (55 | 12.4%), Health Care & Social Assistance (49 | 11.0%), Construction (42 | 9.5%), and Educational Services (42 | 9.5%).
Employment Industries by Sex in Laguna Park
The Laguna Park industries that see more men than women are Mining, Quarrying, & Extraction (100.0%), Wholesale Trade (100.0%), and Public Administration (100.0%), whereas the industries that tend to have a higher number of women are Information (100.0%), Finance & Insurance (100.0%), and Administrative & Support (100.0%).
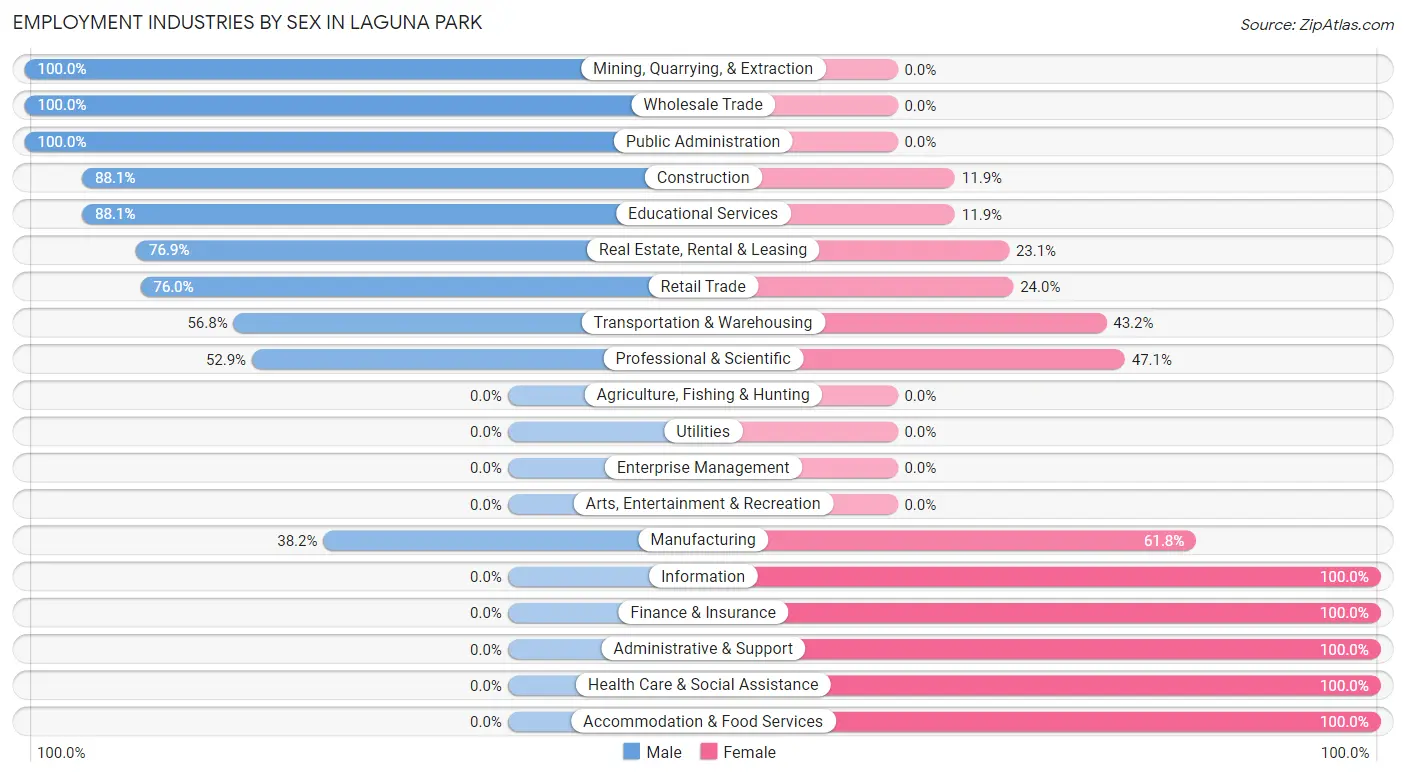
| Industry | Male | Female |
| Agriculture, Fishing & Hunting | 0 (0.0%) | 0 (0.0%) |
| Mining, Quarrying, & Extraction | 10 (100.0%) | 0 (0.0%) |
| Construction | 37 (88.1%) | 5 (11.9%) |
| Manufacturing | 21 (38.2%) | 34 (61.8%) |
| Wholesale Trade | 3 (100.0%) | 0 (0.0%) |
| Retail Trade | 92 (76.0%) | 29 (24.0%) |
| Transportation & Warehousing | 21 (56.8%) | 16 (43.2%) |
| Utilities | 0 (0.0%) | 0 (0.0%) |
| Information | 0 (0.0%) | 8 (100.0%) |
| Finance & Insurance | 0 (0.0%) | 6 (100.0%) |
| Real Estate, Rental & Leasing | 10 (76.9%) | 3 (23.1%) |
| Professional & Scientific | 9 (52.9%) | 8 (47.1%) |
| Enterprise Management | 0 (0.0%) | 0 (0.0%) |
| Administrative & Support | 0 (0.0%) | 9 (100.0%) |
| Educational Services | 37 (88.1%) | 5 (11.9%) |
| Health Care & Social Assistance | 0 (0.0%) | 49 (100.0%) |
| Arts, Entertainment & Recreation | 0 (0.0%) | 0 (0.0%) |
| Accommodation & Food Services | 0 (0.0%) | 7 (100.0%) |
| Public Administration | 10 (100.0%) | 0 (0.0%) |
| Total | 250 (56.3%) | 194 (43.7%) |
Education in Laguna Park
School Enrollment in Laguna Park
The most common levels of schooling among the 423 students in Laguna Park are middle school (105 | 24.8%), elementary school (103 | 24.3%), and high school (69 | 16.3%).
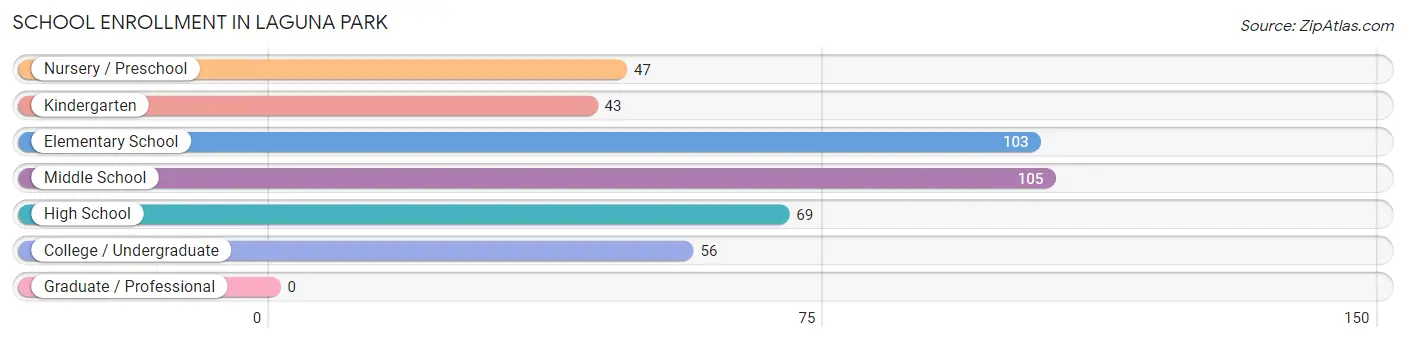
| School Level | # Students | % Students |
| Nursery / Preschool | 47 | 11.1% |
| Kindergarten | 43 | 10.2% |
| Elementary School | 103 | 24.3% |
| Middle School | 105 | 24.8% |
| High School | 69 | 16.3% |
| College / Undergraduate | 56 | 13.2% |
| Graduate / Professional | 0 | 0.0% |
| Total | 423 | 100.0% |
School Enrollment by Age by Funding Source in Laguna Park
Out of a total of 423 students who are enrolled in schools in Laguna Park, 192 (45.4%) attend a private institution, while the remaining 231 (54.6%) are enrolled in public schools. The age group of 3 to 4 year olds has the highest likelihood of being enrolled in private schools, with 24 (100.0% in the age bracket) enrolled. Conversely, the age group of 20 to 24 year olds has the lowest likelihood of being enrolled in a private school, with 7 (100.0% in the age bracket) attending a public institution.
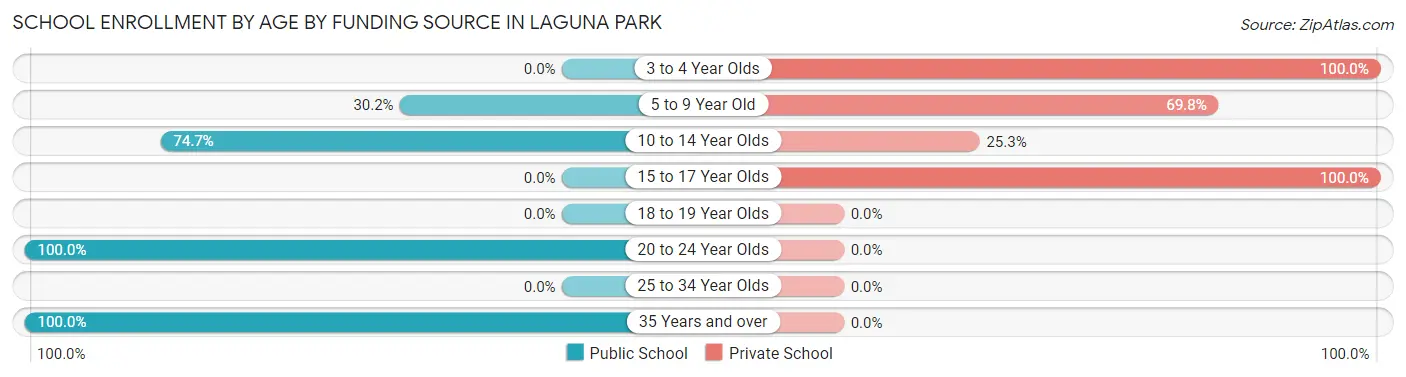
| Age Bracket | Public School | Private School |
| 3 to 4 Year Olds | 0 (0.0%) | 24 (100.0%) |
| 5 to 9 Year Old | 51 (30.2%) | 118 (69.8%) |
| 10 to 14 Year Olds | 124 (74.7%) | 42 (25.3%) |
| 15 to 17 Year Olds | 0 (0.0%) | 8 (100.0%) |
| 18 to 19 Year Olds | 0 (0.0%) | 0 (0.0%) |
| 20 to 24 Year Olds | 7 (100.0%) | 0 (0.0%) |
| 25 to 34 Year Olds | 0 (0.0%) | 0 (0.0%) |
| 35 Years and over | 49 (100.0%) | 0 (0.0%) |
| Total | 231 (54.6%) | 192 (45.4%) |
Educational Attainment by Field of Study in Laguna Park
Liberal arts & history (48 | 23.3%), business (40 | 19.4%), science & technology (34 | 16.5%), bio, nature & agricultural (24 | 11.7%), and social sciences (18 | 8.7%) are the most common fields of study among 206 individuals in Laguna Park who have obtained a bachelor's degree or higher.
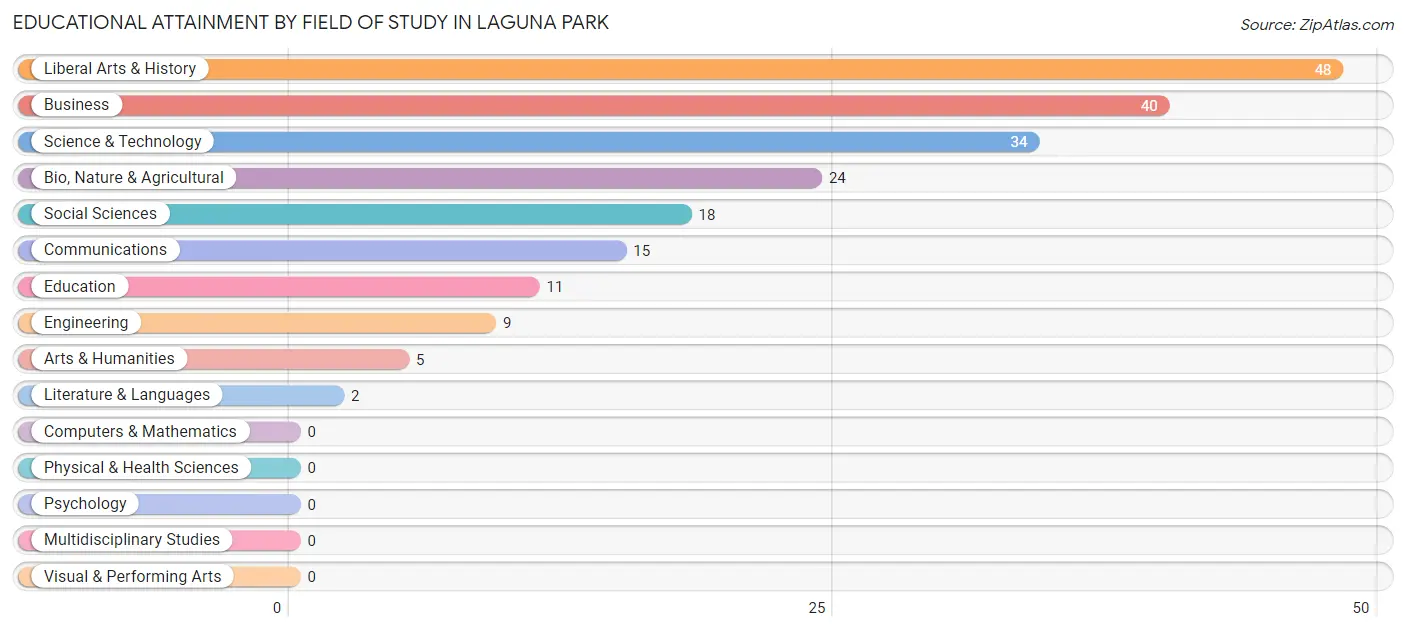
| Field of Study | # Graduates | % Graduates |
| Computers & Mathematics | 0 | 0.0% |
| Bio, Nature & Agricultural | 24 | 11.7% |
| Physical & Health Sciences | 0 | 0.0% |
| Psychology | 0 | 0.0% |
| Social Sciences | 18 | 8.7% |
| Engineering | 9 | 4.4% |
| Multidisciplinary Studies | 0 | 0.0% |
| Science & Technology | 34 | 16.5% |
| Business | 40 | 19.4% |
| Education | 11 | 5.3% |
| Literature & Languages | 2 | 1.0% |
| Liberal Arts & History | 48 | 23.3% |
| Visual & Performing Arts | 0 | 0.0% |
| Communications | 15 | 7.3% |
| Arts & Humanities | 5 | 2.4% |
| Total | 206 | 100.0% |
Transportation & Commute in Laguna Park
Vehicle Availability by Sex in Laguna Park
The most prevalent vehicle ownership categories in Laguna Park are males with 2 vehicles (150, accounting for 60.0%) and females with 2 vehicles (76, making up 80.6%).
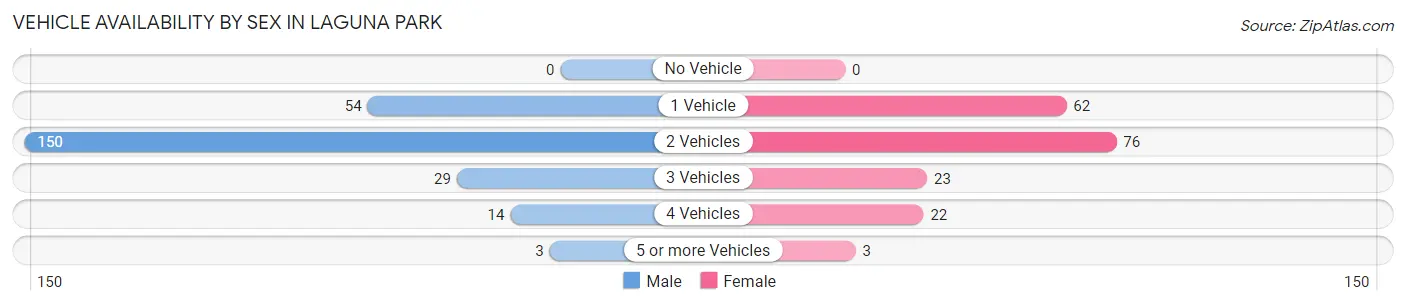
| Vehicles Available | Male | Female |
| No Vehicle | 0 (0.0%) | 0 (0.0%) |
| 1 Vehicle | 54 (21.6%) | 62 (33.3%) |
| 2 Vehicles | 150 (60.0%) | 76 (40.9%) |
| 3 Vehicles | 29 (11.6%) | 23 (12.4%) |
| 4 Vehicles | 14 (5.6%) | 22 (11.8%) |
| 5 or more Vehicles | 3 (1.2%) | 3 (1.6%) |
| Total | 250 (100.0%) | 186 (100.0%) |
Commute Time in Laguna Park
The most frequently occuring commute durations in Laguna Park are 45 to 59 minutes (102 commuters, 26.6%), 25 to 29 minutes (59 commuters, 15.4%), and 60 to 89 minutes (50 commuters, 13.0%).
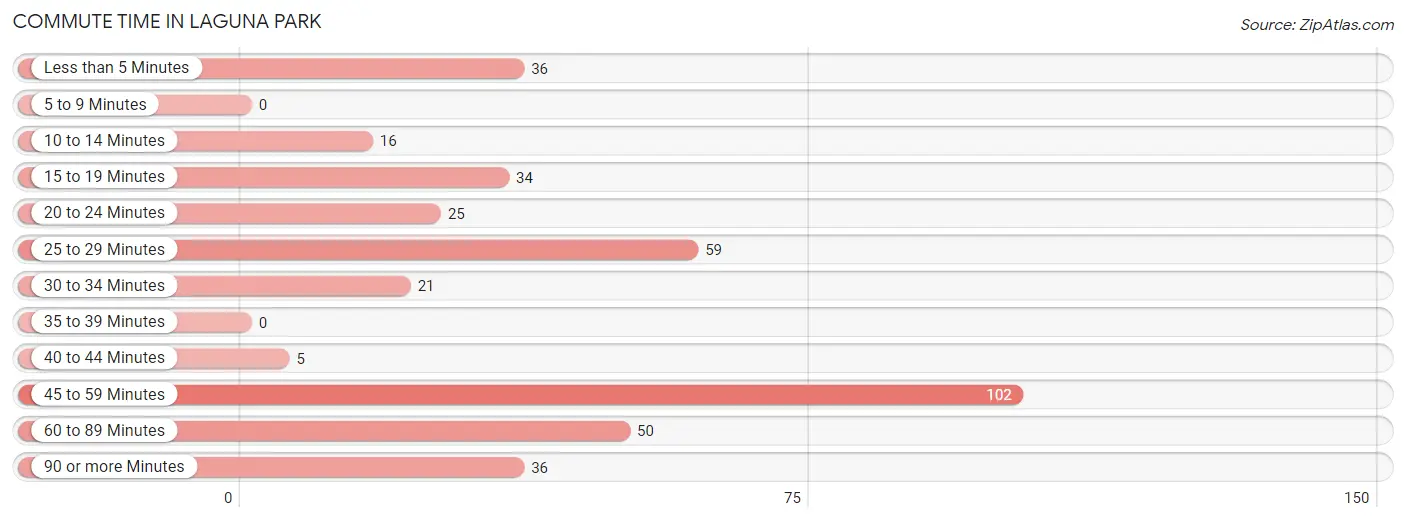
| Commute Time | # Commuters | % Commuters |
| Less than 5 Minutes | 36 | 9.4% |
| 5 to 9 Minutes | 0 | 0.0% |
| 10 to 14 Minutes | 16 | 4.2% |
| 15 to 19 Minutes | 34 | 8.8% |
| 20 to 24 Minutes | 25 | 6.5% |
| 25 to 29 Minutes | 59 | 15.4% |
| 30 to 34 Minutes | 21 | 5.5% |
| 35 to 39 Minutes | 0 | 0.0% |
| 40 to 44 Minutes | 5 | 1.3% |
| 45 to 59 Minutes | 102 | 26.6% |
| 60 to 89 Minutes | 50 | 13.0% |
| 90 or more Minutes | 36 | 9.4% |
Commute Time by Sex in Laguna Park
The most common commute times in Laguna Park are 45 to 59 minutes (87 commuters, 41.4%) for males and 25 to 29 minutes (34 commuters, 19.5%) for females.
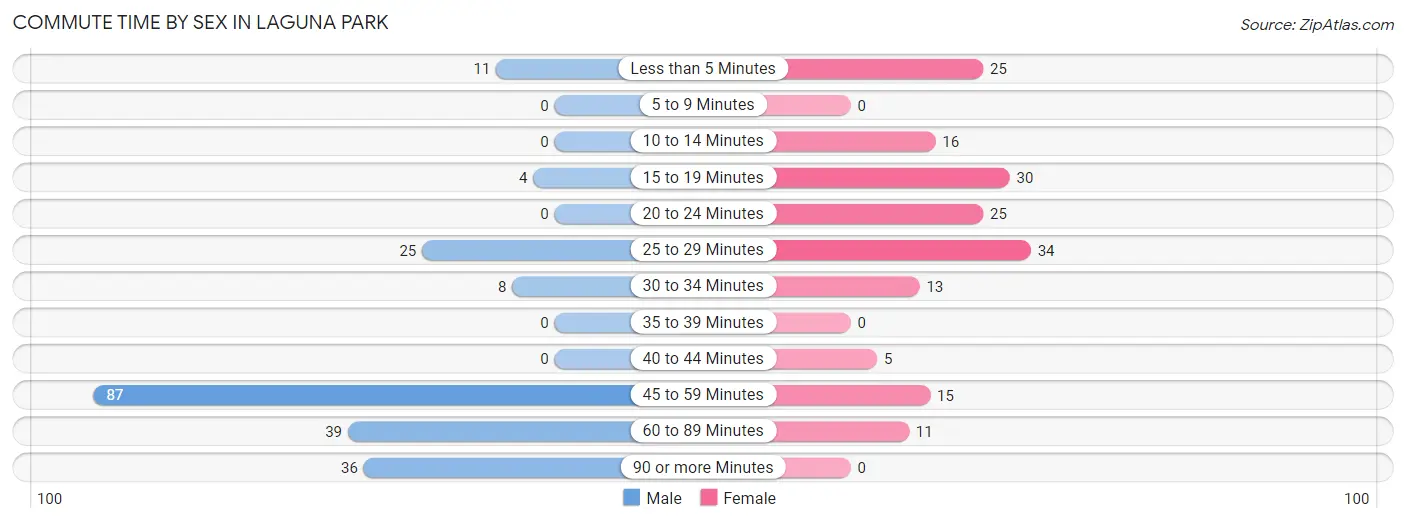
| Commute Time | Male | Female |
| Less than 5 Minutes | 11 (5.2%) | 25 (14.4%) |
| 5 to 9 Minutes | 0 (0.0%) | 0 (0.0%) |
| 10 to 14 Minutes | 0 (0.0%) | 16 (9.2%) |
| 15 to 19 Minutes | 4 (1.9%) | 30 (17.2%) |
| 20 to 24 Minutes | 0 (0.0%) | 25 (14.4%) |
| 25 to 29 Minutes | 25 (11.9%) | 34 (19.5%) |
| 30 to 34 Minutes | 8 (3.8%) | 13 (7.5%) |
| 35 to 39 Minutes | 0 (0.0%) | 0 (0.0%) |
| 40 to 44 Minutes | 0 (0.0%) | 5 (2.9%) |
| 45 to 59 Minutes | 87 (41.4%) | 15 (8.6%) |
| 60 to 89 Minutes | 39 (18.6%) | 11 (6.3%) |
| 90 or more Minutes | 36 (17.1%) | 0 (0.0%) |
Time of Departure to Work by Sex in Laguna Park
The most frequent times of departure to work in Laguna Park are 7:00 AM to 7:29 AM (90, 42.9%) for males and 6:30 AM to 6:59 AM (61, 35.1%) for females.
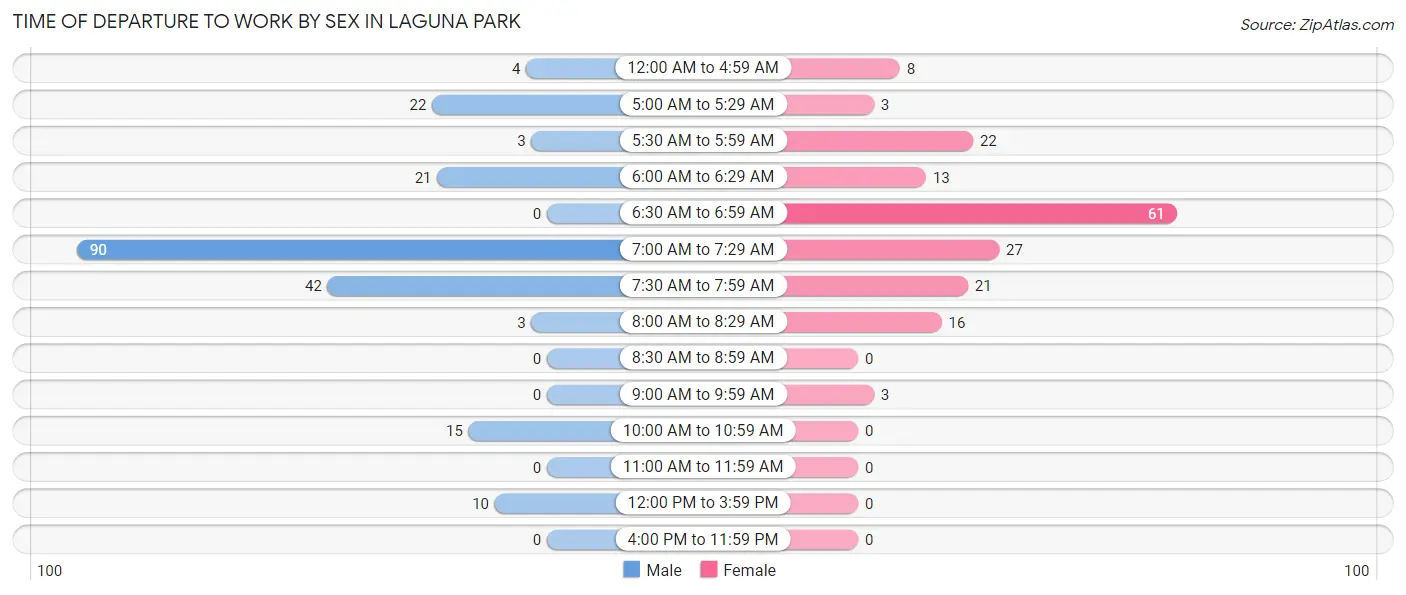
| Time of Departure | Male | Female |
| 12:00 AM to 4:59 AM | 4 (1.9%) | 8 (4.6%) |
| 5:00 AM to 5:29 AM | 22 (10.5%) | 3 (1.7%) |
| 5:30 AM to 5:59 AM | 3 (1.4%) | 22 (12.6%) |
| 6:00 AM to 6:29 AM | 21 (10.0%) | 13 (7.5%) |
| 6:30 AM to 6:59 AM | 0 (0.0%) | 61 (35.1%) |
| 7:00 AM to 7:29 AM | 90 (42.9%) | 27 (15.5%) |
| 7:30 AM to 7:59 AM | 42 (20.0%) | 21 (12.1%) |
| 8:00 AM to 8:29 AM | 3 (1.4%) | 16 (9.2%) |
| 8:30 AM to 8:59 AM | 0 (0.0%) | 0 (0.0%) |
| 9:00 AM to 9:59 AM | 0 (0.0%) | 3 (1.7%) |
| 10:00 AM to 10:59 AM | 15 (7.1%) | 0 (0.0%) |
| 11:00 AM to 11:59 AM | 0 (0.0%) | 0 (0.0%) |
| 12:00 PM to 3:59 PM | 10 (4.8%) | 0 (0.0%) |
| 4:00 PM to 11:59 PM | 0 (0.0%) | 0 (0.0%) |
| Total | 210 (100.0%) | 174 (100.0%) |
Housing Occupancy in Laguna Park
Occupancy by Ownership in Laguna Park
Of the total 560 dwellings in Laguna Park, owner-occupied units account for 479 (85.5%), while renter-occupied units make up 81 (14.5%).
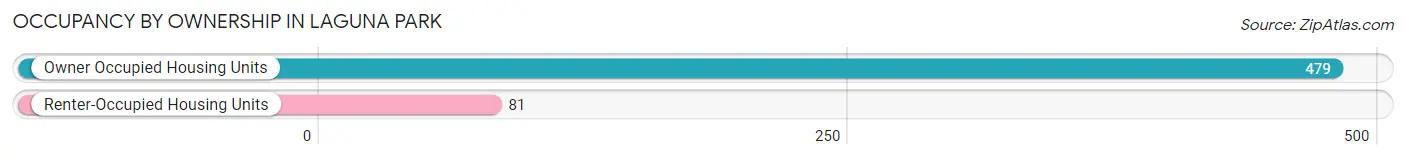
| Occupancy | # Housing Units | % Housing Units |
| Owner Occupied Housing Units | 479 | 85.5% |
| Renter-Occupied Housing Units | 81 | 14.5% |
| Total Occupied Housing Units | 560 | 100.0% |
Occupancy by Household Size in Laguna Park
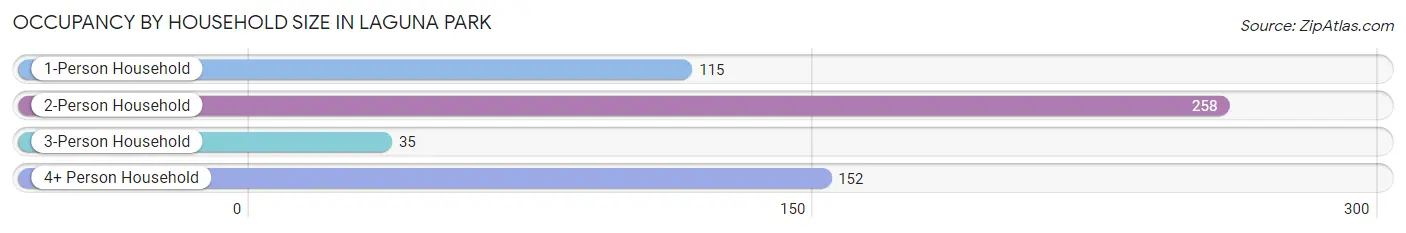
| Household Size | # Housing Units | % Housing Units |
| 1-Person Household | 115 | 20.5% |
| 2-Person Household | 258 | 46.1% |
| 3-Person Household | 35 | 6.2% |
| 4+ Person Household | 152 | 27.1% |
| Total Housing Units | 560 | 100.0% |
Occupancy by Ownership by Household Size in Laguna Park
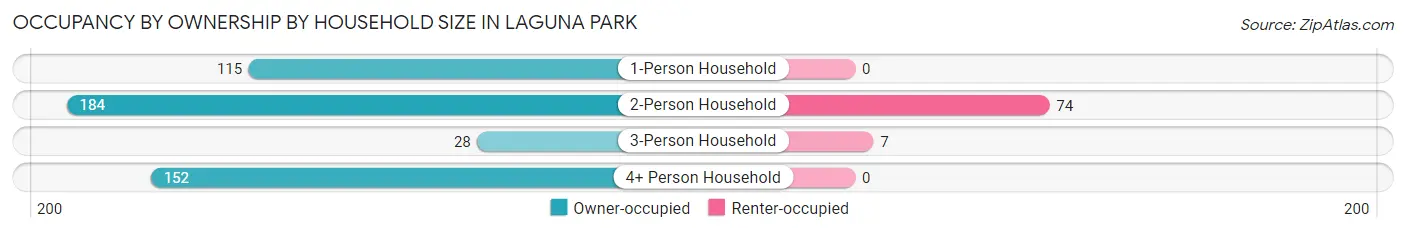
| Household Size | Owner-occupied | Renter-occupied |
| 1-Person Household | 115 (100.0%) | 0 (0.0%) |
| 2-Person Household | 184 (71.3%) | 74 (28.7%) |
| 3-Person Household | 28 (80.0%) | 7 (20.0%) |
| 4+ Person Household | 152 (100.0%) | 0 (0.0%) |
| Total Housing Units | 479 (85.5%) | 81 (14.5%) |
Occupancy by Educational Attainment in Laguna Park
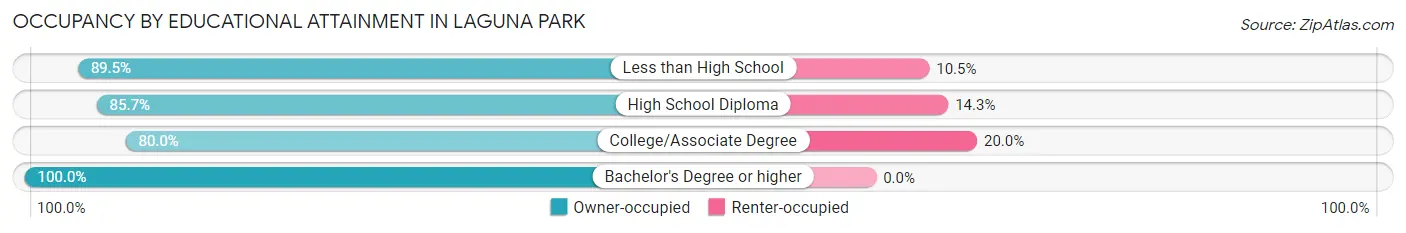
| Household Size | Owner-occupied | Renter-occupied |
| Less than High School | 34 (89.5%) | 4 (10.5%) |
| High School Diploma | 162 (85.7%) | 27 (14.3%) |
| College/Associate Degree | 200 (80.0%) | 50 (20.0%) |
| Bachelor's Degree or higher | 83 (100.0%) | 0 (0.0%) |
Occupancy by Age of Householder in Laguna Park
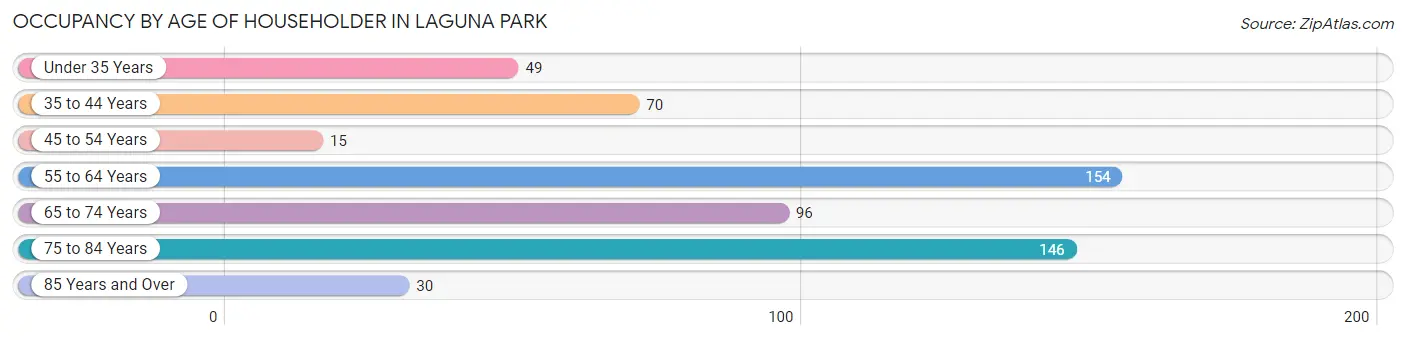
| Age Bracket | # Households | % Households |
| Under 35 Years | 49 | 8.7% |
| 35 to 44 Years | 70 | 12.5% |
| 45 to 54 Years | 15 | 2.7% |
| 55 to 64 Years | 154 | 27.5% |
| 65 to 74 Years | 96 | 17.1% |
| 75 to 84 Years | 146 | 26.1% |
| 85 Years and Over | 30 | 5.4% |
| Total | 560 | 100.0% |
Housing Finances in Laguna Park
Median Income by Occupancy in Laguna Park
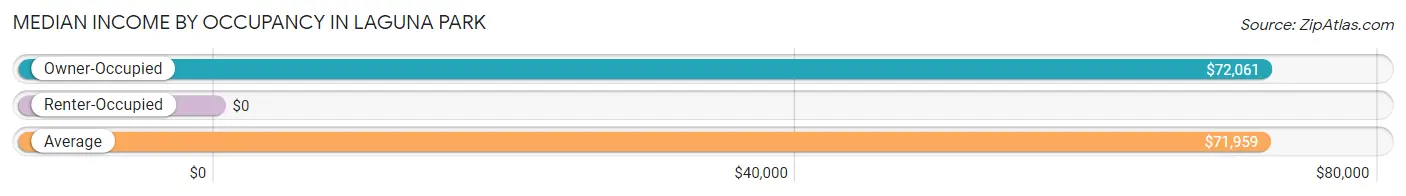
| Occupancy Type | # Households | Median Income |
| Owner-Occupied | 479 (85.5%) | $72,061 |
| Renter-Occupied | 81 (14.5%) | $0 |
| Average | 560 (100.0%) | $71,959 |
Occupancy by Householder Income Bracket in Laguna Park
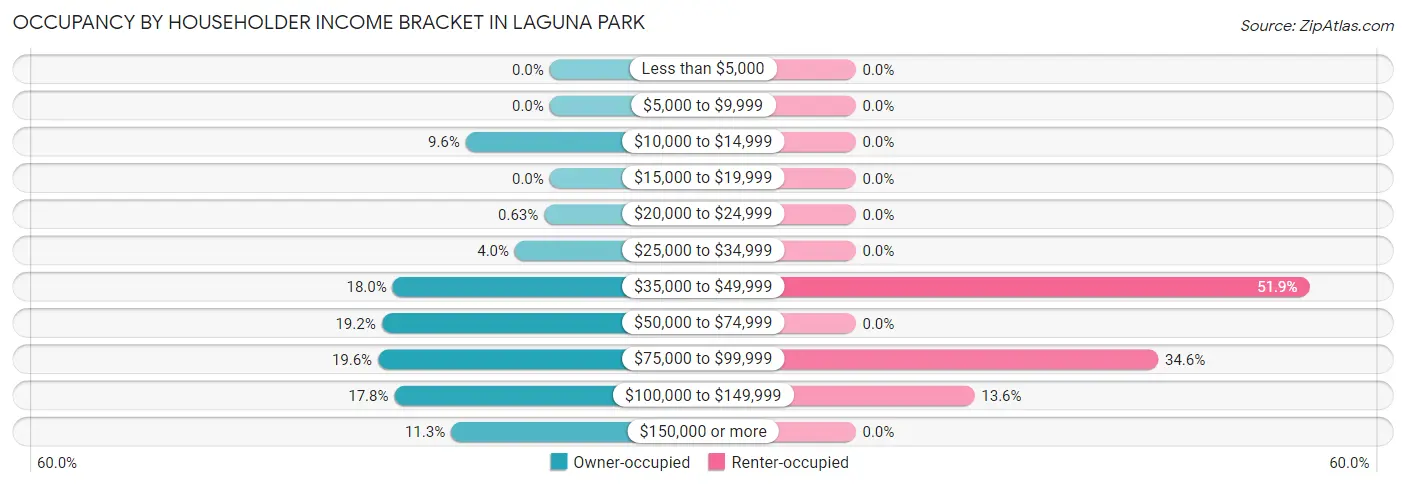
| Income Bracket | Owner-occupied | Renter-occupied |
| Less than $5,000 | 0 (0.0%) | 0 (0.0%) |
| $5,000 to $9,999 | 0 (0.0%) | 0 (0.0%) |
| $10,000 to $14,999 | 46 (9.6%) | 0 (0.0%) |
| $15,000 to $19,999 | 0 (0.0%) | 0 (0.0%) |
| $20,000 to $24,999 | 3 (0.6%) | 0 (0.0%) |
| $25,000 to $34,999 | 19 (4.0%) | 0 (0.0%) |
| $35,000 to $49,999 | 86 (17.9%) | 42 (51.8%) |
| $50,000 to $74,999 | 92 (19.2%) | 0 (0.0%) |
| $75,000 to $99,999 | 94 (19.6%) | 28 (34.6%) |
| $100,000 to $149,999 | 85 (17.7%) | 11 (13.6%) |
| $150,000 or more | 54 (11.3%) | 0 (0.0%) |
| Total | 479 (100.0%) | 81 (100.0%) |
Monthly Housing Cost Tiers in Laguna Park
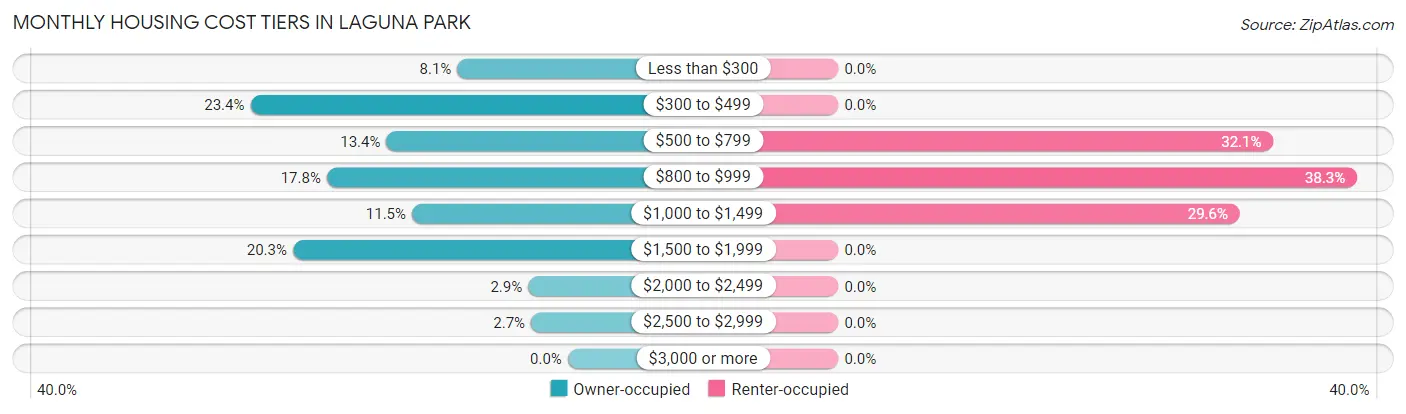
| Monthly Cost | Owner-occupied | Renter-occupied |
| Less than $300 | 39 (8.1%) | 0 (0.0%) |
| $300 to $499 | 112 (23.4%) | 0 (0.0%) |
| $500 to $799 | 64 (13.4%) | 26 (32.1%) |
| $800 to $999 | 85 (17.7%) | 31 (38.3%) |
| $1,000 to $1,499 | 55 (11.5%) | 24 (29.6%) |
| $1,500 to $1,999 | 97 (20.3%) | 0 (0.0%) |
| $2,000 to $2,499 | 14 (2.9%) | 0 (0.0%) |
| $2,500 to $2,999 | 13 (2.7%) | 0 (0.0%) |
| $3,000 or more | 0 (0.0%) | 0 (0.0%) |
| Total | 479 (100.0%) | 81 (100.0%) |
Physical Housing Characteristics in Laguna Park
Housing Structures in Laguna Park
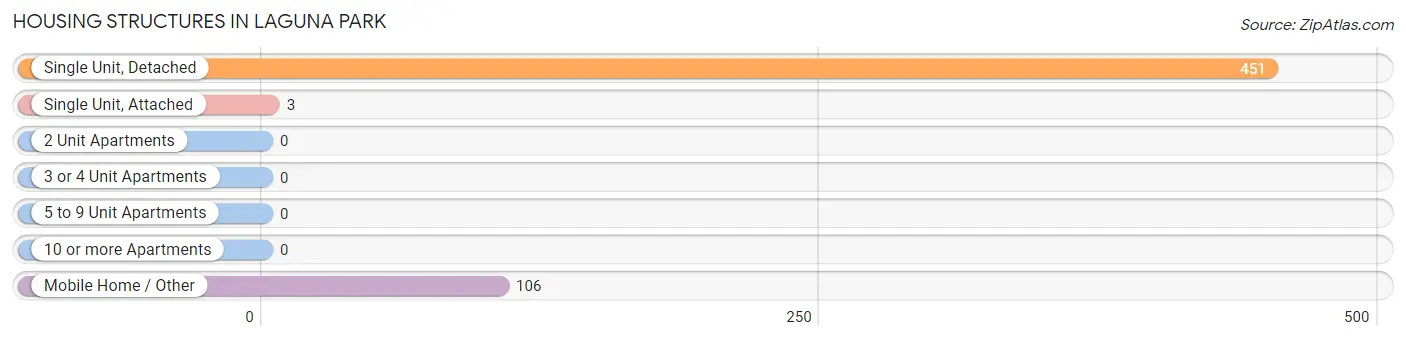
| Structure Type | # Housing Units | % Housing Units |
| Single Unit, Detached | 451 | 80.5% |
| Single Unit, Attached | 3 | 0.5% |
| 2 Unit Apartments | 0 | 0.0% |
| 3 or 4 Unit Apartments | 0 | 0.0% |
| 5 to 9 Unit Apartments | 0 | 0.0% |
| 10 or more Apartments | 0 | 0.0% |
| Mobile Home / Other | 106 | 18.9% |
| Total | 560 | 100.0% |
Housing Structures by Occupancy in Laguna Park
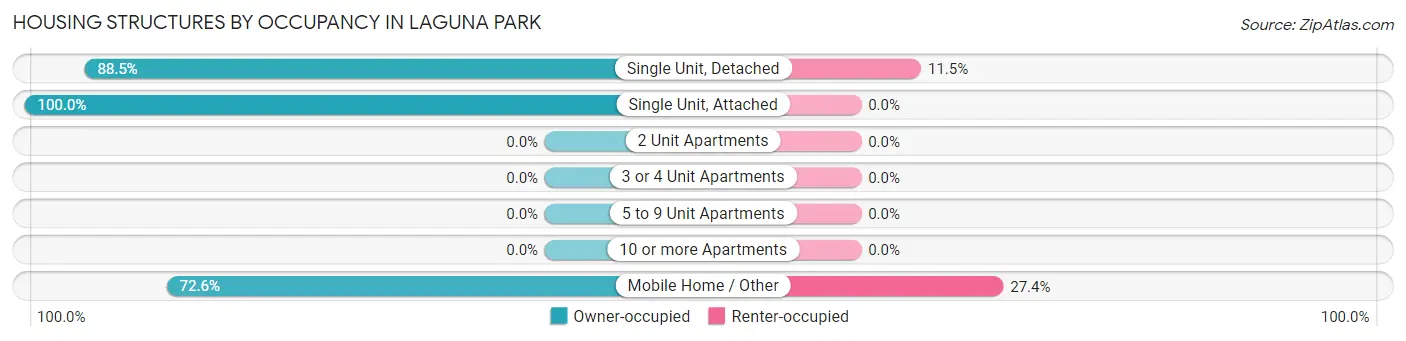
| Structure Type | Owner-occupied | Renter-occupied |
| Single Unit, Detached | 399 (88.5%) | 52 (11.5%) |
| Single Unit, Attached | 3 (100.0%) | 0 (0.0%) |
| 2 Unit Apartments | 0 (0.0%) | 0 (0.0%) |
| 3 or 4 Unit Apartments | 0 (0.0%) | 0 (0.0%) |
| 5 to 9 Unit Apartments | 0 (0.0%) | 0 (0.0%) |
| 10 or more Apartments | 0 (0.0%) | 0 (0.0%) |
| Mobile Home / Other | 77 (72.6%) | 29 (27.4%) |
| Total | 479 (85.5%) | 81 (14.5%) |
Housing Structures by Number of Rooms in Laguna Park
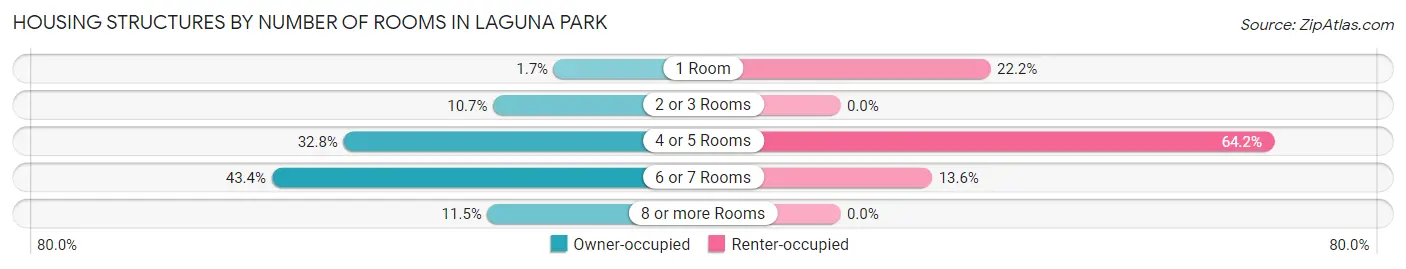
| Number of Rooms | Owner-occupied | Renter-occupied |
| 1 Room | 8 (1.7%) | 18 (22.2%) |
| 2 or 3 Rooms | 51 (10.6%) | 0 (0.0%) |
| 4 or 5 Rooms | 157 (32.8%) | 52 (64.2%) |
| 6 or 7 Rooms | 208 (43.4%) | 11 (13.6%) |
| 8 or more Rooms | 55 (11.5%) | 0 (0.0%) |
| Total | 479 (100.0%) | 81 (100.0%) |
Housing Structure by Heating Type in Laguna Park
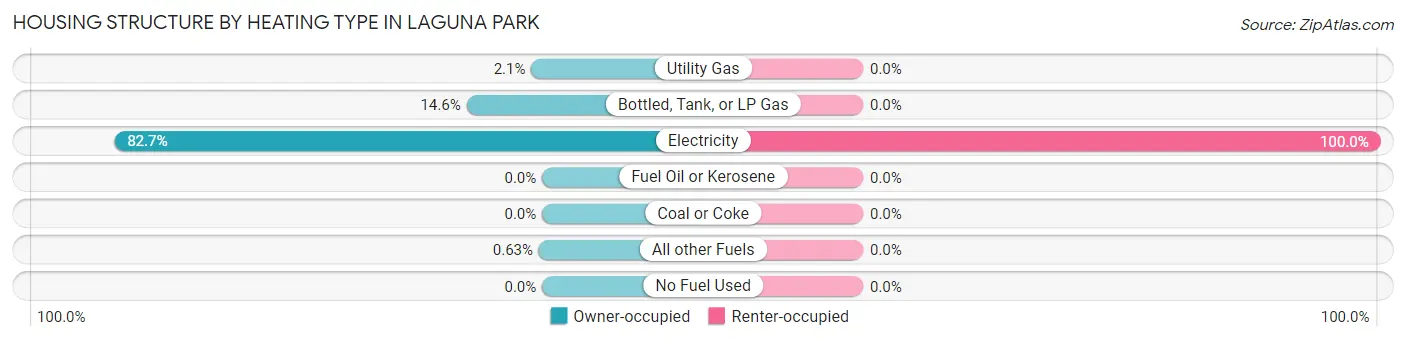
| Heating Type | Owner-occupied | Renter-occupied |
| Utility Gas | 10 (2.1%) | 0 (0.0%) |
| Bottled, Tank, or LP Gas | 70 (14.6%) | 0 (0.0%) |
| Electricity | 396 (82.7%) | 81 (100.0%) |
| Fuel Oil or Kerosene | 0 (0.0%) | 0 (0.0%) |
| Coal or Coke | 0 (0.0%) | 0 (0.0%) |
| All other Fuels | 3 (0.6%) | 0 (0.0%) |
| No Fuel Used | 0 (0.0%) | 0 (0.0%) |
| Total | 479 (100.0%) | 81 (100.0%) |
Household Vehicle Usage in Laguna Park
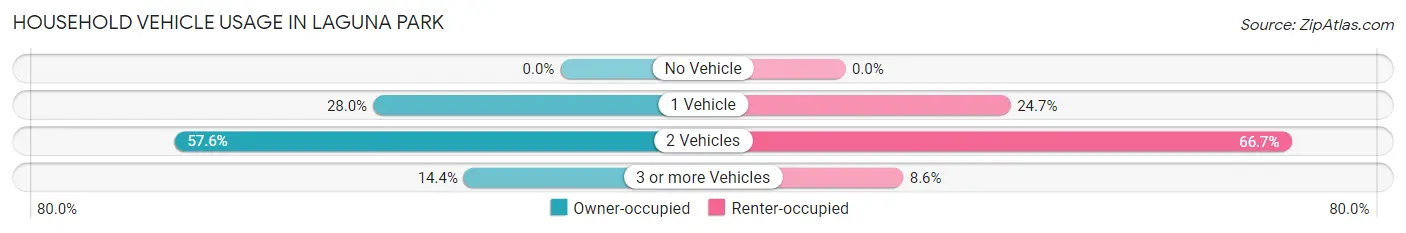
| Vehicles per Household | Owner-occupied | Renter-occupied |
| No Vehicle | 0 (0.0%) | 0 (0.0%) |
| 1 Vehicle | 134 (28.0%) | 20 (24.7%) |
| 2 Vehicles | 276 (57.6%) | 54 (66.7%) |
| 3 or more Vehicles | 69 (14.4%) | 7 (8.6%) |
| Total | 479 (100.0%) | 81 (100.0%) |
Real Estate & Mortgages in Laguna Park
Real Estate and Mortgage Overview in Laguna Park
| Characteristic | Without Mortgage | With Mortgage |
| Housing Units | 244 | 235 |
| Median Property Value | $150,000 | $185,900 |
| Median Household Income | $68,500 | $20 |
| Monthly Housing Costs | $446 | $0 |
| Real Estate Taxes | $1,303 | $18 |
Property Value by Mortgage Status in Laguna Park
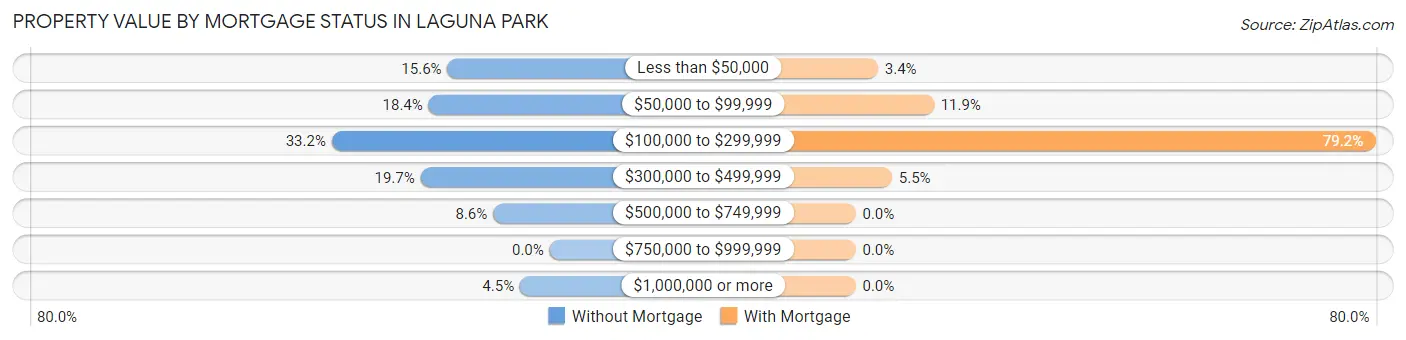
| Property Value | Without Mortgage | With Mortgage |
| Less than $50,000 | 38 (15.6%) | 8 (3.4%) |
| $50,000 to $99,999 | 45 (18.4%) | 28 (11.9%) |
| $100,000 to $299,999 | 81 (33.2%) | 186 (79.1%) |
| $300,000 to $499,999 | 48 (19.7%) | 13 (5.5%) |
| $500,000 to $749,999 | 21 (8.6%) | 0 (0.0%) |
| $750,000 to $999,999 | 0 (0.0%) | 0 (0.0%) |
| $1,000,000 or more | 11 (4.5%) | 0 (0.0%) |
| Total | 244 (100.0%) | 235 (100.0%) |
Household Income by Mortgage Status in Laguna Park
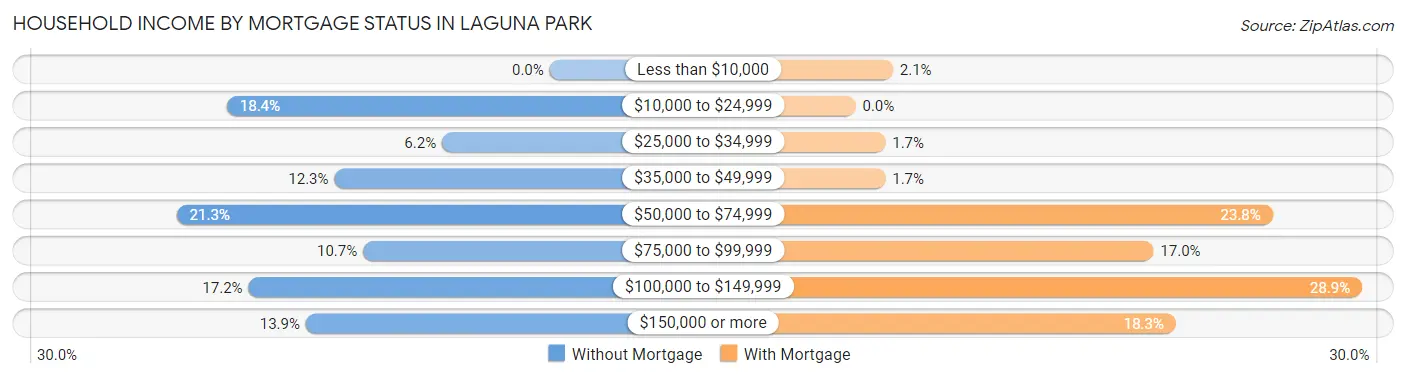
| Household Income | Without Mortgage | With Mortgage |
| Less than $10,000 | 0 (0.0%) | 5 (2.1%) |
| $10,000 to $24,999 | 45 (18.4%) | 0 (0.0%) |
| $25,000 to $34,999 | 15 (6.1%) | 4 (1.7%) |
| $35,000 to $49,999 | 30 (12.3%) | 4 (1.7%) |
| $50,000 to $74,999 | 52 (21.3%) | 56 (23.8%) |
| $75,000 to $99,999 | 26 (10.7%) | 40 (17.0%) |
| $100,000 to $149,999 | 42 (17.2%) | 68 (28.9%) |
| $150,000 or more | 34 (13.9%) | 43 (18.3%) |
| Total | 244 (100.0%) | 235 (100.0%) |
Property Value to Household Income Ratio in Laguna Park
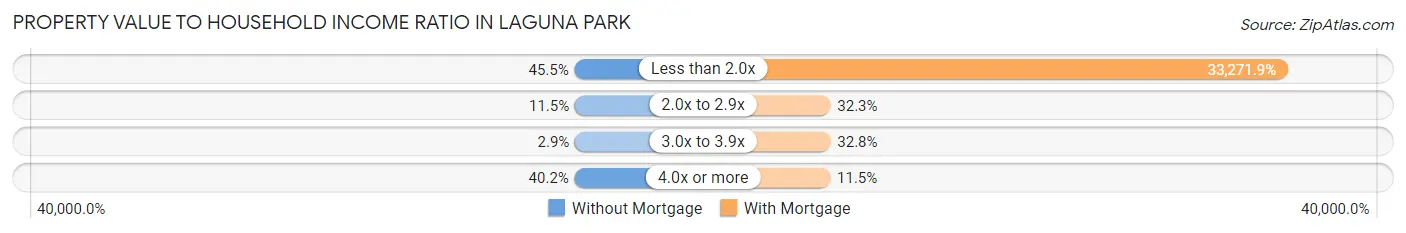
| Value-to-Income Ratio | Without Mortgage | With Mortgage |
| Less than 2.0x | 111 (45.5%) | 78,189 (33,271.9%) |
| 2.0x to 2.9x | 28 (11.5%) | 76 (32.3%) |
| 3.0x to 3.9x | 7 (2.9%) | 77 (32.8%) |
| 4.0x or more | 98 (40.2%) | 27 (11.5%) |
| Total | 244 (100.0%) | 235 (100.0%) |
Real Estate Taxes by Mortgage Status in Laguna Park
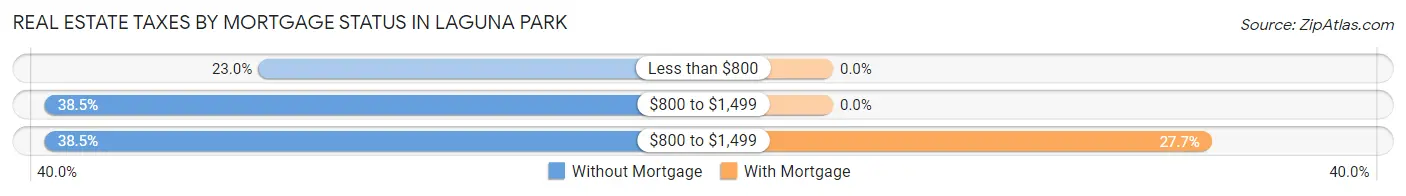
| Property Taxes | Without Mortgage | With Mortgage |
| Less than $800 | 56 (23.0%) | 0 (0.0%) |
| $800 to $1,499 | 94 (38.5%) | 0 (0.0%) |
| $800 to $1,499 | 94 (38.5%) | 65 (27.7%) |
| Total | 244 (100.0%) | 235 (100.0%) |
Health & Disability in Laguna Park
Health Insurance Coverage by Age in Laguna Park
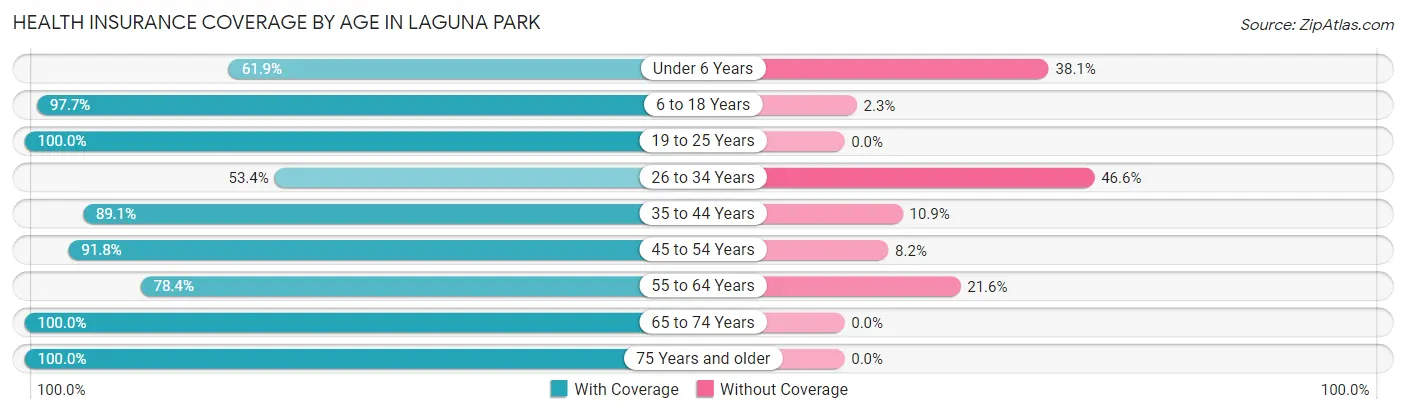
| Age Bracket | With Coverage | Without Coverage |
| Under 6 Years | 39 (61.9%) | 24 (38.1%) |
| 6 to 18 Years | 340 (97.7%) | 8 (2.3%) |
| 19 to 25 Years | 17 (100.0%) | 0 (0.0%) |
| 26 to 34 Years | 63 (53.4%) | 55 (46.6%) |
| 35 to 44 Years | 156 (89.1%) | 19 (10.9%) |
| 45 to 54 Years | 101 (91.8%) | 9 (8.2%) |
| 55 to 64 Years | 192 (78.4%) | 53 (21.6%) |
| 65 to 74 Years | 240 (100.0%) | 0 (0.0%) |
| 75 Years and older | 220 (100.0%) | 0 (0.0%) |
| Total | 1,368 (89.1%) | 168 (10.9%) |
Health Insurance Coverage by Citizenship Status in Laguna Park
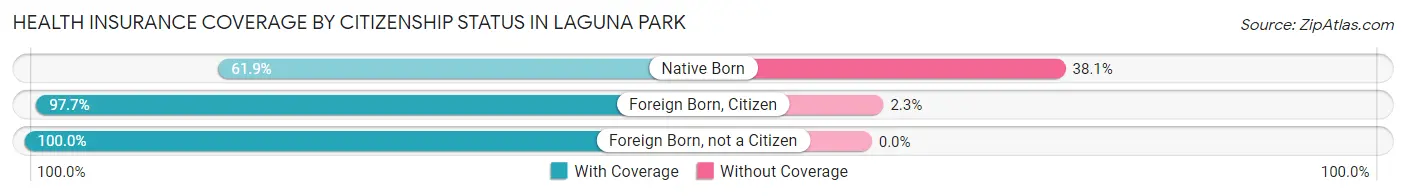
| Citizenship Status | With Coverage | Without Coverage |
| Native Born | 39 (61.9%) | 24 (38.1%) |
| Foreign Born, Citizen | 340 (97.7%) | 8 (2.3%) |
| Foreign Born, not a Citizen | 17 (100.0%) | 0 (0.0%) |
Health Insurance Coverage by Household Income in Laguna Park
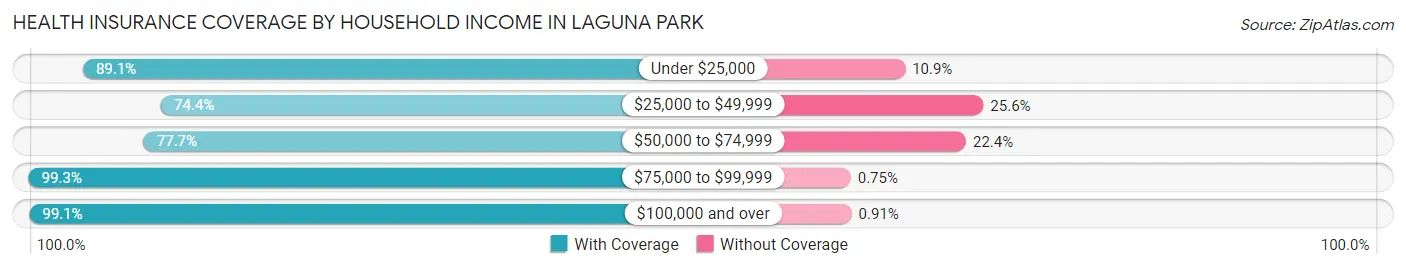
| Household Income | With Coverage | Without Coverage |
| Under $25,000 | 57 (89.1%) | 7 (10.9%) |
| $25,000 to $49,999 | 282 (74.4%) | 97 (25.6%) |
| $50,000 to $74,999 | 198 (77.6%) | 57 (22.4%) |
| $75,000 to $99,999 | 396 (99.3%) | 3 (0.7%) |
| $100,000 and over | 435 (99.1%) | 4 (0.9%) |
Public vs Private Health Insurance Coverage by Age in Laguna Park
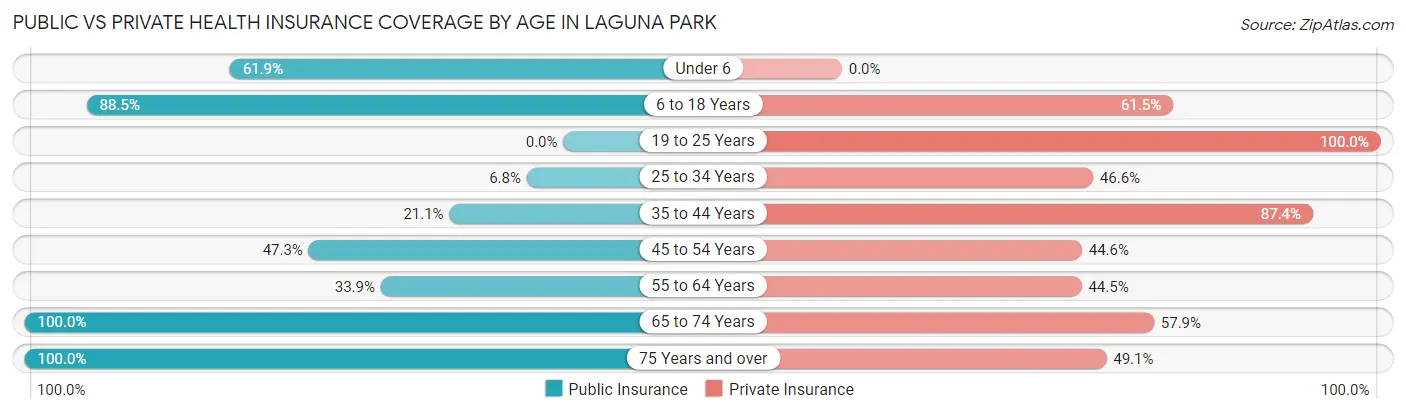
| Age Bracket | Public Insurance | Private Insurance |
| Under 6 | 39 (61.9%) | 0 (0.0%) |
| 6 to 18 Years | 308 (88.5%) | 214 (61.5%) |
| 19 to 25 Years | 0 (0.0%) | 17 (100.0%) |
| 25 to 34 Years | 8 (6.8%) | 55 (46.6%) |
| 35 to 44 Years | 37 (21.1%) | 153 (87.4%) |
| 45 to 54 Years | 52 (47.3%) | 49 (44.6%) |
| 55 to 64 Years | 83 (33.9%) | 109 (44.5%) |
| 65 to 74 Years | 240 (100.0%) | 139 (57.9%) |
| 75 Years and over | 220 (100.0%) | 108 (49.1%) |
| Total | 987 (64.3%) | 844 (54.9%) |
Disability Status by Sex by Age in Laguna Park
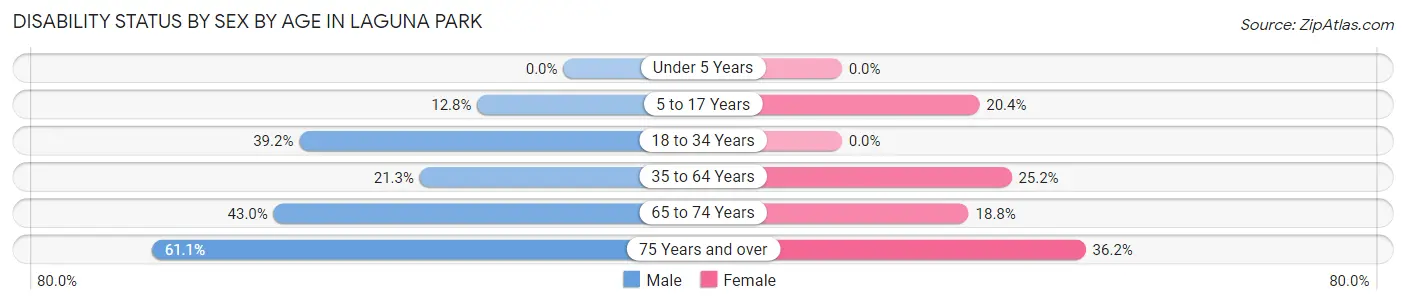
| Age Bracket | Male | Female |
| Under 5 Years | 0 (0.0%) | 0 (0.0%) |
| 5 to 17 Years | 23 (12.8%) | 39 (20.4%) |
| 18 to 34 Years | 20 (39.2%) | 0 (0.0%) |
| 35 to 64 Years | 58 (21.3%) | 65 (25.2%) |
| 65 to 74 Years | 37 (43.0%) | 29 (18.8%) |
| 75 Years and over | 99 (61.1%) | 21 (36.2%) |
Disability Class by Sex by Age in Laguna Park
Disability Class: Hearing Difficulty
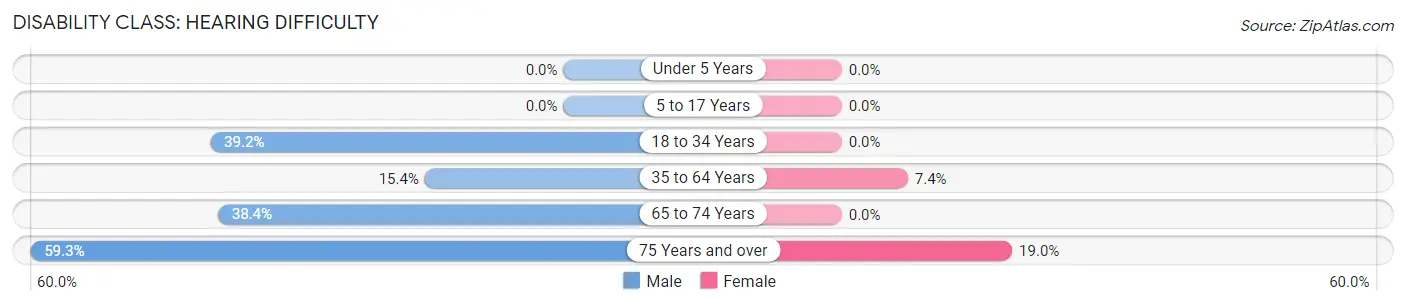
| Age Bracket | Male | Female |
| Under 5 Years | 0 (0.0%) | 0 (0.0%) |
| 5 to 17 Years | 0 (0.0%) | 0 (0.0%) |
| 18 to 34 Years | 20 (39.2%) | 0 (0.0%) |
| 35 to 64 Years | 42 (15.4%) | 19 (7.4%) |
| 65 to 74 Years | 33 (38.4%) | 0 (0.0%) |
| 75 Years and over | 96 (59.3%) | 11 (19.0%) |
Disability Class: Vision Difficulty
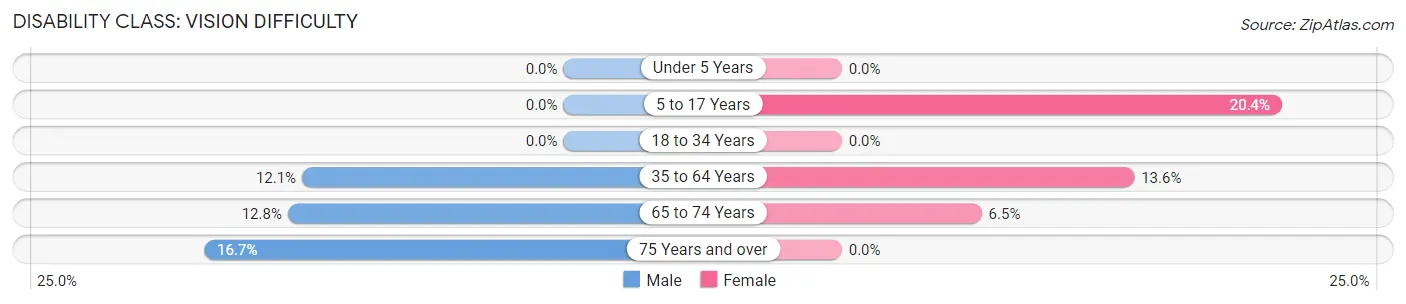
| Age Bracket | Male | Female |
| Under 5 Years | 0 (0.0%) | 0 (0.0%) |
| 5 to 17 Years | 0 (0.0%) | 39 (20.4%) |
| 18 to 34 Years | 0 (0.0%) | 0 (0.0%) |
| 35 to 64 Years | 33 (12.1%) | 35 (13.6%) |
| 65 to 74 Years | 11 (12.8%) | 10 (6.5%) |
| 75 Years and over | 27 (16.7%) | 0 (0.0%) |
Disability Class: Cognitive Difficulty
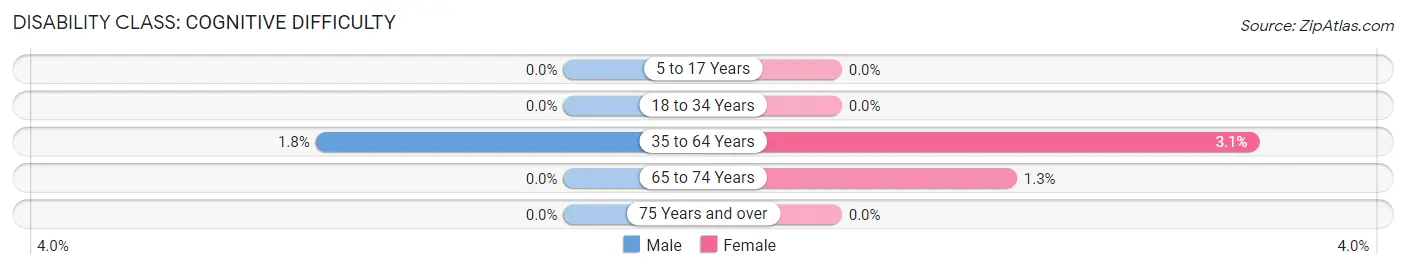
| Age Bracket | Male | Female |
| 5 to 17 Years | 0 (0.0%) | 0 (0.0%) |
| 18 to 34 Years | 0 (0.0%) | 0 (0.0%) |
| 35 to 64 Years | 5 (1.8%) | 8 (3.1%) |
| 65 to 74 Years | 0 (0.0%) | 2 (1.3%) |
| 75 Years and over | 0 (0.0%) | 0 (0.0%) |
Disability Class: Ambulatory Difficulty
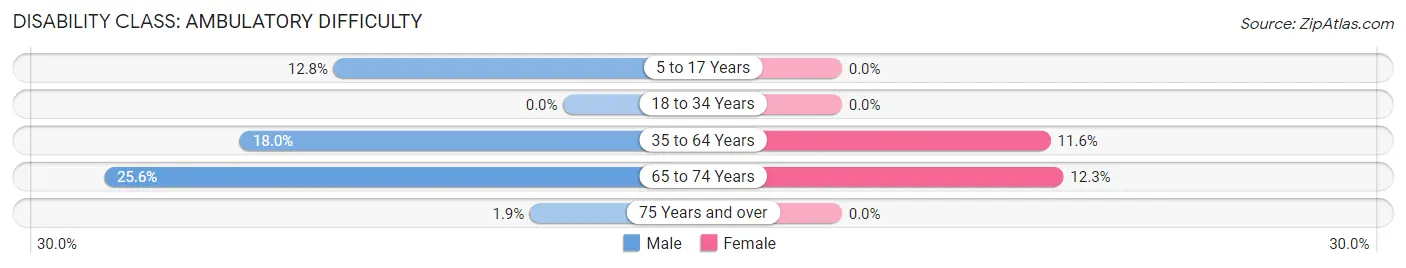
| Age Bracket | Male | Female |
| 5 to 17 Years | 23 (12.8%) | 0 (0.0%) |
| 18 to 34 Years | 0 (0.0%) | 0 (0.0%) |
| 35 to 64 Years | 49 (18.0%) | 30 (11.6%) |
| 65 to 74 Years | 22 (25.6%) | 19 (12.3%) |
| 75 Years and over | 3 (1.8%) | 0 (0.0%) |
Disability Class: Self-Care Difficulty
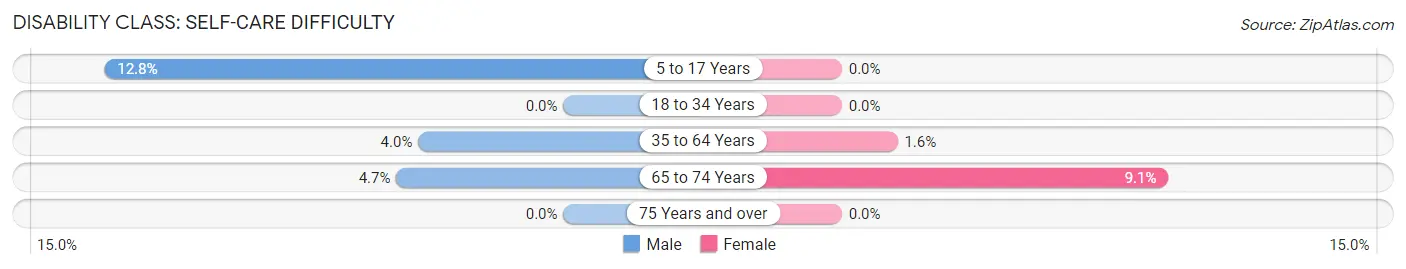
| Age Bracket | Male | Female |
| 5 to 17 Years | 23 (12.8%) | 0 (0.0%) |
| 18 to 34 Years | 0 (0.0%) | 0 (0.0%) |
| 35 to 64 Years | 11 (4.0%) | 4 (1.5%) |
| 65 to 74 Years | 4 (4.6%) | 14 (9.1%) |
| 75 Years and over | 0 (0.0%) | 0 (0.0%) |
Technology Access in Laguna Park
Computing Device Access in Laguna Park
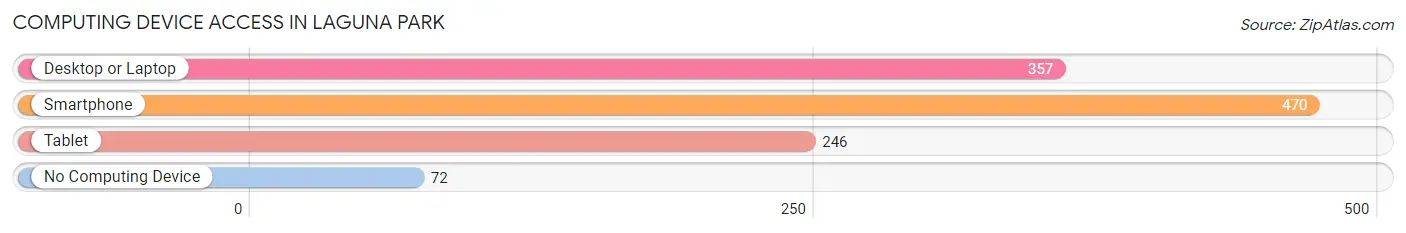
| Device Type | # Households | % Households |
| Desktop or Laptop | 357 | 63.7% |
| Smartphone | 470 | 83.9% |
| Tablet | 246 | 43.9% |
| No Computing Device | 72 | 12.9% |
| Total | 560 | 100.0% |
Internet Access in Laguna Park
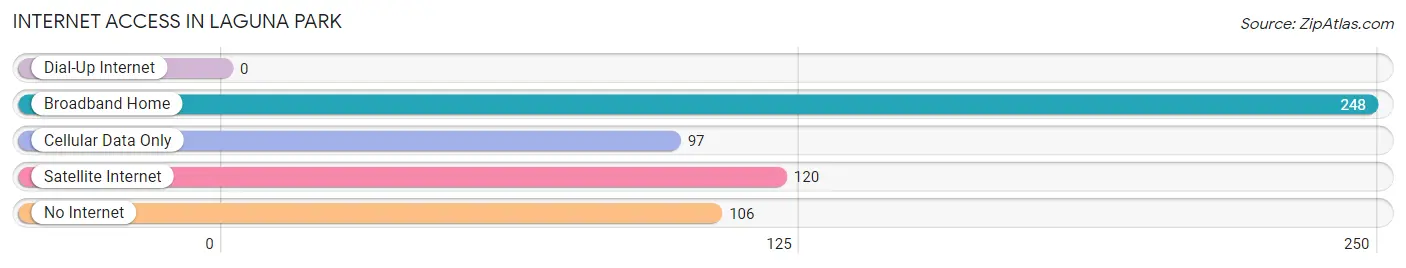
| Internet Type | # Households | % Households |
| Dial-Up Internet | 0 | 0.0% |
| Broadband Home | 248 | 44.3% |
| Cellular Data Only | 97 | 17.3% |
| Satellite Internet | 120 | 21.4% |
| No Internet | 106 | 18.9% |
| Total | 560 | 100.0% |
Laguna Park Summary
Laguna Park is a small unincorporated community located in Bosque County, Texas, United States. It is situated along the Brazos River, approximately 10 miles (16 km) northwest of Clifton, the county seat. The population of Laguna Park was estimated to be around 200 in 2020.
History
Laguna Park was founded in the late 1800s by a group of settlers from the nearby town of Clifton. The settlers were attracted to the area by the abundance of natural resources, including the Brazos River, which provided a source of water for the community. The settlers named the area Laguna Park, after the lagoon that was located nearby.
The first post office in Laguna Park was established in 1891. The town grew slowly over the years, and by the early 1900s, it had become a popular destination for tourists and fishermen. The town was also home to a number of businesses, including a general store, a blacksmith shop, and a cotton gin.
In the 1920s, the town began to decline as the population shifted to larger cities. By the 1950s, the population had dropped to just over 100. In the 1960s, the town was almost completely abandoned. However, in the 1970s, the population began to increase again, and by the 2000s, the population had grown to around 200.
Geography
Laguna Park is located in Bosque County, Texas, approximately 10 miles (16 km) northwest of Clifton, the county seat. The town is situated along the Brazos River, which provides a source of water for the community. The terrain in the area is mostly flat, with some rolling hills. The climate is generally mild, with hot summers and cool winters.
Economy
The economy of Laguna Park is largely based on agriculture and tourism. The town is home to a number of farms, which produce a variety of crops, including cotton, corn, and hay. The town is also a popular destination for tourists, who come to enjoy the natural beauty of the area, as well as the fishing and hunting opportunities.
Demographics
As of the 2010 census, the population of Laguna Park was estimated to be around 200. The racial makeup of the town was 97.5% White, 0.5% African American, 0.5% Native American, and 1.5% from other races. The median household income was $37,500, and the median home value was $90,000.
Conclusion
Laguna Park is a small unincorporated community located in Bosque County, Texas. It was founded in the late 1800s by a group of settlers from the nearby town of Clifton. The town has a population of around 200 and is largely based on agriculture and tourism. The town is home to a number of farms, which produce a variety of crops, and is a popular destination for tourists. The racial makeup of the town is mostly White, with a small percentage of African American, Native American, and other races. The median household income is $37,500, and the median home value is $90,000.
Common Questions
What is the Total Population of Laguna Park?
Total Population of Laguna Park is 1,536.
What is the Total Male Population of Laguna Park?
Total Male Population of Laguna Park is 761.
What is the Total Female Population of Laguna Park?
Total Female Population of Laguna Park is 775.
What is the Ratio of Males per 100 Females in Laguna Park?
There are 98.19 Males per 100 Females in Laguna Park.
What is the Ratio of Females per 100 Males in Laguna Park?
There are 101.84 Females per 100 Males in Laguna Park.
What is the Median Population Age in Laguna Park?
Median Population Age in Laguna Park is 51.2 Years.
What is the Average Family Size in Laguna Park
Average Family Size in Laguna Park is 3.1 People.
What is the Average Household Size in Laguna Park
Average Household Size in Laguna Park is 2.7 People.
What is Per Capita Income in Laguna Park?
Per Capita income in Laguna Park is $37,840.
What is the Median Family Income in Laguna Park?
Median Family Income in Laguna Park is $78,220.
What is the Median Household income in Laguna Park?
Median Household Income in Laguna Park is $71,959.
What is Income or Wage Gap in Laguna Park?
Income or Wage Gap in Laguna Park is 70.6%.
Women in Laguna Park earn 29.4 cents for every dollar earned by a man.
What is Inequality or Gini Index in Laguna Park?
Inequality or Gini Index in Laguna Park is 0.47.
How Large is the Labor Force in Laguna Park?
There are 465 People in the Labor Forcein in Laguna Park.
What is the Percentage of People in the Labor Force in Laguna Park?
41.0% of People are in the Labor Force in Laguna Park.
What is the Unemployment Rate in Laguna Park?
Unemployment Rate in Laguna Park is 4.3%.