Pantego, TX
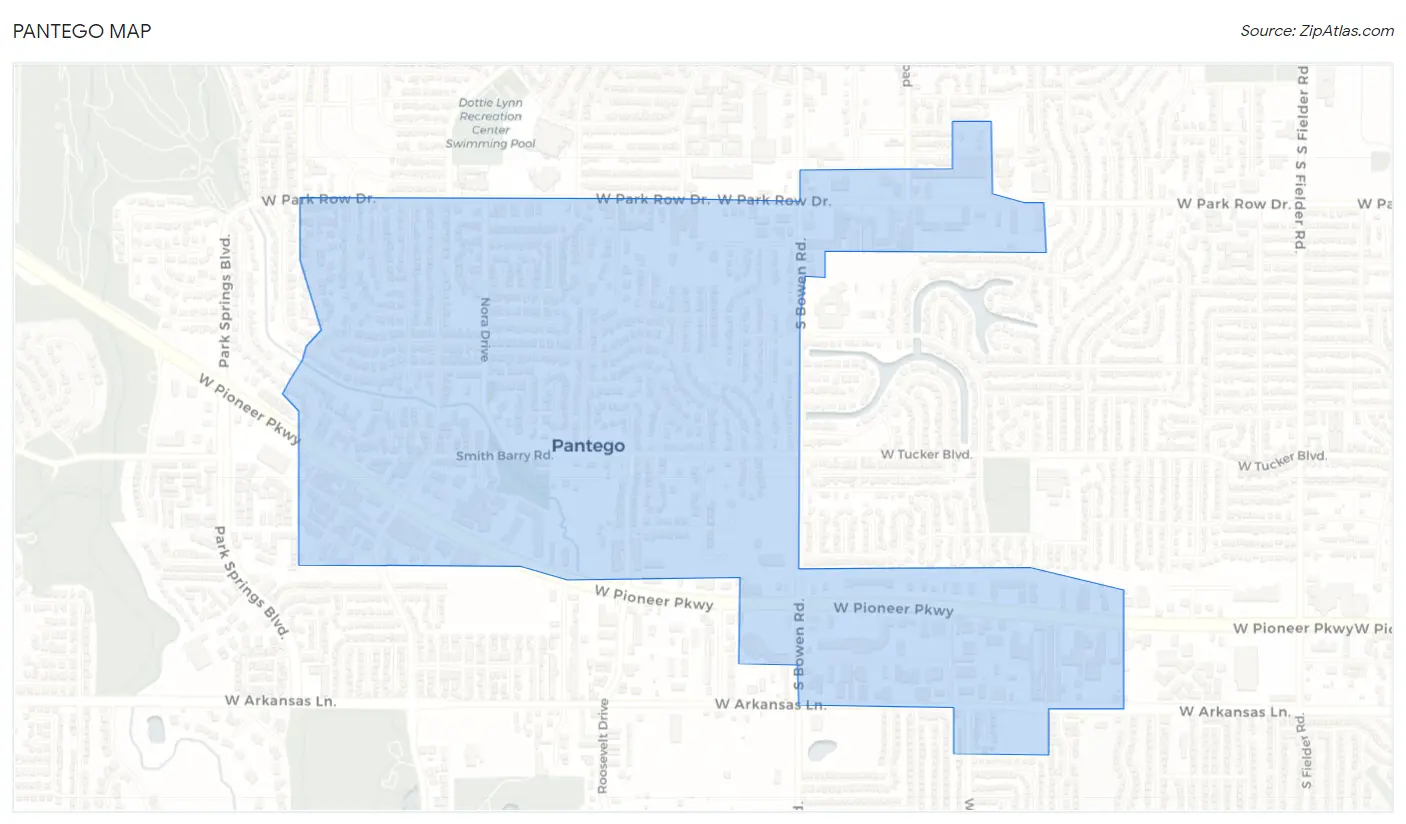
Pantego Map
Pantego Overview
2,529
TOTAL POPULATION
1,234
MALE POPULATION
1,295
FEMALE POPULATION
95.29
MALES / 100 FEMALES
104.94
FEMALES / 100 MALES
44.0
MEDIAN AGE
2.9
AVG FAMILY SIZE
2.2
AVG HOUSEHOLD SIZE
$48,325
PER CAPITA INCOME
$113,750
AVG FAMILY INCOME
$84,125
AVG HOUSEHOLD INCOME
44.6%
WAGE / INCOME GAP [ % ]
55.4¢/ $1
WAGE / INCOME GAP [ $ ]
0.45
INEQUALITY / GINI INDEX
1,268
LABOR FORCE [ PEOPLE ]
61.3%
PERCENT IN LABOR FORCE
7.6%
UNEMPLOYMENT RATE
Race in Pantego
The most populous races in Pantego are White / Caucasian (2,163 | 85.5%), Hispanic or Latino (233 | 9.2%), and Black / African American (185 | 7.3%).
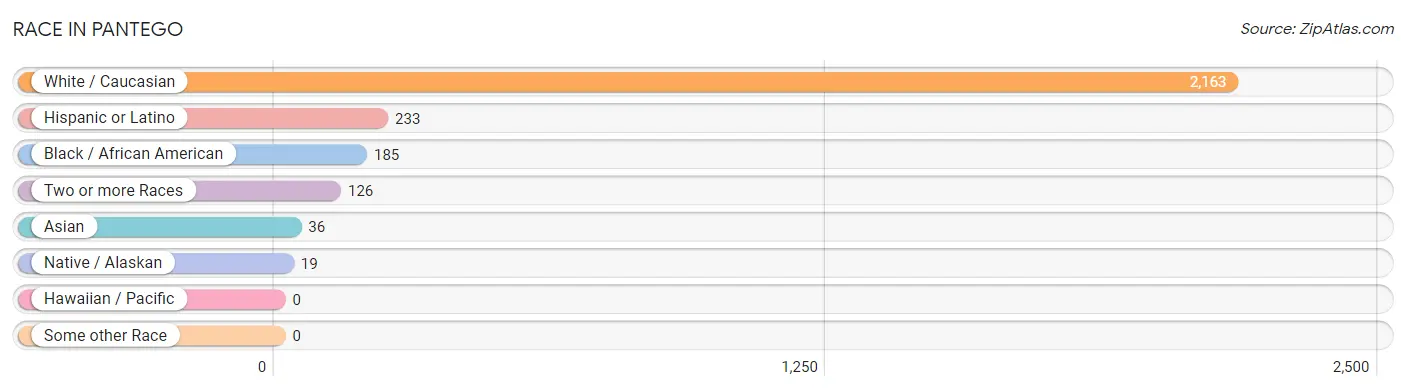
| Race | # Population | % Population |
| Asian | 36 | 1.4% |
| Black / African American | 185 | 7.3% |
| Hawaiian / Pacific | 0 | 0.0% |
| Hispanic or Latino | 233 | 9.2% |
| Native / Alaskan | 19 | 0.7% |
| White / Caucasian | 2,163 | 85.5% |
| Two or more Races | 126 | 5.0% |
| Some other Race | 0 | 0.0% |
| Total | 2,529 | 100.0% |
Ancestry in Pantego
The most populous ancestries reported in Pantego are German (427 | 16.9%), English (423 | 16.7%), Irish (350 | 13.8%), Mexican (210 | 8.3%), and American (154 | 6.1%), together accounting for 61.8% of all Pantego residents.
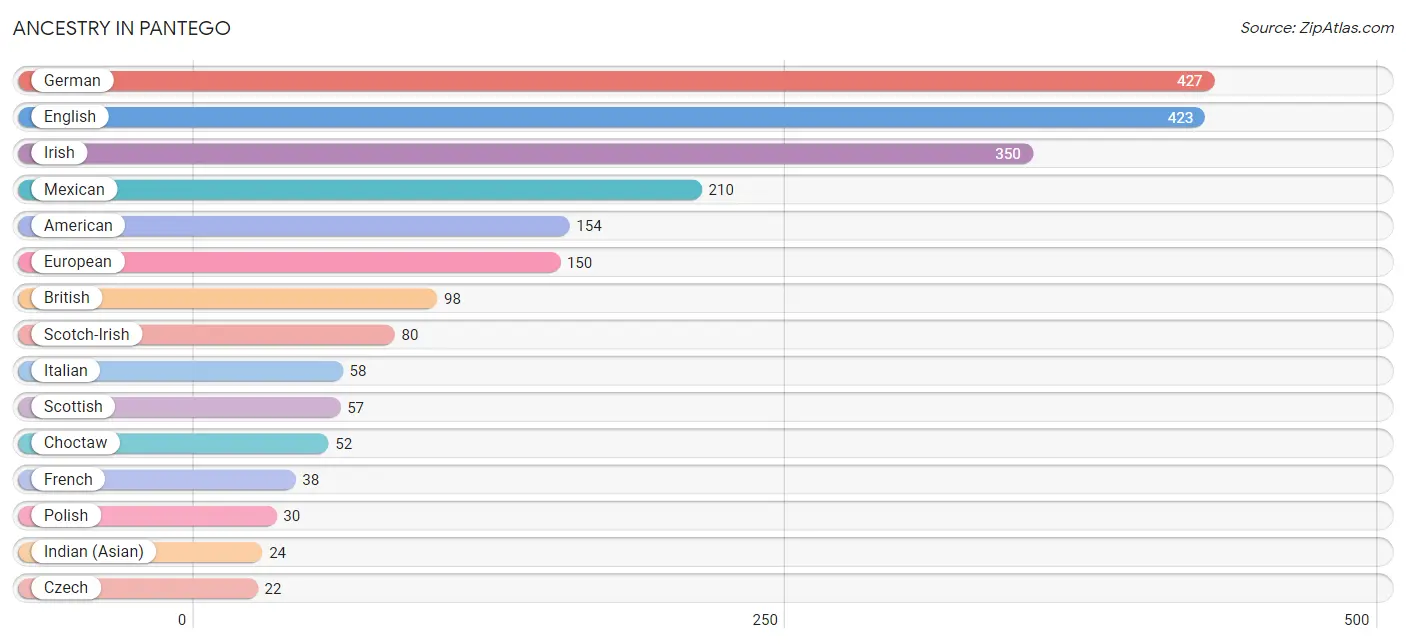
| Ancestry | # Population | % Population |
| African | 17 | 0.7% |
| American | 154 | 6.1% |
| Arab | 9 | 0.4% |
| Bhutanese | 11 | 0.4% |
| Blackfeet | 17 | 0.7% |
| British | 98 | 3.9% |
| Canadian | 7 | 0.3% |
| Cherokee | 17 | 0.7% |
| Choctaw | 52 | 2.1% |
| Colombian | 8 | 0.3% |
| Czech | 22 | 0.9% |
| Danish | 19 | 0.7% |
| Dutch | 5 | 0.2% |
| English | 423 | 16.7% |
| European | 150 | 5.9% |
| French | 38 | 1.5% |
| French Canadian | 21 | 0.8% |
| German | 427 | 16.9% |
| Hungarian | 19 | 0.7% |
| Indian (Asian) | 24 | 0.9% |
| Irish | 350 | 13.8% |
| Italian | 58 | 2.3% |
| Kiowa | 2 | 0.1% |
| Lithuanian | 3 | 0.1% |
| Mexican | 210 | 8.3% |
| Mexican American Indian | 17 | 0.7% |
| Norwegian | 7 | 0.3% |
| Polish | 30 | 1.2% |
| Puerto Rican | 11 | 0.4% |
| Russian | 4 | 0.2% |
| Scandinavian | 3 | 0.1% |
| Scotch-Irish | 80 | 3.2% |
| Scottish | 57 | 2.2% |
| South American | 8 | 0.3% |
| Spaniard | 4 | 0.2% |
| Sri Lankan | 10 | 0.4% |
| Subsaharan African | 17 | 0.7% |
| Swedish | 19 | 0.7% |
| Swiss | 3 | 0.1% |
| Syrian | 5 | 0.2% |
| Thai | 1 | 0.0% |
| Ukrainian | 8 | 0.3% |
| Welsh | 3 | 0.1% | View All 43 Rows |
Immigrants in Pantego
The most numerous immigrant groups reported in Pantego came from Latin America (56 | 2.2%), Central America (52 | 2.1%), Mexico (52 | 2.1%), Asia (42 | 1.7%), and China (16 | 0.6%), together accounting for 8.6% of all Pantego residents.
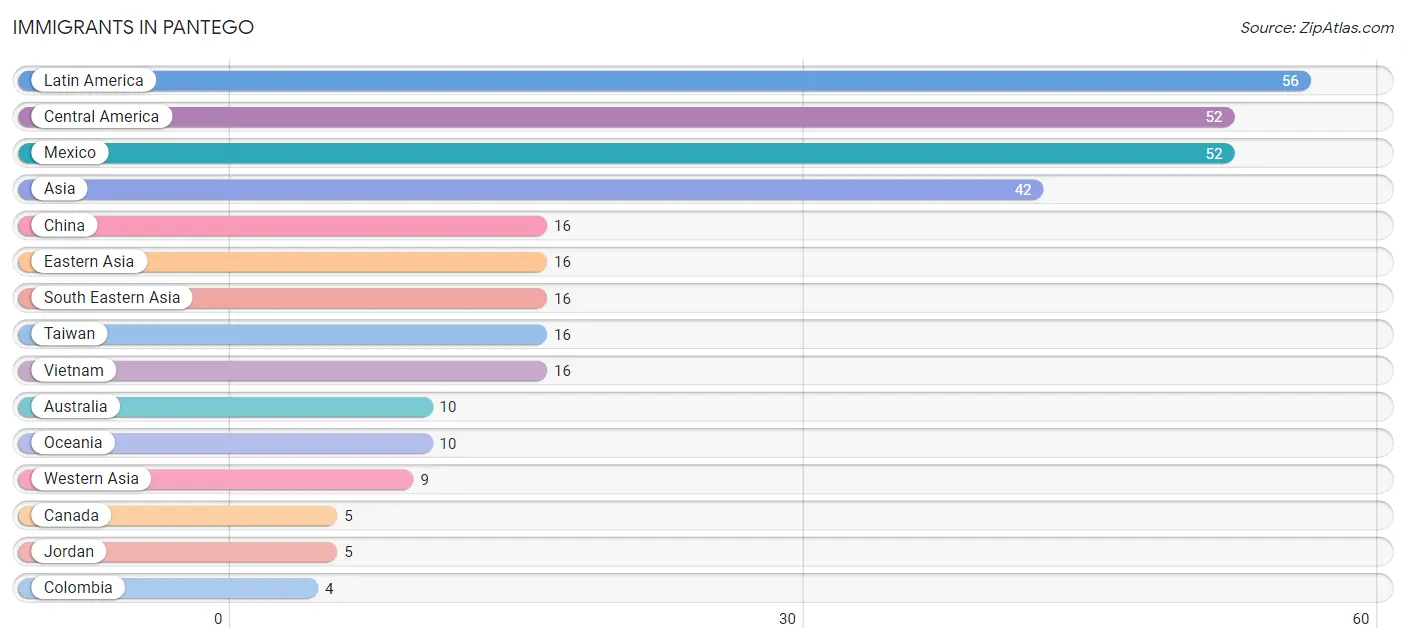
| Immigration Origin | # Population | % Population |
| Asia | 42 | 1.7% |
| Australia | 10 | 0.4% |
| Canada | 5 | 0.2% |
| Central America | 52 | 2.1% |
| China | 16 | 0.6% |
| Colombia | 4 | 0.2% |
| Eastern Asia | 16 | 0.6% |
| Iraq | 4 | 0.2% |
| Jordan | 5 | 0.2% |
| Latin America | 56 | 2.2% |
| Mexico | 52 | 2.1% |
| Nepal | 1 | 0.0% |
| Oceania | 10 | 0.4% |
| South America | 4 | 0.2% |
| South Central Asia | 1 | 0.0% |
| South Eastern Asia | 16 | 0.6% |
| Taiwan | 16 | 0.6% |
| Vietnam | 16 | 0.6% |
| Western Asia | 9 | 0.4% | View All 19 Rows |
Sex and Age in Pantego
Sex and Age in Pantego
The most populous age groups in Pantego are 25 to 29 Years (157 | 12.7%) for men and 85 Years and over (99 | 7.6%) for women.
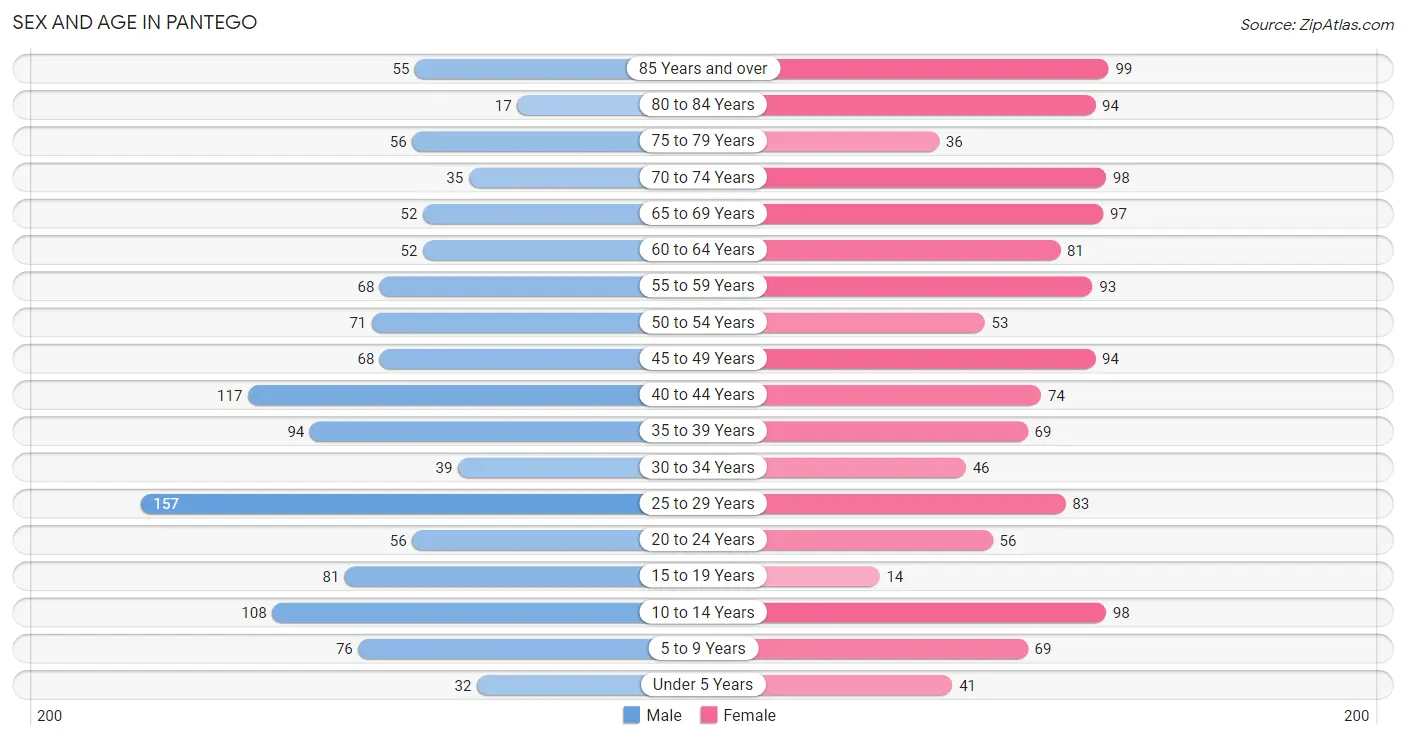
| Age Bracket | Male | Female |
| Under 5 Years | 32 (2.6%) | 41 (3.2%) |
| 5 to 9 Years | 76 (6.2%) | 69 (5.3%) |
| 10 to 14 Years | 108 (8.7%) | 98 (7.6%) |
| 15 to 19 Years | 81 (6.6%) | 14 (1.1%) |
| 20 to 24 Years | 56 (4.5%) | 56 (4.3%) |
| 25 to 29 Years | 157 (12.7%) | 83 (6.4%) |
| 30 to 34 Years | 39 (3.2%) | 46 (3.5%) |
| 35 to 39 Years | 94 (7.6%) | 69 (5.3%) |
| 40 to 44 Years | 117 (9.5%) | 74 (5.7%) |
| 45 to 49 Years | 68 (5.5%) | 94 (7.3%) |
| 50 to 54 Years | 71 (5.8%) | 53 (4.1%) |
| 55 to 59 Years | 68 (5.5%) | 93 (7.2%) |
| 60 to 64 Years | 52 (4.2%) | 81 (6.2%) |
| 65 to 69 Years | 52 (4.2%) | 97 (7.5%) |
| 70 to 74 Years | 35 (2.8%) | 98 (7.6%) |
| 75 to 79 Years | 56 (4.5%) | 36 (2.8%) |
| 80 to 84 Years | 17 (1.4%) | 94 (7.3%) |
| 85 Years and over | 55 (4.5%) | 99 (7.6%) |
| Total | 1,234 (100.0%) | 1,295 (100.0%) |
Families and Households in Pantego
Median Family Size in Pantego
The median family size in Pantego is 2.87 persons per family, with single male/father families (24 | 3.6%) accounting for the largest median family size of 3.04 persons per family. On the other hand, single female/mother families (96 | 14.5%) represent the smallest median family size with 2.81 persons per family.
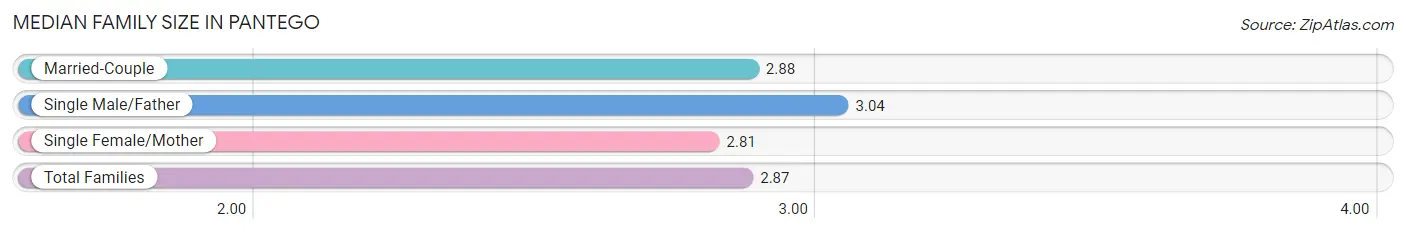
| Family Type | # Families | Family Size |
| Married-Couple | 542 (81.9%) | 2.88 |
| Single Male/Father | 24 (3.6%) | 3.04 |
| Single Female/Mother | 96 (14.5%) | 2.81 |
| Total Families | 662 (100.0%) | 2.87 |
Median Household Size in Pantego
The median household size in Pantego is 2.18 persons per household, with single male/father households (24 | 2.1%) accounting for the largest median household size of 3.04 persons per household. non-family households (481 | 42.1%) represent the smallest median household size with 1.22 persons per household.
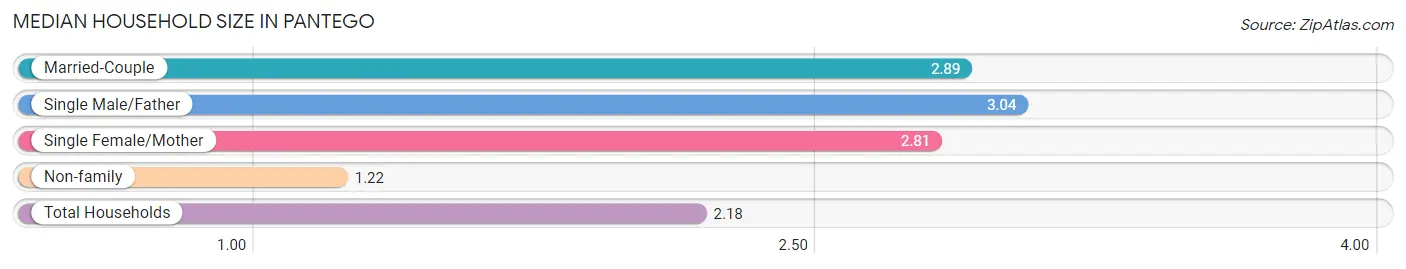
| Household Type | # Households | Household Size |
| Married-Couple | 542 (47.4%) | 2.89 |
| Single Male/Father | 24 (2.1%) | 3.04 |
| Single Female/Mother | 96 (8.4%) | 2.81 |
| Non-family | 481 (42.1%) | 1.22 |
| Total Households | 1,143 (100.0%) | 2.18 |
Household Size by Marriage Status in Pantego
Out of a total of 1,143 households in Pantego, 662 (57.9%) are family households, while 481 (42.1%) are nonfamily households. The most numerous type of family households are 2-person households, comprising 317, and the most common type of nonfamily households are 1-person households, comprising 394.
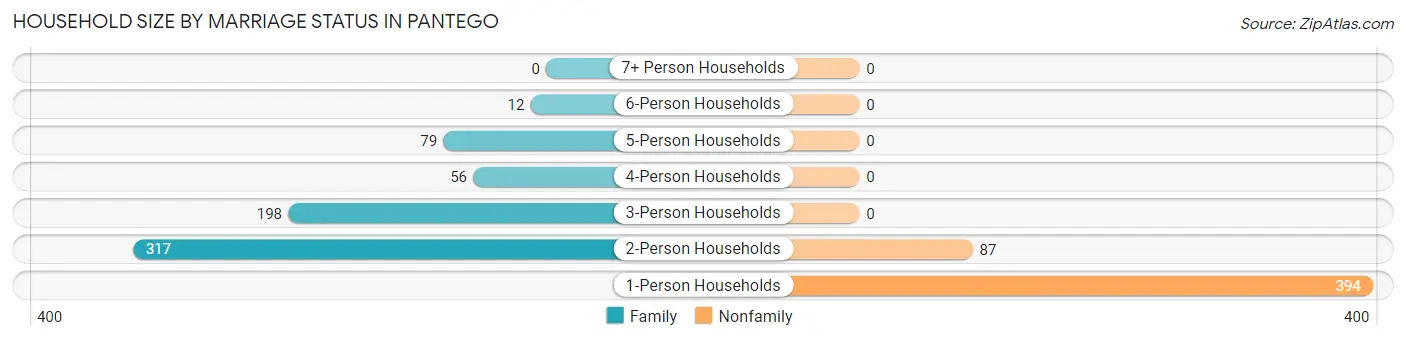
| Household Size | Family Households | Nonfamily Households |
| 1-Person Households | - | 394 (34.5%) |
| 2-Person Households | 317 (27.7%) | 87 (7.6%) |
| 3-Person Households | 198 (17.3%) | 0 (0.0%) |
| 4-Person Households | 56 (4.9%) | 0 (0.0%) |
| 5-Person Households | 79 (6.9%) | 0 (0.0%) |
| 6-Person Households | 12 (1.1%) | 0 (0.0%) |
| 7+ Person Households | 0 (0.0%) | 0 (0.0%) |
| Total | 662 (57.9%) | 481 (42.1%) |
Female Fertility in Pantego
Fertility by Age in Pantego
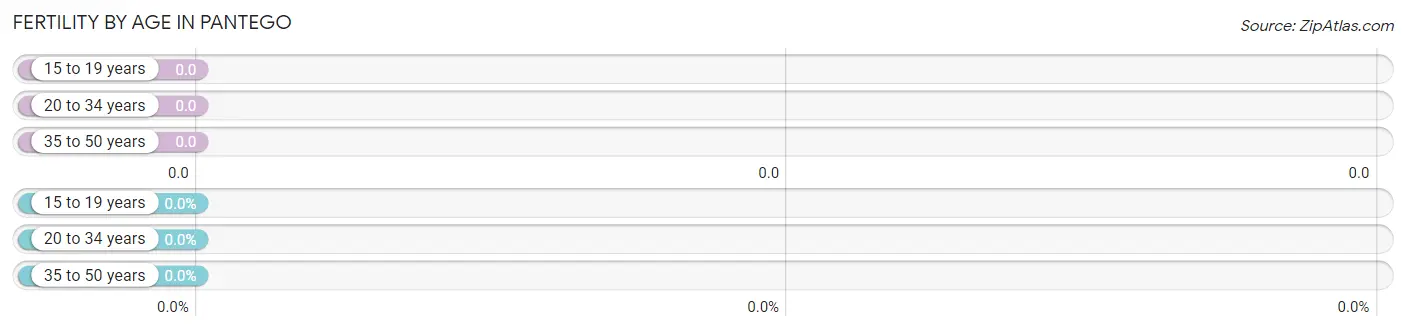
| Age Bracket | Women with Births | Births / 1,000 Women |
| 15 to 19 years | 0 (0.0%) | 0.0 |
| 20 to 34 years | 0 (0.0%) | 0.0 |
| 35 to 50 years | 0 (0.0%) | 0.0 |
| Total | 0 (0.0%) | 0.0 |
Fertility by Age by Marriage Status in Pantego
| Age Bracket | Married | Unmarried |
| 15 to 19 years | 0 (0.0%) | 0 (0.0%) |
| 20 to 34 years | 0 (0.0%) | 0 (0.0%) |
| 35 to 50 years | 0 (0.0%) | 0 (0.0%) |
| Total | 0 (0.0%) | 0 (0.0%) |
Fertility by Education in Pantego
| Educational Attainment | Women with Births | Births / 1,000 Women |
| Less than High School | 0 (0.0%) | 0.0 |
| High School Diploma | 0 (0.0%) | 0.0 |
| College or Associate's Degree | 0 (0.0%) | 0.0 |
| Bachelor's Degree | 0 (0.0%) | 0.0 |
| Graduate Degree | 0 (0.0%) | 0.0 |
| Total | 0 (0.0%) | 0.0 |
Fertility by Education by Marriage Status in Pantego
| Educational Attainment | Married | Unmarried |
| Less than High School | 0 (0.0%) | 0 (0.0%) |
| High School Diploma | 0 (0.0%) | 0 (0.0%) |
| College or Associate's Degree | 0 (0.0%) | 0 (0.0%) |
| Bachelor's Degree | 0 (0.0%) | 0 (0.0%) |
| Graduate Degree | 0 (0.0%) | 0 (0.0%) |
| Total | 0 (0.0%) | 0 (0.0%) |
Income in Pantego
Income Overview in Pantego
Per Capita Income in Pantego is $48,325, while median incomes of families and households are $113,750 and $84,125 respectively.
| Characteristic | Number | Measure |
| Per Capita Income | 2,529 | $48,325 |
| Median Family Income | 662 | $113,750 |
| Mean Family Income | 662 | $141,743 |
| Median Household Income | 1,143 | $84,125 |
| Mean Household Income | 1,143 | $107,472 |
| Income Deficit | 662 | $0 |
| Wage / Income Gap (%) | 2,529 | 44.58% |
| Wage / Income Gap ($) | 2,529 | 55.42¢ per $1 |
| Gini / Inequality Index | 2,529 | 0.45 |
Earnings by Sex in Pantego
Average Earnings in Pantego are $43,144, $62,589 for men and $34,688 for women, a difference of 44.6%.
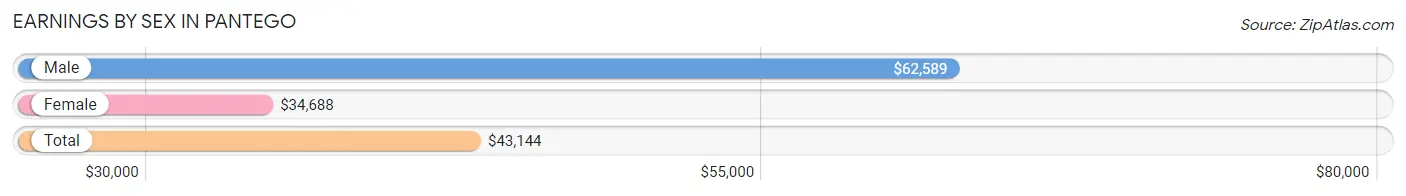
| Sex | Number | Average Earnings |
| Male | 706 (53.1%) | $62,589 |
| Female | 623 (46.9%) | $34,688 |
| Total | 1,329 (100.0%) | $43,144 |
Earnings by Sex by Income Bracket in Pantego
The most common earnings brackets in Pantego are $100,000+ for men (136 | 19.3%) and $30,000 to $34,999 for women (97 | 15.6%).
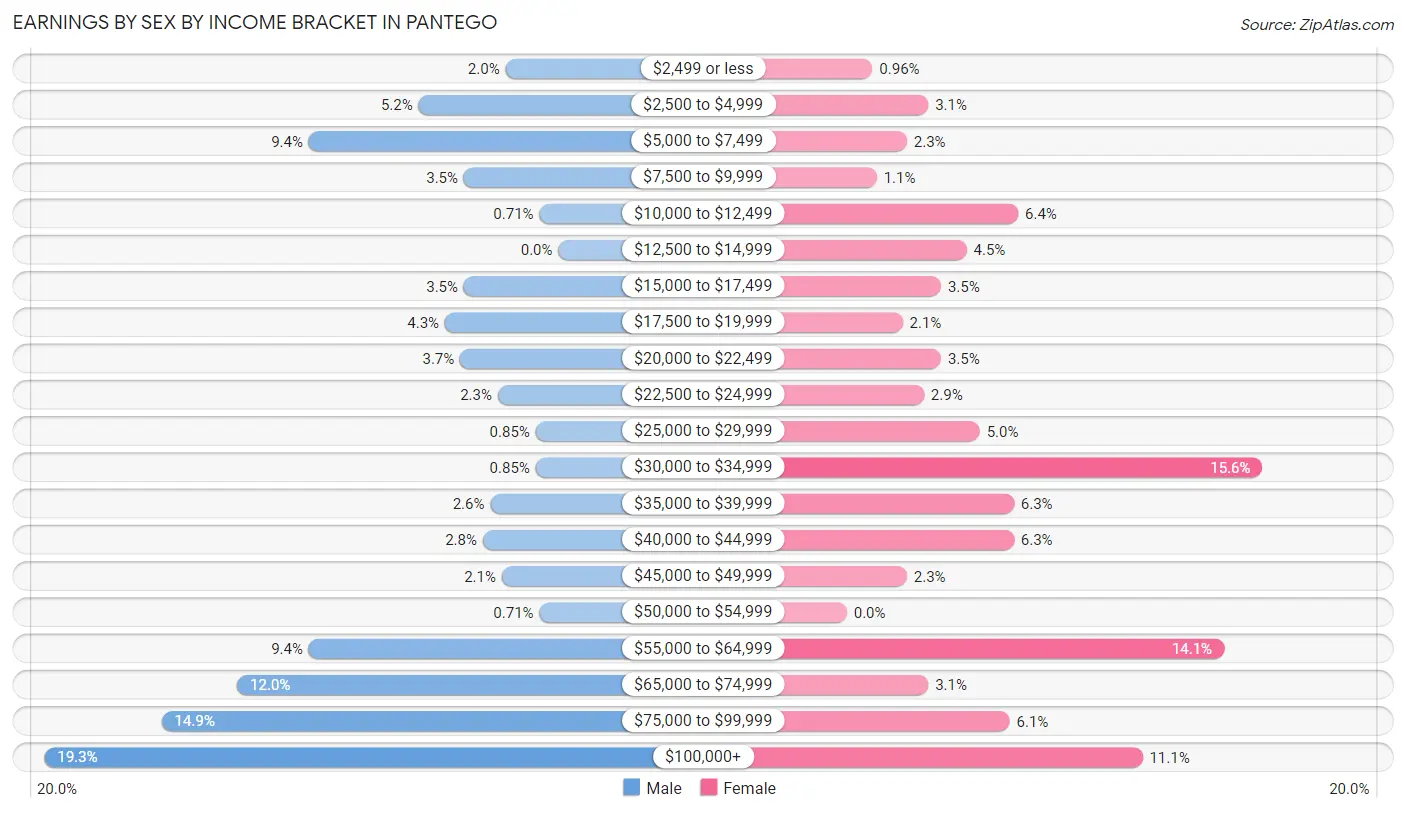
| Income | Male | Female |
| $2,499 or less | 14 (2.0%) | 6 (1.0%) |
| $2,500 to $4,999 | 37 (5.2%) | 19 (3.0%) |
| $5,000 to $7,499 | 66 (9.3%) | 14 (2.2%) |
| $7,500 to $9,999 | 25 (3.5%) | 7 (1.1%) |
| $10,000 to $12,499 | 5 (0.7%) | 40 (6.4%) |
| $12,500 to $14,999 | 0 (0.0%) | 28 (4.5%) |
| $15,000 to $17,499 | 25 (3.5%) | 22 (3.5%) |
| $17,500 to $19,999 | 30 (4.3%) | 13 (2.1%) |
| $20,000 to $22,499 | 26 (3.7%) | 22 (3.5%) |
| $22,500 to $24,999 | 16 (2.3%) | 18 (2.9%) |
| $25,000 to $29,999 | 6 (0.9%) | 31 (5.0%) |
| $30,000 to $34,999 | 6 (0.9%) | 97 (15.6%) |
| $35,000 to $39,999 | 18 (2.5%) | 39 (6.3%) |
| $40,000 to $44,999 | 20 (2.8%) | 39 (6.3%) |
| $45,000 to $49,999 | 15 (2.1%) | 14 (2.2%) |
| $50,000 to $54,999 | 5 (0.7%) | 0 (0.0%) |
| $55,000 to $64,999 | 66 (9.3%) | 88 (14.1%) |
| $65,000 to $74,999 | 85 (12.0%) | 19 (3.0%) |
| $75,000 to $99,999 | 105 (14.9%) | 38 (6.1%) |
| $100,000+ | 136 (19.3%) | 69 (11.1%) |
| Total | 706 (100.0%) | 623 (100.0%) |
Earnings by Sex by Educational Attainment in Pantego
Average earnings in Pantego are $64,509 for men and $34,972 for women, a difference of 45.8%. Men with an educational attainment of graduate degree enjoy the highest average annual earnings of $86,300, while those with less than high school education earn the least with $21,010. Women with an educational attainment of graduate degree earn the most with the average annual earnings of $71,250, while those with high school diploma education have the smallest earnings of $33,665.
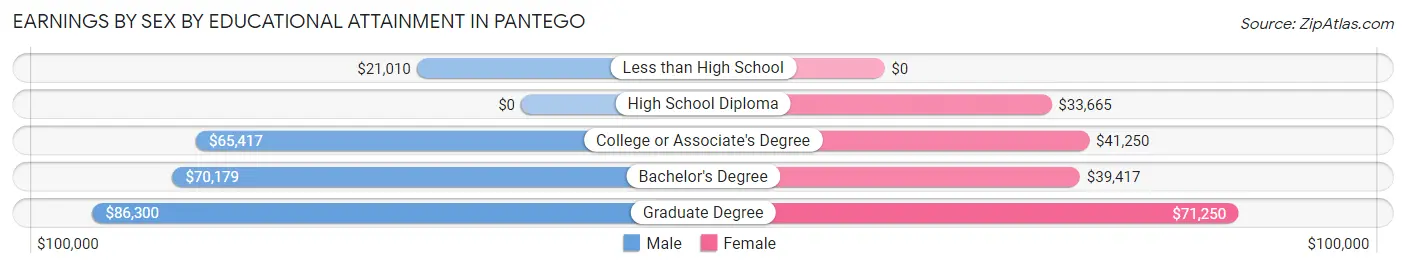
| Educational Attainment | Male Income | Female Income |
| Less than High School | $21,010 | $0 |
| High School Diploma | - | - |
| College or Associate's Degree | $65,417 | $41,250 |
| Bachelor's Degree | $70,179 | $39,417 |
| Graduate Degree | $86,300 | $71,250 |
| Total | $64,509 | $34,972 |
Family Income in Pantego
Family Income Brackets in Pantego
According to the Pantego family income data, there are 197 families falling into the $100,000 to $149,999 income range, which is the most common income bracket and makes up 29.8% of all families.
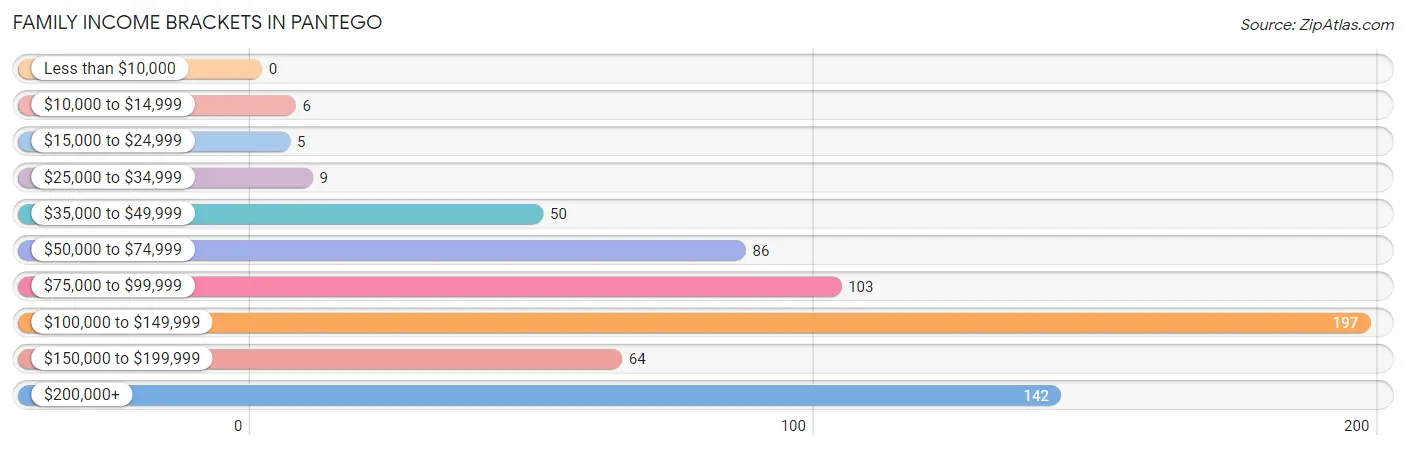
| Income Bracket | # Families | % Families |
| Less than $10,000 | 0 | 0.0% |
| $10,000 to $14,999 | 6 | 0.9% |
| $15,000 to $24,999 | 5 | 0.8% |
| $25,000 to $34,999 | 9 | 1.4% |
| $35,000 to $49,999 | 50 | 7.6% |
| $50,000 to $74,999 | 86 | 13.0% |
| $75,000 to $99,999 | 103 | 15.6% |
| $100,000 to $149,999 | 197 | 29.8% |
| $150,000 to $199,999 | 64 | 9.7% |
| $200,000+ | 142 | 21.5% |
Family Income by Famaliy Size in Pantego
5-person families (79 | 11.9%) account for the highest median family income in Pantego with $119,276 per family, while 2-person families (322 | 48.6%) have the highest median income of $52,750 per family member.
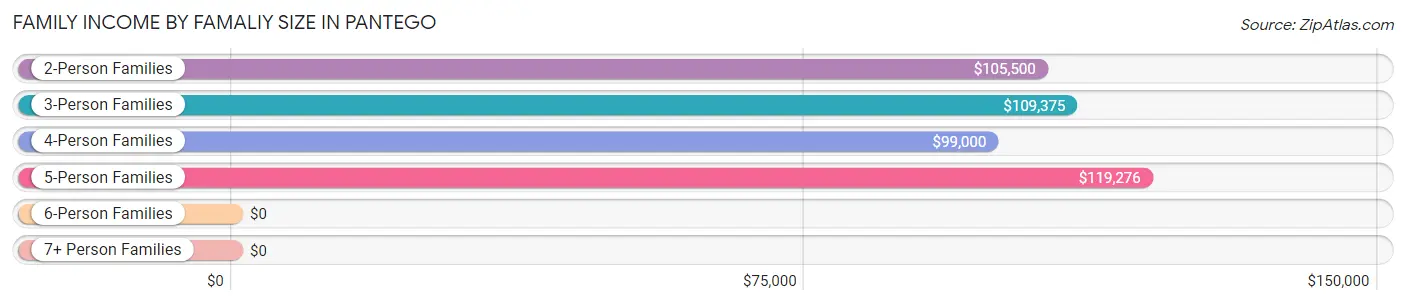
| Income Bracket | # Families | Median Income |
| 2-Person Families | 322 (48.6%) | $105,500 |
| 3-Person Families | 193 (29.1%) | $109,375 |
| 4-Person Families | 56 (8.5%) | $99,000 |
| 5-Person Families | 79 (11.9%) | $119,276 |
| 6-Person Families | 12 (1.8%) | $0 |
| 7+ Person Families | 0 (0.0%) | $0 |
| Total | 662 (100.0%) | $113,750 |
Family Income by Number of Earners in Pantego
The median family income in Pantego is $113,750, with families comprising 3+ earners (60) having the highest median family income of $212,667, while families with no earners (120) have the lowest median family income of $70,625, accounting for 9.1% and 18.1% of families, respectively.
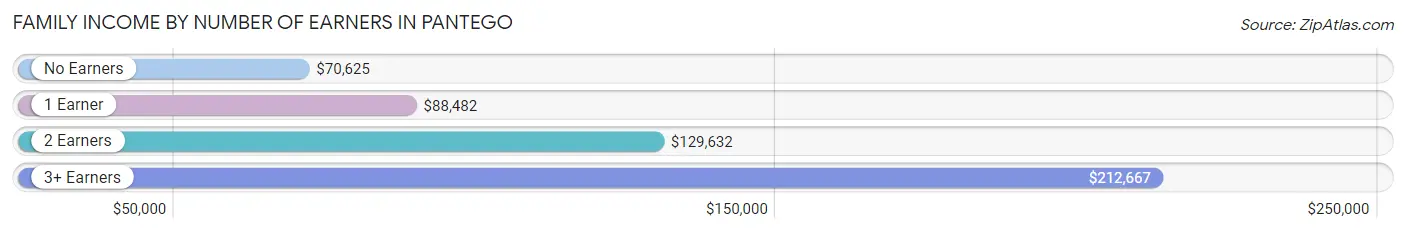
| Number of Earners | # Families | Median Income |
| No Earners | 120 (18.1%) | $70,625 |
| 1 Earner | 175 (26.4%) | $88,482 |
| 2 Earners | 307 (46.4%) | $129,632 |
| 3+ Earners | 60 (9.1%) | $212,667 |
| Total | 662 (100.0%) | $113,750 |
Household Income in Pantego
Household Income Brackets in Pantego
With 217 households falling in the category, the $100,000 to $149,999 income range is the most frequent in Pantego, accounting for 19.0% of all households. In contrast, only 2 households (0.2%) fall into the less than $10,000 income bracket, making it the least populous group.
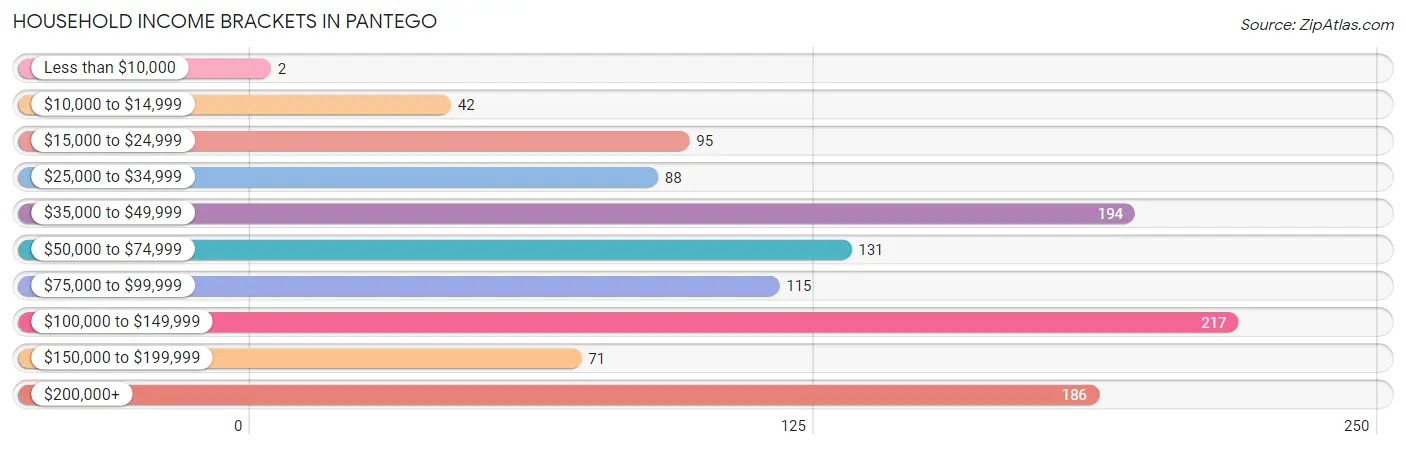
| Income Bracket | # Households | % Households |
| Less than $10,000 | 2 | 0.2% |
| $10,000 to $14,999 | 42 | 3.7% |
| $15,000 to $24,999 | 95 | 8.3% |
| $25,000 to $34,999 | 88 | 7.7% |
| $35,000 to $49,999 | 194 | 17.0% |
| $50,000 to $74,999 | 131 | 11.5% |
| $75,000 to $99,999 | 115 | 10.1% |
| $100,000 to $149,999 | 217 | 19.0% |
| $150,000 to $199,999 | 71 | 6.2% |
| $200,000+ | 186 | 16.3% |
Household Income by Householder Age in Pantego
The median household income in Pantego is $84,125, with the highest median household income of $128,021 found in the 45 to 64 years age bracket for the primary householder. A total of 337 households (29.5%) fall into this category. Meanwhile, the 15 to 24 years age bracket for the primary householder has the lowest median household income of $0, with 13 households (1.1%) in this group.
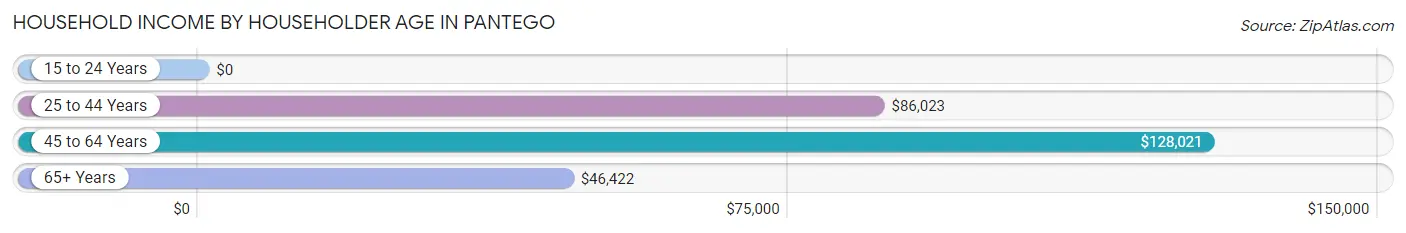
| Income Bracket | # Households | Median Income |
| 15 to 24 Years | 13 (1.1%) | $0 |
| 25 to 44 Years | 350 (30.6%) | $86,023 |
| 45 to 64 Years | 337 (29.5%) | $128,021 |
| 65+ Years | 443 (38.8%) | $46,422 |
| Total | 1,143 (100.0%) | $84,125 |
Poverty in Pantego
Income Below Poverty by Sex and Age in Pantego
With 6.7% poverty level for males and 2.5% for females among the residents of Pantego, 25 to 34 year old males and 55 to 64 year old females are the most vulnerable to poverty, with 58 males (33.3%) and 18 females (10.3%) in their respective age groups living below the poverty level.
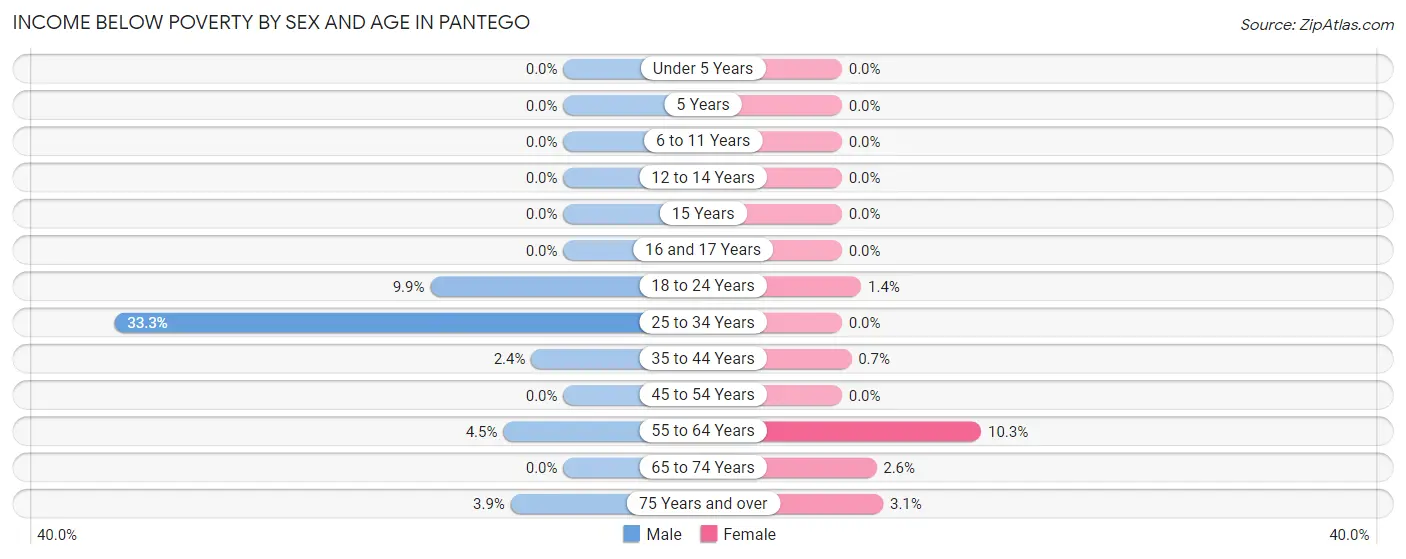
| Age Bracket | Male | Female |
| Under 5 Years | 0 (0.0%) | 0 (0.0%) |
| 5 Years | 0 (0.0%) | 0 (0.0%) |
| 6 to 11 Years | 0 (0.0%) | 0 (0.0%) |
| 12 to 14 Years | 0 (0.0%) | 0 (0.0%) |
| 15 Years | 0 (0.0%) | 0 (0.0%) |
| 16 and 17 Years | 0 (0.0%) | 0 (0.0%) |
| 18 to 24 Years | 8 (9.9%) | 1 (1.4%) |
| 25 to 34 Years | 58 (33.3%) | 0 (0.0%) |
| 35 to 44 Years | 5 (2.4%) | 1 (0.7%) |
| 45 to 54 Years | 0 (0.0%) | 0 (0.0%) |
| 55 to 64 Years | 5 (4.5%) | 18 (10.3%) |
| 65 to 74 Years | 0 (0.0%) | 5 (2.6%) |
| 75 Years and over | 5 (3.9%) | 7 (3.1%) |
| Total | 81 (6.7%) | 32 (2.5%) |
Income Above Poverty by Sex and Age in Pantego
According to the poverty statistics in Pantego, males aged under 5 years and females aged under 5 years are the age groups that are most secure financially, with 100.0% of males and 100.0% of females in these age groups living above the poverty line.
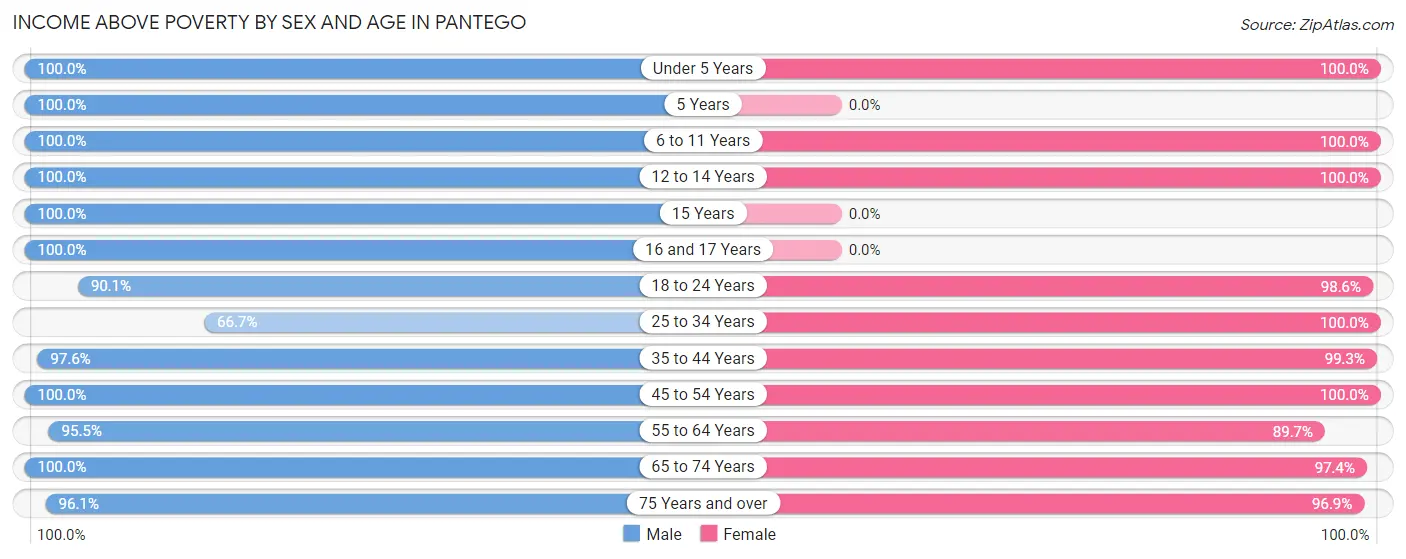
| Age Bracket | Male | Female |
| Under 5 Years | 32 (100.0%) | 41 (100.0%) |
| 5 Years | 27 (100.0%) | 0 (0.0%) |
| 6 to 11 Years | 88 (100.0%) | 98 (100.0%) |
| 12 to 14 Years | 69 (100.0%) | 69 (100.0%) |
| 15 Years | 36 (100.0%) | 0 (0.0%) |
| 16 and 17 Years | 20 (100.0%) | 0 (0.0%) |
| 18 to 24 Years | 73 (90.1%) | 69 (98.6%) |
| 25 to 34 Years | 116 (66.7%) | 129 (100.0%) |
| 35 to 44 Years | 205 (97.6%) | 142 (99.3%) |
| 45 to 54 Years | 139 (100.0%) | 147 (100.0%) |
| 55 to 64 Years | 107 (95.5%) | 156 (89.7%) |
| 65 to 74 Years | 87 (100.0%) | 190 (97.4%) |
| 75 Years and over | 123 (96.1%) | 222 (96.9%) |
| Total | 1,122 (93.3%) | 1,263 (97.5%) |
Income Below Poverty Among Married-Couple Families in Pantego
The poverty statistics for married-couple families in Pantego show that 0.9% or 5 of the total 542 families live below the poverty line. Families with no children have the highest poverty rate of 1.5%, comprising of 5 families. On the other hand, families with 1 or 2 children have the lowest poverty rate of 0.0%, which includes 0 families.
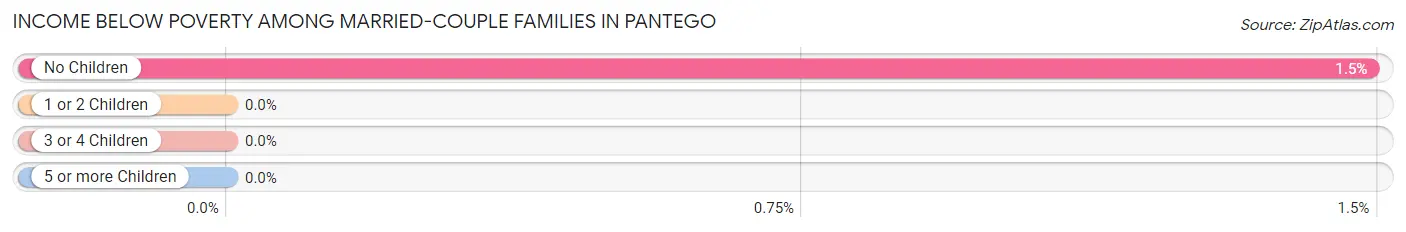
| Children | Above Poverty | Below Poverty |
| No Children | 331 (98.5%) | 5 (1.5%) |
| 1 or 2 Children | 146 (100.0%) | 0 (0.0%) |
| 3 or 4 Children | 60 (100.0%) | 0 (0.0%) |
| 5 or more Children | 0 (0.0%) | 0 (0.0%) |
| Total | 537 (99.1%) | 5 (0.9%) |
Income Below Poverty Among Single-Parent Households in Pantego
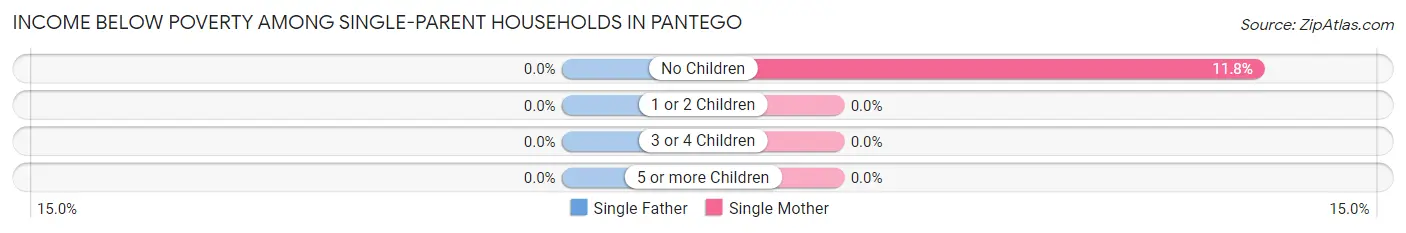
| Children | Single Father | Single Mother |
| No Children | 0 (0.0%) | 6 (11.8%) |
| 1 or 2 Children | 0 (0.0%) | 0 (0.0%) |
| 3 or 4 Children | 0 (0.0%) | 0 (0.0%) |
| 5 or more Children | 0 (0.0%) | 0 (0.0%) |
| Total | 0 (0.0%) | 6 (6.2%) |
Income Below Poverty Among Married-Couple vs Single-Parent Households in Pantego
The poverty data for Pantego shows that 5 of the married-couple family households (0.9%) and 6 of the single-parent households (5.0%) are living below the poverty level. Within the married-couple family households, those with no children have the highest poverty rate, with 5 households (1.5%) falling below the poverty line. Among the single-parent households, those with no children have the highest poverty rate, with 6 household (11.8%) living below poverty.
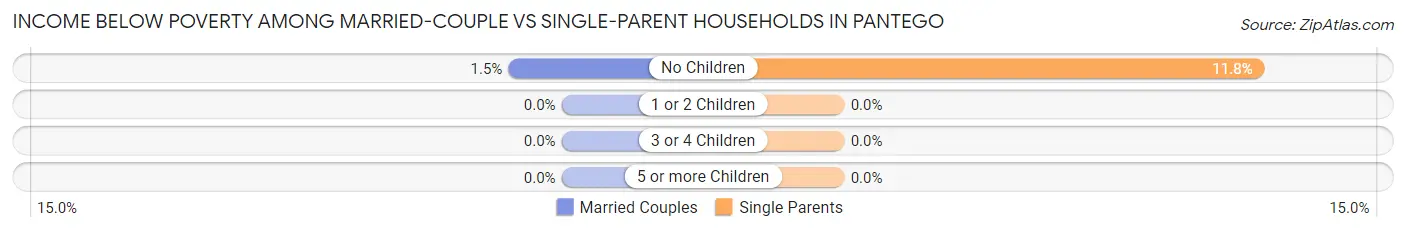
| Children | Married-Couple Families | Single-Parent Households |
| No Children | 5 (1.5%) | 6 (11.8%) |
| 1 or 2 Children | 0 (0.0%) | 0 (0.0%) |
| 3 or 4 Children | 0 (0.0%) | 0 (0.0%) |
| 5 or more Children | 0 (0.0%) | 0 (0.0%) |
| Total | 5 (0.9%) | 6 (5.0%) |
Employment Characteristics in Pantego
Employment by Class of Employer in Pantego
Among the 1,126 employed individuals in Pantego, private company employees (757 | 67.2%), not-for-profit organizations (151 | 13.4%), and local government employees (74 | 6.6%) make up the most common classes of employment.
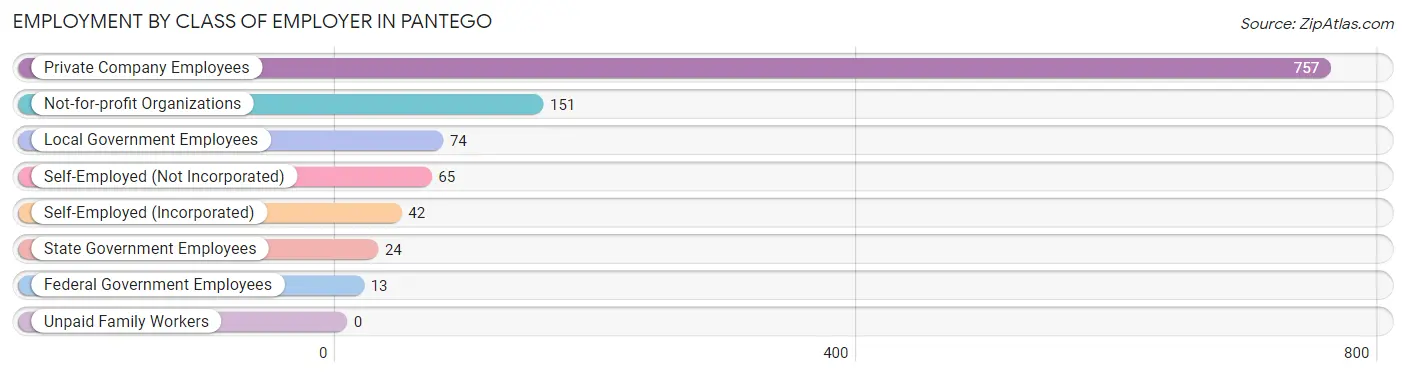
| Employer Class | # Employees | % Employees |
| Private Company Employees | 757 | 67.2% |
| Self-Employed (Incorporated) | 42 | 3.7% |
| Self-Employed (Not Incorporated) | 65 | 5.8% |
| Not-for-profit Organizations | 151 | 13.4% |
| Local Government Employees | 74 | 6.6% |
| State Government Employees | 24 | 2.1% |
| Federal Government Employees | 13 | 1.1% |
| Unpaid Family Workers | 0 | 0.0% |
| Total | 1,126 | 100.0% |
Employment Status by Age in Pantego
According to the labor force statistics for Pantego, out of the total population over 16 years of age (2,069), 61.3% or 1,268 individuals are in the labor force, with 7.6% or 96 of them unemployed. The age group with the highest labor force participation rate is 25 to 29 years, with 91.3% or 219 individuals in the labor force. Within the labor force, the 25 to 29 years age range has the highest percentage of unemployed individuals, with 20.1% or 44 of them being unemployed.
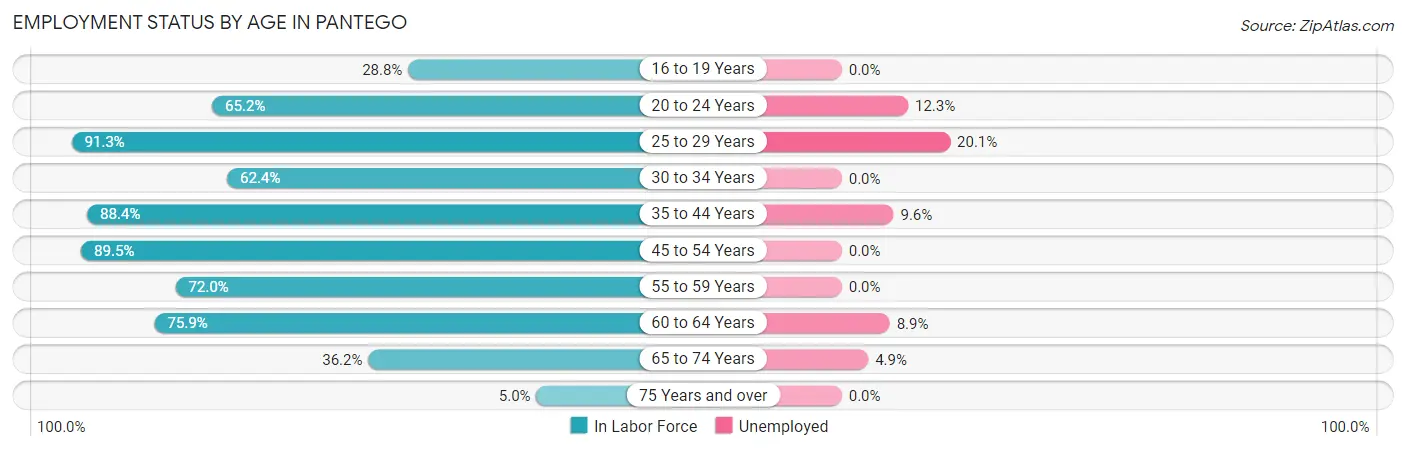
| Age Bracket | In Labor Force | Unemployed |
| 16 to 19 Years | 17 (28.8%) | 0 (0.0%) |
| 20 to 24 Years | 73 (65.2%) | 9 (12.3%) |
| 25 to 29 Years | 219 (91.3%) | 44 (20.1%) |
| 30 to 34 Years | 53 (62.4%) | 0 (0.0%) |
| 35 to 44 Years | 313 (88.4%) | 30 (9.6%) |
| 45 to 54 Years | 256 (89.5%) | 0 (0.0%) |
| 55 to 59 Years | 116 (72.0%) | 0 (0.0%) |
| 60 to 64 Years | 101 (75.9%) | 9 (8.9%) |
| 65 to 74 Years | 102 (36.2%) | 5 (4.9%) |
| 75 Years and over | 18 (5.0%) | 0 (0.0%) |
| Total | 1,268 (61.3%) | 96 (7.6%) |
Employment Status by Educational Attainment in Pantego
According to labor force statistics for Pantego, 84.0% of individuals (1,058) out of the total population between 25 and 64 years of age (1,259) are in the labor force, with 7.8% or 83 of them being unemployed. The group with the highest labor force participation rate are those with the educational attainment of bachelor's degree or higher, with 89.5% or 521 individuals in the labor force. Within the labor force, individuals with high school diploma education have the highest percentage of unemployment, with 36.1% or 70 of them being unemployed.
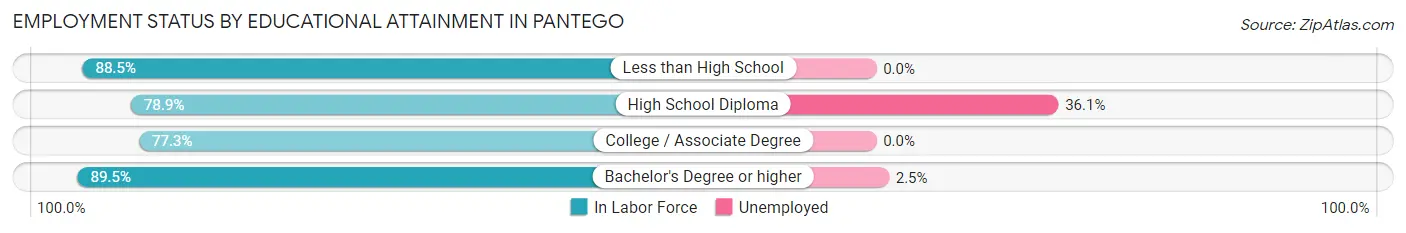
| Educational Attainment | In Labor Force | Unemployed |
| Less than High School | 77 (88.5%) | 0 (0.0%) |
| High School Diploma | 194 (78.9%) | 89 (36.1%) |
| College / Associate Degree | 266 (77.3%) | 0 (0.0%) |
| Bachelor's Degree or higher | 521 (89.5%) | 15 (2.5%) |
| Total | 1,058 (84.0%) | 98 (7.8%) |
Employment Occupations by Sex in Pantego
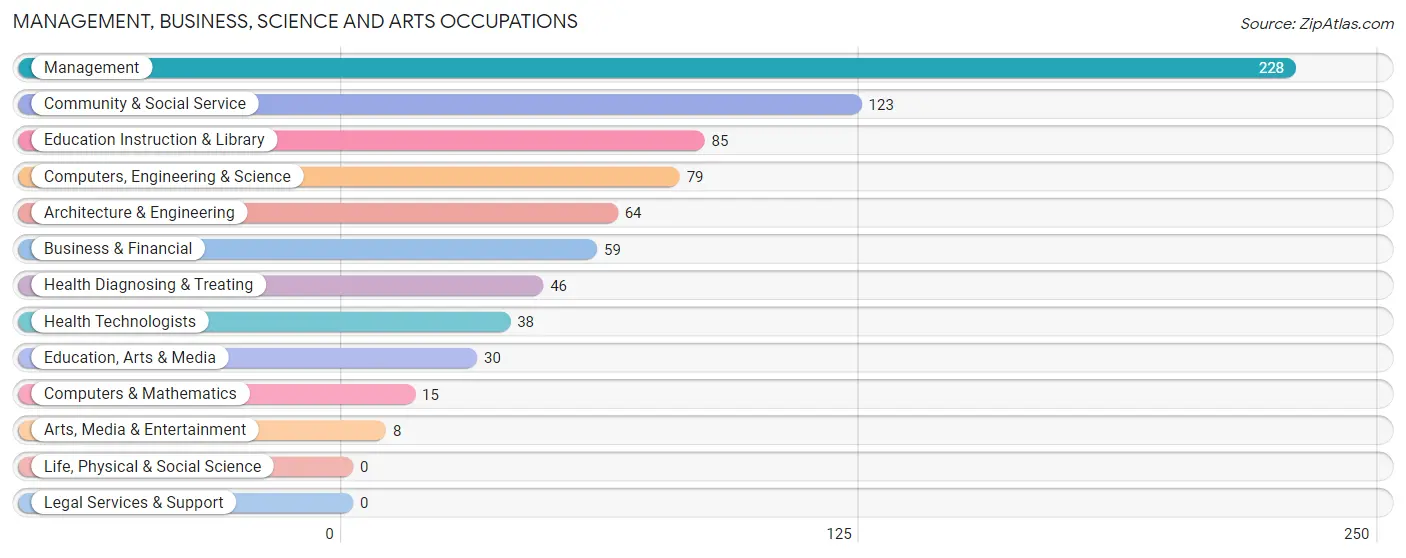
Management, Business, Science and Arts Occupations
The most common Management, Business, Science and Arts occupations in Pantego are Management (228 | 19.5%), Community & Social Service (123 | 10.5%), Education Instruction & Library (85 | 7.3%), Computers, Engineering & Science (79 | 6.8%), and Architecture & Engineering (64 | 5.5%).
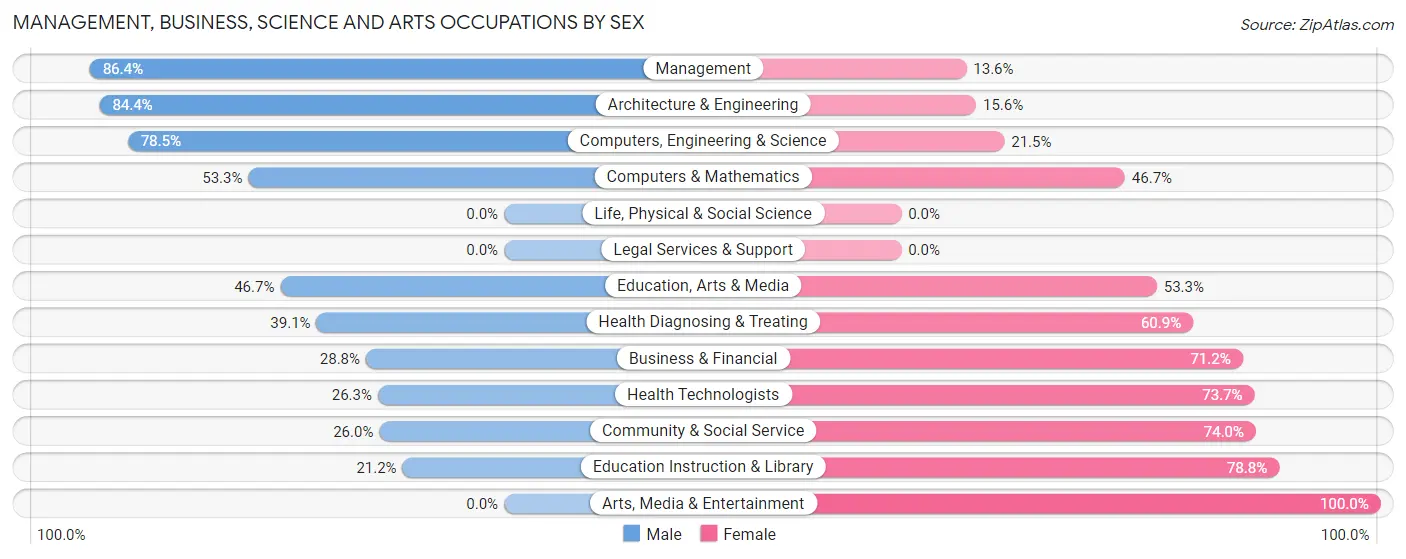
Management, Business, Science and Arts Occupations by Sex
Within the Management, Business, Science and Arts occupations in Pantego, the most male-oriented occupations are Management (86.4%), Architecture & Engineering (84.4%), and Computers, Engineering & Science (78.5%), while the most female-oriented occupations are Arts, Media & Entertainment (100.0%), Education Instruction & Library (78.8%), and Community & Social Service (74.0%).
| Occupation | Male | Female |
| Management | 197 (86.4%) | 31 (13.6%) |
| Business & Financial | 17 (28.8%) | 42 (71.2%) |
| Computers, Engineering & Science | 62 (78.5%) | 17 (21.5%) |
| Computers & Mathematics | 8 (53.3%) | 7 (46.7%) |
| Architecture & Engineering | 54 (84.4%) | 10 (15.6%) |
| Life, Physical & Social Science | 0 (0.0%) | 0 (0.0%) |
| Community & Social Service | 32 (26.0%) | 91 (74.0%) |
| Education, Arts & Media | 14 (46.7%) | 16 (53.3%) |
| Legal Services & Support | 0 (0.0%) | 0 (0.0%) |
| Education Instruction & Library | 18 (21.2%) | 67 (78.8%) |
| Arts, Media & Entertainment | 0 (0.0%) | 8 (100.0%) |
| Health Diagnosing & Treating | 18 (39.1%) | 28 (60.9%) |
| Health Technologists | 10 (26.3%) | 28 (73.7%) |
| Total (Category) | 326 (60.9%) | 209 (39.1%) |
| Total (Overall) | 663 (56.6%) | 508 (43.4%) |
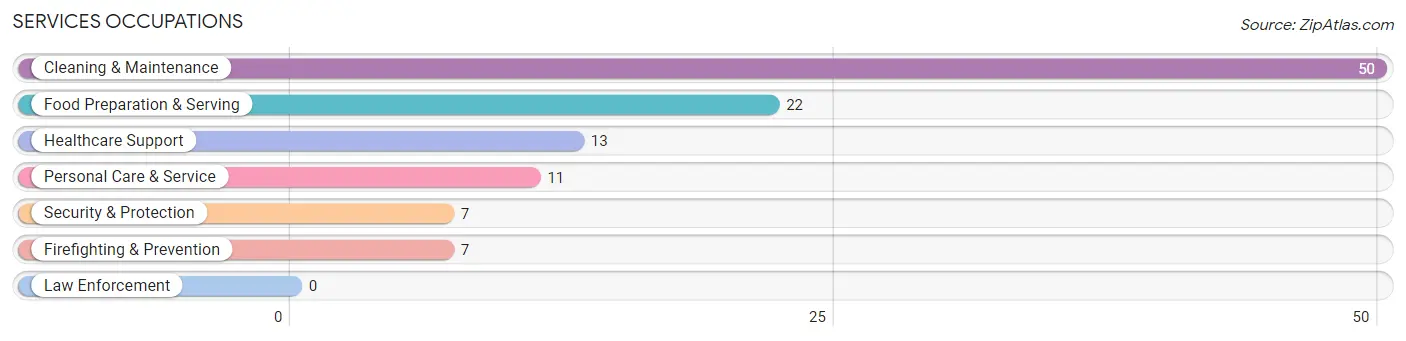
Services Occupations
The most common Services occupations in Pantego are Cleaning & Maintenance (50 | 4.3%), Food Preparation & Serving (22 | 1.9%), Healthcare Support (13 | 1.1%), Personal Care & Service (11 | 0.9%), and Security & Protection (7 | 0.6%).
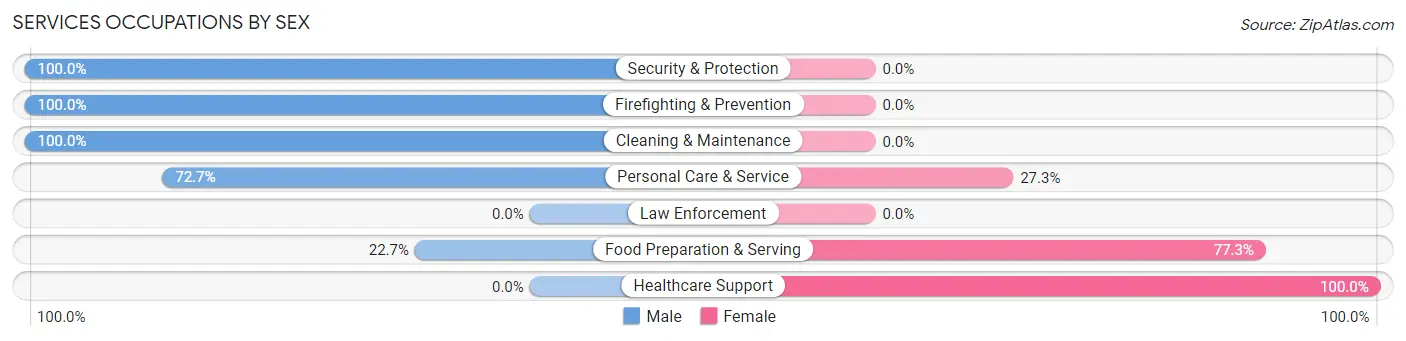
Services Occupations by Sex
Within the Services occupations in Pantego, the most male-oriented occupations are Security & Protection (100.0%), Firefighting & Prevention (100.0%), and Cleaning & Maintenance (100.0%), while the most female-oriented occupations are Healthcare Support (100.0%), Food Preparation & Serving (77.3%), and Personal Care & Service (27.3%).
| Occupation | Male | Female |
| Healthcare Support | 0 (0.0%) | 13 (100.0%) |
| Security & Protection | 7 (100.0%) | 0 (0.0%) |
| Firefighting & Prevention | 7 (100.0%) | 0 (0.0%) |
| Law Enforcement | 0 (0.0%) | 0 (0.0%) |
| Food Preparation & Serving | 5 (22.7%) | 17 (77.3%) |
| Cleaning & Maintenance | 50 (100.0%) | 0 (0.0%) |
| Personal Care & Service | 8 (72.7%) | 3 (27.3%) |
| Total (Category) | 70 (68.0%) | 33 (32.0%) |
| Total (Overall) | 663 (56.6%) | 508 (43.4%) |
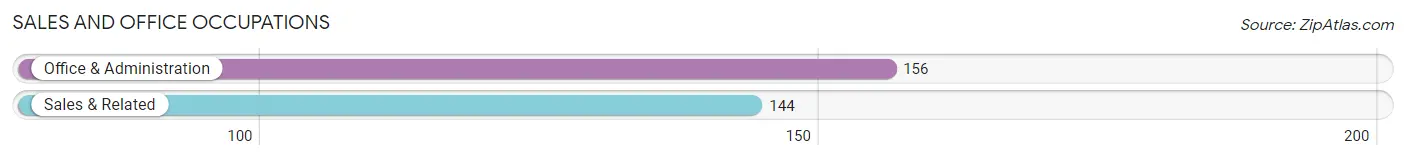
Sales and Office Occupations
The most common Sales and Office occupations in Pantego are Office & Administration (156 | 13.3%), and Sales & Related (144 | 12.3%).
Sales and Office Occupations by Sex
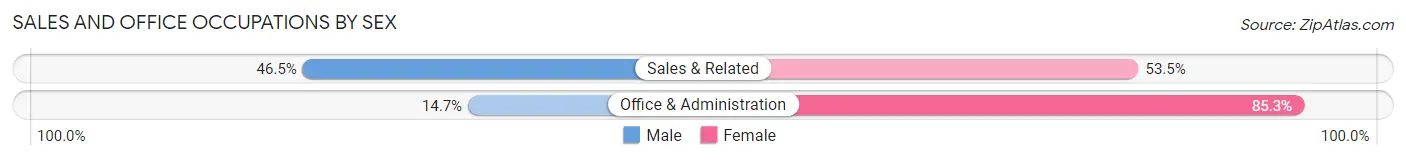
| Occupation | Male | Female |
| Sales & Related | 67 (46.5%) | 77 (53.5%) |
| Office & Administration | 23 (14.7%) | 133 (85.3%) |
| Total (Category) | 90 (30.0%) | 210 (70.0%) |
| Total (Overall) | 663 (56.6%) | 508 (43.4%) |
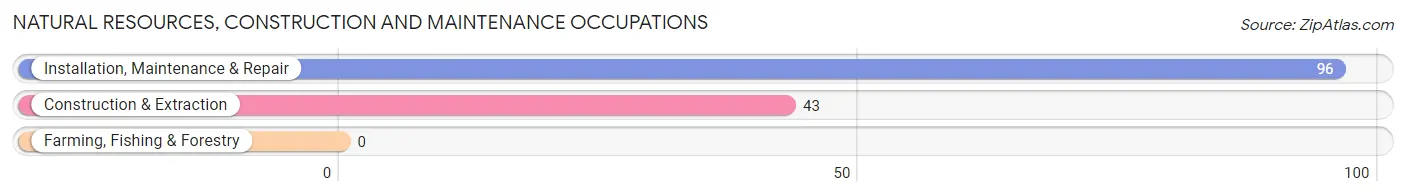
Natural Resources, Construction and Maintenance Occupations
The most common Natural Resources, Construction and Maintenance occupations in Pantego are Installation, Maintenance & Repair (96 | 8.2%), and Construction & Extraction (43 | 3.7%).
Natural Resources, Construction and Maintenance Occupations by Sex
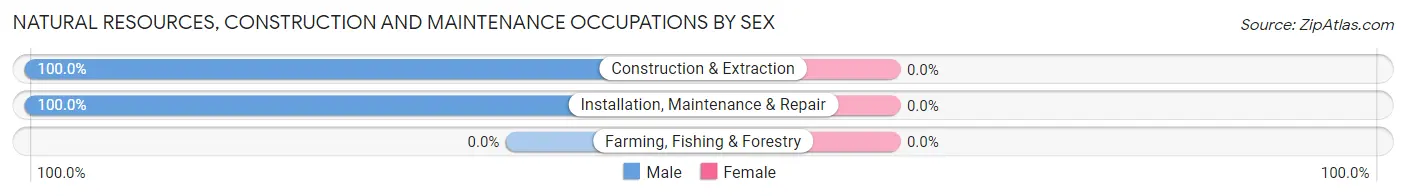
| Occupation | Male | Female |
| Farming, Fishing & Forestry | 0 (0.0%) | 0 (0.0%) |
| Construction & Extraction | 43 (100.0%) | 0 (0.0%) |
| Installation, Maintenance & Repair | 96 (100.0%) | 0 (0.0%) |
| Total (Category) | 139 (100.0%) | 0 (0.0%) |
| Total (Overall) | 663 (56.6%) | 508 (43.4%) |
Production, Transportation and Moving Occupations
The most common Production, Transportation and Moving occupations in Pantego are Material Moving (59 | 5.0%), Production (24 | 2.1%), and Transportation (11 | 0.9%).
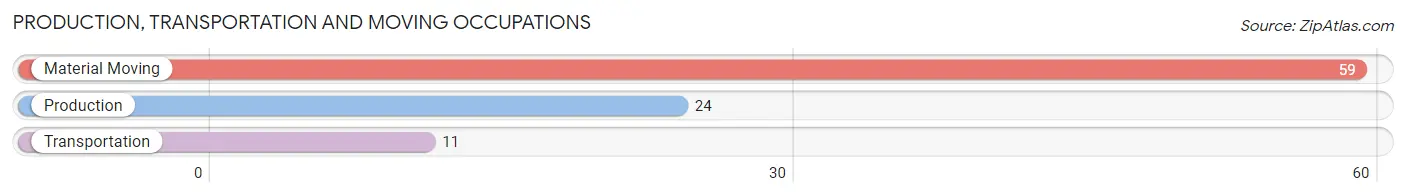
Production, Transportation and Moving Occupations by Sex
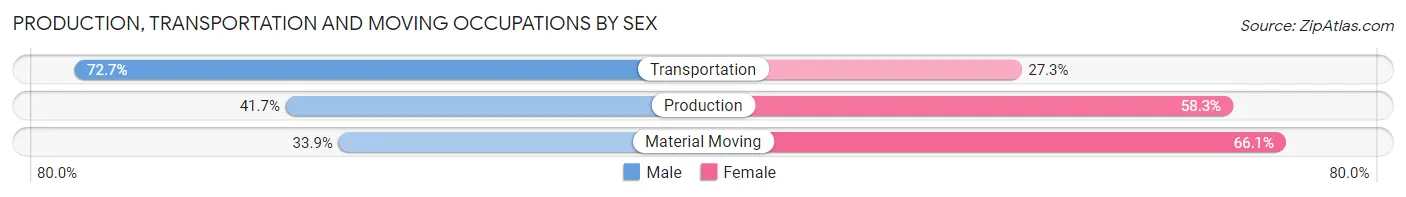
| Occupation | Male | Female |
| Production | 10 (41.7%) | 14 (58.3%) |
| Transportation | 8 (72.7%) | 3 (27.3%) |
| Material Moving | 20 (33.9%) | 39 (66.1%) |
| Total (Category) | 38 (40.4%) | 56 (59.6%) |
| Total (Overall) | 663 (56.6%) | 508 (43.4%) |
Employment Industries by Sex in Pantego
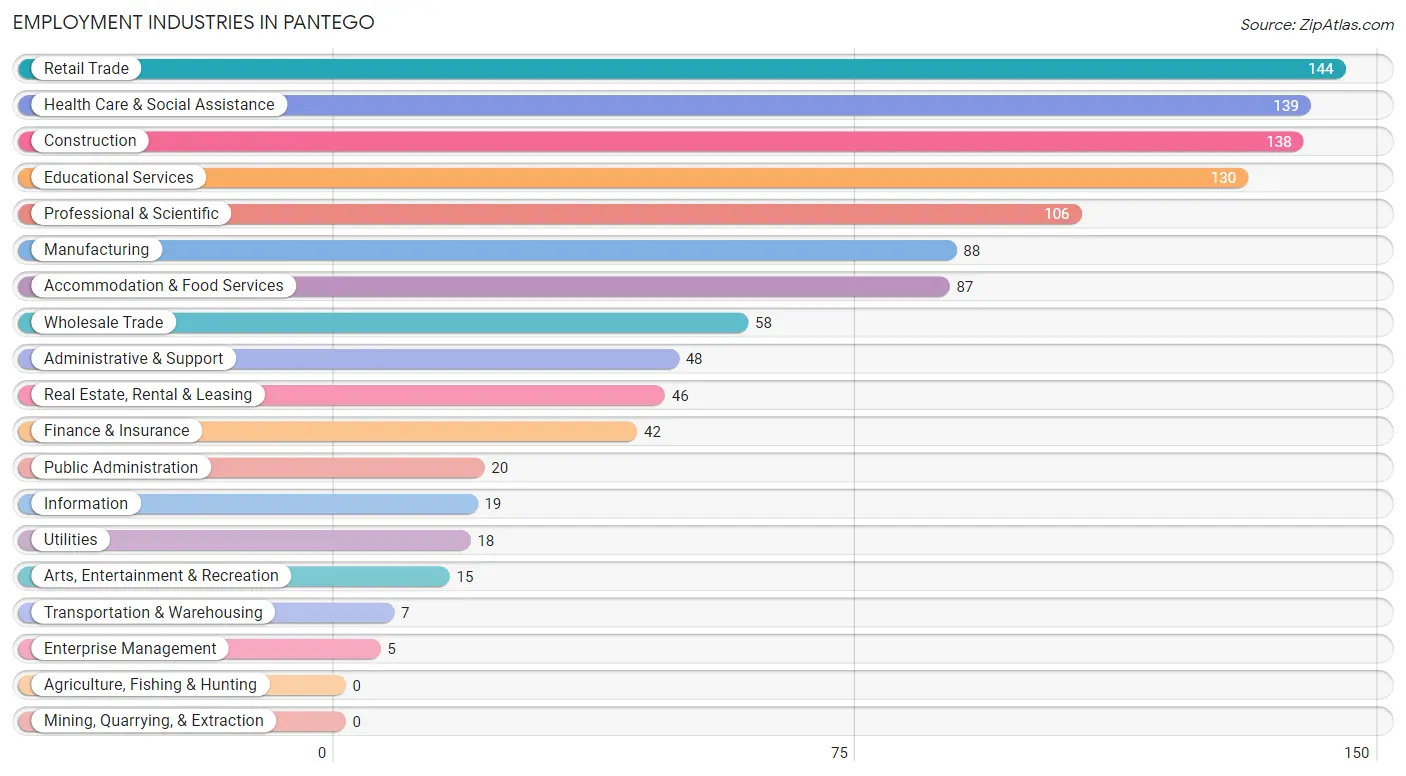
Employment Industries in Pantego
The major employment industries in Pantego include Retail Trade (144 | 12.3%), Health Care & Social Assistance (139 | 11.9%), Construction (138 | 11.8%), Educational Services (130 | 11.1%), and Professional & Scientific (106 | 9.0%).
Employment Industries by Sex in Pantego
The Pantego industries that see more men than women are Transportation & Warehousing (100.0%), Utilities (100.0%), and Enterprise Management (100.0%), whereas the industries that tend to have a higher number of women are Educational Services (72.3%), Retail Trade (65.3%), and Real Estate, Rental & Leasing (63.0%).
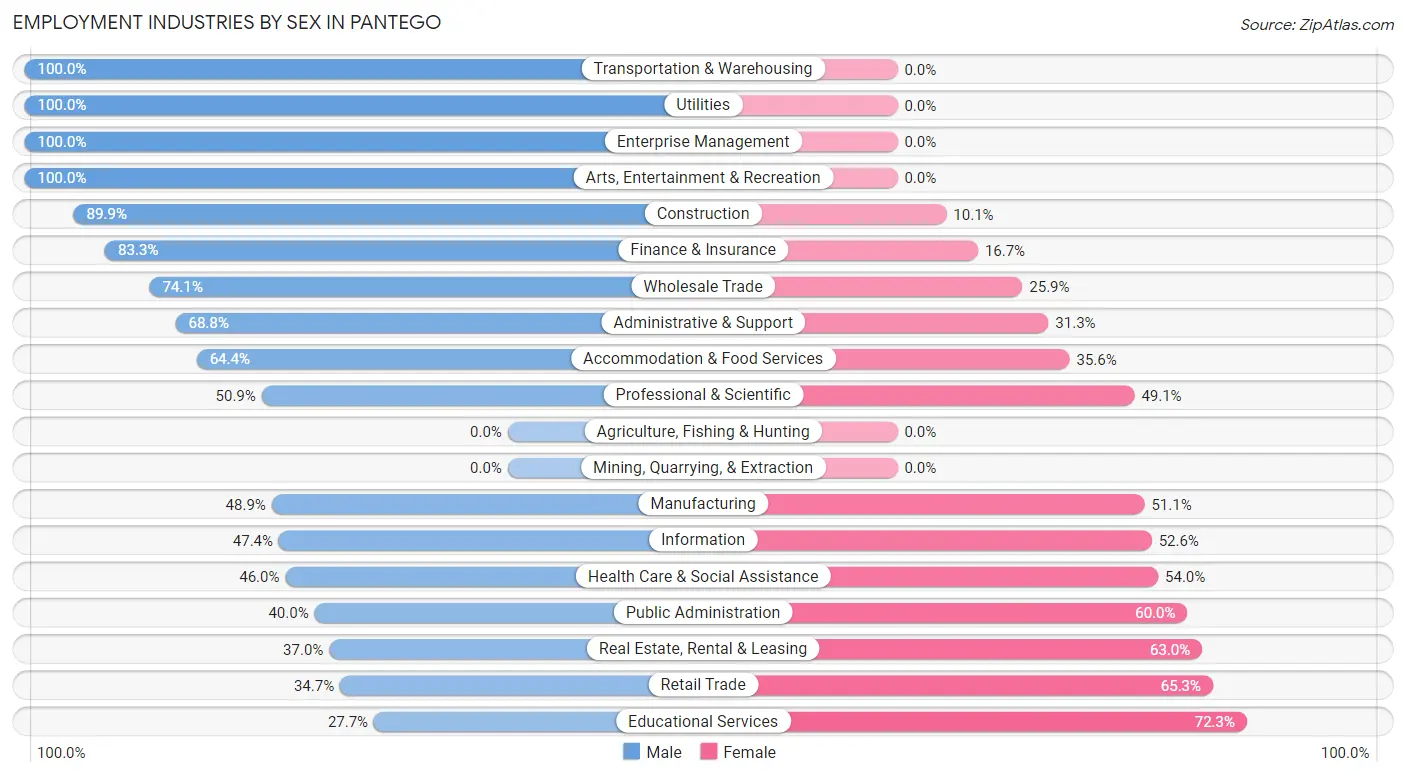
| Industry | Male | Female |
| Agriculture, Fishing & Hunting | 0 (0.0%) | 0 (0.0%) |
| Mining, Quarrying, & Extraction | 0 (0.0%) | 0 (0.0%) |
| Construction | 124 (89.9%) | 14 (10.1%) |
| Manufacturing | 43 (48.9%) | 45 (51.1%) |
| Wholesale Trade | 43 (74.1%) | 15 (25.9%) |
| Retail Trade | 50 (34.7%) | 94 (65.3%) |
| Transportation & Warehousing | 7 (100.0%) | 0 (0.0%) |
| Utilities | 18 (100.0%) | 0 (0.0%) |
| Information | 9 (47.4%) | 10 (52.6%) |
| Finance & Insurance | 35 (83.3%) | 7 (16.7%) |
| Real Estate, Rental & Leasing | 17 (37.0%) | 29 (63.0%) |
| Professional & Scientific | 54 (50.9%) | 52 (49.1%) |
| Enterprise Management | 5 (100.0%) | 0 (0.0%) |
| Administrative & Support | 33 (68.8%) | 15 (31.2%) |
| Educational Services | 36 (27.7%) | 94 (72.3%) |
| Health Care & Social Assistance | 64 (46.0%) | 75 (54.0%) |
| Arts, Entertainment & Recreation | 15 (100.0%) | 0 (0.0%) |
| Accommodation & Food Services | 56 (64.4%) | 31 (35.6%) |
| Public Administration | 8 (40.0%) | 12 (60.0%) |
| Total | 663 (56.6%) | 508 (43.4%) |
Education in Pantego
School Enrollment in Pantego
The most common levels of schooling among the 623 students in Pantego are middle school (148 | 23.8%), college / undergraduate (145 | 23.3%), and elementary school (141 | 22.6%).
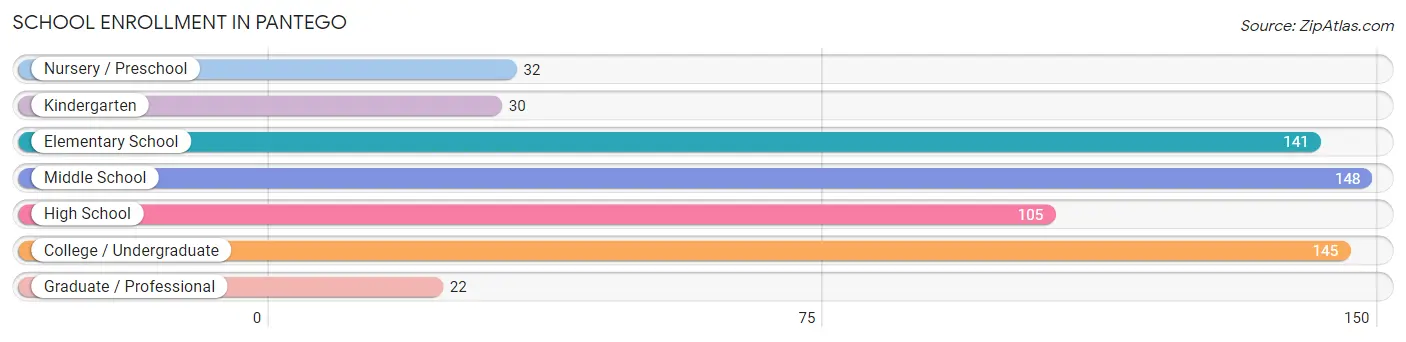
| School Level | # Students | % Students |
| Nursery / Preschool | 32 | 5.1% |
| Kindergarten | 30 | 4.8% |
| Elementary School | 141 | 22.6% |
| Middle School | 148 | 23.8% |
| High School | 105 | 16.9% |
| College / Undergraduate | 145 | 23.3% |
| Graduate / Professional | 22 | 3.5% |
| Total | 623 | 100.0% |
School Enrollment by Age by Funding Source in Pantego
Out of a total of 623 students who are enrolled in schools in Pantego, 153 (24.6%) attend a private institution, while the remaining 470 (75.4%) are enrolled in public schools. The age group of 3 to 4 year olds has the highest likelihood of being enrolled in private schools, with 20 (71.4% in the age bracket) enrolled. Conversely, the age group of 35 years and over has the lowest likelihood of being enrolled in a private school, with 55 (100.0% in the age bracket) attending a public institution.
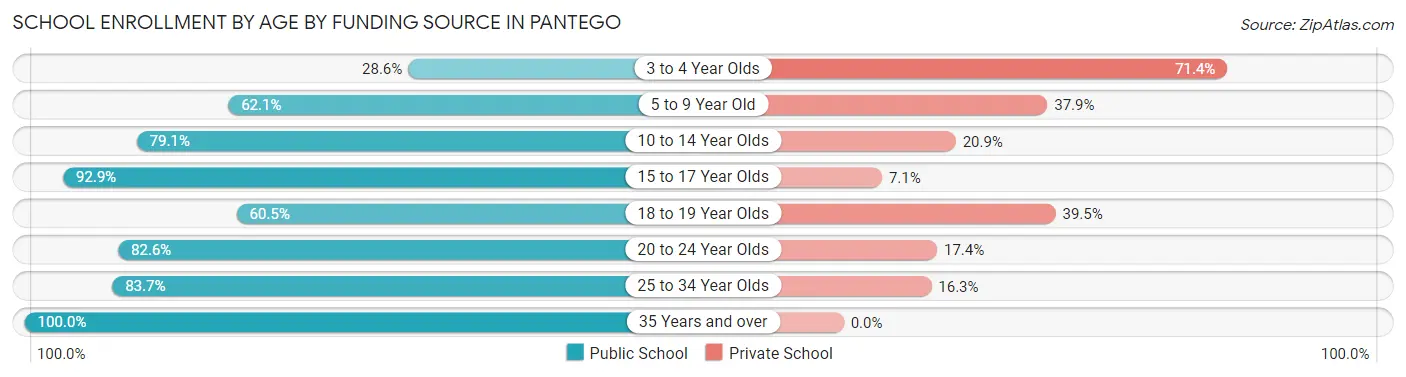
| Age Bracket | Public School | Private School |
| 3 to 4 Year Olds | 8 (28.6%) | 20 (71.4%) |
| 5 to 9 Year Old | 90 (62.1%) | 55 (37.9%) |
| 10 to 14 Year Olds | 163 (79.1%) | 43 (20.9%) |
| 15 to 17 Year Olds | 52 (92.9%) | 4 (7.1%) |
| 18 to 19 Year Olds | 23 (60.5%) | 15 (39.5%) |
| 20 to 24 Year Olds | 38 (82.6%) | 8 (17.4%) |
| 25 to 34 Year Olds | 41 (83.7%) | 8 (16.3%) |
| 35 Years and over | 55 (100.0%) | 0 (0.0%) |
| Total | 470 (75.4%) | 153 (24.6%) |
Educational Attainment by Field of Study in Pantego
Education (174 | 19.8%), business (133 | 15.2%), arts & humanities (100 | 11.4%), science & technology (86 | 9.8%), and engineering (78 | 8.9%) are the most common fields of study among 877 individuals in Pantego who have obtained a bachelor's degree or higher.
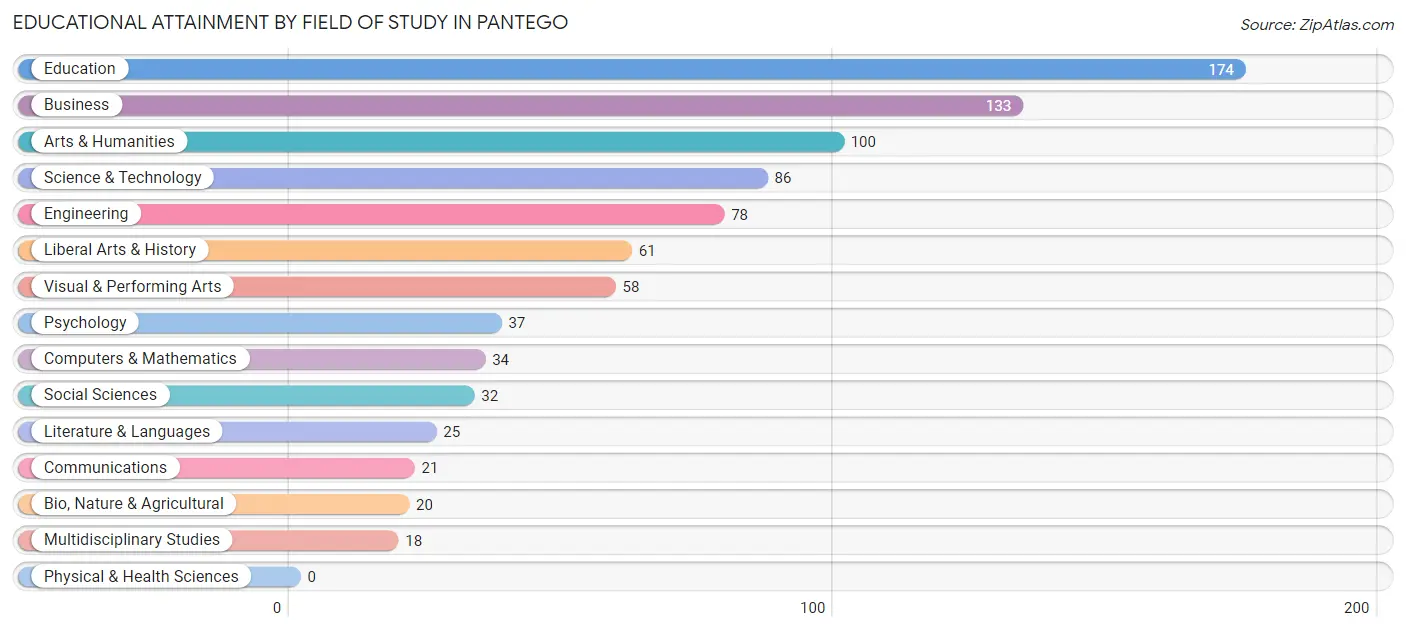
| Field of Study | # Graduates | % Graduates |
| Computers & Mathematics | 34 | 3.9% |
| Bio, Nature & Agricultural | 20 | 2.3% |
| Physical & Health Sciences | 0 | 0.0% |
| Psychology | 37 | 4.2% |
| Social Sciences | 32 | 3.6% |
| Engineering | 78 | 8.9% |
| Multidisciplinary Studies | 18 | 2.1% |
| Science & Technology | 86 | 9.8% |
| Business | 133 | 15.2% |
| Education | 174 | 19.8% |
| Literature & Languages | 25 | 2.9% |
| Liberal Arts & History | 61 | 7.0% |
| Visual & Performing Arts | 58 | 6.6% |
| Communications | 21 | 2.4% |
| Arts & Humanities | 100 | 11.4% |
| Total | 877 | 100.0% |
Transportation & Commute in Pantego
Vehicle Availability by Sex in Pantego
The most prevalent vehicle ownership categories in Pantego are males with 2 vehicles (346, accounting for 55.4%) and females with 2 vehicles (175, making up 69.1%).
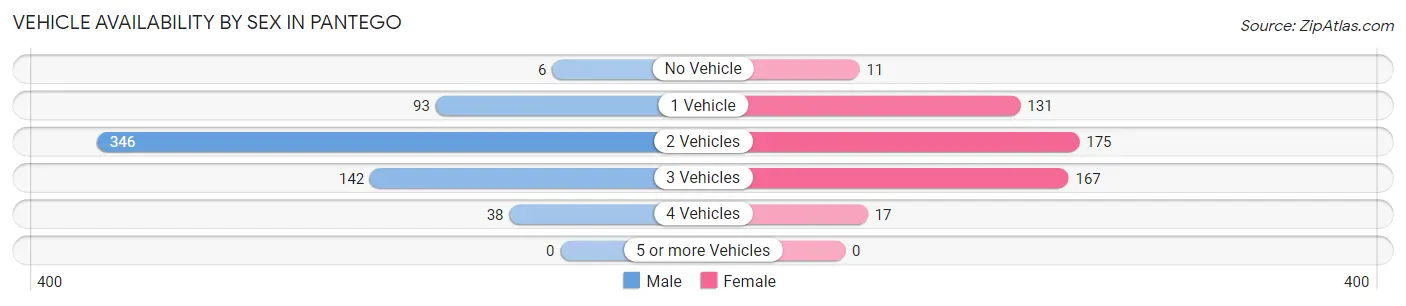
| Vehicles Available | Male | Female |
| No Vehicle | 6 (1.0%) | 11 (2.2%) |
| 1 Vehicle | 93 (14.9%) | 131 (26.2%) |
| 2 Vehicles | 346 (55.4%) | 175 (34.9%) |
| 3 Vehicles | 142 (22.7%) | 167 (33.3%) |
| 4 Vehicles | 38 (6.1%) | 17 (3.4%) |
| 5 or more Vehicles | 0 (0.0%) | 0 (0.0%) |
| Total | 625 (100.0%) | 501 (100.0%) |
Commute Time in Pantego
The most frequently occuring commute durations in Pantego are 15 to 19 minutes (225 commuters, 22.0%), 30 to 34 minutes (165 commuters, 16.1%), and 5 to 9 minutes (140 commuters, 13.7%).
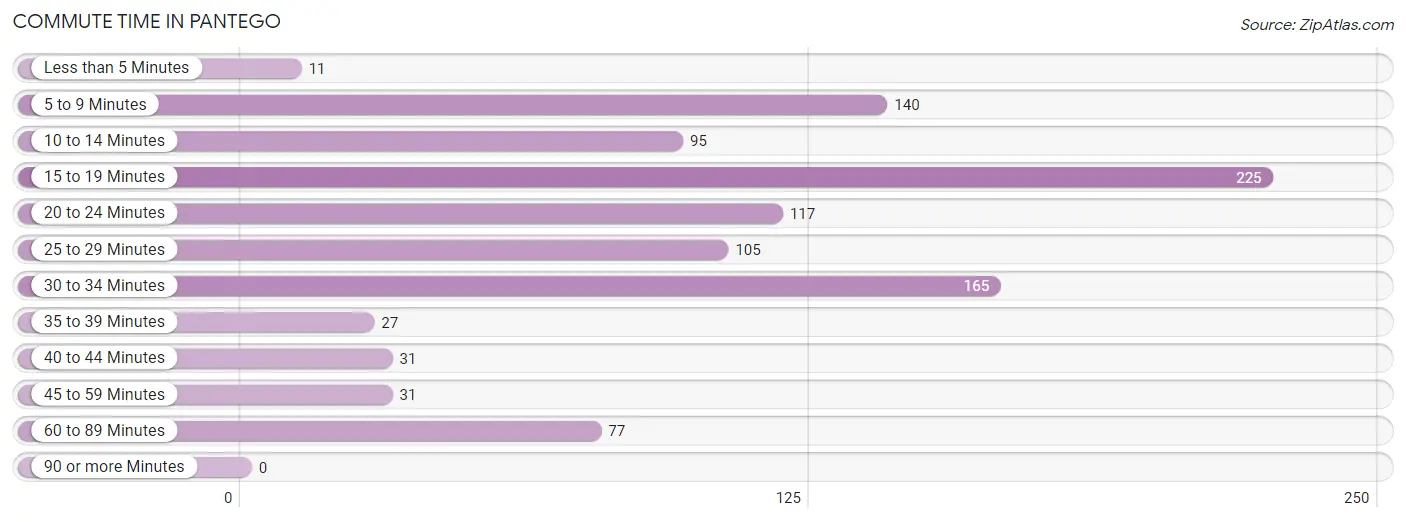
| Commute Time | # Commuters | % Commuters |
| Less than 5 Minutes | 11 | 1.1% |
| 5 to 9 Minutes | 140 | 13.7% |
| 10 to 14 Minutes | 95 | 9.3% |
| 15 to 19 Minutes | 225 | 22.0% |
| 20 to 24 Minutes | 117 | 11.4% |
| 25 to 29 Minutes | 105 | 10.2% |
| 30 to 34 Minutes | 165 | 16.1% |
| 35 to 39 Minutes | 27 | 2.6% |
| 40 to 44 Minutes | 31 | 3.0% |
| 45 to 59 Minutes | 31 | 3.0% |
| 60 to 89 Minutes | 77 | 7.5% |
| 90 or more Minutes | 0 | 0.0% |
Commute Time by Sex in Pantego
The most common commute times in Pantego are 15 to 19 minutes (136 commuters, 24.2%) for males and 30 to 34 minutes (95 commuters, 20.6%) for females.
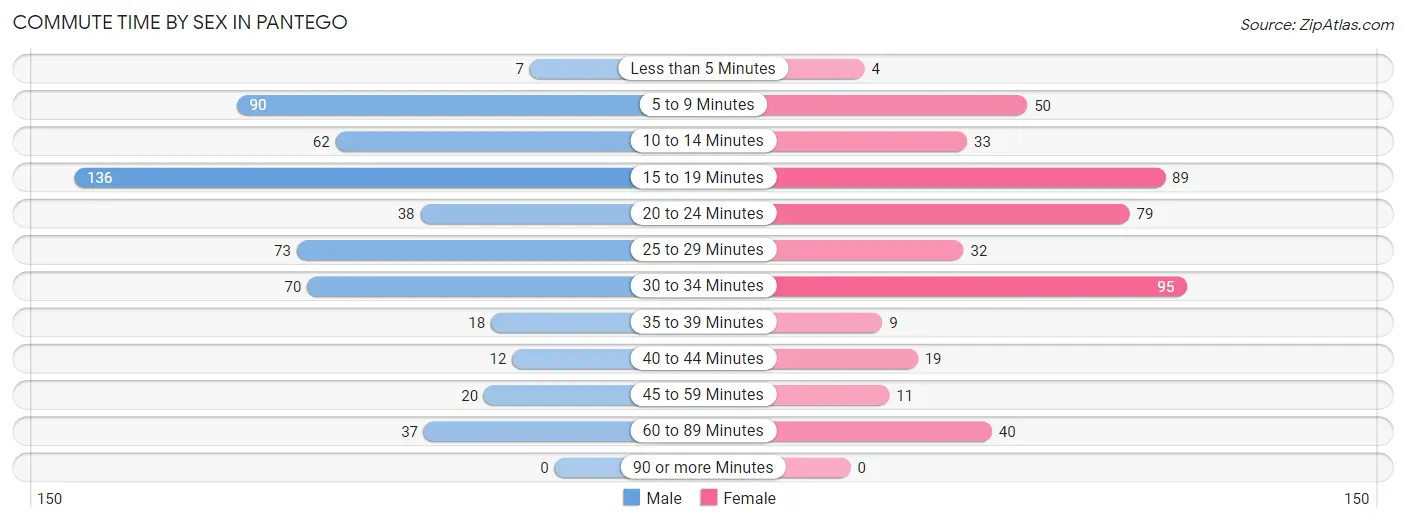
| Commute Time | Male | Female |
| Less than 5 Minutes | 7 (1.2%) | 4 (0.9%) |
| 5 to 9 Minutes | 90 (16.0%) | 50 (10.8%) |
| 10 to 14 Minutes | 62 (11.0%) | 33 (7.2%) |
| 15 to 19 Minutes | 136 (24.2%) | 89 (19.3%) |
| 20 to 24 Minutes | 38 (6.8%) | 79 (17.1%) |
| 25 to 29 Minutes | 73 (13.0%) | 32 (6.9%) |
| 30 to 34 Minutes | 70 (12.4%) | 95 (20.6%) |
| 35 to 39 Minutes | 18 (3.2%) | 9 (1.9%) |
| 40 to 44 Minutes | 12 (2.1%) | 19 (4.1%) |
| 45 to 59 Minutes | 20 (3.5%) | 11 (2.4%) |
| 60 to 89 Minutes | 37 (6.6%) | 40 (8.7%) |
| 90 or more Minutes | 0 (0.0%) | 0 (0.0%) |
Time of Departure to Work by Sex in Pantego
The most frequent times of departure to work in Pantego are 7:00 AM to 7:29 AM (143, 25.4%) for males and 7:30 AM to 7:59 AM (108, 23.4%) for females.
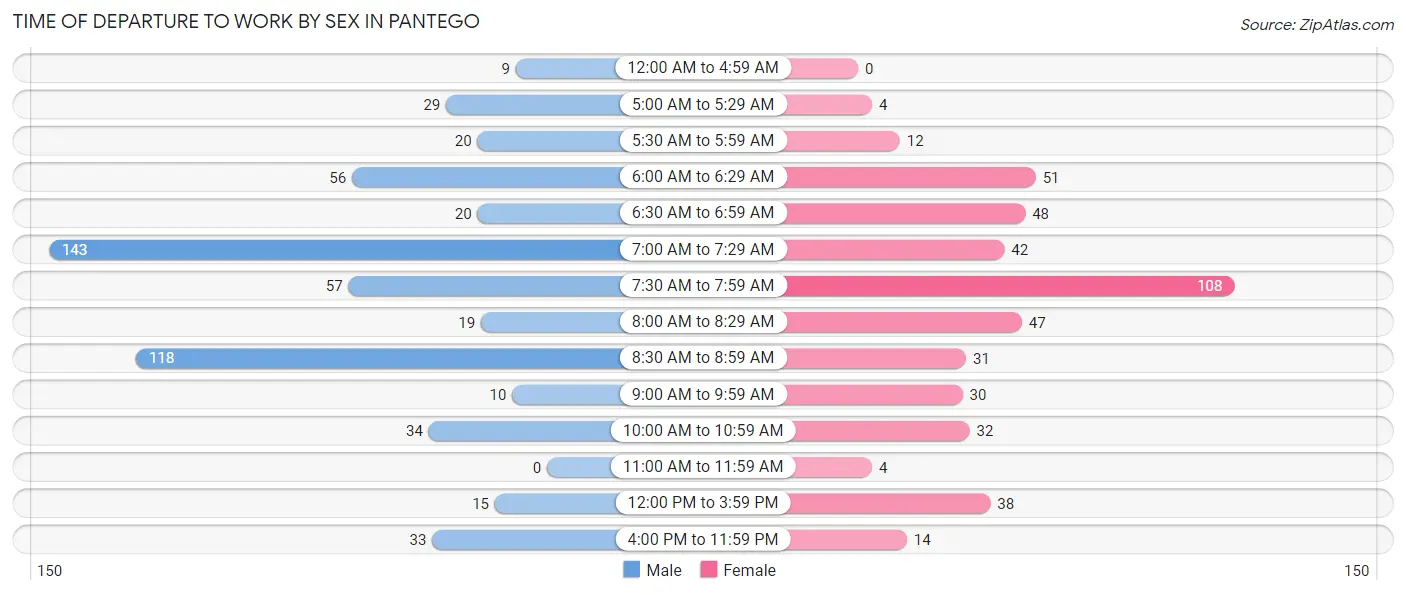
| Time of Departure | Male | Female |
| 12:00 AM to 4:59 AM | 9 (1.6%) | 0 (0.0%) |
| 5:00 AM to 5:29 AM | 29 (5.1%) | 4 (0.9%) |
| 5:30 AM to 5:59 AM | 20 (3.5%) | 12 (2.6%) |
| 6:00 AM to 6:29 AM | 56 (10.0%) | 51 (11.1%) |
| 6:30 AM to 6:59 AM | 20 (3.5%) | 48 (10.4%) |
| 7:00 AM to 7:29 AM | 143 (25.4%) | 42 (9.1%) |
| 7:30 AM to 7:59 AM | 57 (10.1%) | 108 (23.4%) |
| 8:00 AM to 8:29 AM | 19 (3.4%) | 47 (10.2%) |
| 8:30 AM to 8:59 AM | 118 (21.0%) | 31 (6.7%) |
| 9:00 AM to 9:59 AM | 10 (1.8%) | 30 (6.5%) |
| 10:00 AM to 10:59 AM | 34 (6.0%) | 32 (6.9%) |
| 11:00 AM to 11:59 AM | 0 (0.0%) | 4 (0.9%) |
| 12:00 PM to 3:59 PM | 15 (2.7%) | 38 (8.2%) |
| 4:00 PM to 11:59 PM | 33 (5.9%) | 14 (3.0%) |
| Total | 563 (100.0%) | 461 (100.0%) |
Housing Occupancy in Pantego
Occupancy by Ownership in Pantego
Of the total 1,143 dwellings in Pantego, owner-occupied units account for 737 (64.5%), while renter-occupied units make up 406 (35.5%).
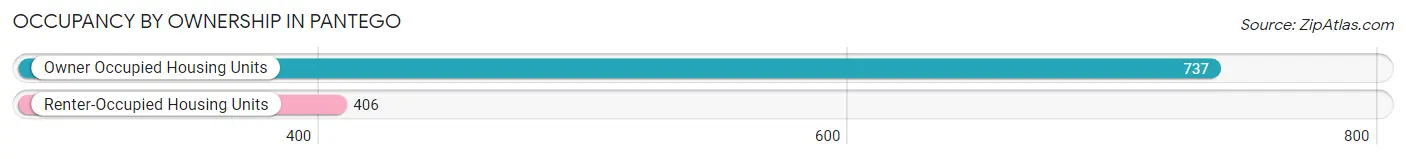
| Occupancy | # Housing Units | % Housing Units |
| Owner Occupied Housing Units | 737 | 64.5% |
| Renter-Occupied Housing Units | 406 | 35.5% |
| Total Occupied Housing Units | 1,143 | 100.0% |
Occupancy by Household Size in Pantego
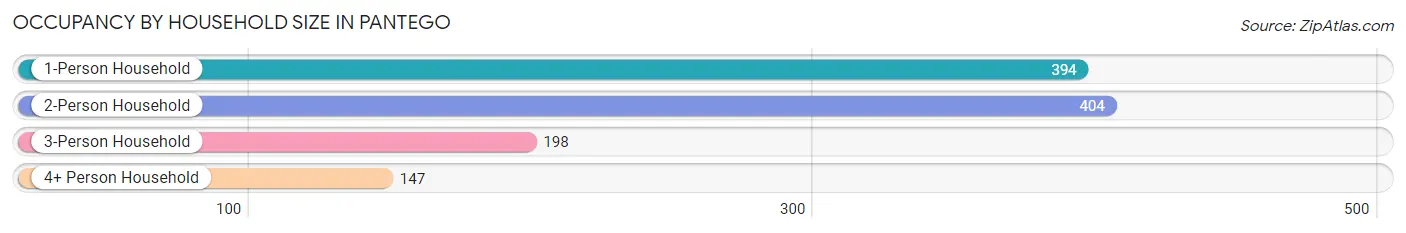
| Household Size | # Housing Units | % Housing Units |
| 1-Person Household | 394 | 34.5% |
| 2-Person Household | 404 | 35.3% |
| 3-Person Household | 198 | 17.3% |
| 4+ Person Household | 147 | 12.9% |
| Total Housing Units | 1,143 | 100.0% |
Occupancy by Ownership by Household Size in Pantego
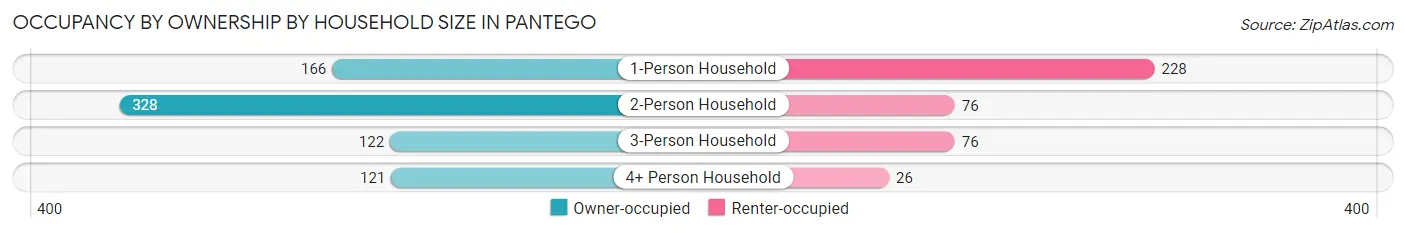
| Household Size | Owner-occupied | Renter-occupied |
| 1-Person Household | 166 (42.1%) | 228 (57.9%) |
| 2-Person Household | 328 (81.2%) | 76 (18.8%) |
| 3-Person Household | 122 (61.6%) | 76 (38.4%) |
| 4+ Person Household | 121 (82.3%) | 26 (17.7%) |
| Total Housing Units | 737 (64.5%) | 406 (35.5%) |
Occupancy by Educational Attainment in Pantego
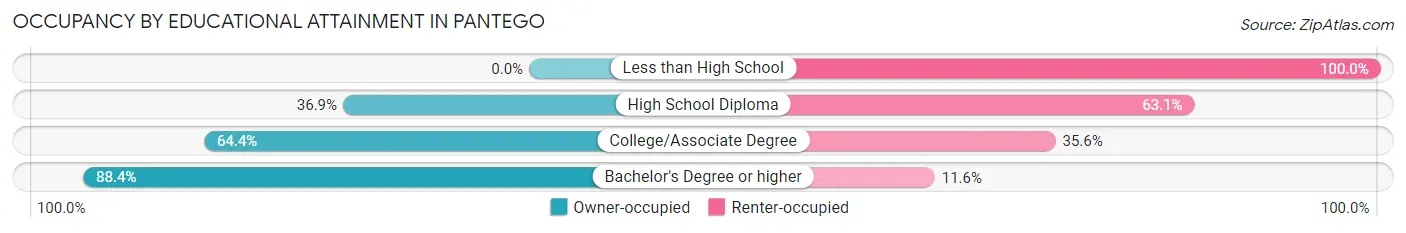
| Household Size | Owner-occupied | Renter-occupied |
| Less than High School | 0 (0.0%) | 77 (100.0%) |
| High School Diploma | 93 (36.9%) | 159 (63.1%) |
| College/Associate Degree | 203 (64.4%) | 112 (35.6%) |
| Bachelor's Degree or higher | 441 (88.4%) | 58 (11.6%) |
Occupancy by Age of Householder in Pantego
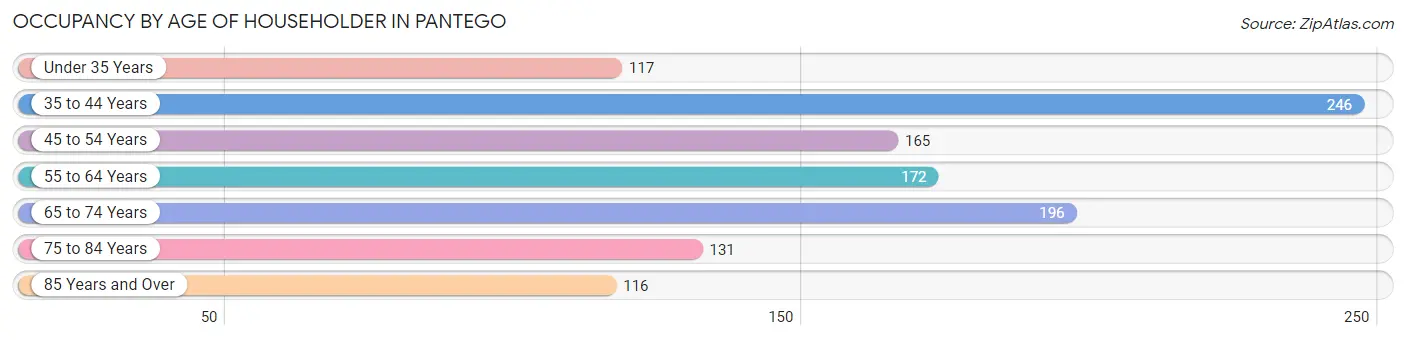
| Age Bracket | # Households | % Households |
| Under 35 Years | 117 | 10.2% |
| 35 to 44 Years | 246 | 21.5% |
| 45 to 54 Years | 165 | 14.4% |
| 55 to 64 Years | 172 | 15.0% |
| 65 to 74 Years | 196 | 17.2% |
| 75 to 84 Years | 131 | 11.5% |
| 85 Years and Over | 116 | 10.2% |
| Total | 1,143 | 100.0% |
Housing Finances in Pantego
Median Income by Occupancy in Pantego
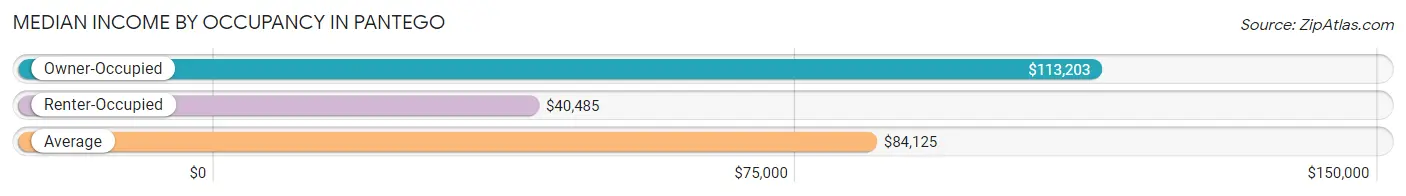
| Occupancy Type | # Households | Median Income |
| Owner-Occupied | 737 (64.5%) | $113,203 |
| Renter-Occupied | 406 (35.5%) | $40,485 |
| Average | 1,143 (100.0%) | $84,125 |
Occupancy by Householder Income Bracket in Pantego
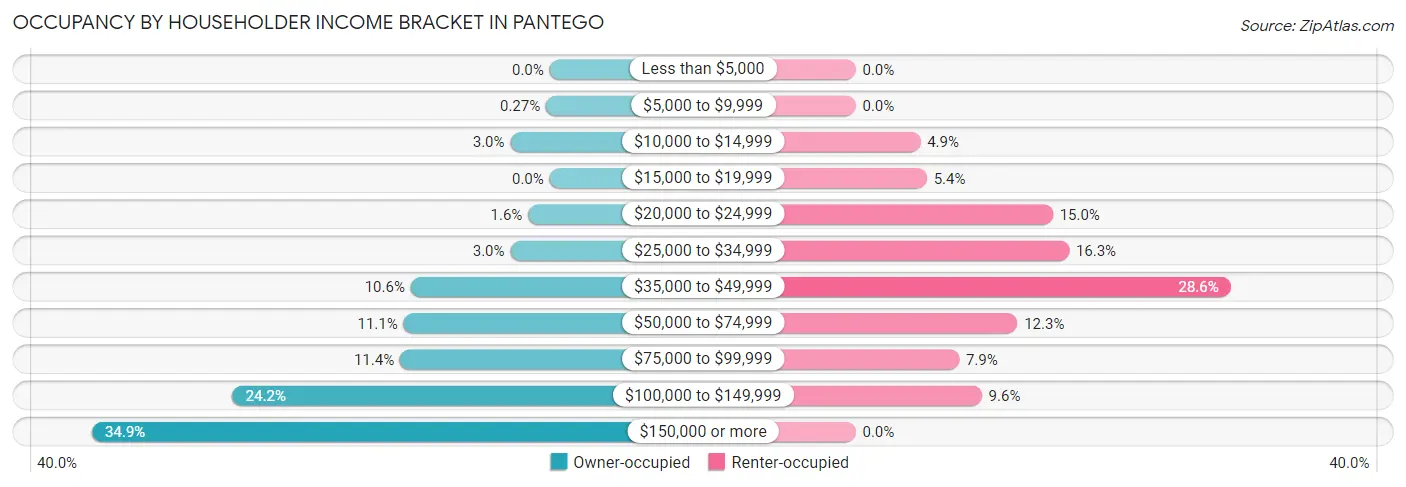
| Income Bracket | Owner-occupied | Renter-occupied |
| Less than $5,000 | 0 (0.0%) | 0 (0.0%) |
| $5,000 to $9,999 | 2 (0.3%) | 0 (0.0%) |
| $10,000 to $14,999 | 22 (3.0%) | 20 (4.9%) |
| $15,000 to $19,999 | 0 (0.0%) | 22 (5.4%) |
| $20,000 to $24,999 | 12 (1.6%) | 61 (15.0%) |
| $25,000 to $34,999 | 22 (3.0%) | 66 (16.3%) |
| $35,000 to $49,999 | 78 (10.6%) | 116 (28.6%) |
| $50,000 to $74,999 | 82 (11.1%) | 50 (12.3%) |
| $75,000 to $99,999 | 84 (11.4%) | 32 (7.9%) |
| $100,000 to $149,999 | 178 (24.1%) | 39 (9.6%) |
| $150,000 or more | 257 (34.9%) | 0 (0.0%) |
| Total | 737 (100.0%) | 406 (100.0%) |
Monthly Housing Cost Tiers in Pantego
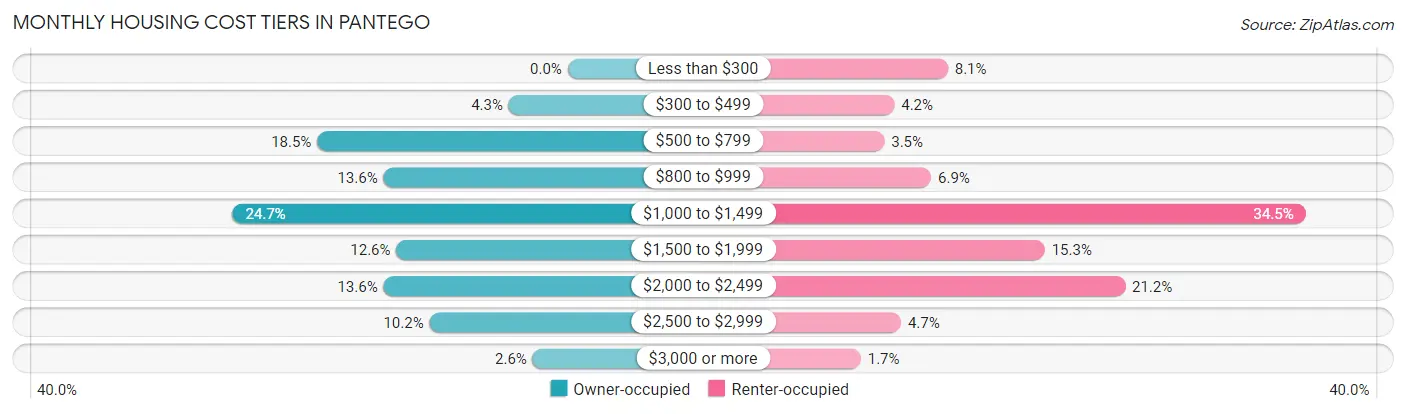
| Monthly Cost | Owner-occupied | Renter-occupied |
| Less than $300 | 0 (0.0%) | 33 (8.1%) |
| $300 to $499 | 32 (4.3%) | 17 (4.2%) |
| $500 to $799 | 136 (18.4%) | 14 (3.5%) |
| $800 to $999 | 100 (13.6%) | 28 (6.9%) |
| $1,000 to $1,499 | 182 (24.7%) | 140 (34.5%) |
| $1,500 to $1,999 | 93 (12.6%) | 62 (15.3%) |
| $2,000 to $2,499 | 100 (13.6%) | 86 (21.2%) |
| $2,500 to $2,999 | 75 (10.2%) | 19 (4.7%) |
| $3,000 or more | 19 (2.6%) | 7 (1.7%) |
| Total | 737 (100.0%) | 406 (100.0%) |
Physical Housing Characteristics in Pantego
Housing Structures in Pantego
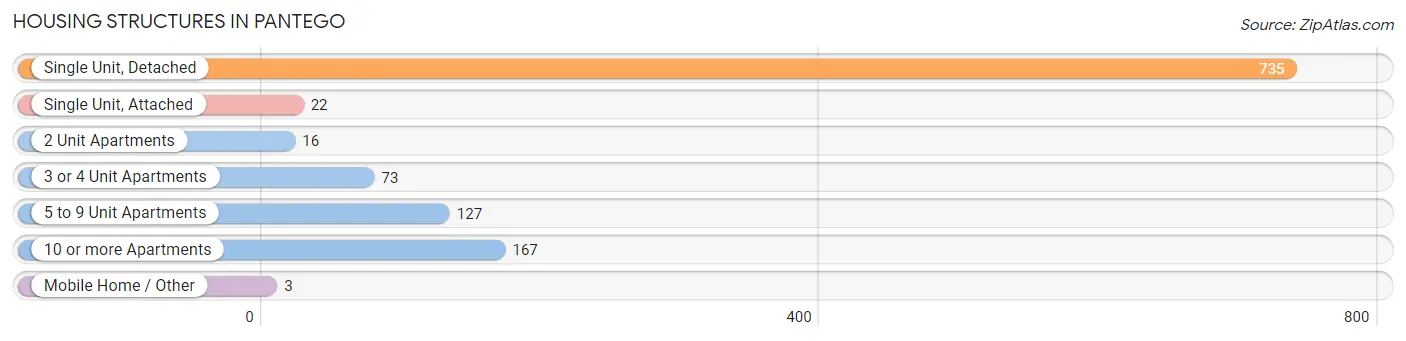
| Structure Type | # Housing Units | % Housing Units |
| Single Unit, Detached | 735 | 64.3% |
| Single Unit, Attached | 22 | 1.9% |
| 2 Unit Apartments | 16 | 1.4% |
| 3 or 4 Unit Apartments | 73 | 6.4% |
| 5 to 9 Unit Apartments | 127 | 11.1% |
| 10 or more Apartments | 167 | 14.6% |
| Mobile Home / Other | 3 | 0.3% |
| Total | 1,143 | 100.0% |
Housing Structures by Occupancy in Pantego
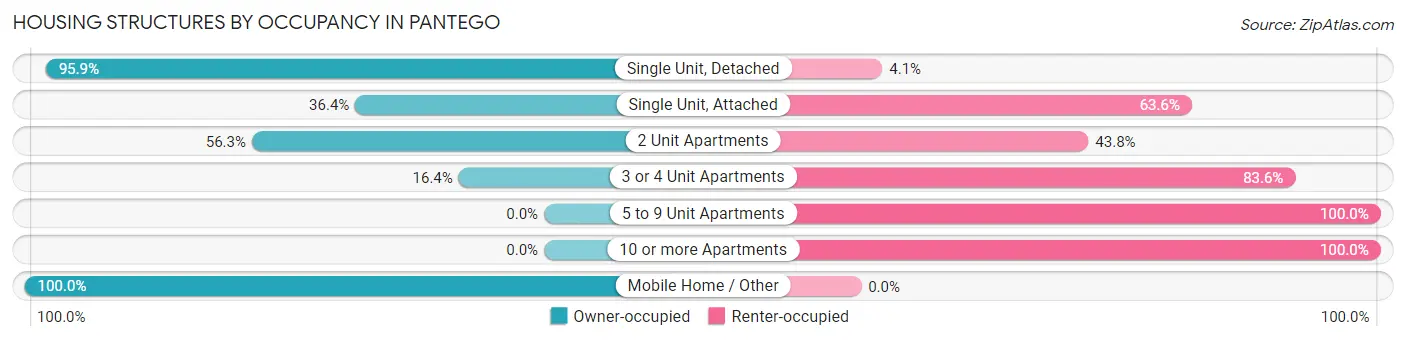
| Structure Type | Owner-occupied | Renter-occupied |
| Single Unit, Detached | 705 (95.9%) | 30 (4.1%) |
| Single Unit, Attached | 8 (36.4%) | 14 (63.6%) |
| 2 Unit Apartments | 9 (56.2%) | 7 (43.8%) |
| 3 or 4 Unit Apartments | 12 (16.4%) | 61 (83.6%) |
| 5 to 9 Unit Apartments | 0 (0.0%) | 127 (100.0%) |
| 10 or more Apartments | 0 (0.0%) | 167 (100.0%) |
| Mobile Home / Other | 3 (100.0%) | 0 (0.0%) |
| Total | 737 (64.5%) | 406 (35.5%) |
Housing Structures by Number of Rooms in Pantego
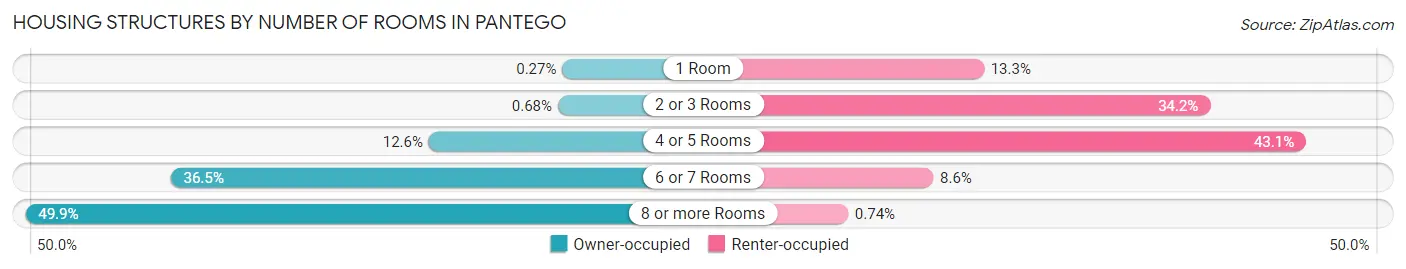
| Number of Rooms | Owner-occupied | Renter-occupied |
| 1 Room | 2 (0.3%) | 54 (13.3%) |
| 2 or 3 Rooms | 5 (0.7%) | 139 (34.2%) |
| 4 or 5 Rooms | 93 (12.6%) | 175 (43.1%) |
| 6 or 7 Rooms | 269 (36.5%) | 35 (8.6%) |
| 8 or more Rooms | 368 (49.9%) | 3 (0.7%) |
| Total | 737 (100.0%) | 406 (100.0%) |
Housing Structure by Heating Type in Pantego
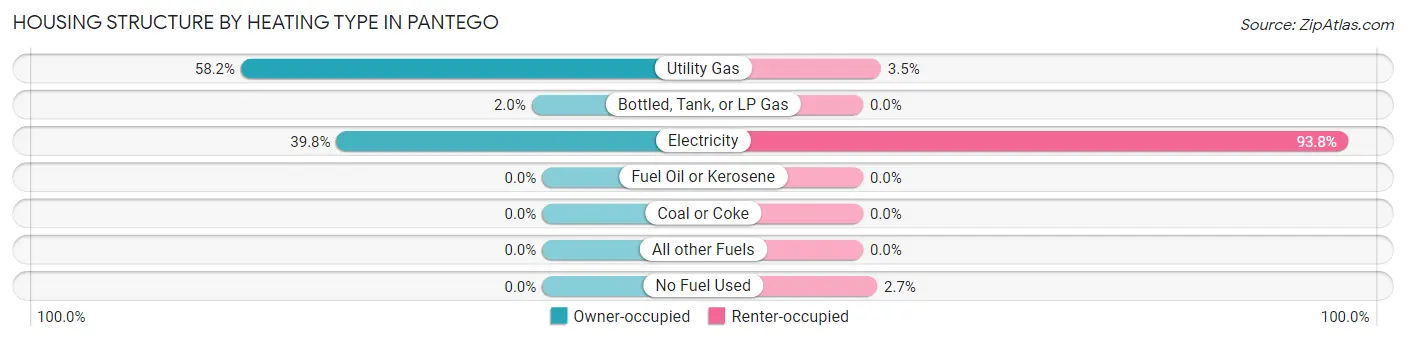
| Heating Type | Owner-occupied | Renter-occupied |
| Utility Gas | 429 (58.2%) | 14 (3.5%) |
| Bottled, Tank, or LP Gas | 15 (2.0%) | 0 (0.0%) |
| Electricity | 293 (39.8%) | 381 (93.8%) |
| Fuel Oil or Kerosene | 0 (0.0%) | 0 (0.0%) |
| Coal or Coke | 0 (0.0%) | 0 (0.0%) |
| All other Fuels | 0 (0.0%) | 0 (0.0%) |
| No Fuel Used | 0 (0.0%) | 11 (2.7%) |
| Total | 737 (100.0%) | 406 (100.0%) |
Household Vehicle Usage in Pantego
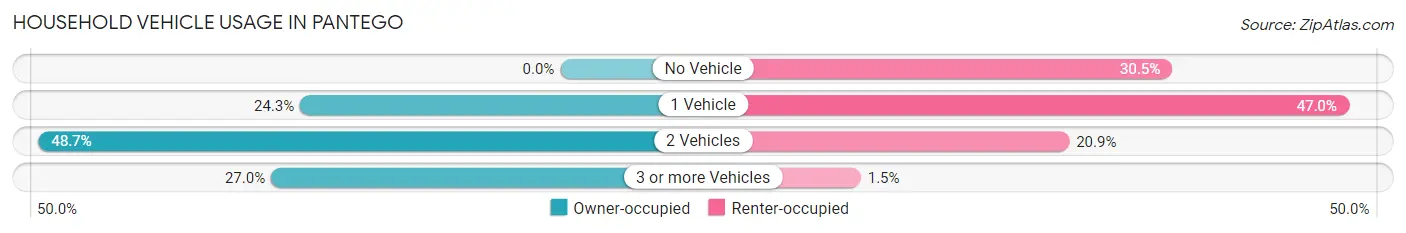
| Vehicles per Household | Owner-occupied | Renter-occupied |
| No Vehicle | 0 (0.0%) | 124 (30.5%) |
| 1 Vehicle | 179 (24.3%) | 191 (47.0%) |
| 2 Vehicles | 359 (48.7%) | 85 (20.9%) |
| 3 or more Vehicles | 199 (27.0%) | 6 (1.5%) |
| Total | 737 (100.0%) | 406 (100.0%) |
Real Estate & Mortgages in Pantego
Real Estate and Mortgage Overview in Pantego
| Characteristic | Without Mortgage | With Mortgage |
| Housing Units | 363 | 374 |
| Median Property Value | $320,200 | $320,600 |
| Median Household Income | $89,250 | $140 |
| Monthly Housing Costs | $830 | $19 |
| Real Estate Taxes | $3,734 | $0 |
Property Value by Mortgage Status in Pantego
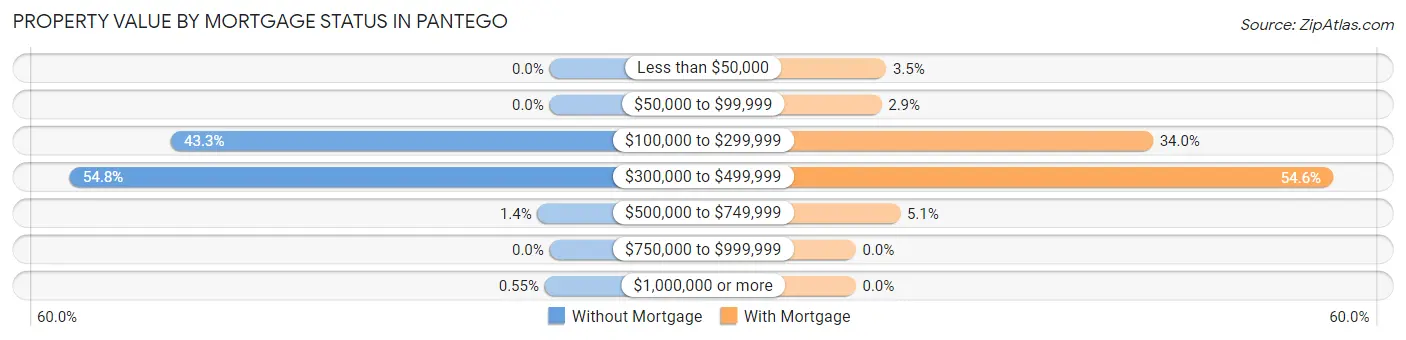
| Property Value | Without Mortgage | With Mortgage |
| Less than $50,000 | 0 (0.0%) | 13 (3.5%) |
| $50,000 to $99,999 | 0 (0.0%) | 11 (2.9%) |
| $100,000 to $299,999 | 157 (43.2%) | 127 (34.0%) |
| $300,000 to $499,999 | 199 (54.8%) | 204 (54.5%) |
| $500,000 to $749,999 | 5 (1.4%) | 19 (5.1%) |
| $750,000 to $999,999 | 0 (0.0%) | 0 (0.0%) |
| $1,000,000 or more | 2 (0.5%) | 0 (0.0%) |
| Total | 363 (100.0%) | 374 (100.0%) |
Household Income by Mortgage Status in Pantego
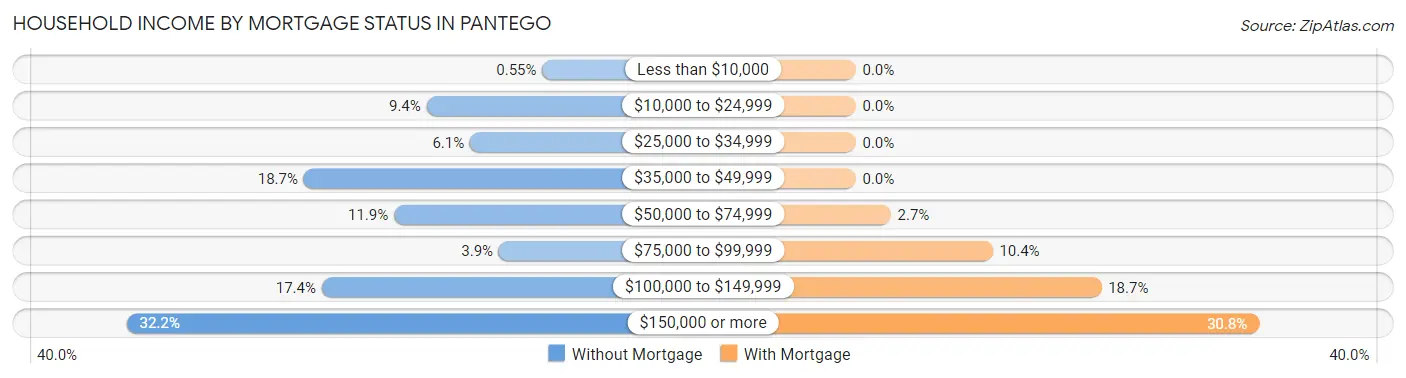
| Household Income | Without Mortgage | With Mortgage |
| Less than $10,000 | 2 (0.5%) | 0 (0.0%) |
| $10,000 to $24,999 | 34 (9.4%) | 0 (0.0%) |
| $25,000 to $34,999 | 22 (6.1%) | 0 (0.0%) |
| $35,000 to $49,999 | 68 (18.7%) | 0 (0.0%) |
| $50,000 to $74,999 | 43 (11.8%) | 10 (2.7%) |
| $75,000 to $99,999 | 14 (3.9%) | 39 (10.4%) |
| $100,000 to $149,999 | 63 (17.4%) | 70 (18.7%) |
| $150,000 or more | 117 (32.2%) | 115 (30.7%) |
| Total | 363 (100.0%) | 374 (100.0%) |
Property Value to Household Income Ratio in Pantego
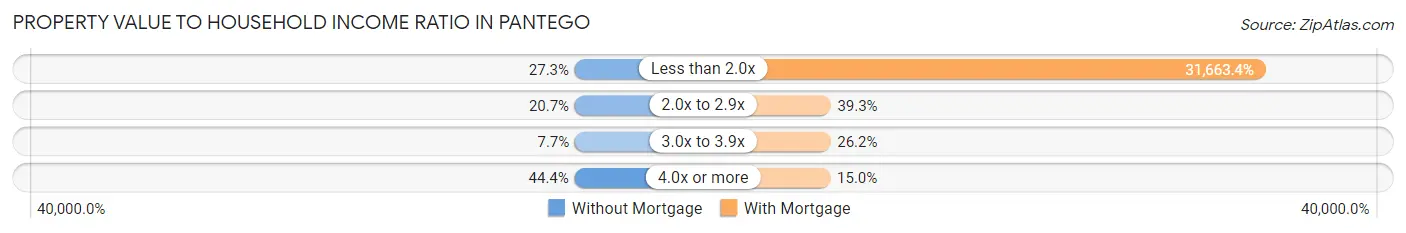
| Value-to-Income Ratio | Without Mortgage | With Mortgage |
| Less than 2.0x | 99 (27.3%) | 118,421 (31,663.4%) |
| 2.0x to 2.9x | 75 (20.7%) | 147 (39.3%) |
| 3.0x to 3.9x | 28 (7.7%) | 98 (26.2%) |
| 4.0x or more | 161 (44.4%) | 56 (15.0%) |
| Total | 363 (100.0%) | 374 (100.0%) |
Real Estate Taxes by Mortgage Status in Pantego
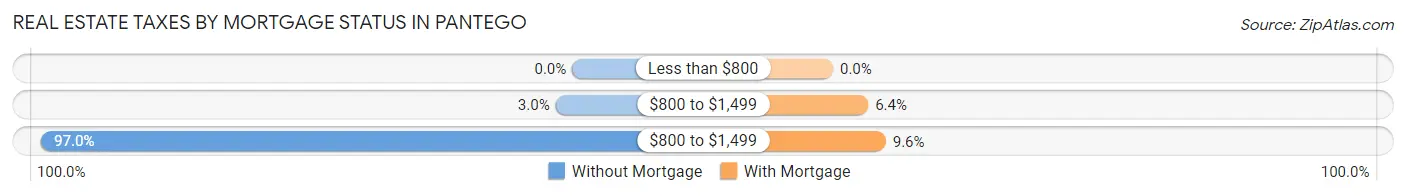
| Property Taxes | Without Mortgage | With Mortgage |
| Less than $800 | 0 (0.0%) | 0 (0.0%) |
| $800 to $1,499 | 11 (3.0%) | 24 (6.4%) |
| $800 to $1,499 | 352 (97.0%) | 36 (9.6%) |
| Total | 363 (100.0%) | 374 (100.0%) |
Health & Disability in Pantego
Health Insurance Coverage by Age in Pantego
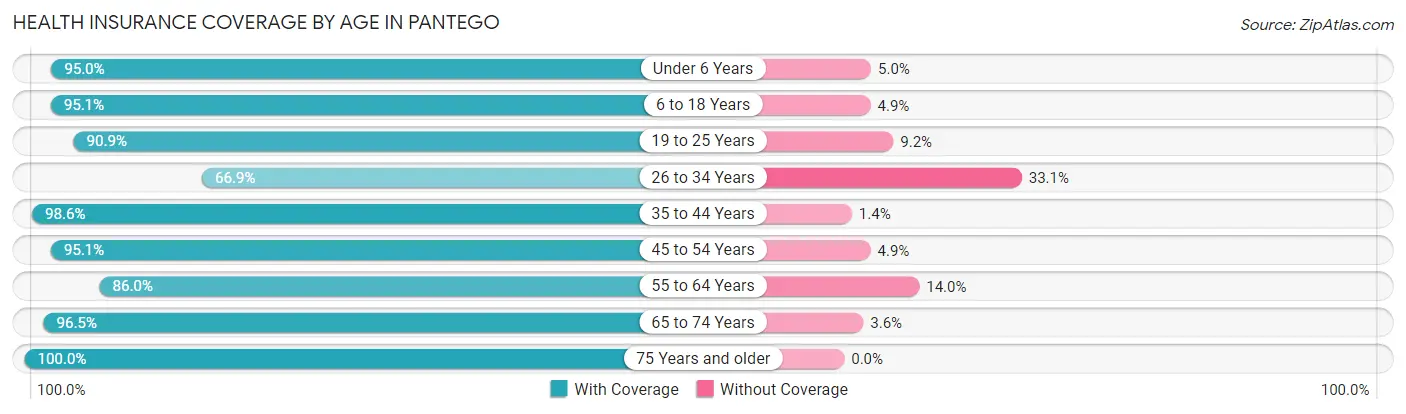
| Age Bracket | With Coverage | Without Coverage |
| Under 6 Years | 95 (95.0%) | 5 (5.0%) |
| 6 to 18 Years | 388 (95.1%) | 20 (4.9%) |
| 19 to 25 Years | 129 (90.8%) | 13 (9.1%) |
| 26 to 34 Years | 190 (66.9%) | 94 (33.1%) |
| 35 to 44 Years | 348 (98.6%) | 5 (1.4%) |
| 45 to 54 Years | 272 (95.1%) | 14 (4.9%) |
| 55 to 64 Years | 246 (86.0%) | 40 (14.0%) |
| 65 to 74 Years | 272 (96.5%) | 10 (3.5%) |
| 75 Years and older | 357 (100.0%) | 0 (0.0%) |
| Total | 2,297 (91.9%) | 201 (8.1%) |
Health Insurance Coverage by Citizenship Status in Pantego
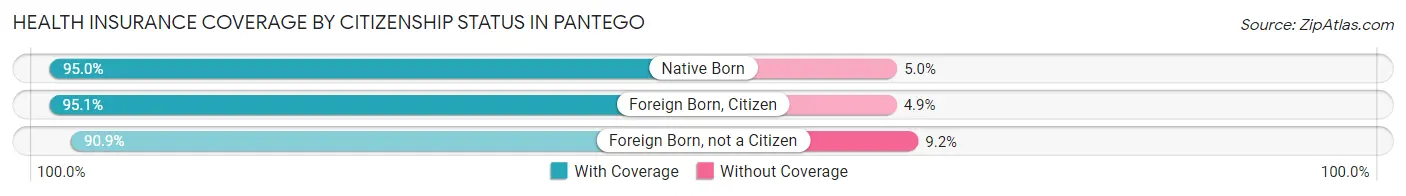
| Citizenship Status | With Coverage | Without Coverage |
| Native Born | 95 (95.0%) | 5 (5.0%) |
| Foreign Born, Citizen | 388 (95.1%) | 20 (4.9%) |
| Foreign Born, not a Citizen | 129 (90.8%) | 13 (9.1%) |
Health Insurance Coverage by Household Income in Pantego
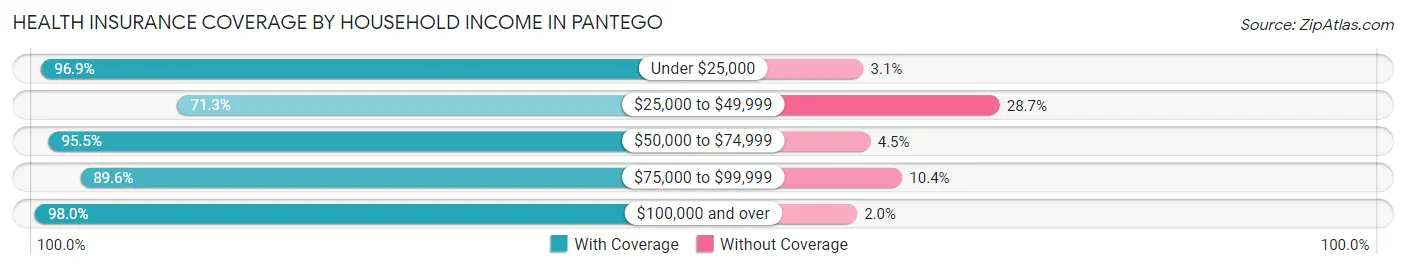
| Household Income | With Coverage | Without Coverage |
| Under $25,000 | 154 (96.9%) | 5 (3.1%) |
| $25,000 to $49,999 | 311 (71.3%) | 125 (28.7%) |
| $50,000 to $74,999 | 255 (95.5%) | 12 (4.5%) |
| $75,000 to $99,999 | 275 (89.6%) | 32 (10.4%) |
| $100,000 and over | 1,300 (98.0%) | 26 (2.0%) |
Public vs Private Health Insurance Coverage by Age in Pantego
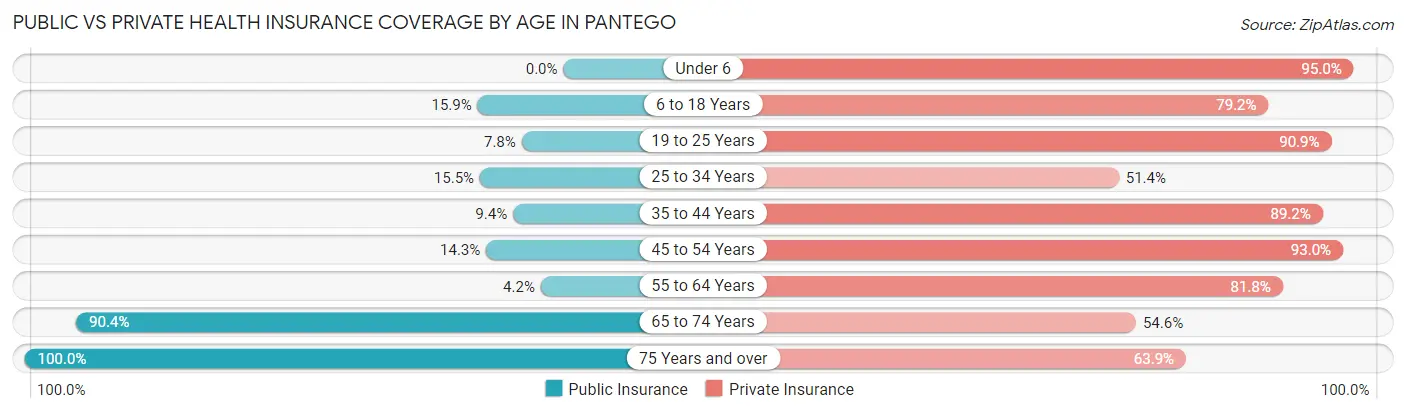
| Age Bracket | Public Insurance | Private Insurance |
| Under 6 | 0 (0.0%) | 95 (95.0%) |
| 6 to 18 Years | 65 (15.9%) | 323 (79.2%) |
| 19 to 25 Years | 11 (7.7%) | 129 (90.8%) |
| 25 to 34 Years | 44 (15.5%) | 146 (51.4%) |
| 35 to 44 Years | 33 (9.3%) | 315 (89.2%) |
| 45 to 54 Years | 41 (14.3%) | 266 (93.0%) |
| 55 to 64 Years | 12 (4.2%) | 234 (81.8%) |
| 65 to 74 Years | 255 (90.4%) | 154 (54.6%) |
| 75 Years and over | 357 (100.0%) | 228 (63.9%) |
| Total | 818 (32.8%) | 1,890 (75.7%) |
Disability Status by Sex by Age in Pantego
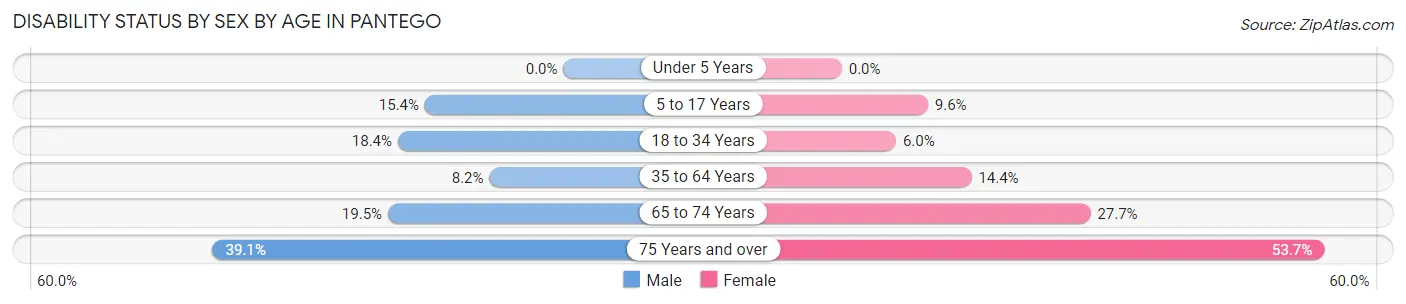
| Age Bracket | Male | Female |
| Under 5 Years | 0 (0.0%) | 0 (0.0%) |
| 5 to 17 Years | 37 (15.4%) | 16 (9.6%) |
| 18 to 34 Years | 47 (18.4%) | 12 (6.0%) |
| 35 to 64 Years | 38 (8.2%) | 67 (14.4%) |
| 65 to 74 Years | 17 (19.5%) | 54 (27.7%) |
| 75 Years and over | 50 (39.1%) | 123 (53.7%) |
Disability Class by Sex by Age in Pantego
Disability Class: Hearing Difficulty
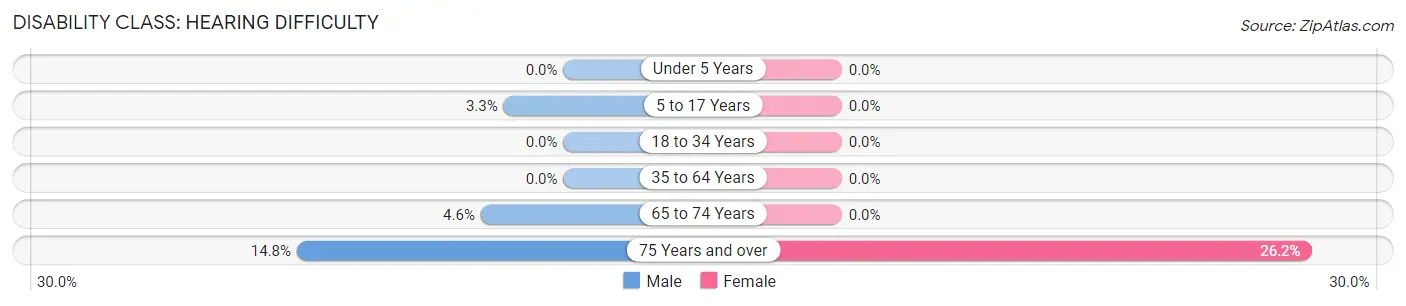
| Age Bracket | Male | Female |
| Under 5 Years | 0 (0.0%) | 0 (0.0%) |
| 5 to 17 Years | 8 (3.3%) | 0 (0.0%) |
| 18 to 34 Years | 0 (0.0%) | 0 (0.0%) |
| 35 to 64 Years | 0 (0.0%) | 0 (0.0%) |
| 65 to 74 Years | 4 (4.6%) | 0 (0.0%) |
| 75 Years and over | 19 (14.8%) | 60 (26.2%) |
Disability Class: Vision Difficulty
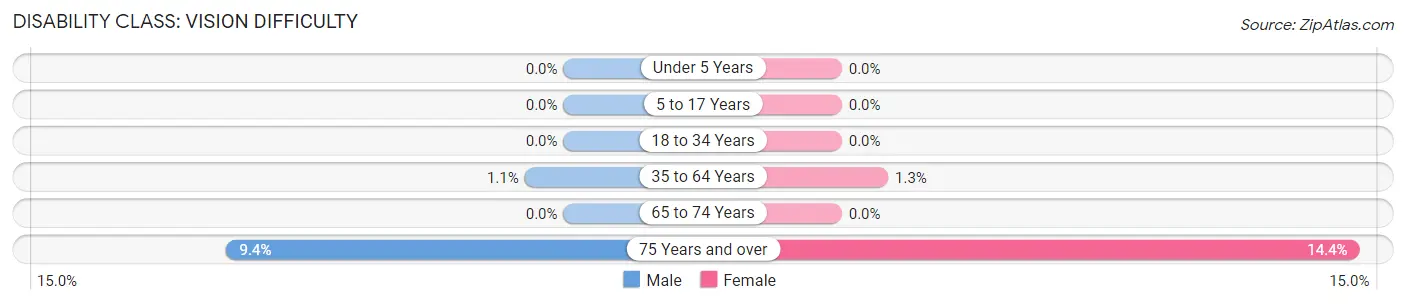
| Age Bracket | Male | Female |
| Under 5 Years | 0 (0.0%) | 0 (0.0%) |
| 5 to 17 Years | 0 (0.0%) | 0 (0.0%) |
| 18 to 34 Years | 0 (0.0%) | 0 (0.0%) |
| 35 to 64 Years | 5 (1.1%) | 6 (1.3%) |
| 65 to 74 Years | 0 (0.0%) | 0 (0.0%) |
| 75 Years and over | 12 (9.4%) | 33 (14.4%) |
Disability Class: Cognitive Difficulty
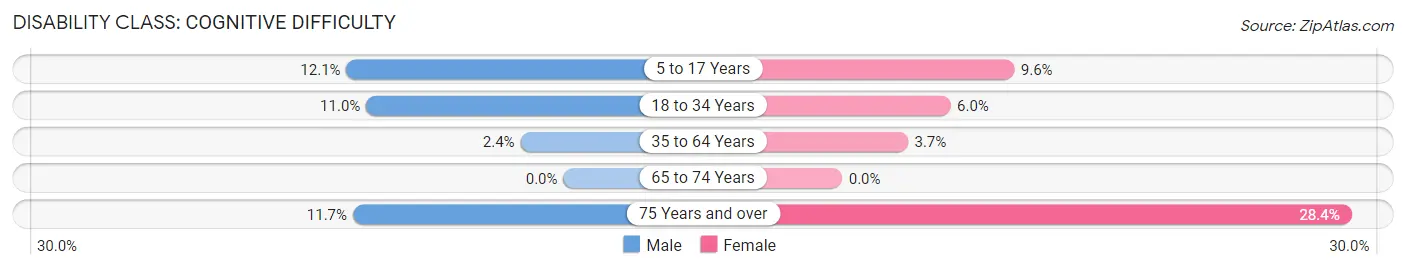
| Age Bracket | Male | Female |
| 5 to 17 Years | 29 (12.1%) | 16 (9.6%) |
| 18 to 34 Years | 28 (11.0%) | 12 (6.0%) |
| 35 to 64 Years | 11 (2.4%) | 17 (3.7%) |
| 65 to 74 Years | 0 (0.0%) | 0 (0.0%) |
| 75 Years and over | 15 (11.7%) | 65 (28.4%) |
Disability Class: Ambulatory Difficulty
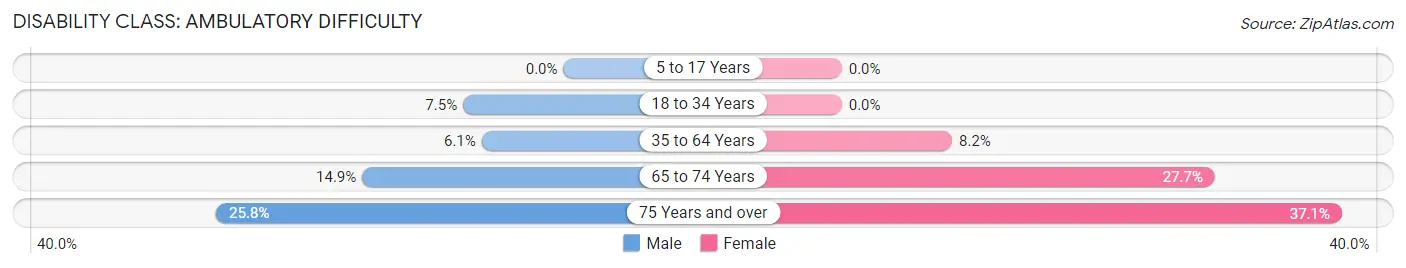
| Age Bracket | Male | Female |
| 5 to 17 Years | 0 (0.0%) | 0 (0.0%) |
| 18 to 34 Years | 19 (7.4%) | 0 (0.0%) |
| 35 to 64 Years | 28 (6.1%) | 38 (8.2%) |
| 65 to 74 Years | 13 (14.9%) | 54 (27.7%) |
| 75 Years and over | 33 (25.8%) | 85 (37.1%) |
Disability Class: Self-Care Difficulty
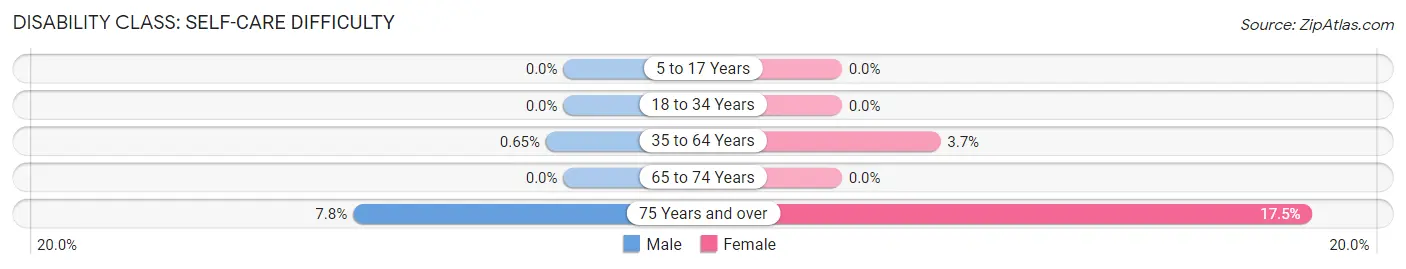
| Age Bracket | Male | Female |
| 5 to 17 Years | 0 (0.0%) | 0 (0.0%) |
| 18 to 34 Years | 0 (0.0%) | 0 (0.0%) |
| 35 to 64 Years | 3 (0.6%) | 17 (3.7%) |
| 65 to 74 Years | 0 (0.0%) | 0 (0.0%) |
| 75 Years and over | 10 (7.8%) | 40 (17.5%) |
Technology Access in Pantego
Computing Device Access in Pantego
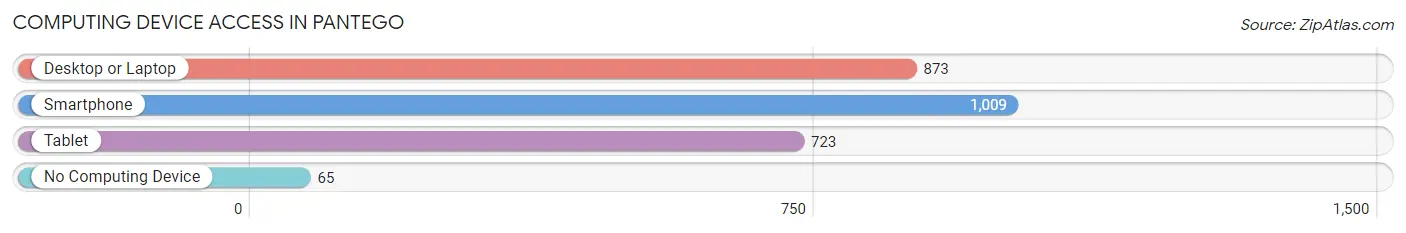
| Device Type | # Households | % Households |
| Desktop or Laptop | 873 | 76.4% |
| Smartphone | 1,009 | 88.3% |
| Tablet | 723 | 63.2% |
| No Computing Device | 65 | 5.7% |
| Total | 1,143 | 100.0% |
Internet Access in Pantego
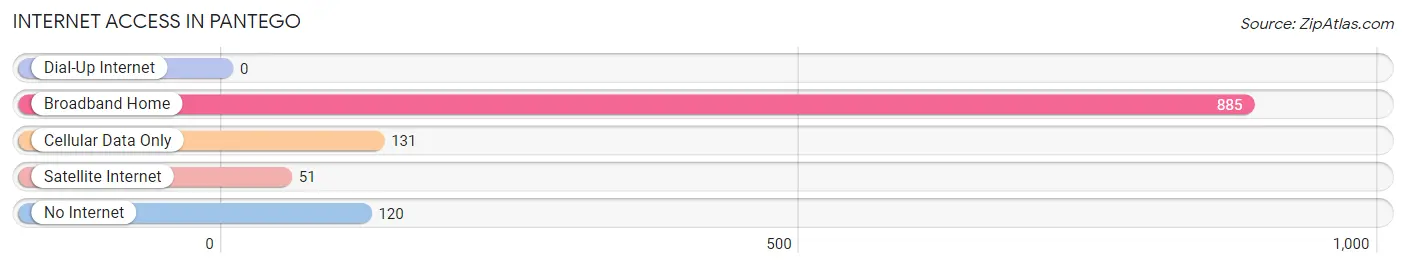
| Internet Type | # Households | % Households |
| Dial-Up Internet | 0 | 0.0% |
| Broadband Home | 885 | 77.4% |
| Cellular Data Only | 131 | 11.5% |
| Satellite Internet | 51 | 4.5% |
| No Internet | 120 | 10.5% |
| Total | 1,143 | 100.0% |
Pantego Summary
Pantego, Texas is a small town located in the Dallas-Fort Worth metropolitan area. It is situated in Tarrant County, Texas, and is part of the Arlington Independent School District. The town has a population of approximately 3,000 people and is located just south of the city of Arlington.
History
Pantego was founded in 1876 by a group of settlers from Tennessee. The town was named after the Pantego Creek, which runs through the area. The creek was named after the Cherokee word for “river of plenty”. The town was originally a farming community, but in the early 1900s, it began to develop into a residential area.
In the 1950s, the town began to experience rapid growth due to its proximity to the Dallas-Fort Worth metropolitan area. This growth was further accelerated by the construction of Interstate 20, which runs through the town.
Geography
Pantego is located in the Dallas-Fort Worth metropolitan area, in Tarrant County, Texas. It is situated just south of the city of Arlington. The town is bordered by the cities of Mansfield, Grand Prairie, and Arlington. The town is located at an elevation of 645 feet above sea level.
The town has a total area of 2.3 square miles, all of which is land. The town is located in a humid subtropical climate zone, with hot summers and mild winters. The average annual temperature is 68 degrees Fahrenheit.
Economy
Pantego’s economy is largely based on the service industry. The town is home to several restaurants, retail stores, and other businesses. The town is also home to several manufacturing companies, including a plastics manufacturer and a metal fabrication company.
The town is also home to several educational institutions, including a community college and a technical school. The town is also home to several churches and other religious organizations.
Demographics
As of the 2010 census, the population of Pantego was 3,000. The racial makeup of the town was 79.3% White, 11.3% African American, 0.7% Native American, 0.7% Asian, and 6.7% from other races. Hispanic or Latino of any race were 11.3% of the population.
The median income for a household in the town was $45,000, and the median income for a family was $50,000. The per capita income for the town was $20,000. About 8.3% of families and 10.3% of the population were below the poverty line, including 14.3% of those under age 18 and 6.7% of those age 65 or over.
Pantego is a small town with a rich history and a diverse population. The town is home to several businesses and educational institutions, and is a great place to live and work. The town is also conveniently located near the Dallas-Fort Worth metropolitan area, making it an ideal place to live for those who want to be close to the city but still enjoy the small-town atmosphere.
Common Questions
What is the Total Population of Pantego?
Total Population of Pantego is 2,529.
What is the Total Male Population of Pantego?
Total Male Population of Pantego is 1,234.
What is the Total Female Population of Pantego?
Total Female Population of Pantego is 1,295.
What is the Ratio of Males per 100 Females in Pantego?
There are 95.29 Males per 100 Females in Pantego.
What is the Ratio of Females per 100 Males in Pantego?
There are 104.94 Females per 100 Males in Pantego.
What is the Median Population Age in Pantego?
Median Population Age in Pantego is 44.0 Years.
What is the Average Family Size in Pantego
Average Family Size in Pantego is 2.9 People.
What is the Average Household Size in Pantego
Average Household Size in Pantego is 2.2 People.
What is Per Capita Income in Pantego?
Per Capita income in Pantego is $48,325.
What is the Median Family Income in Pantego?
Median Family Income in Pantego is $113,750.
What is the Median Household income in Pantego?
Median Household Income in Pantego is $84,125.
What is Income or Wage Gap in Pantego?
Income or Wage Gap in Pantego is 44.6%.
Women in Pantego earn 55.4 cents for every dollar earned by a man.
What is Inequality or Gini Index in Pantego?
Inequality or Gini Index in Pantego is 0.45.
How Large is the Labor Force in Pantego?
There are 1,268 People in the Labor Forcein in Pantego.
What is the Percentage of People in the Labor Force in Pantego?
61.3% of People are in the Labor Force in Pantego.
What is the Unemployment Rate in Pantego?
Unemployment Rate in Pantego is 7.6%.