Commerce, TX
Commerce Map
Commerce Overview
9,078
TOTAL POPULATION
3,948
MALE POPULATION
5,130
FEMALE POPULATION
76.96
MALES / 100 FEMALES
129.94
FEMALES / 100 MALES
24.1
MEDIAN AGE
3.0
AVG FAMILY SIZE
2.4
AVG HOUSEHOLD SIZE
$21,020
PER CAPITA INCOME
$53,804
AVG FAMILY INCOME
$41,382
AVG HOUSEHOLD INCOME
26.0%
WAGE / INCOME GAP [ % ]
74.0¢/ $1
WAGE / INCOME GAP [ $ ]
0.47
INEQUALITY / GINI INDEX
4,509
LABOR FORCE [ PEOPLE ]
60.1%
PERCENT IN LABOR FORCE
6.9%
UNEMPLOYMENT RATE
Commerce Zip Codes
Commerce Area Codes
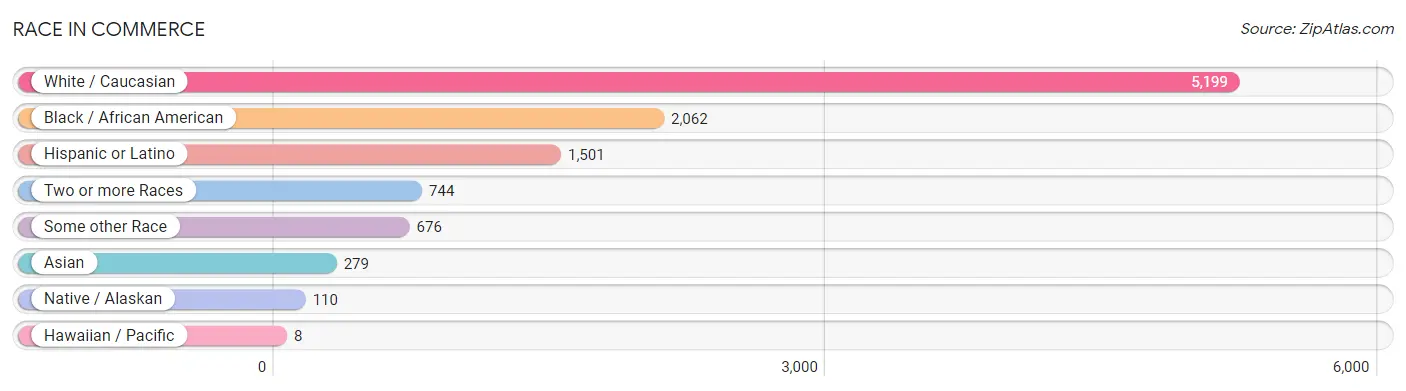
Race in Commerce
The most populous races in Commerce are White / Caucasian (5,199 | 57.3%), Black / African American (2,062 | 22.7%), and Hispanic or Latino (1,501 | 16.5%).
| Race | # Population | % Population |
| Asian | 279 | 3.1% |
| Black / African American | 2,062 | 22.7% |
| Hawaiian / Pacific | 8 | 0.1% |
| Hispanic or Latino | 1,501 | 16.5% |
| Native / Alaskan | 110 | 1.2% |
| White / Caucasian | 5,199 | 57.3% |
| Two or more Races | 744 | 8.2% |
| Some other Race | 676 | 7.4% |
| Total | 9,078 | 100.0% |
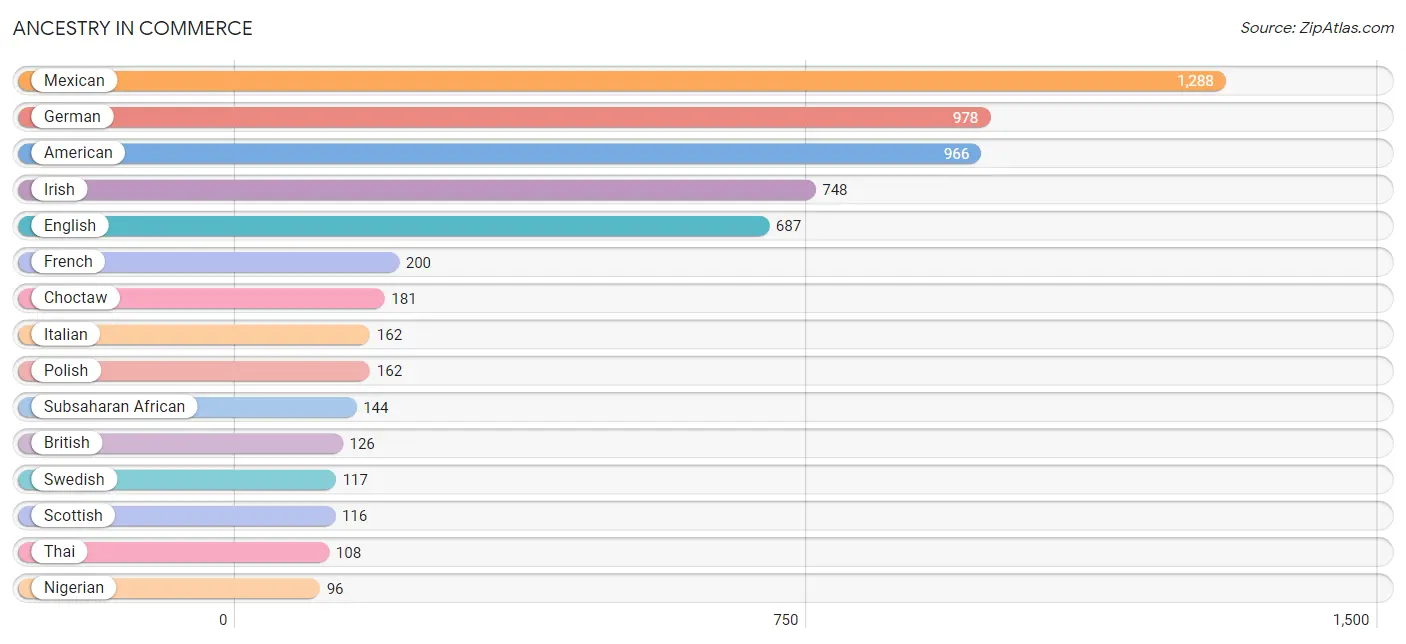
Ancestry in Commerce
The most populous ancestries reported in Commerce are Mexican (1,288 | 14.2%), German (978 | 10.8%), American (966 | 10.6%), Irish (748 | 8.2%), and English (687 | 7.6%), together accounting for 51.4% of all Commerce residents.
| Ancestry | # Population | % Population |
| African | 17 | 0.2% |
| American | 966 | 10.6% |
| Arab | 14 | 0.2% |
| Bahamian | 3 | 0.0% |
| Belizean | 5 | 0.1% |
| Bhutanese | 16 | 0.2% |
| British | 126 | 1.4% |
| Burmese | 38 | 0.4% |
| Central American | 69 | 0.8% |
| Cherokee | 17 | 0.2% |
| Chickasaw | 7 | 0.1% |
| Choctaw | 181 | 2.0% |
| Costa Rican | 36 | 0.4% |
| Croatian | 5 | 0.1% |
| Czech | 43 | 0.5% |
| Danish | 9 | 0.1% |
| Dutch | 49 | 0.5% |
| Ecuadorian | 18 | 0.2% |
| English | 687 | 7.6% |
| European | 77 | 0.9% |
| French | 200 | 2.2% |
| German | 978 | 10.8% |
| Greek | 45 | 0.5% |
| Guamanian / Chamorro | 13 | 0.1% |
| Guatemalan | 6 | 0.1% |
| Honduran | 9 | 0.1% |
| Indian (Asian) | 61 | 0.7% |
| Iranian | 10 | 0.1% |
| Iraqi | 9 | 0.1% |
| Irish | 748 | 8.2% |
| Italian | 162 | 1.8% |
| Korean | 36 | 0.4% |
| Laotian | 9 | 0.1% |
| Mexican | 1,288 | 14.2% |
| Native Hawaiian | 13 | 0.1% |
| Nigerian | 96 | 1.1% |
| Northern European | 23 | 0.3% |
| Norwegian | 38 | 0.4% |
| Pakistani | 16 | 0.2% |
| Polish | 162 | 1.8% |
| Portuguese | 20 | 0.2% |
| Puerto Rican | 4 | 0.0% |
| Russian | 22 | 0.2% |
| Salvadoran | 18 | 0.2% |
| Samoan | 19 | 0.2% |
| Scandinavian | 41 | 0.4% |
| Scotch-Irish | 58 | 0.6% |
| Scottish | 116 | 1.3% |
| South American | 18 | 0.2% |
| Spaniard | 38 | 0.4% |
| Sri Lankan | 21 | 0.2% |
| Subsaharan African | 144 | 1.6% |
| Swedish | 117 | 1.3% |
| Thai | 108 | 1.2% |
| Tongan | 8 | 0.1% |
| Ukrainian | 9 | 0.1% |
| Welsh | 28 | 0.3% |
| West Indian | 5 | 0.1% | View All 58 Rows |
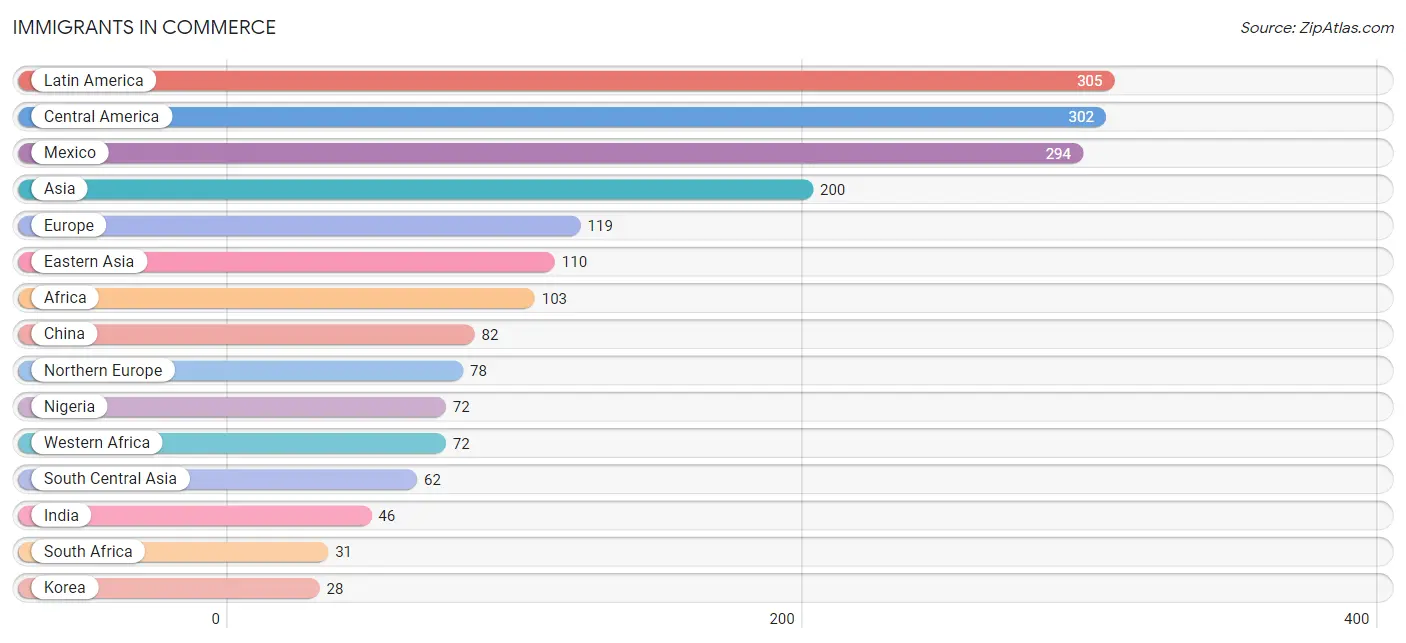
Immigrants in Commerce
The most numerous immigrant groups reported in Commerce came from Latin America (305 | 3.4%), Central America (302 | 3.3%), Mexico (294 | 3.2%), Asia (200 | 2.2%), and Europe (119 | 1.3%), together accounting for 13.4% of all Commerce residents.
| Immigration Origin | # Population | % Population |
| Africa | 103 | 1.1% |
| Asia | 200 | 2.2% |
| Bahamas | 3 | 0.0% |
| Bangladesh | 6 | 0.1% |
| Caribbean | 3 | 0.0% |
| Central America | 302 | 3.3% |
| China | 82 | 0.9% |
| Eastern Asia | 110 | 1.2% |
| El Salvador | 8 | 0.1% |
| England | 4 | 0.0% |
| Europe | 119 | 1.3% |
| France | 6 | 0.1% |
| Germany | 15 | 0.2% |
| Hong Kong | 5 | 0.1% |
| India | 46 | 0.5% |
| Iran | 10 | 0.1% |
| Iraq | 9 | 0.1% |
| Korea | 28 | 0.3% |
| Latin America | 305 | 3.4% |
| Mexico | 294 | 3.2% |
| Nigeria | 72 | 0.8% |
| Northern Europe | 78 | 0.9% |
| Philippines | 6 | 0.1% |
| South Africa | 31 | 0.3% |
| South Central Asia | 62 | 0.7% |
| South Eastern Asia | 19 | 0.2% |
| Southern Europe | 20 | 0.2% |
| Spain | 20 | 0.2% |
| Taiwan | 13 | 0.1% |
| Vietnam | 13 | 0.1% |
| Western Africa | 72 | 0.8% |
| Western Asia | 9 | 0.1% |
| Western Europe | 21 | 0.2% | View All 33 Rows |
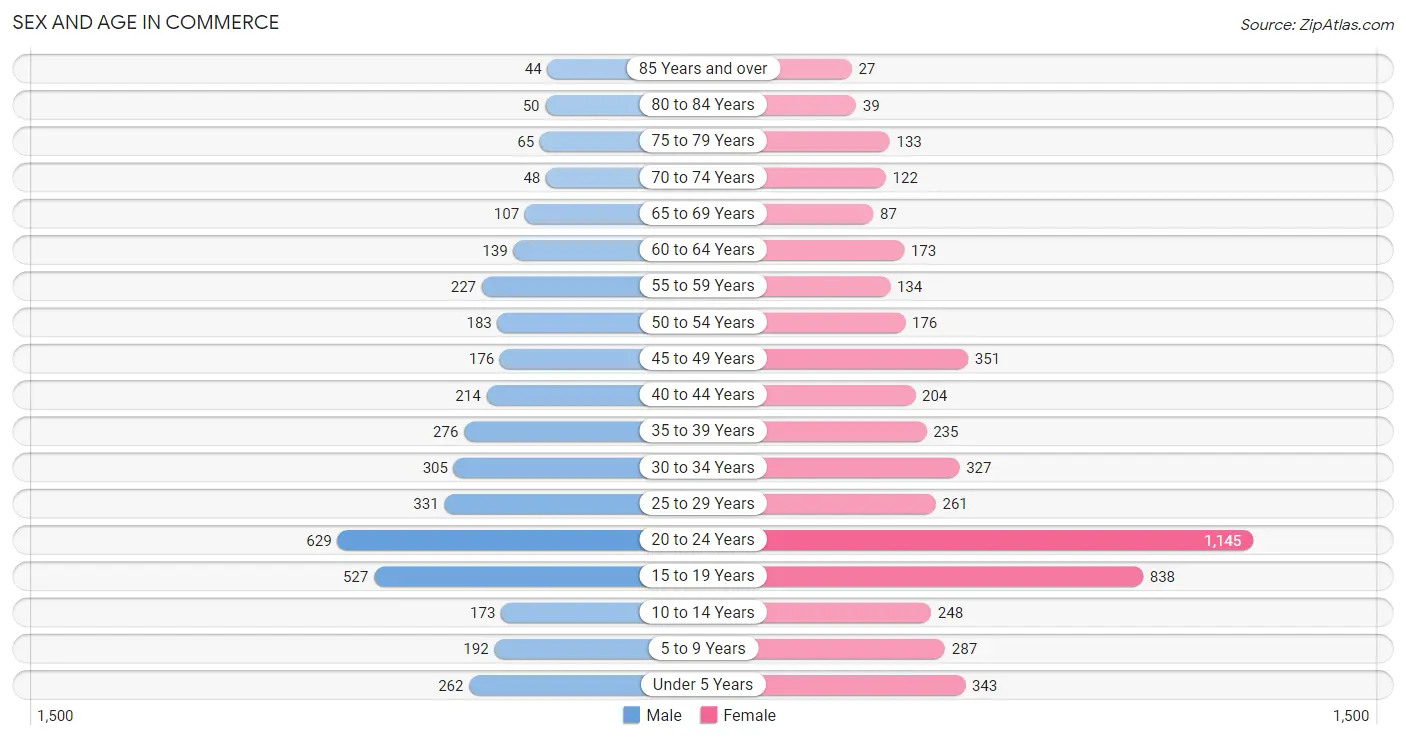
Sex and Age in Commerce
Sex and Age in Commerce
The most populous age groups in Commerce are 20 to 24 Years (629 | 15.9%) for men and 20 to 24 Years (1,145 | 22.3%) for women.
| Age Bracket | Male | Female |
| Under 5 Years | 262 (6.6%) | 343 (6.7%) |
| 5 to 9 Years | 192 (4.9%) | 287 (5.6%) |
| 10 to 14 Years | 173 (4.4%) | 248 (4.8%) |
| 15 to 19 Years | 527 (13.4%) | 838 (16.3%) |
| 20 to 24 Years | 629 (15.9%) | 1,145 (22.3%) |
| 25 to 29 Years | 331 (8.4%) | 261 (5.1%) |
| 30 to 34 Years | 305 (7.7%) | 327 (6.4%) |
| 35 to 39 Years | 276 (7.0%) | 235 (4.6%) |
| 40 to 44 Years | 214 (5.4%) | 204 (4.0%) |
| 45 to 49 Years | 176 (4.5%) | 351 (6.8%) |
| 50 to 54 Years | 183 (4.6%) | 176 (3.4%) |
| 55 to 59 Years | 227 (5.8%) | 134 (2.6%) |
| 60 to 64 Years | 139 (3.5%) | 173 (3.4%) |
| 65 to 69 Years | 107 (2.7%) | 87 (1.7%) |
| 70 to 74 Years | 48 (1.2%) | 122 (2.4%) |
| 75 to 79 Years | 65 (1.7%) | 133 (2.6%) |
| 80 to 84 Years | 50 (1.3%) | 39 (0.8%) |
| 85 Years and over | 44 (1.1%) | 27 (0.5%) |
| Total | 3,948 (100.0%) | 5,130 (100.0%) |
Families and Households in Commerce
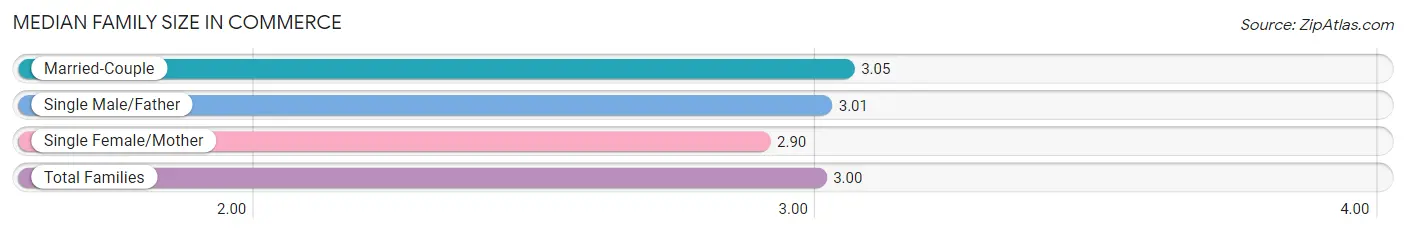
Median Family Size in Commerce
The median family size in Commerce is 3.00 persons per family, with married-couple families (1,011 | 58.4%) accounting for the largest median family size of 3.05 persons per family. On the other hand, single female/mother families (438 | 25.3%) represent the smallest median family size with 2.90 persons per family.
| Family Type | # Families | Family Size |
| Married-Couple | 1,011 (58.4%) | 3.05 |
| Single Male/Father | 283 (16.3%) | 3.01 |
| Single Female/Mother | 438 (25.3%) | 2.90 |
| Total Families | 1,732 (100.0%) | 3.00 |
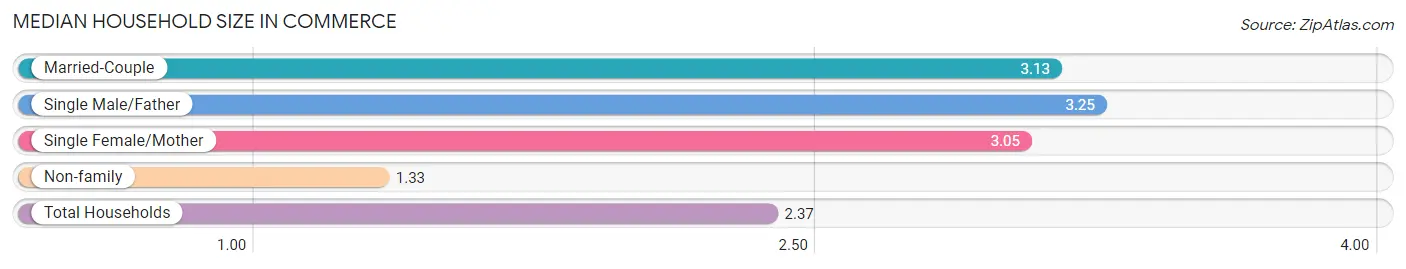
Median Household Size in Commerce
The median household size in Commerce is 2.37 persons per household, with single male/father households (283 | 9.4%) accounting for the largest median household size of 3.25 persons per household. non-family households (1,272 | 42.3%) represent the smallest median household size with 1.33 persons per household.
| Household Type | # Households | Household Size |
| Married-Couple | 1,011 (33.7%) | 3.13 |
| Single Male/Father | 283 (9.4%) | 3.25 |
| Single Female/Mother | 438 (14.6%) | 3.05 |
| Non-family | 1,272 (42.3%) | 1.33 |
| Total Households | 3,004 (100.0%) | 2.37 |
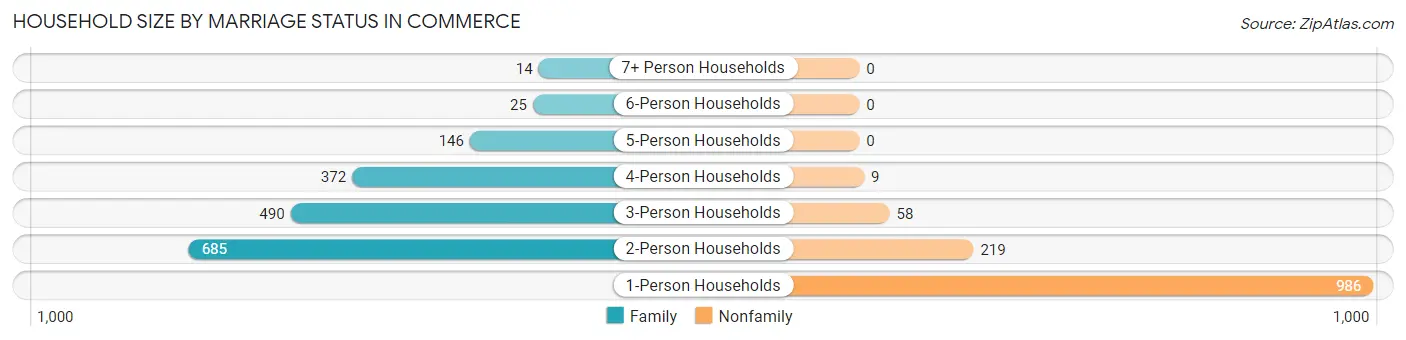
Household Size by Marriage Status in Commerce
Out of a total of 3,004 households in Commerce, 1,732 (57.7%) are family households, while 1,272 (42.3%) are nonfamily households. The most numerous type of family households are 2-person households, comprising 685, and the most common type of nonfamily households are 1-person households, comprising 986.
| Household Size | Family Households | Nonfamily Households |
| 1-Person Households | - | 986 (32.8%) |
| 2-Person Households | 685 (22.8%) | 219 (7.3%) |
| 3-Person Households | 490 (16.3%) | 58 (1.9%) |
| 4-Person Households | 372 (12.4%) | 9 (0.3%) |
| 5-Person Households | 146 (4.9%) | 0 (0.0%) |
| 6-Person Households | 25 (0.8%) | 0 (0.0%) |
| 7+ Person Households | 14 (0.5%) | 0 (0.0%) |
| Total | 1,732 (57.7%) | 1,272 (42.3%) |
Female Fertility in Commerce
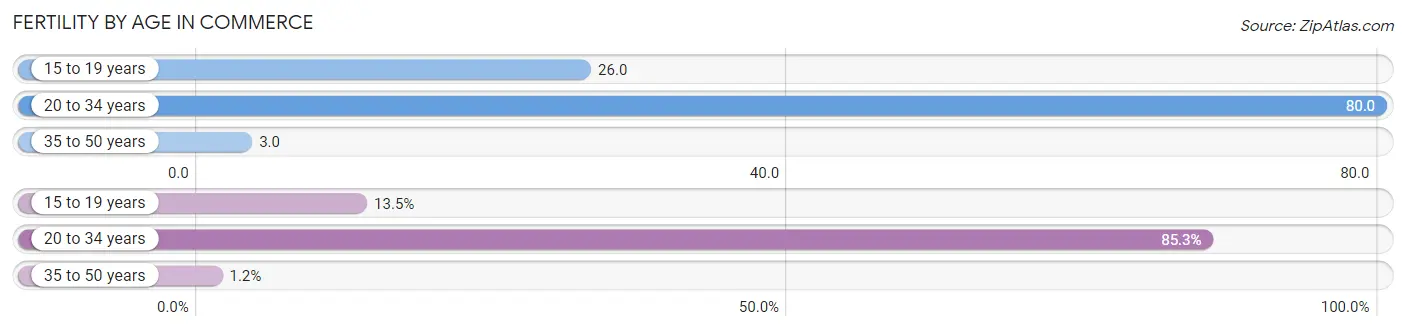
Fertility by Age in Commerce
Average fertility rate in Commerce is 48.0 births per 1,000 women. Women in the age bracket of 20 to 34 years have the highest fertility rate with 80.0 births per 1,000 women. Women in the age bracket of 20 to 34 years acount for 85.3% of all women with births.
| Age Bracket | Women with Births | Births / 1,000 Women |
| 15 to 19 years | 22 (13.5%) | 26.0 |
| 20 to 34 years | 139 (85.3%) | 80.0 |
| 35 to 50 years | 2 (1.2%) | 3.0 |
| Total | 163 (100.0%) | 48.0 |
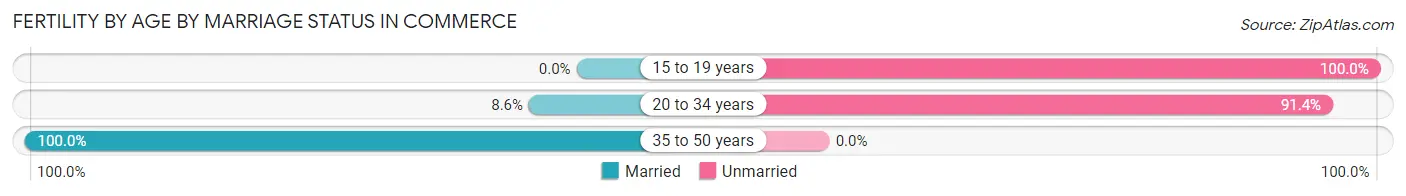
Fertility by Age by Marriage Status in Commerce
8.6% of women with births (163) in Commerce are married. The highest percentage of unmarried women with births falls into 15 to 19 years age bracket with 100.0% of them unmarried at the time of birth, while the lowest percentage of unmarried women with births belong to 35 to 50 years age bracket with 0.0% of them unmarried.
| Age Bracket | Married | Unmarried |
| 15 to 19 years | 0 (0.0%) | 22 (100.0%) |
| 20 to 34 years | 12 (8.6%) | 127 (91.4%) |
| 35 to 50 years | 2 (100.0%) | 0 (0.0%) |
| Total | 14 (8.6%) | 149 (91.4%) |
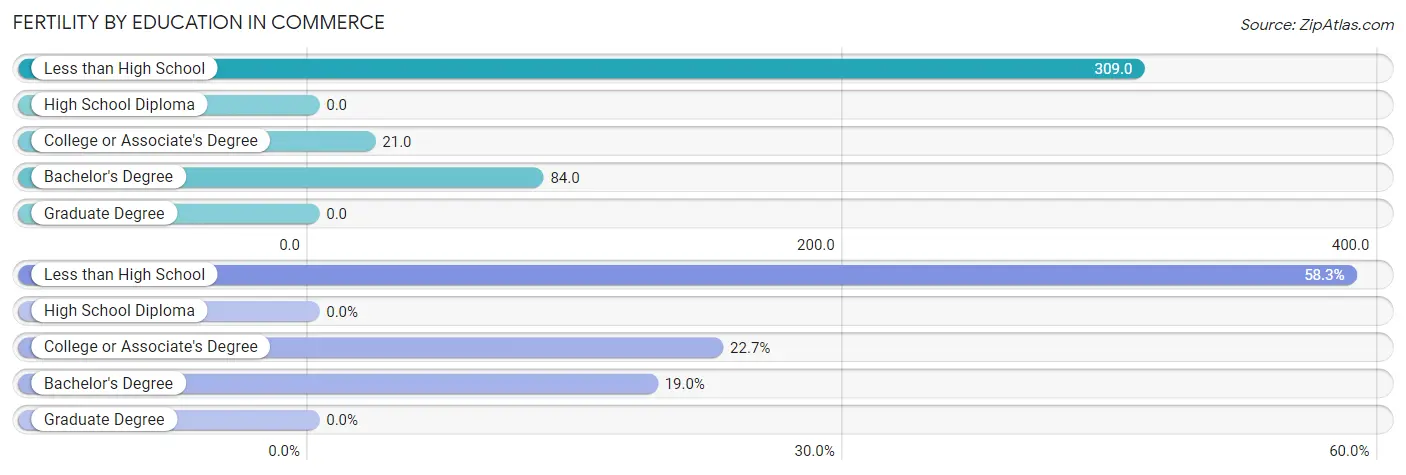
Fertility by Education in Commerce
| Educational Attainment | Women with Births | Births / 1,000 Women |
| Less than High School | 95 (58.3%) | 309.0 |
| High School Diploma | 0 (0.0%) | 0.0 |
| College or Associate's Degree | 37 (22.7%) | 21.0 |
| Bachelor's Degree | 31 (19.0%) | 84.0 |
| Graduate Degree | 0 (0.0%) | 0.0 |
| Total | 163 (100.0%) | 48.0 |
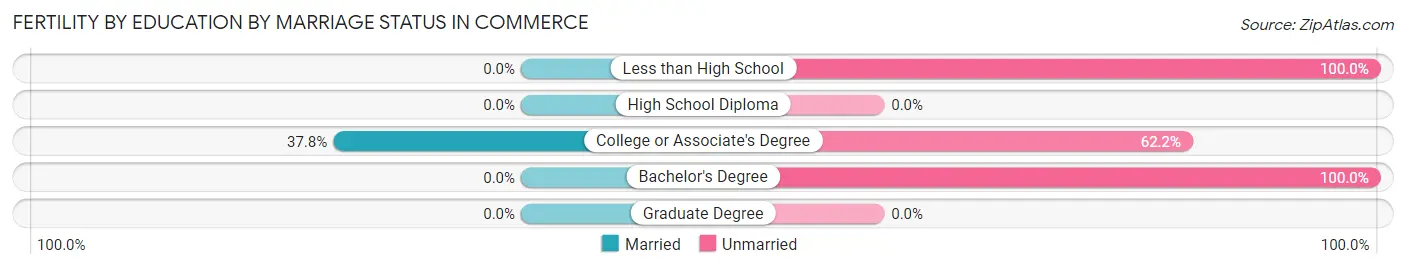
Fertility by Education by Marriage Status in Commerce
91.4% of women with births in Commerce are unmarried. Women with the educational attainment of college or associate's degree are most likely to be married with 37.8% of them married at childbirth, while women with the educational attainment of less than high school are least likely to be married with 100.0% of them unmarried at childbirth.
| Educational Attainment | Married | Unmarried |
| Less than High School | 0 (0.0%) | 95 (100.0%) |
| High School Diploma | 0 (0.0%) | 0 (0.0%) |
| College or Associate's Degree | 14 (37.8%) | 23 (62.2%) |
| Bachelor's Degree | 0 (0.0%) | 31 (100.0%) |
| Graduate Degree | 0 (0.0%) | 0 (0.0%) |
| Total | 14 (8.6%) | 149 (91.4%) |
Income in Commerce
Income Overview in Commerce
Per Capita Income in Commerce is $21,020, while median incomes of families and households are $53,804 and $41,382 respectively.
| Characteristic | Number | Measure |
| Per Capita Income | 9,078 | $21,020 |
| Median Family Income | 1,732 | $53,804 |
| Mean Family Income | 1,732 | $74,730 |
| Median Household Income | 3,004 | $41,382 |
| Mean Household Income | 3,004 | $59,903 |
| Income Deficit | 1,732 | $0 |
| Wage / Income Gap (%) | 9,078 | 26.03% |
| Wage / Income Gap ($) | 9,078 | 73.97¢ per $1 |
| Gini / Inequality Index | 9,078 | 0.47 |
Earnings by Sex in Commerce
Average Earnings in Commerce are $19,688, $24,210 for men and $17,907 for women, a difference of 26.0%.
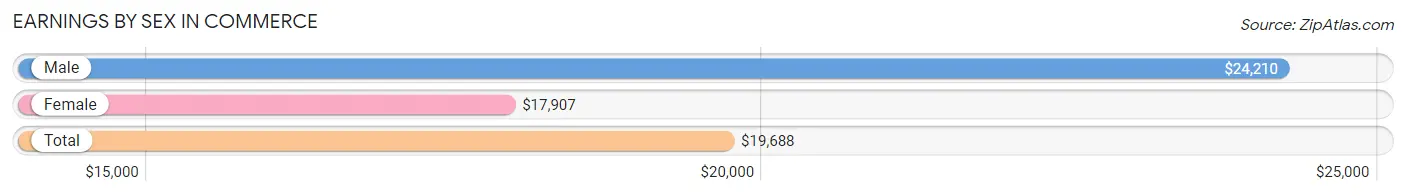
| Sex | Number | Average Earnings |
| Male | 2,403 (46.7%) | $24,210 |
| Female | 2,741 (53.3%) | $17,907 |
| Total | 5,144 (100.0%) | $19,688 |
Earnings by Sex by Income Bracket in Commerce
The most common earnings brackets in Commerce are $2,499 or less for men (237 | 9.9%) and $2,499 or less for women (497 | 18.1%).
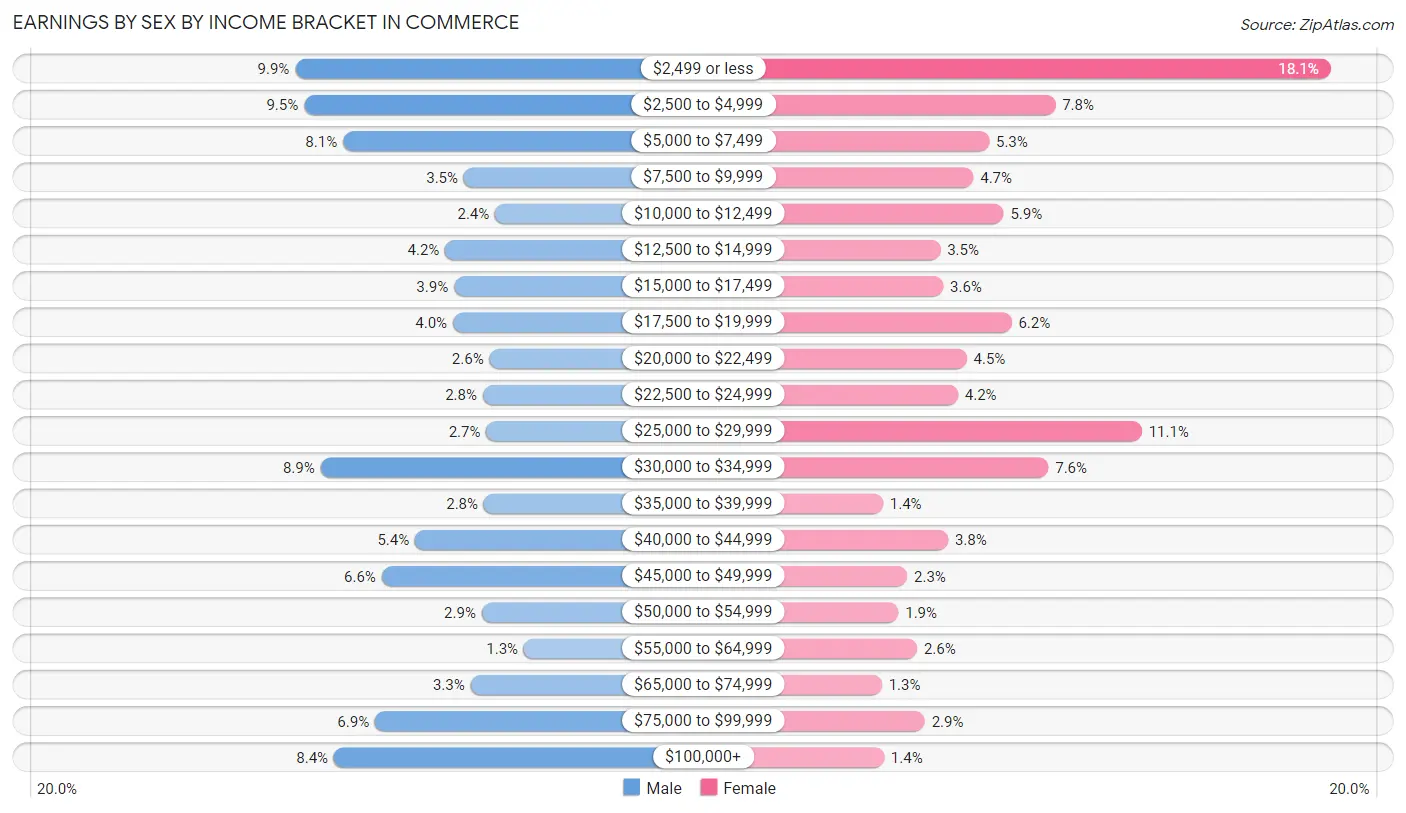
| Income | Male | Female |
| $2,499 or less | 237 (9.9%) | 497 (18.1%) |
| $2,500 to $4,999 | 229 (9.5%) | 214 (7.8%) |
| $5,000 to $7,499 | 194 (8.1%) | 146 (5.3%) |
| $7,500 to $9,999 | 85 (3.5%) | 130 (4.7%) |
| $10,000 to $12,499 | 57 (2.4%) | 161 (5.9%) |
| $12,500 to $14,999 | 102 (4.2%) | 96 (3.5%) |
| $15,000 to $17,499 | 94 (3.9%) | 99 (3.6%) |
| $17,500 to $19,999 | 95 (4.0%) | 169 (6.2%) |
| $20,000 to $22,499 | 62 (2.6%) | 123 (4.5%) |
| $22,500 to $24,999 | 68 (2.8%) | 114 (4.2%) |
| $25,000 to $29,999 | 65 (2.7%) | 303 (11.1%) |
| $30,000 to $34,999 | 214 (8.9%) | 207 (7.5%) |
| $35,000 to $39,999 | 67 (2.8%) | 37 (1.3%) |
| $40,000 to $44,999 | 129 (5.4%) | 104 (3.8%) |
| $45,000 to $49,999 | 159 (6.6%) | 62 (2.3%) |
| $50,000 to $54,999 | 69 (2.9%) | 53 (1.9%) |
| $55,000 to $64,999 | 31 (1.3%) | 72 (2.6%) |
| $65,000 to $74,999 | 79 (3.3%) | 36 (1.3%) |
| $75,000 to $99,999 | 165 (6.9%) | 80 (2.9%) |
| $100,000+ | 202 (8.4%) | 38 (1.4%) |
| Total | 2,403 (100.0%) | 2,741 (100.0%) |
Earnings by Sex by Educational Attainment in Commerce
Average earnings in Commerce are $40,548 for men and $27,973 for women, a difference of 31.0%. Men with an educational attainment of graduate degree enjoy the highest average annual earnings of $68,750, while those with less than high school education earn the least with $33,077. Women with an educational attainment of bachelor's degree earn the most with the average annual earnings of $46,719, while those with less than high school education have the smallest earnings of $20,625.
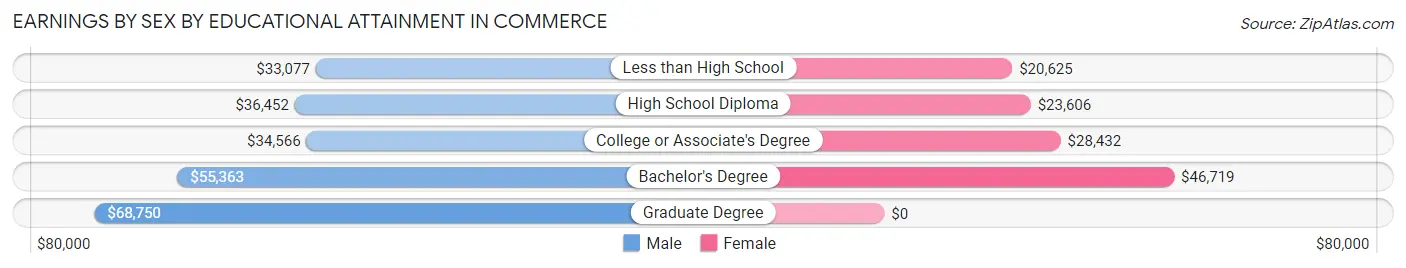
| Educational Attainment | Male Income | Female Income |
| Less than High School | $33,077 | $20,625 |
| High School Diploma | $36,452 | $23,606 |
| College or Associate's Degree | $34,566 | $28,432 |
| Bachelor's Degree | $55,363 | $46,719 |
| Graduate Degree | $68,750 | $0 |
| Total | $40,548 | $27,973 |
Family Income in Commerce
Family Income Brackets in Commerce
According to the Commerce family income data, there are 336 families falling into the $75,000 to $99,999 income range, which is the most common income bracket and makes up 19.4% of all families. Conversely, the $150,000 to $199,999 income bracket is the least frequent group with only 78 families (4.5%) belonging to this category.
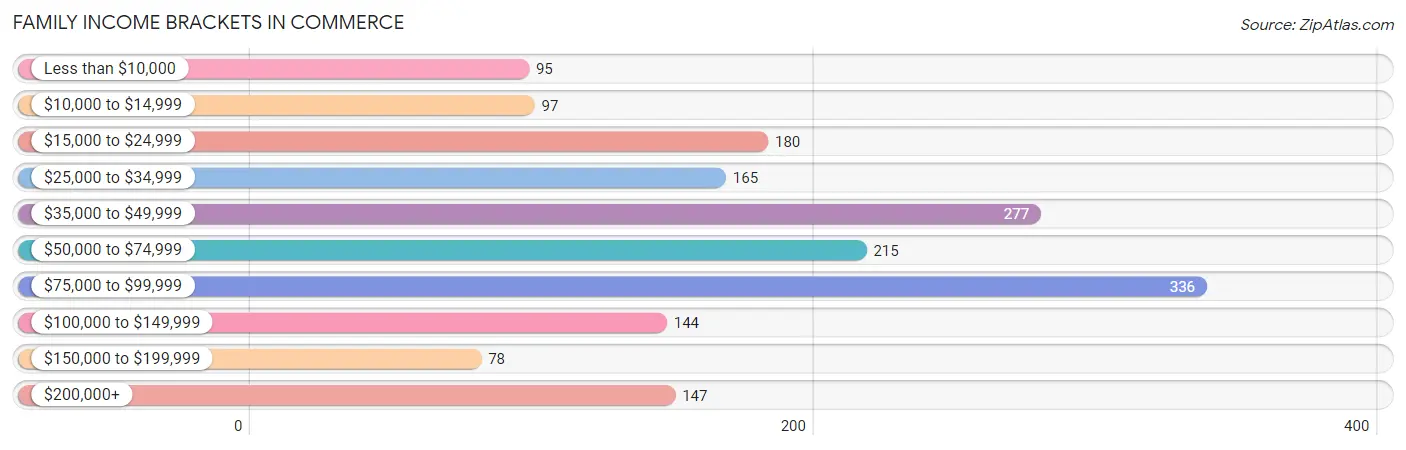
| Income Bracket | # Families | % Families |
| Less than $10,000 | 95 | 5.5% |
| $10,000 to $14,999 | 97 | 5.6% |
| $15,000 to $24,999 | 180 | 10.4% |
| $25,000 to $34,999 | 165 | 9.5% |
| $35,000 to $49,999 | 277 | 16.0% |
| $50,000 to $74,999 | 215 | 12.4% |
| $75,000 to $99,999 | 336 | 19.4% |
| $100,000 to $149,999 | 144 | 8.3% |
| $150,000 to $199,999 | 78 | 4.5% |
| $200,000+ | 147 | 8.5% |
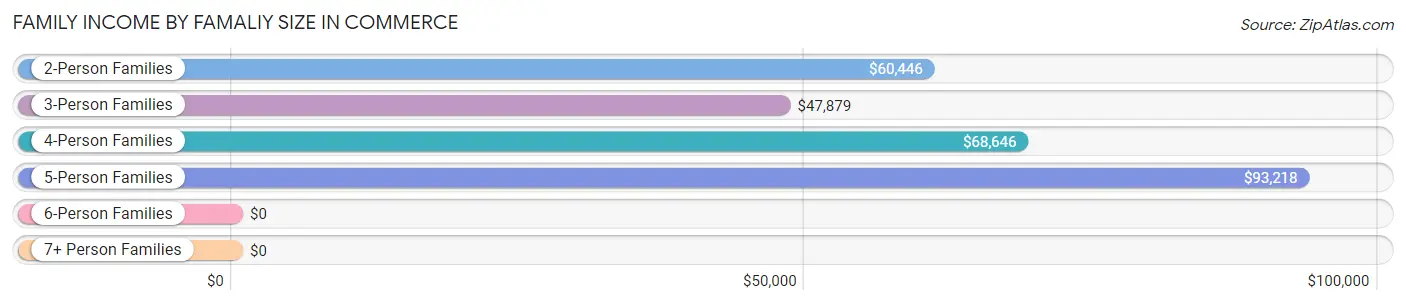
Family Income by Famaliy Size in Commerce
5-person families (145 | 8.4%) account for the highest median family income in Commerce with $93,218 per family, while 2-person families (727 | 42.0%) have the highest median income of $30,223 per family member.
| Income Bracket | # Families | Median Income |
| 2-Person Families | 727 (42.0%) | $60,446 |
| 3-Person Families | 553 (31.9%) | $47,879 |
| 4-Person Families | 293 (16.9%) | $68,646 |
| 5-Person Families | 145 (8.4%) | $93,218 |
| 6-Person Families | 0 (0.0%) | $0 |
| 7+ Person Families | 14 (0.8%) | $0 |
| Total | 1,732 (100.0%) | $53,804 |
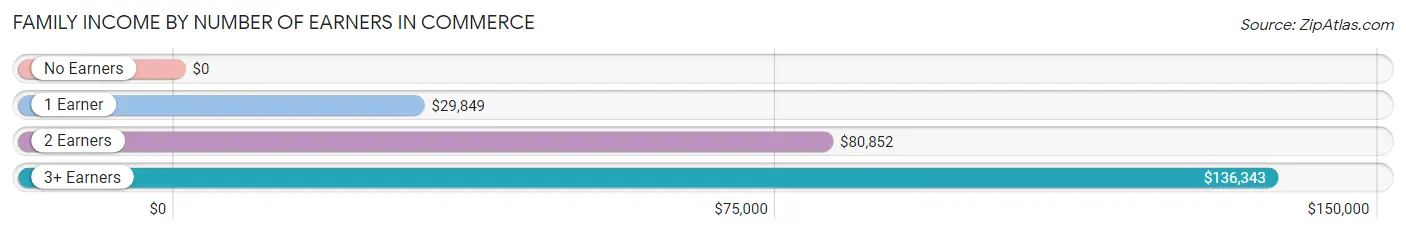
Family Income by Number of Earners in Commerce
| Number of Earners | # Families | Median Income |
| No Earners | 256 (14.8%) | $0 |
| 1 Earner | 560 (32.3%) | $29,849 |
| 2 Earners | 723 (41.7%) | $80,852 |
| 3+ Earners | 193 (11.1%) | $136,343 |
| Total | 1,732 (100.0%) | $53,804 |
Household Income in Commerce
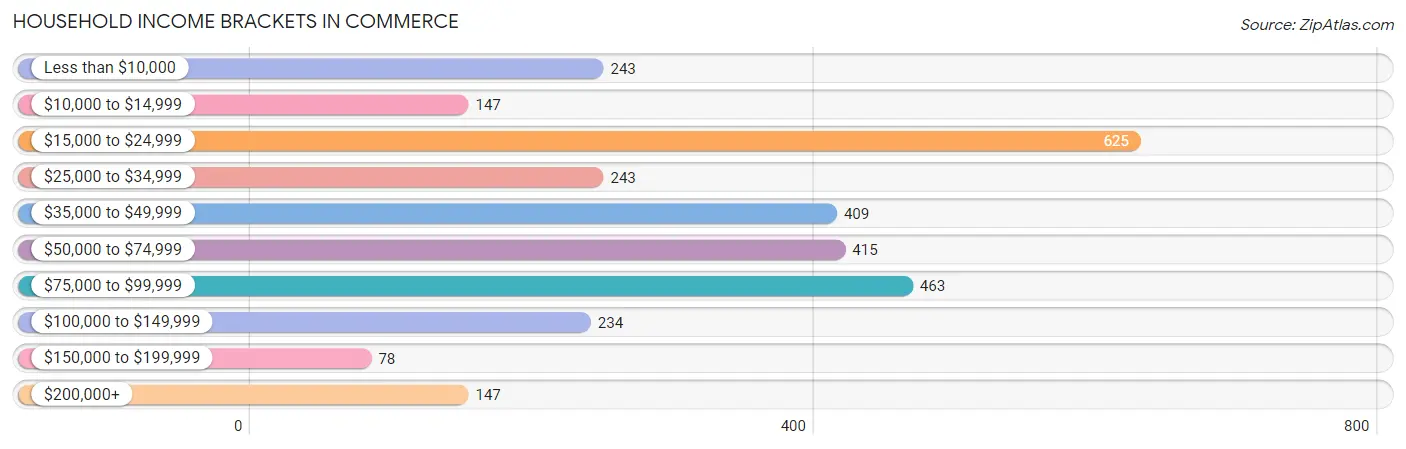
Household Income Brackets in Commerce
With 625 households falling in the category, the $15,000 to $24,999 income range is the most frequent in Commerce, accounting for 20.8% of all households. In contrast, only 78 households (2.6%) fall into the $150,000 to $199,999 income bracket, making it the least populous group.
| Income Bracket | # Households | % Households |
| Less than $10,000 | 243 | 8.1% |
| $10,000 to $14,999 | 147 | 4.9% |
| $15,000 to $24,999 | 625 | 20.8% |
| $25,000 to $34,999 | 243 | 8.1% |
| $35,000 to $49,999 | 409 | 13.6% |
| $50,000 to $74,999 | 415 | 13.8% |
| $75,000 to $99,999 | 463 | 15.4% |
| $100,000 to $149,999 | 234 | 7.8% |
| $150,000 to $199,999 | 78 | 2.6% |
| $200,000+ | 147 | 4.9% |
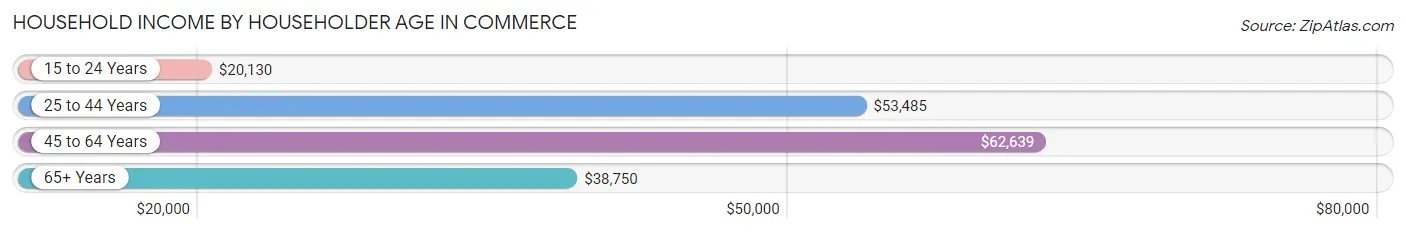
Household Income by Householder Age in Commerce
The median household income in Commerce is $41,382, with the highest median household income of $62,639 found in the 45 to 64 years age bracket for the primary householder. A total of 921 households (30.7%) fall into this category. Meanwhile, the 15 to 24 years age bracket for the primary householder has the lowest median household income of $20,130, with 400 households (13.3%) in this group.
| Income Bracket | # Households | Median Income |
| 15 to 24 Years | 400 (13.3%) | $20,130 |
| 25 to 44 Years | 1,166 (38.8%) | $53,485 |
| 45 to 64 Years | 921 (30.7%) | $62,639 |
| 65+ Years | 517 (17.2%) | $38,750 |
| Total | 3,004 (100.0%) | $41,382 |
Poverty in Commerce
Income Below Poverty by Sex and Age in Commerce
With 21.9% poverty level for males and 27.4% for females among the residents of Commerce, 5 year old males and 5 year old females are the most vulnerable to poverty, with 74 males (49.0%) and 85 females (100.0%) in their respective age groups living below the poverty level.
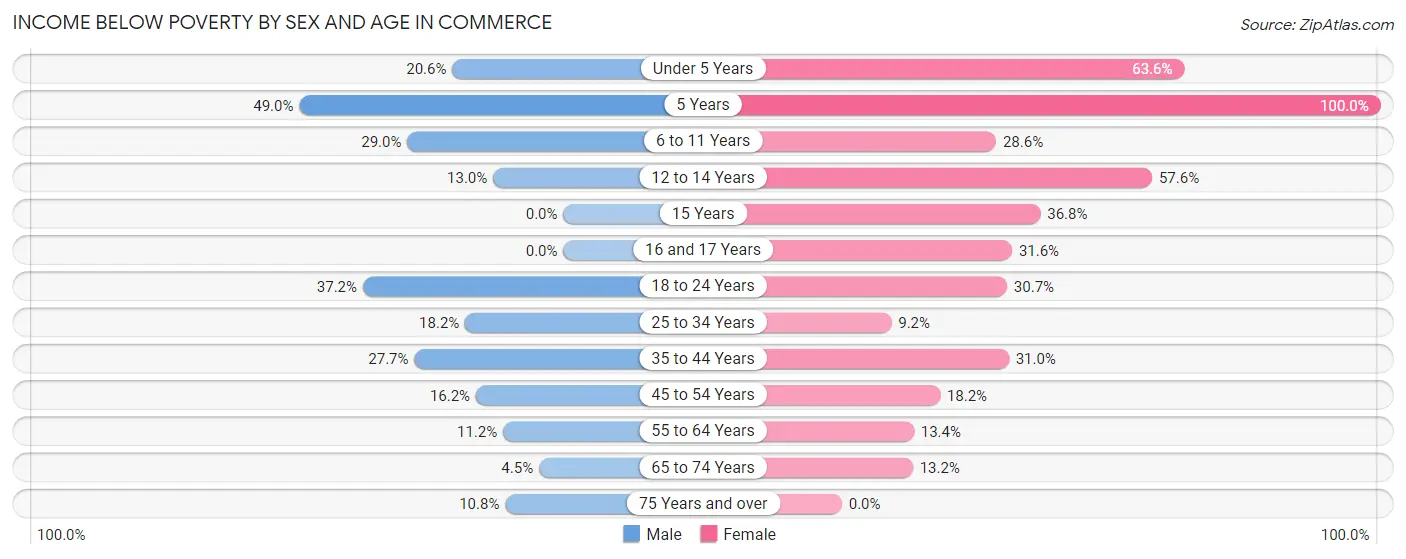
| Age Bracket | Male | Female |
| Under 5 Years | 54 (20.6%) | 218 (63.6%) |
| 5 Years | 74 (49.0%) | 85 (100.0%) |
| 6 to 11 Years | 42 (29.0%) | 91 (28.6%) |
| 12 to 14 Years | 9 (13.0%) | 76 (57.6%) |
| 15 Years | 0 (0.0%) | 21 (36.8%) |
| 16 and 17 Years | 0 (0.0%) | 12 (31.6%) |
| 18 to 24 Years | 163 (37.2%) | 221 (30.6%) |
| 25 to 34 Years | 115 (18.2%) | 54 (9.2%) |
| 35 to 44 Years | 122 (27.7%) | 136 (31.0%) |
| 45 to 54 Years | 55 (16.2%) | 96 (18.2%) |
| 55 to 64 Years | 41 (11.2%) | 41 (13.4%) |
| 65 to 74 Years | 7 (4.5%) | 25 (13.2%) |
| 75 Years and over | 15 (10.8%) | 0 (0.0%) |
| Total | 697 (21.9%) | 1,076 (27.4%) |
Income Above Poverty by Sex and Age in Commerce
According to the poverty statistics in Commerce, males aged 15 years and females aged 75 years and over are the age groups that are most secure financially, with 100.0% of males and 100.0% of females in these age groups living above the poverty line.
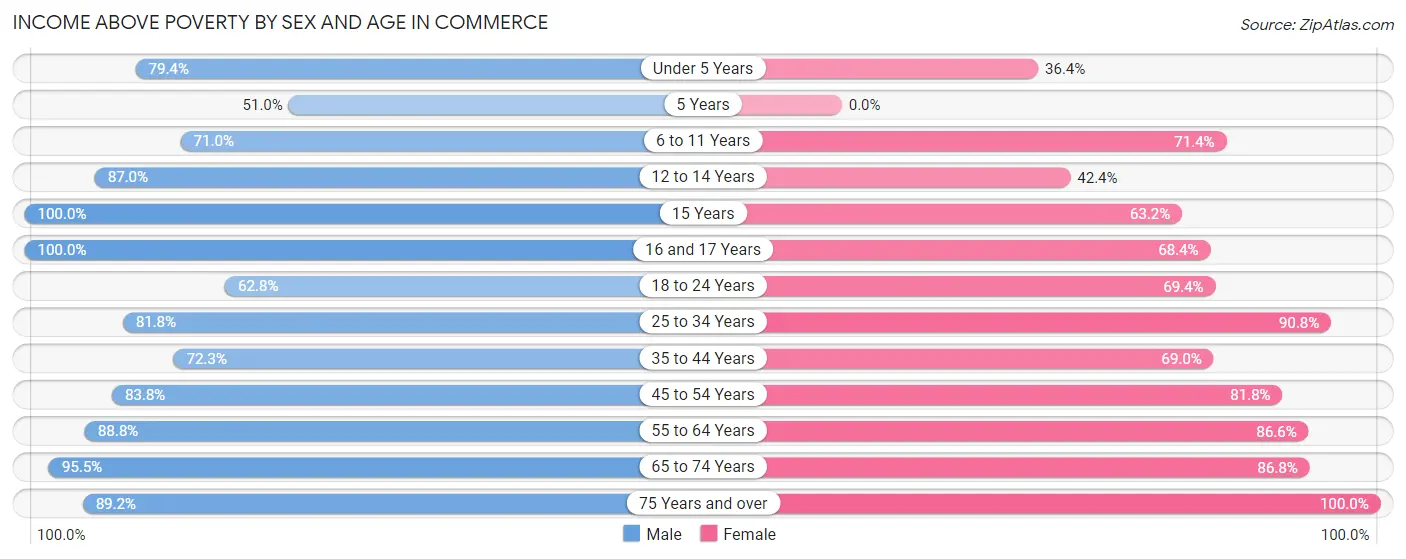
| Age Bracket | Male | Female |
| Under 5 Years | 208 (79.4%) | 125 (36.4%) |
| 5 Years | 77 (51.0%) | 0 (0.0%) |
| 6 to 11 Years | 103 (71.0%) | 227 (71.4%) |
| 12 to 14 Years | 60 (87.0%) | 56 (42.4%) |
| 15 Years | 14 (100.0%) | 36 (63.2%) |
| 16 and 17 Years | 30 (100.0%) | 26 (68.4%) |
| 18 to 24 Years | 275 (62.8%) | 500 (69.4%) |
| 25 to 34 Years | 516 (81.8%) | 534 (90.8%) |
| 35 to 44 Years | 319 (72.3%) | 303 (69.0%) |
| 45 to 54 Years | 284 (83.8%) | 431 (81.8%) |
| 55 to 64 Years | 325 (88.8%) | 266 (86.6%) |
| 65 to 74 Years | 148 (95.5%) | 165 (86.8%) |
| 75 Years and over | 124 (89.2%) | 185 (100.0%) |
| Total | 2,483 (78.1%) | 2,854 (72.6%) |
Income Below Poverty Among Married-Couple Families in Commerce
The poverty statistics for married-couple families in Commerce show that 6.7% or 68 of the total 1,011 families live below the poverty line. Families with 3 or 4 children have the highest poverty rate of 43.2%, comprising of 19 families. On the other hand, families with no children have the lowest poverty rate of 4.8%, which includes 29 families.
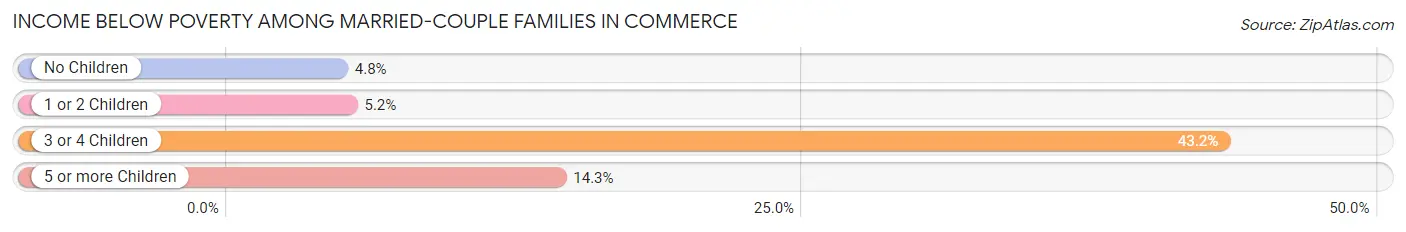
| Children | Above Poverty | Below Poverty |
| No Children | 578 (95.2%) | 29 (4.8%) |
| 1 or 2 Children | 328 (94.8%) | 18 (5.2%) |
| 3 or 4 Children | 25 (56.8%) | 19 (43.2%) |
| 5 or more Children | 12 (85.7%) | 2 (14.3%) |
| Total | 943 (93.3%) | 68 (6.7%) |
Income Below Poverty Among Single-Parent Households in Commerce
According to the poverty data in Commerce, 15.9% or 45 single-father households and 44.8% or 196 single-mother households are living below the poverty line. Among single-father households, those with 1 or 2 children have the highest poverty rate, with 45 households (26.5%) experiencing poverty. Likewise, among single-mother households, those with 3 or 4 children have the highest poverty rate, with 26 households (100.0%) falling below the poverty line.
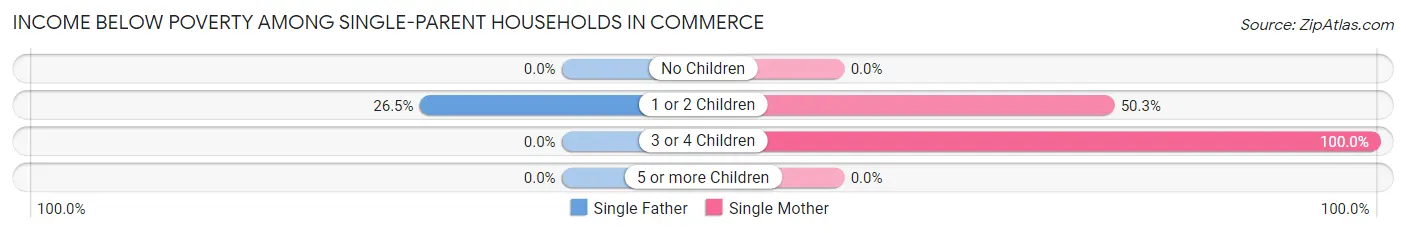
| Children | Single Father | Single Mother |
| No Children | 0 (0.0%) | 0 (0.0%) |
| 1 or 2 Children | 45 (26.5%) | 170 (50.3%) |
| 3 or 4 Children | 0 (0.0%) | 26 (100.0%) |
| 5 or more Children | 0 (0.0%) | 0 (0.0%) |
| Total | 45 (15.9%) | 196 (44.8%) |
Income Below Poverty Among Married-Couple vs Single-Parent Households in Commerce
The poverty data for Commerce shows that 68 of the married-couple family households (6.7%) and 241 of the single-parent households (33.4%) are living below the poverty level. Within the married-couple family households, those with 3 or 4 children have the highest poverty rate, with 19 households (43.2%) falling below the poverty line. Among the single-parent households, those with 3 or 4 children have the highest poverty rate, with 26 household (100.0%) living below poverty.
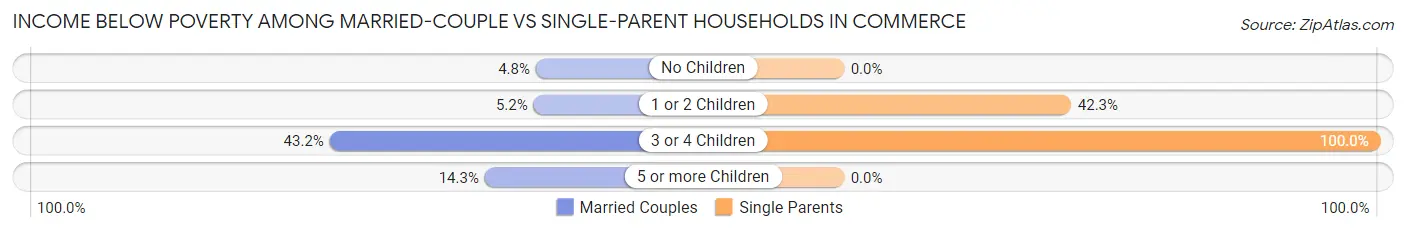
| Children | Married-Couple Families | Single-Parent Households |
| No Children | 29 (4.8%) | 0 (0.0%) |
| 1 or 2 Children | 18 (5.2%) | 215 (42.3%) |
| 3 or 4 Children | 19 (43.2%) | 26 (100.0%) |
| 5 or more Children | 2 (14.3%) | 0 (0.0%) |
| Total | 68 (6.7%) | 241 (33.4%) |
Employment Characteristics in Commerce
Employment by Class of Employer in Commerce
Among the 4,143 employed individuals in Commerce, private company employees (2,515 | 60.7%), state government employees (675 | 16.3%), and local government employees (310 | 7.5%) make up the most common classes of employment.
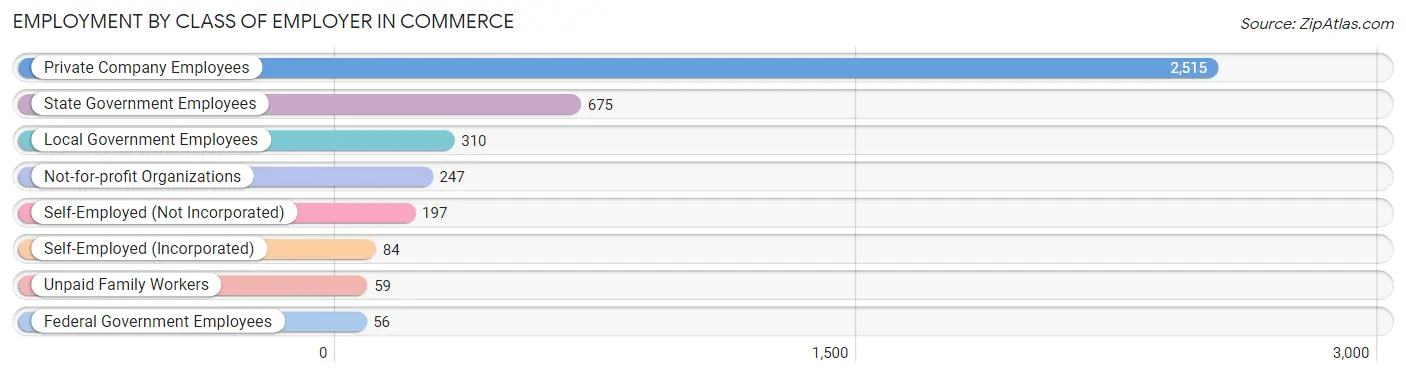
| Employer Class | # Employees | % Employees |
| Private Company Employees | 2,515 | 60.7% |
| Self-Employed (Incorporated) | 84 | 2.0% |
| Self-Employed (Not Incorporated) | 197 | 4.8% |
| Not-for-profit Organizations | 247 | 6.0% |
| Local Government Employees | 310 | 7.5% |
| State Government Employees | 675 | 16.3% |
| Federal Government Employees | 56 | 1.3% |
| Unpaid Family Workers | 59 | 1.4% |
| Total | 4,143 | 100.0% |
Employment Status by Age in Commerce
According to the labor force statistics for Commerce, out of the total population over 16 years of age (7,502), 60.1% or 4,509 individuals are in the labor force, with 6.9% or 311 of them unemployed. The age group with the highest labor force participation rate is 30 to 34 years, with 92.6% or 585 individuals in the labor force. Within the labor force, the 75 years and over age range has the highest percentage of unemployed individuals, with 26.8% or 11 of them being unemployed.
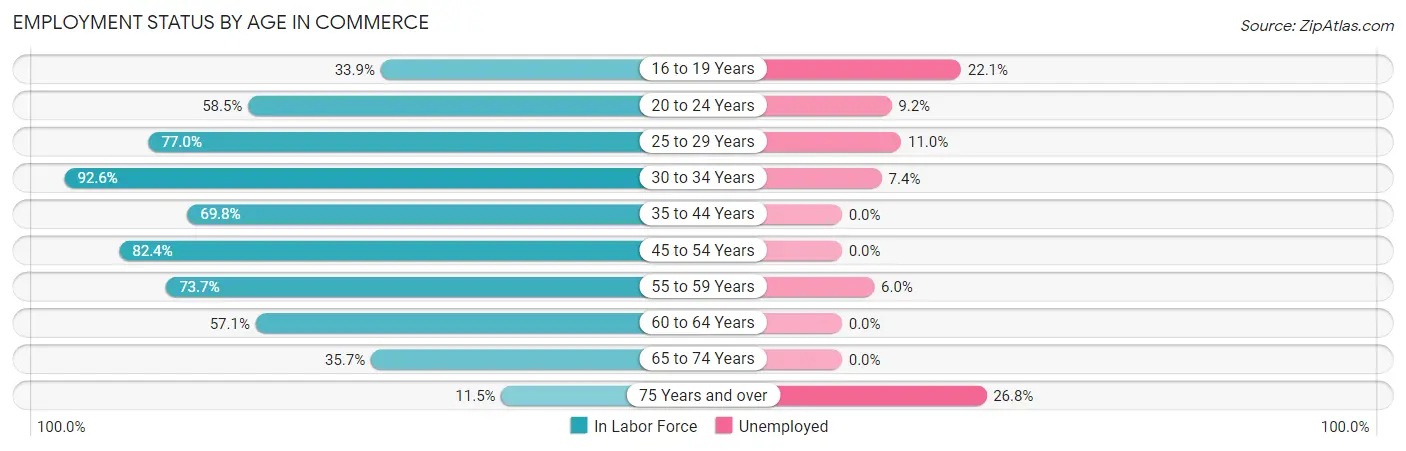
| Age Bracket | In Labor Force | Unemployed |
| 16 to 19 Years | 439 (33.9%) | 97 (22.1%) |
| 20 to 24 Years | 1,038 (58.5%) | 95 (9.2%) |
| 25 to 29 Years | 456 (77.0%) | 50 (11.0%) |
| 30 to 34 Years | 585 (92.6%) | 43 (7.4%) |
| 35 to 44 Years | 648 (69.8%) | 0 (0.0%) |
| 45 to 54 Years | 730 (82.4%) | 0 (0.0%) |
| 55 to 59 Years | 266 (73.7%) | 16 (6.0%) |
| 60 to 64 Years | 178 (57.1%) | 0 (0.0%) |
| 65 to 74 Years | 130 (35.7%) | 0 (0.0%) |
| 75 Years and over | 41 (11.5%) | 11 (26.8%) |
| Total | 4,509 (60.1%) | 311 (6.9%) |
Employment Status by Educational Attainment in Commerce
According to labor force statistics for Commerce, 77.1% of individuals (2,862) out of the total population between 25 and 64 years of age (3,712) are in the labor force, with 3.8% or 109 of them being unemployed. The group with the highest labor force participation rate are those with the educational attainment of bachelor's degree or higher, with 96.4% or 849 individuals in the labor force. Within the labor force, individuals with less than high school education have the highest percentage of unemployment, with 11.8% or 37 of them being unemployed.
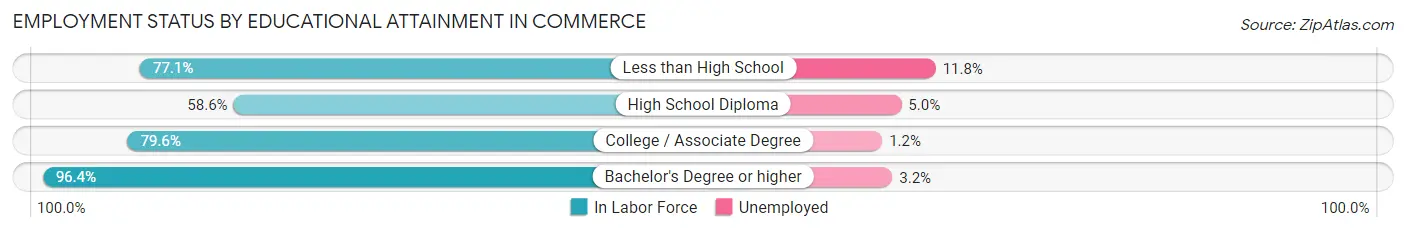
| Educational Attainment | In Labor Force | Unemployed |
| Less than High School | 314 (77.1%) | 48 (11.8%) |
| High School Diploma | 638 (58.6%) | 54 (5.0%) |
| College / Associate Degree | 1,063 (79.6%) | 16 (1.2%) |
| Bachelor's Degree or higher | 849 (96.4%) | 28 (3.2%) |
| Total | 2,862 (77.1%) | 141 (3.8%) |
Employment Occupations by Sex in Commerce
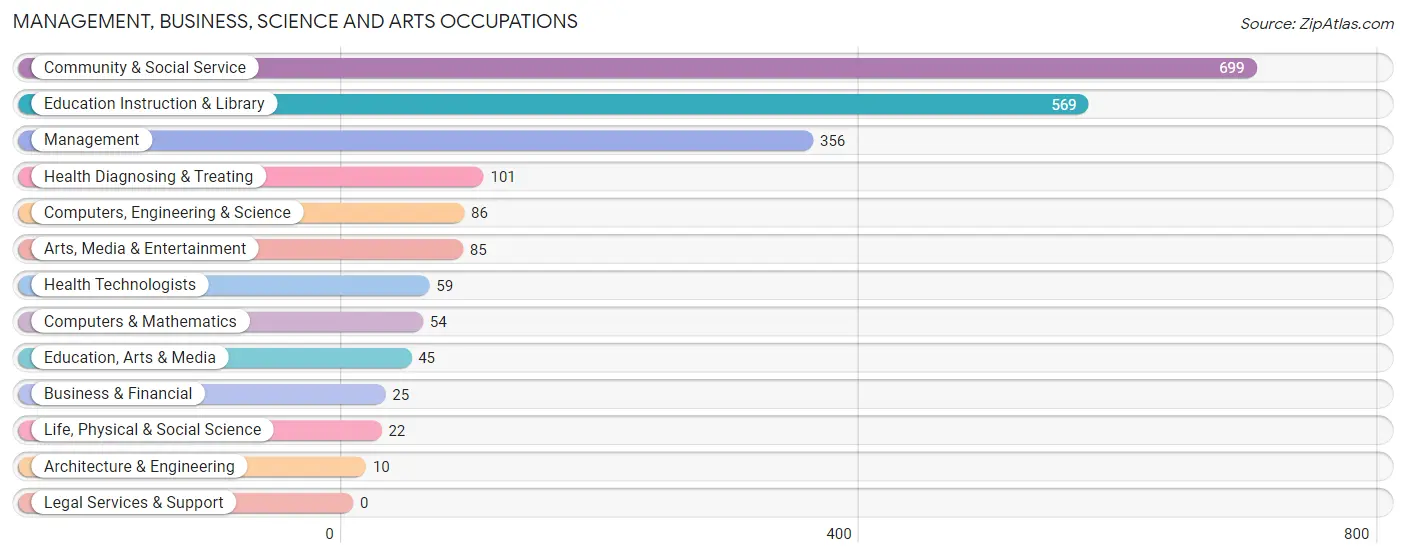
Management, Business, Science and Arts Occupations
The most common Management, Business, Science and Arts occupations in Commerce are Community & Social Service (699 | 16.7%), Education Instruction & Library (569 | 13.6%), Management (356 | 8.5%), Health Diagnosing & Treating (101 | 2.4%), and Computers, Engineering & Science (86 | 2.1%).
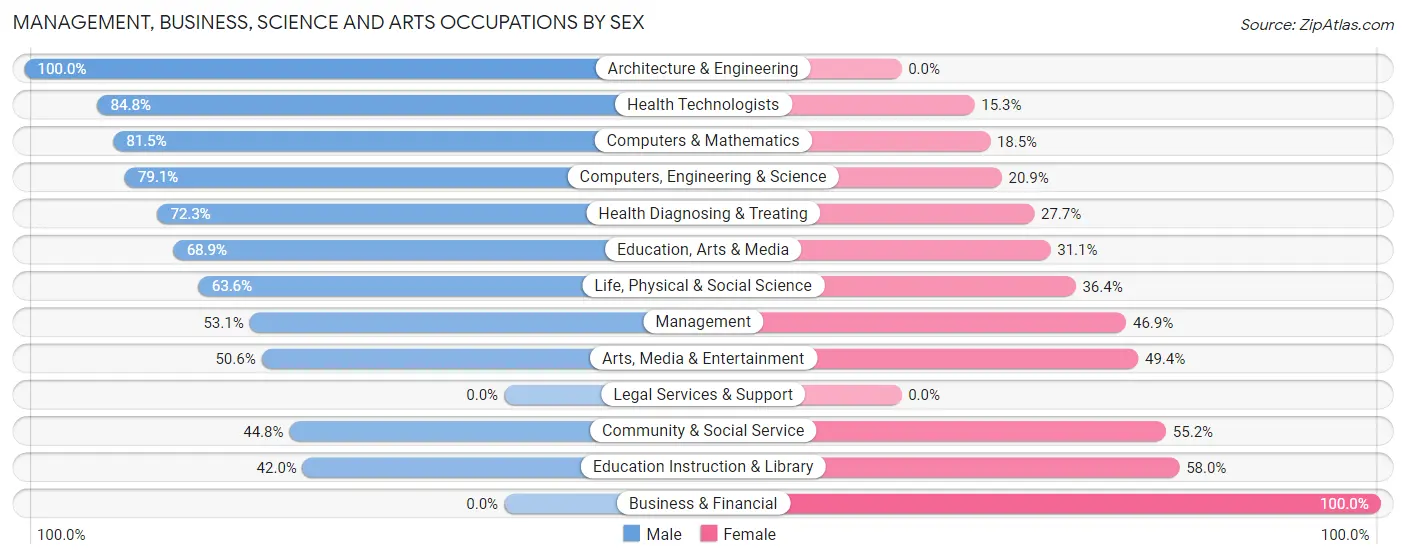
Management, Business, Science and Arts Occupations by Sex
Within the Management, Business, Science and Arts occupations in Commerce, the most male-oriented occupations are Architecture & Engineering (100.0%), Health Technologists (84.8%), and Computers & Mathematics (81.5%), while the most female-oriented occupations are Business & Financial (100.0%), Education Instruction & Library (58.0%), and Community & Social Service (55.2%).
| Occupation | Male | Female |
| Management | 189 (53.1%) | 167 (46.9%) |
| Business & Financial | 0 (0.0%) | 25 (100.0%) |
| Computers, Engineering & Science | 68 (79.1%) | 18 (20.9%) |
| Computers & Mathematics | 44 (81.5%) | 10 (18.5%) |
| Architecture & Engineering | 10 (100.0%) | 0 (0.0%) |
| Life, Physical & Social Science | 14 (63.6%) | 8 (36.4%) |
| Community & Social Service | 313 (44.8%) | 386 (55.2%) |
| Education, Arts & Media | 31 (68.9%) | 14 (31.1%) |
| Legal Services & Support | 0 (0.0%) | 0 (0.0%) |
| Education Instruction & Library | 239 (42.0%) | 330 (58.0%) |
| Arts, Media & Entertainment | 43 (50.6%) | 42 (49.4%) |
| Health Diagnosing & Treating | 73 (72.3%) | 28 (27.7%) |
| Health Technologists | 50 (84.8%) | 9 (15.2%) |
| Total (Category) | 643 (50.7%) | 624 (49.2%) |
| Total (Overall) | 2,059 (49.1%) | 2,132 (50.9%) |
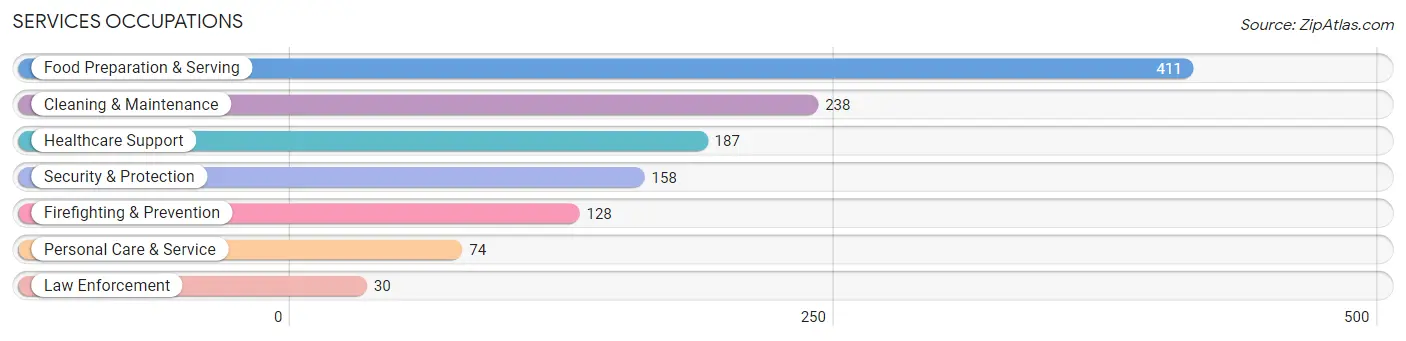
Services Occupations
The most common Services occupations in Commerce are Food Preparation & Serving (411 | 9.8%), Cleaning & Maintenance (238 | 5.7%), Healthcare Support (187 | 4.5%), Security & Protection (158 | 3.8%), and Firefighting & Prevention (128 | 3.0%).
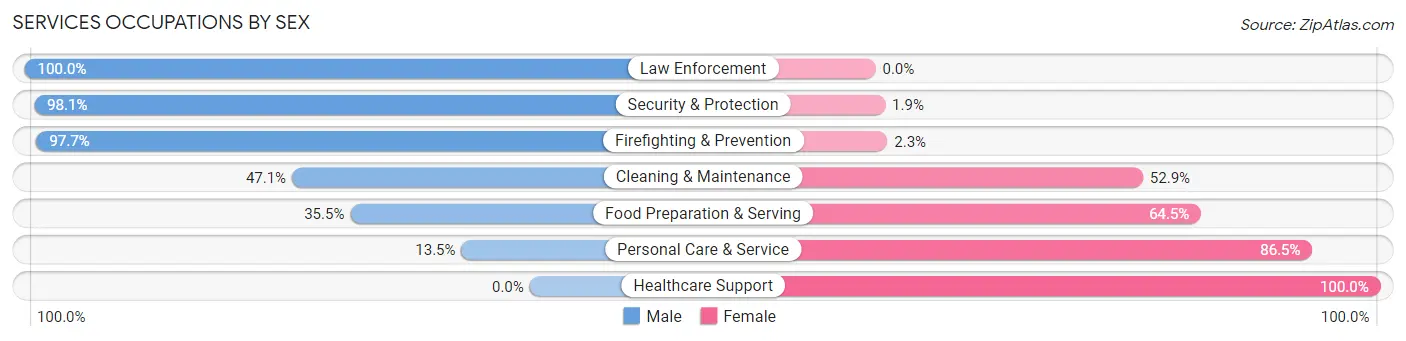
Services Occupations by Sex
Within the Services occupations in Commerce, the most male-oriented occupations are Law Enforcement (100.0%), Security & Protection (98.1%), and Firefighting & Prevention (97.7%), while the most female-oriented occupations are Healthcare Support (100.0%), Personal Care & Service (86.5%), and Food Preparation & Serving (64.5%).
| Occupation | Male | Female |
| Healthcare Support | 0 (0.0%) | 187 (100.0%) |
| Security & Protection | 155 (98.1%) | 3 (1.9%) |
| Firefighting & Prevention | 125 (97.7%) | 3 (2.3%) |
| Law Enforcement | 30 (100.0%) | 0 (0.0%) |
| Food Preparation & Serving | 146 (35.5%) | 265 (64.5%) |
| Cleaning & Maintenance | 112 (47.1%) | 126 (52.9%) |
| Personal Care & Service | 10 (13.5%) | 64 (86.5%) |
| Total (Category) | 423 (39.6%) | 645 (60.4%) |
| Total (Overall) | 2,059 (49.1%) | 2,132 (50.9%) |
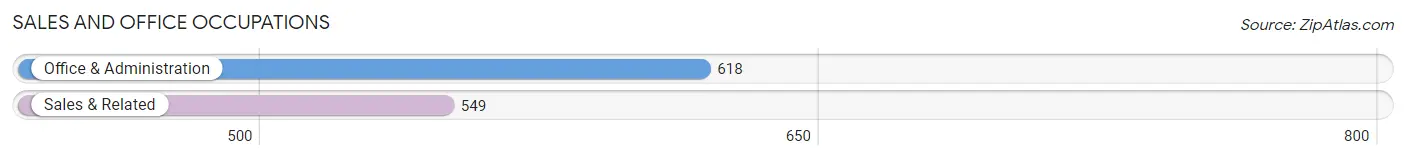
Sales and Office Occupations
The most common Sales and Office occupations in Commerce are Office & Administration (618 | 14.7%), and Sales & Related (549 | 13.1%).
Sales and Office Occupations by Sex
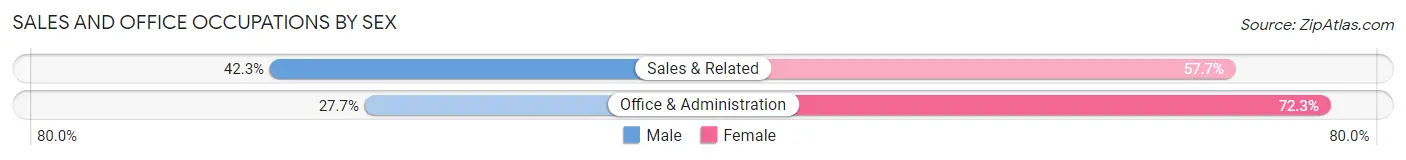
| Occupation | Male | Female |
| Sales & Related | 232 (42.3%) | 317 (57.7%) |
| Office & Administration | 171 (27.7%) | 447 (72.3%) |
| Total (Category) | 403 (34.5%) | 764 (65.5%) |
| Total (Overall) | 2,059 (49.1%) | 2,132 (50.9%) |
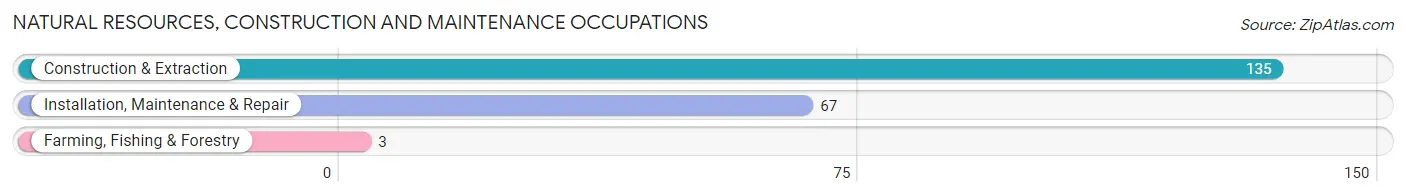
Natural Resources, Construction and Maintenance Occupations
The most common Natural Resources, Construction and Maintenance occupations in Commerce are Construction & Extraction (135 | 3.2%), Installation, Maintenance & Repair (67 | 1.6%), and Farming, Fishing & Forestry (3 | 0.1%).
Natural Resources, Construction and Maintenance Occupations by Sex
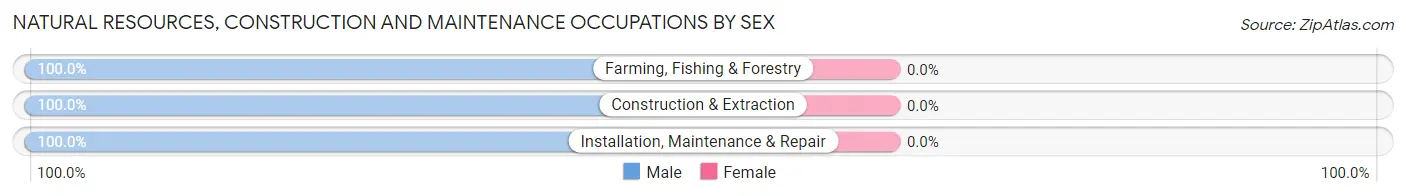
| Occupation | Male | Female |
| Farming, Fishing & Forestry | 3 (100.0%) | 0 (0.0%) |
| Construction & Extraction | 135 (100.0%) | 0 (0.0%) |
| Installation, Maintenance & Repair | 67 (100.0%) | 0 (0.0%) |
| Total (Category) | 205 (100.0%) | 0 (0.0%) |
| Total (Overall) | 2,059 (49.1%) | 2,132 (50.9%) |
Production, Transportation and Moving Occupations
The most common Production, Transportation and Moving occupations in Commerce are Production (221 | 5.3%), Transportation (149 | 3.6%), and Material Moving (114 | 2.7%).
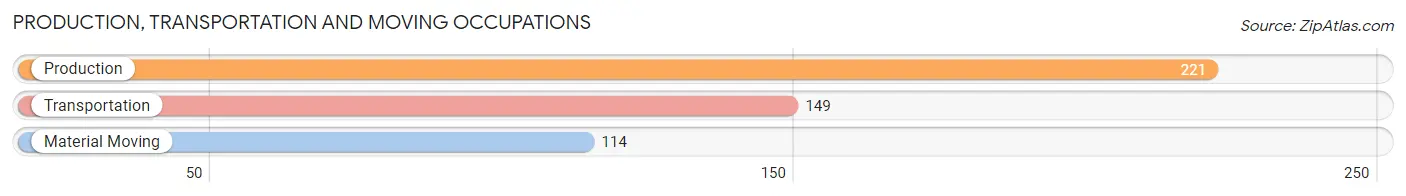
Production, Transportation and Moving Occupations by Sex
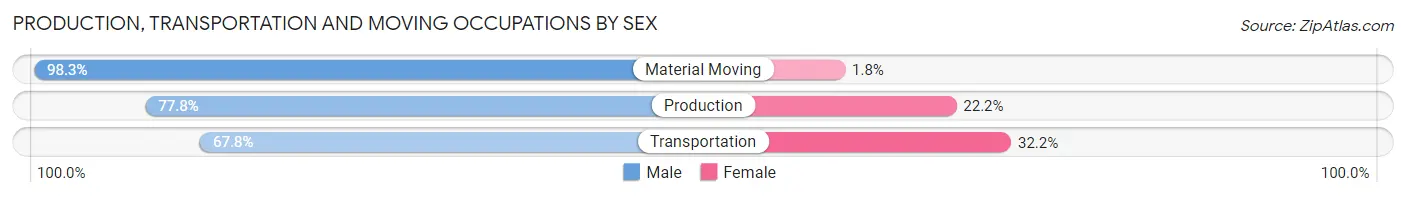
| Occupation | Male | Female |
| Production | 172 (77.8%) | 49 (22.2%) |
| Transportation | 101 (67.8%) | 48 (32.2%) |
| Material Moving | 112 (98.3%) | 2 (1.8%) |
| Total (Category) | 385 (79.5%) | 99 (20.4%) |
| Total (Overall) | 2,059 (49.1%) | 2,132 (50.9%) |
Employment Industries by Sex in Commerce
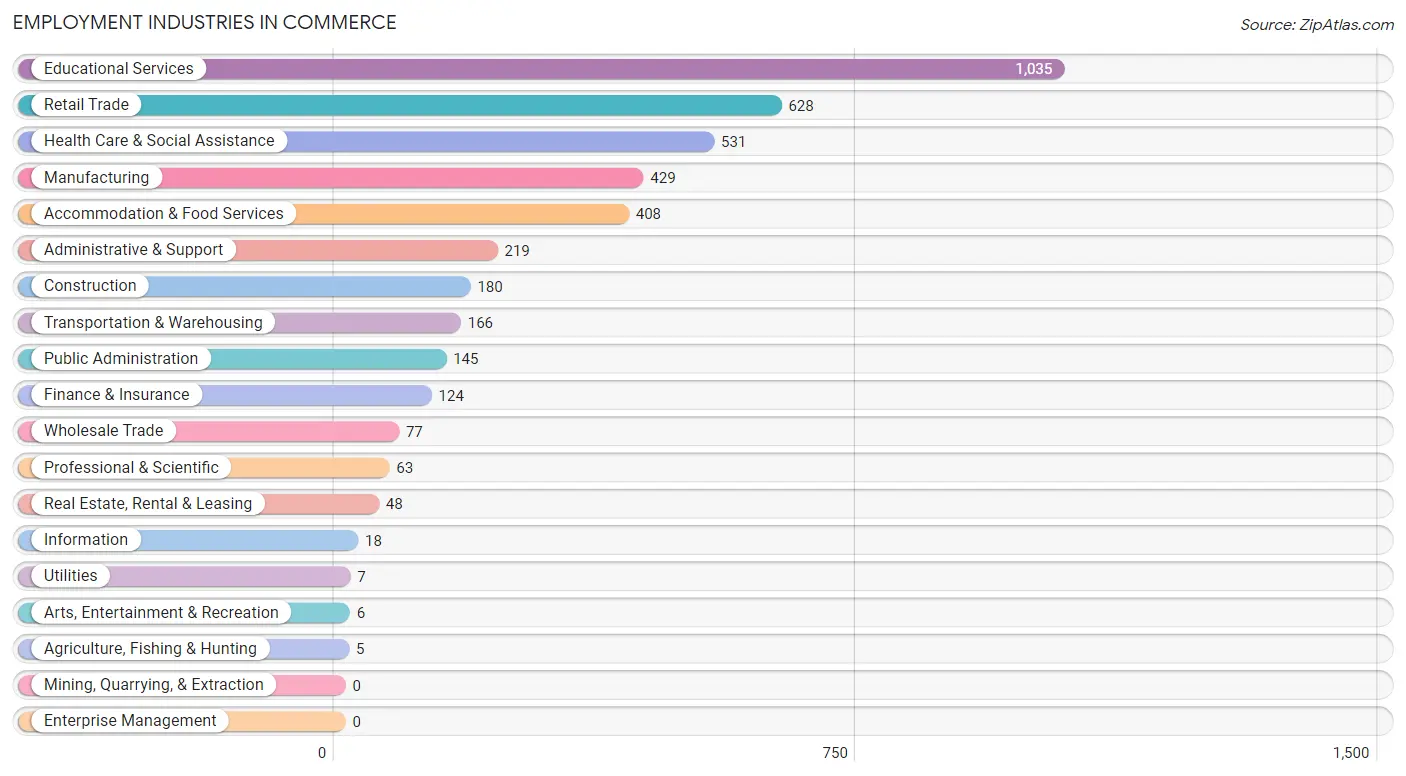
Employment Industries in Commerce
The major employment industries in Commerce include Educational Services (1,035 | 24.7%), Retail Trade (628 | 15.0%), Health Care & Social Assistance (531 | 12.7%), Manufacturing (429 | 10.2%), and Accommodation & Food Services (408 | 9.7%).
Employment Industries by Sex in Commerce
The Commerce industries that see more men than women are Agriculture, Fishing & Hunting (100.0%), Utilities (100.0%), and Construction (93.9%), whereas the industries that tend to have a higher number of women are Finance & Insurance (90.3%), Real Estate, Rental & Leasing (83.3%), and Health Care & Social Assistance (81.4%).
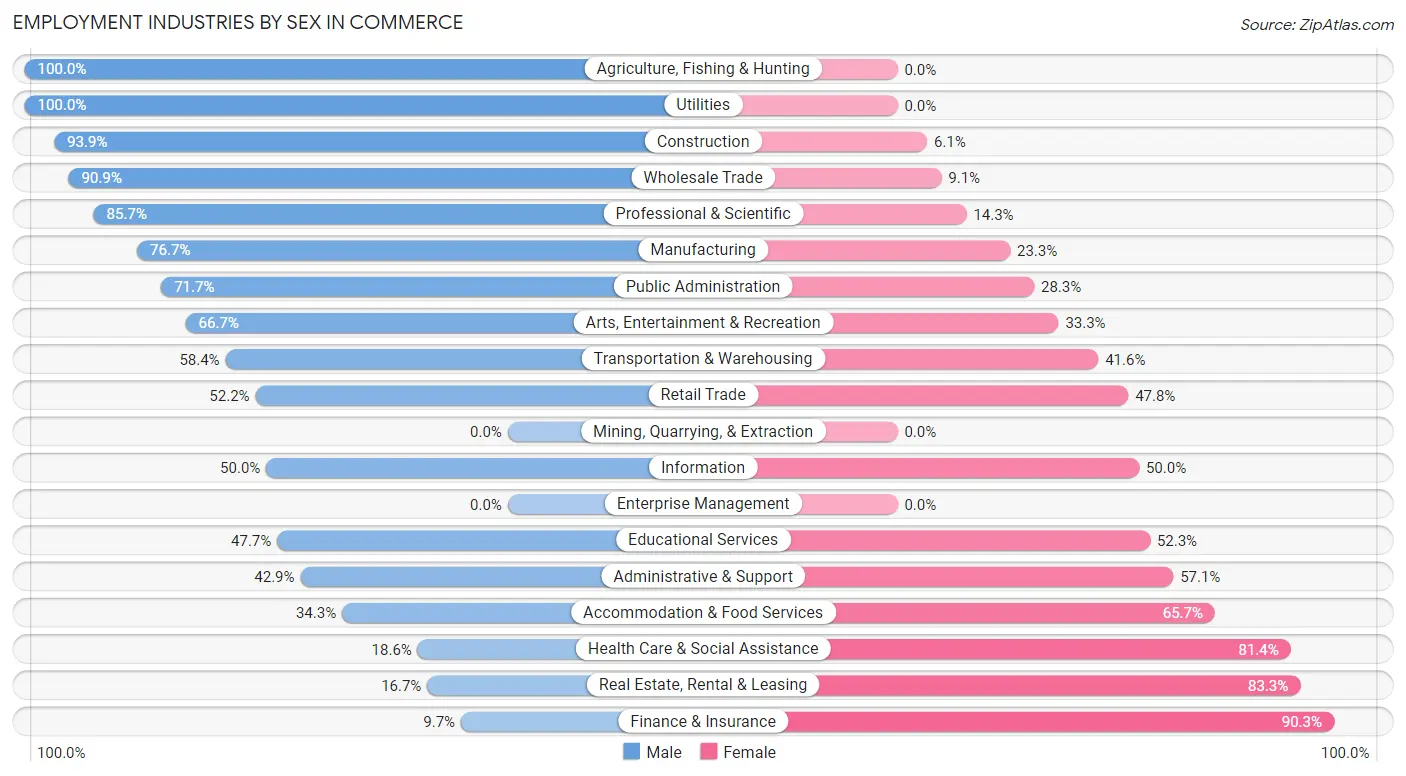
| Industry | Male | Female |
| Agriculture, Fishing & Hunting | 5 (100.0%) | 0 (0.0%) |
| Mining, Quarrying, & Extraction | 0 (0.0%) | 0 (0.0%) |
| Construction | 169 (93.9%) | 11 (6.1%) |
| Manufacturing | 329 (76.7%) | 100 (23.3%) |
| Wholesale Trade | 70 (90.9%) | 7 (9.1%) |
| Retail Trade | 328 (52.2%) | 300 (47.8%) |
| Transportation & Warehousing | 97 (58.4%) | 69 (41.6%) |
| Utilities | 7 (100.0%) | 0 (0.0%) |
| Information | 9 (50.0%) | 9 (50.0%) |
| Finance & Insurance | 12 (9.7%) | 112 (90.3%) |
| Real Estate, Rental & Leasing | 8 (16.7%) | 40 (83.3%) |
| Professional & Scientific | 54 (85.7%) | 9 (14.3%) |
| Enterprise Management | 0 (0.0%) | 0 (0.0%) |
| Administrative & Support | 94 (42.9%) | 125 (57.1%) |
| Educational Services | 494 (47.7%) | 541 (52.3%) |
| Health Care & Social Assistance | 99 (18.6%) | 432 (81.4%) |
| Arts, Entertainment & Recreation | 4 (66.7%) | 2 (33.3%) |
| Accommodation & Food Services | 140 (34.3%) | 268 (65.7%) |
| Public Administration | 104 (71.7%) | 41 (28.3%) |
| Total | 2,059 (49.1%) | 2,132 (50.9%) |
Education in Commerce
School Enrollment in Commerce
The most common levels of schooling among the 3,986 students in Commerce are college / undergraduate (2,495 | 62.6%), graduate / professional (407 | 10.2%), and middle school (365 | 9.2%).
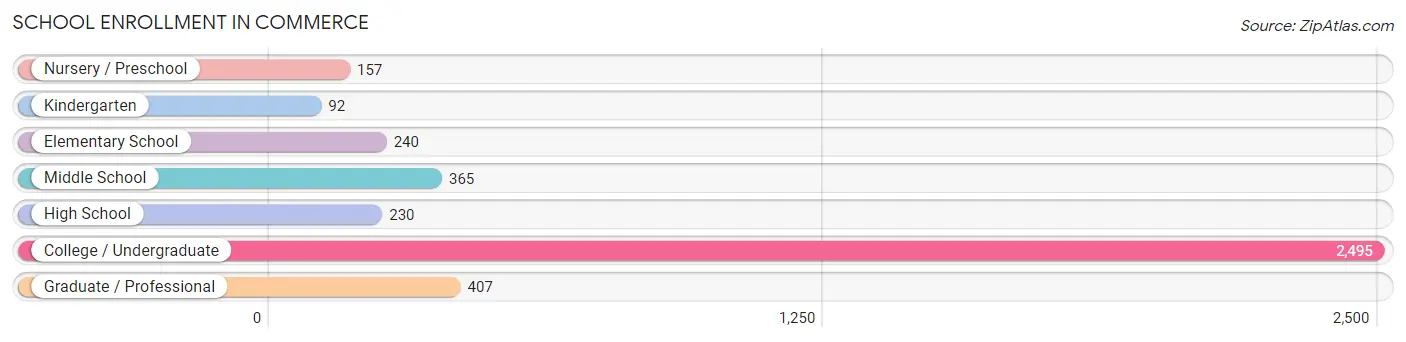
| School Level | # Students | % Students |
| Nursery / Preschool | 157 | 3.9% |
| Kindergarten | 92 | 2.3% |
| Elementary School | 240 | 6.0% |
| Middle School | 365 | 9.2% |
| High School | 230 | 5.8% |
| College / Undergraduate | 2,495 | 62.6% |
| Graduate / Professional | 407 | 10.2% |
| Total | 3,986 | 100.0% |
School Enrollment by Age by Funding Source in Commerce
Out of a total of 3,986 students who are enrolled in schools in Commerce, 574 (14.4%) attend a private institution, while the remaining 3,412 (85.6%) are enrolled in public schools. The age group of 18 to 19 year olds has the highest likelihood of being enrolled in private schools, with 274 (23.3% in the age bracket) enrolled. Conversely, the age group of 3 to 4 year olds has the lowest likelihood of being enrolled in a private school, with 15 (100.0% in the age bracket) attending a public institution.
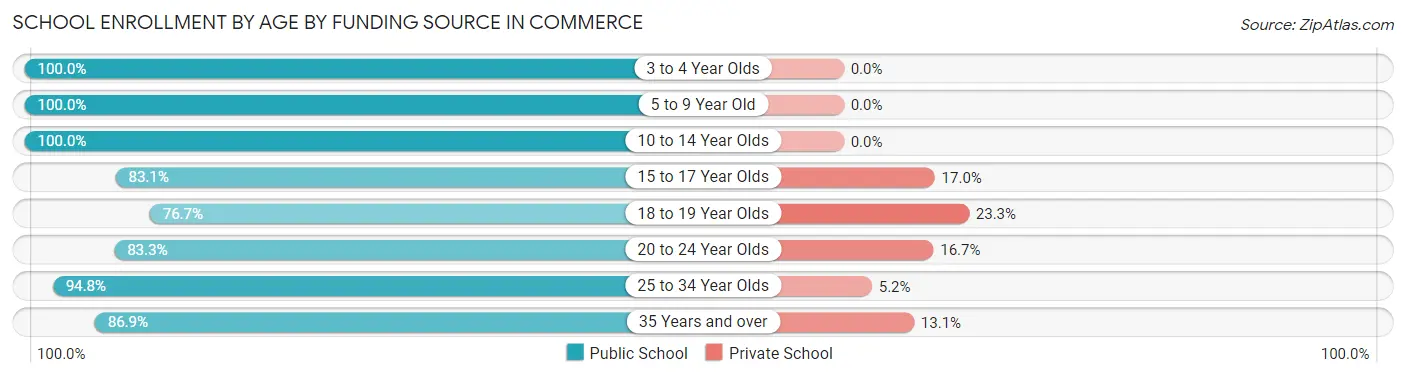
| Age Bracket | Public School | Private School |
| 3 to 4 Year Olds | 15 (100.0%) | 0 (0.0%) |
| 5 to 9 Year Old | 428 (100.0%) | 0 (0.0%) |
| 10 to 14 Year Olds | 421 (100.0%) | 0 (0.0%) |
| 15 to 17 Year Olds | 147 (83.1%) | 30 (17.0%) |
| 18 to 19 Year Olds | 901 (76.7%) | 274 (23.3%) |
| 20 to 24 Year Olds | 1,207 (83.3%) | 242 (16.7%) |
| 25 to 34 Year Olds | 181 (94.8%) | 10 (5.2%) |
| 35 Years and over | 113 (86.9%) | 17 (13.1%) |
| Total | 3,412 (85.6%) | 574 (14.4%) |
Educational Attainment by Field of Study in Commerce
Education (260 | 19.4%), arts & humanities (204 | 15.2%), business (157 | 11.7%), physical & health sciences (116 | 8.7%), and liberal arts & history (107 | 8.0%) are the most common fields of study among 1,339 individuals in Commerce who have obtained a bachelor's degree or higher.
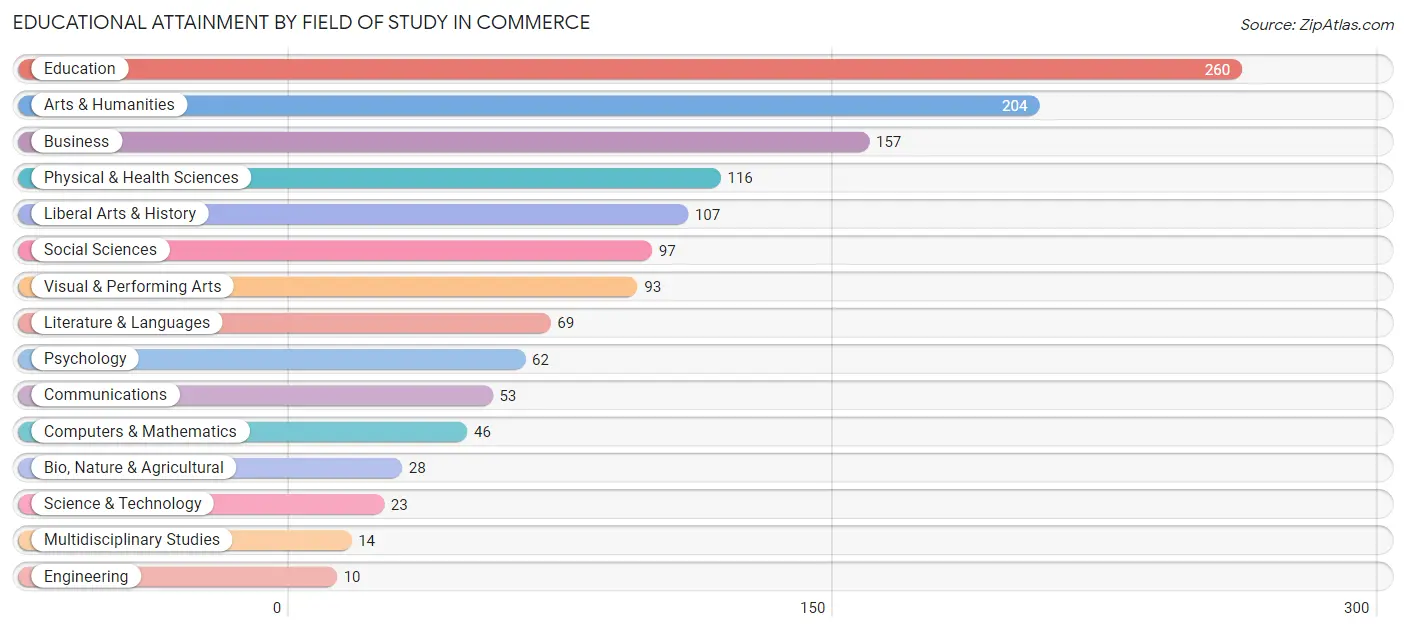
| Field of Study | # Graduates | % Graduates |
| Computers & Mathematics | 46 | 3.4% |
| Bio, Nature & Agricultural | 28 | 2.1% |
| Physical & Health Sciences | 116 | 8.7% |
| Psychology | 62 | 4.6% |
| Social Sciences | 97 | 7.2% |
| Engineering | 10 | 0.7% |
| Multidisciplinary Studies | 14 | 1.1% |
| Science & Technology | 23 | 1.7% |
| Business | 157 | 11.7% |
| Education | 260 | 19.4% |
| Literature & Languages | 69 | 5.1% |
| Liberal Arts & History | 107 | 8.0% |
| Visual & Performing Arts | 93 | 7.0% |
| Communications | 53 | 4.0% |
| Arts & Humanities | 204 | 15.2% |
| Total | 1,339 | 100.0% |
Transportation & Commute in Commerce
Vehicle Availability by Sex in Commerce
The most prevalent vehicle ownership categories in Commerce are males with 2 vehicles (713, accounting for 42.7%) and females with 2 vehicles (820, making up 41.6%).
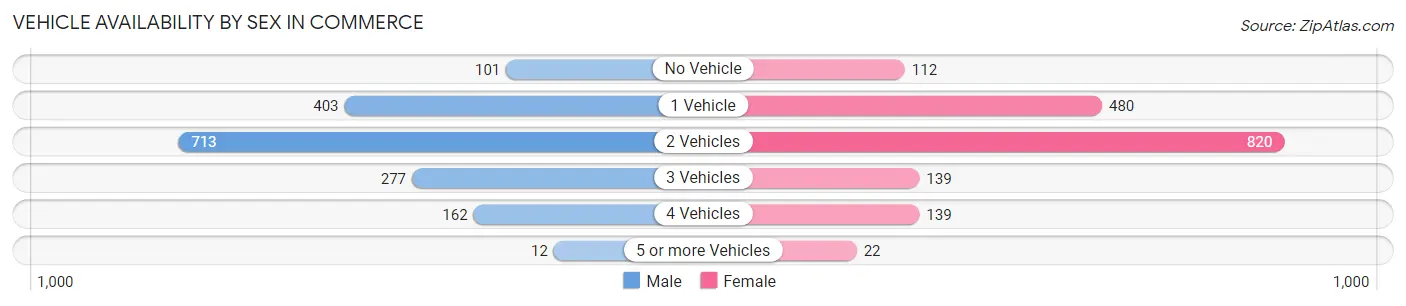
| Vehicles Available | Male | Female |
| No Vehicle | 101 (6.1%) | 112 (6.5%) |
| 1 Vehicle | 403 (24.2%) | 480 (28.0%) |
| 2 Vehicles | 713 (42.7%) | 820 (47.9%) |
| 3 Vehicles | 277 (16.6%) | 139 (8.1%) |
| 4 Vehicles | 162 (9.7%) | 139 (8.1%) |
| 5 or more Vehicles | 12 (0.7%) | 22 (1.3%) |
| Total | 1,668 (100.0%) | 1,712 (100.0%) |
Commute Time in Commerce
The most frequently occuring commute durations in Commerce are 5 to 9 minutes (1,379 commuters, 35.6%), 10 to 14 minutes (438 commuters, 11.3%), and 20 to 24 minutes (410 commuters, 10.6%).
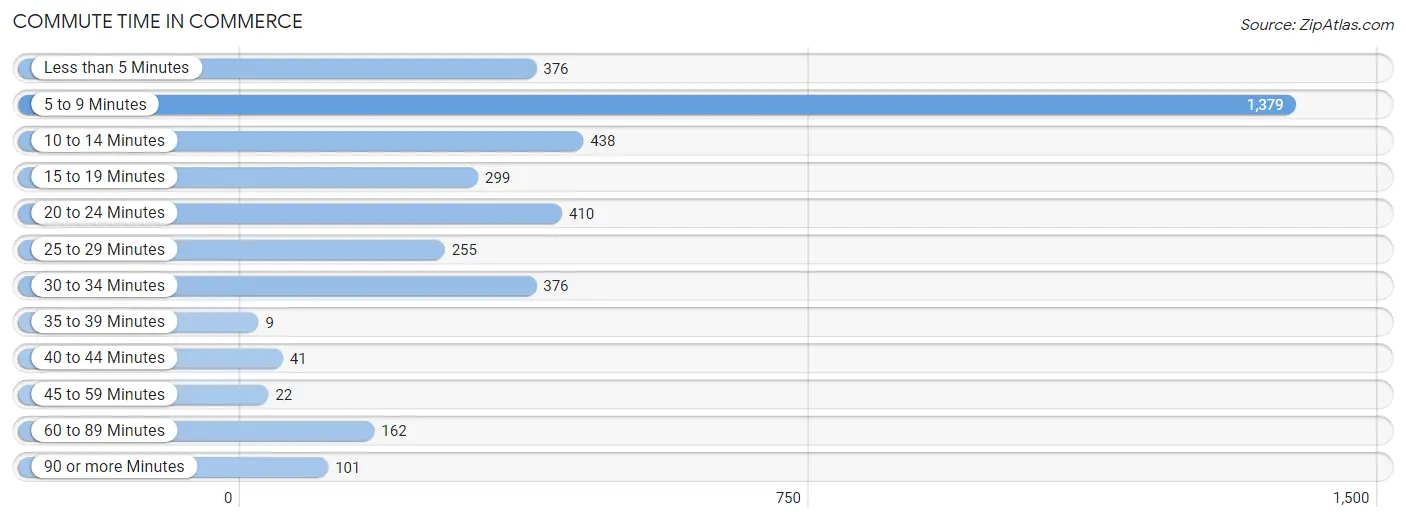
| Commute Time | # Commuters | % Commuters |
| Less than 5 Minutes | 376 | 9.7% |
| 5 to 9 Minutes | 1,379 | 35.6% |
| 10 to 14 Minutes | 438 | 11.3% |
| 15 to 19 Minutes | 299 | 7.7% |
| 20 to 24 Minutes | 410 | 10.6% |
| 25 to 29 Minutes | 255 | 6.6% |
| 30 to 34 Minutes | 376 | 9.7% |
| 35 to 39 Minutes | 9 | 0.2% |
| 40 to 44 Minutes | 41 | 1.1% |
| 45 to 59 Minutes | 22 | 0.6% |
| 60 to 89 Minutes | 162 | 4.2% |
| 90 or more Minutes | 101 | 2.6% |
Commute Time by Sex in Commerce
The most common commute times in Commerce are 5 to 9 minutes (600 commuters, 31.9%) for males and 5 to 9 minutes (779 commuters, 39.2%) for females.
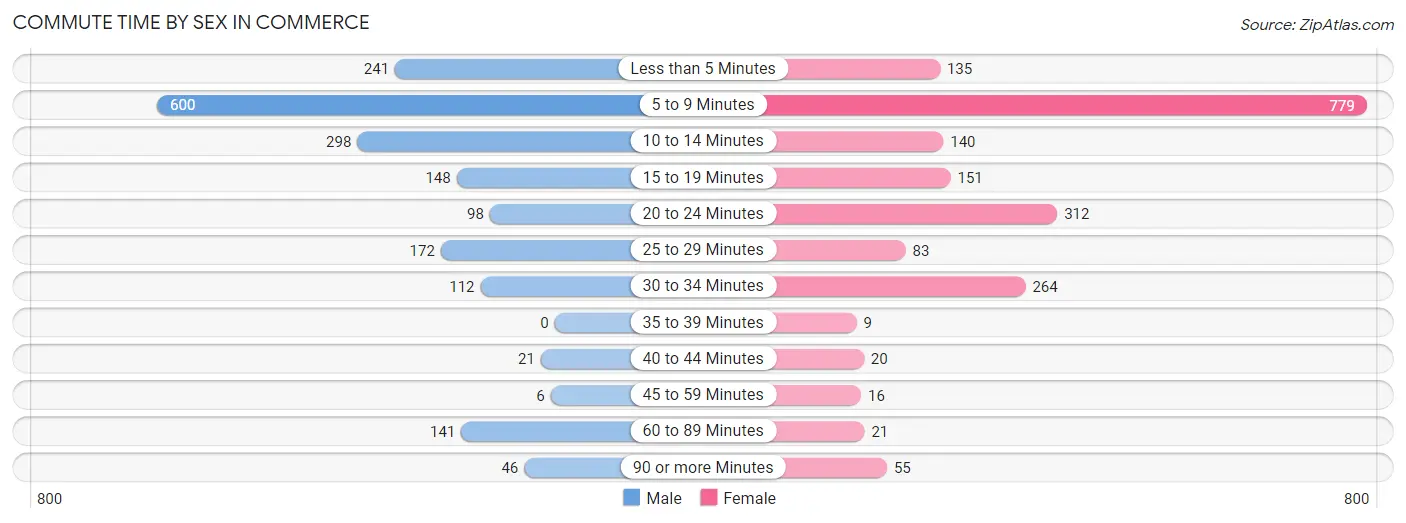
| Commute Time | Male | Female |
| Less than 5 Minutes | 241 (12.8%) | 135 (6.8%) |
| 5 to 9 Minutes | 600 (31.9%) | 779 (39.2%) |
| 10 to 14 Minutes | 298 (15.8%) | 140 (7.0%) |
| 15 to 19 Minutes | 148 (7.9%) | 151 (7.6%) |
| 20 to 24 Minutes | 98 (5.2%) | 312 (15.7%) |
| 25 to 29 Minutes | 172 (9.1%) | 83 (4.2%) |
| 30 to 34 Minutes | 112 (5.9%) | 264 (13.3%) |
| 35 to 39 Minutes | 0 (0.0%) | 9 (0.4%) |
| 40 to 44 Minutes | 21 (1.1%) | 20 (1.0%) |
| 45 to 59 Minutes | 6 (0.3%) | 16 (0.8%) |
| 60 to 89 Minutes | 141 (7.5%) | 21 (1.1%) |
| 90 or more Minutes | 46 (2.4%) | 55 (2.8%) |
Time of Departure to Work by Sex in Commerce
The most frequent times of departure to work in Commerce are 6:30 AM to 6:59 AM (278, 14.8%) for males and 7:30 AM to 7:59 AM (352, 17.7%) for females.
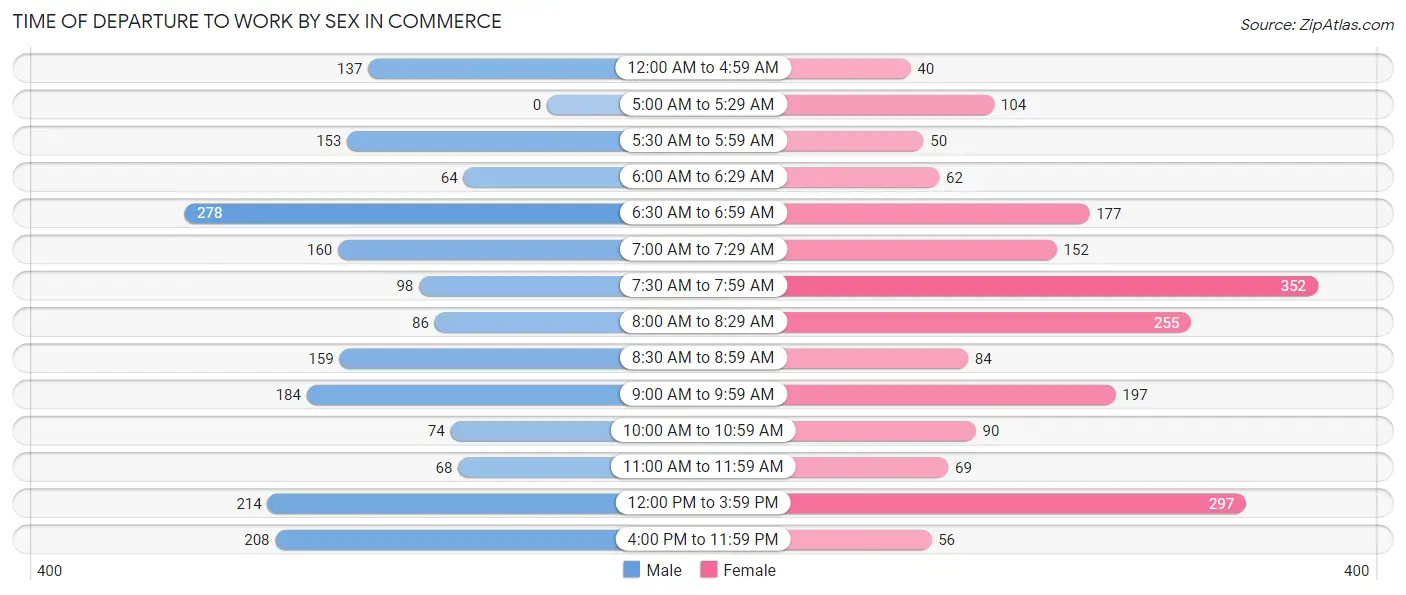
| Time of Departure | Male | Female |
| 12:00 AM to 4:59 AM | 137 (7.3%) | 40 (2.0%) |
| 5:00 AM to 5:29 AM | 0 (0.0%) | 104 (5.2%) |
| 5:30 AM to 5:59 AM | 153 (8.1%) | 50 (2.5%) |
| 6:00 AM to 6:29 AM | 64 (3.4%) | 62 (3.1%) |
| 6:30 AM to 6:59 AM | 278 (14.8%) | 177 (8.9%) |
| 7:00 AM to 7:29 AM | 160 (8.5%) | 152 (7.7%) |
| 7:30 AM to 7:59 AM | 98 (5.2%) | 352 (17.7%) |
| 8:00 AM to 8:29 AM | 86 (4.6%) | 255 (12.9%) |
| 8:30 AM to 8:59 AM | 159 (8.4%) | 84 (4.2%) |
| 9:00 AM to 9:59 AM | 184 (9.8%) | 197 (9.9%) |
| 10:00 AM to 10:59 AM | 74 (3.9%) | 90 (4.5%) |
| 11:00 AM to 11:59 AM | 68 (3.6%) | 69 (3.5%) |
| 12:00 PM to 3:59 PM | 214 (11.4%) | 297 (15.0%) |
| 4:00 PM to 11:59 PM | 208 (11.1%) | 56 (2.8%) |
| Total | 1,883 (100.0%) | 1,985 (100.0%) |
Housing Occupancy in Commerce
Occupancy by Ownership in Commerce
Of the total 3,004 dwellings in Commerce, owner-occupied units account for 1,189 (39.6%), while renter-occupied units make up 1,815 (60.4%).
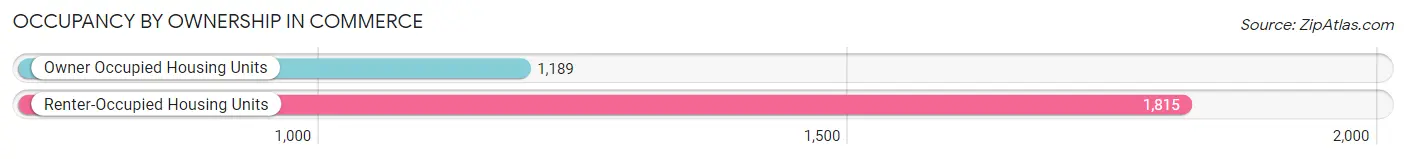
| Occupancy | # Housing Units | % Housing Units |
| Owner Occupied Housing Units | 1,189 | 39.6% |
| Renter-Occupied Housing Units | 1,815 | 60.4% |
| Total Occupied Housing Units | 3,004 | 100.0% |
Occupancy by Household Size in Commerce
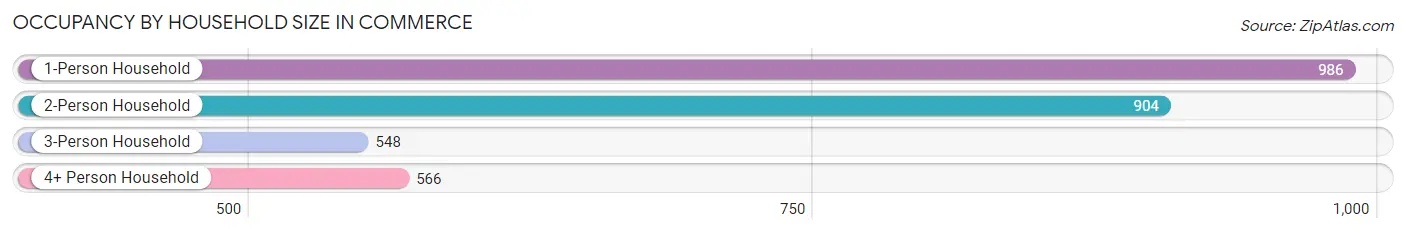
| Household Size | # Housing Units | % Housing Units |
| 1-Person Household | 986 | 32.8% |
| 2-Person Household | 904 | 30.1% |
| 3-Person Household | 548 | 18.2% |
| 4+ Person Household | 566 | 18.8% |
| Total Housing Units | 3,004 | 100.0% |
Occupancy by Ownership by Household Size in Commerce
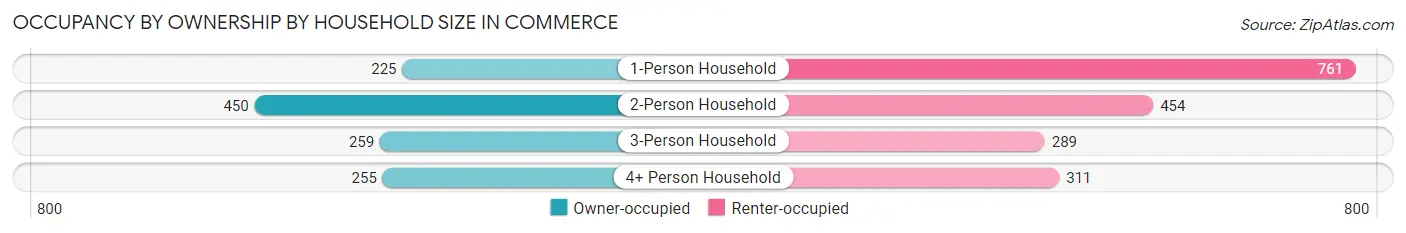
| Household Size | Owner-occupied | Renter-occupied |
| 1-Person Household | 225 (22.8%) | 761 (77.2%) |
| 2-Person Household | 450 (49.8%) | 454 (50.2%) |
| 3-Person Household | 259 (47.3%) | 289 (52.7%) |
| 4+ Person Household | 255 (45.1%) | 311 (54.9%) |
| Total Housing Units | 1,189 (39.6%) | 1,815 (60.4%) |
Occupancy by Educational Attainment in Commerce
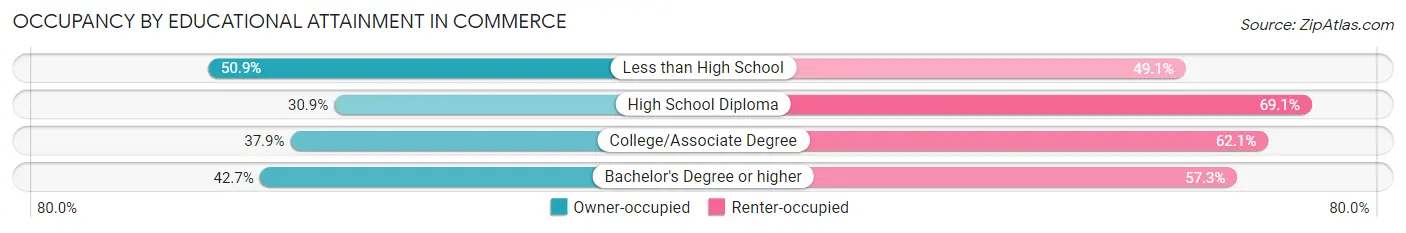
| Household Size | Owner-occupied | Renter-occupied |
| Less than High School | 193 (50.9%) | 186 (49.1%) |
| High School Diploma | 192 (30.9%) | 429 (69.1%) |
| College/Associate Degree | 407 (37.9%) | 668 (62.1%) |
| Bachelor's Degree or higher | 397 (42.7%) | 532 (57.3%) |
Occupancy by Age of Householder in Commerce
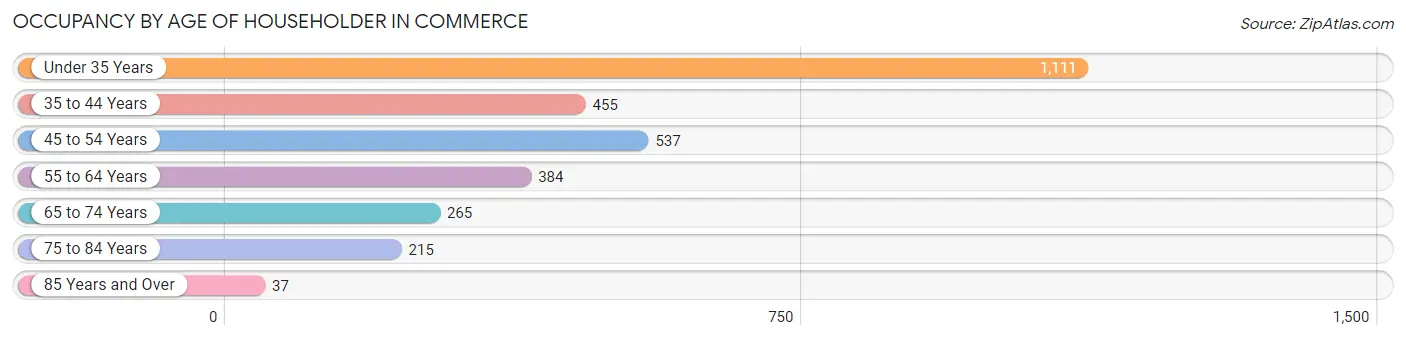
| Age Bracket | # Households | % Households |
| Under 35 Years | 1,111 | 37.0% |
| 35 to 44 Years | 455 | 15.1% |
| 45 to 54 Years | 537 | 17.9% |
| 55 to 64 Years | 384 | 12.8% |
| 65 to 74 Years | 265 | 8.8% |
| 75 to 84 Years | 215 | 7.2% |
| 85 Years and Over | 37 | 1.2% |
| Total | 3,004 | 100.0% |
Housing Finances in Commerce
Median Income by Occupancy in Commerce
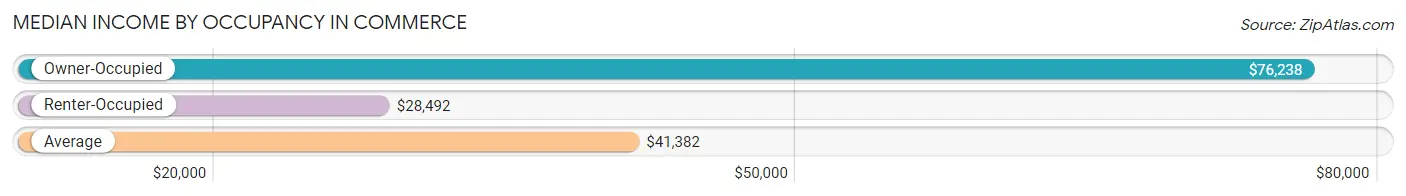
| Occupancy Type | # Households | Median Income |
| Owner-Occupied | 1,189 (39.6%) | $76,238 |
| Renter-Occupied | 1,815 (60.4%) | $28,492 |
| Average | 3,004 (100.0%) | $41,382 |
Occupancy by Householder Income Bracket in Commerce
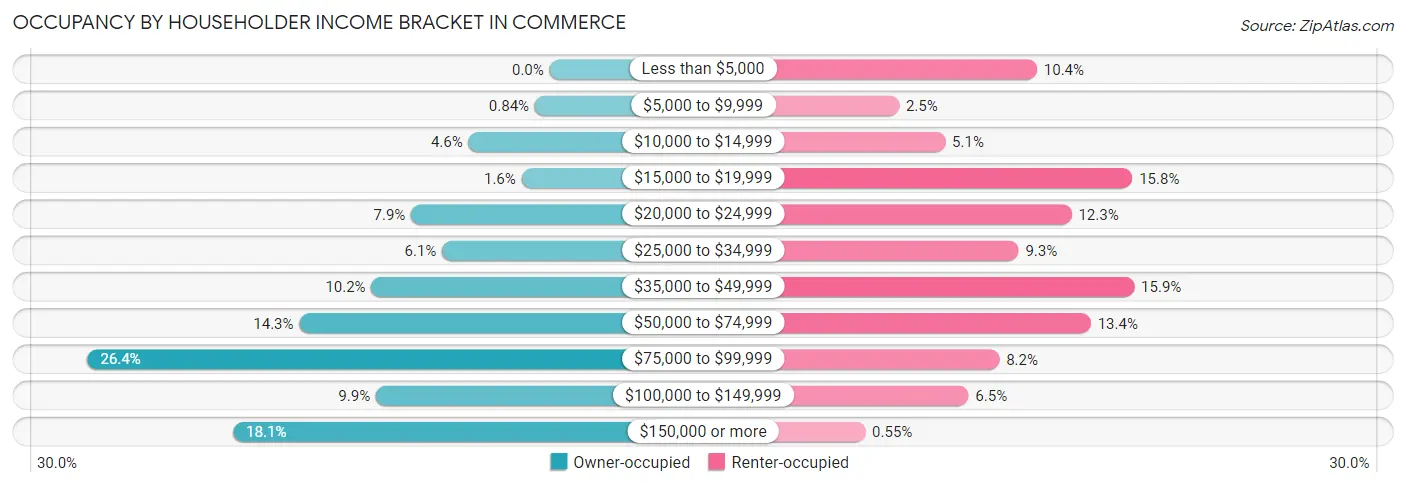
| Income Bracket | Owner-occupied | Renter-occupied |
| Less than $5,000 | 0 (0.0%) | 188 (10.4%) |
| $5,000 to $9,999 | 10 (0.8%) | 45 (2.5%) |
| $10,000 to $14,999 | 55 (4.6%) | 93 (5.1%) |
| $15,000 to $19,999 | 19 (1.6%) | 287 (15.8%) |
| $20,000 to $24,999 | 94 (7.9%) | 224 (12.3%) |
| $25,000 to $34,999 | 73 (6.1%) | 169 (9.3%) |
| $35,000 to $49,999 | 121 (10.2%) | 289 (15.9%) |
| $50,000 to $74,999 | 170 (14.3%) | 244 (13.4%) |
| $75,000 to $99,999 | 314 (26.4%) | 149 (8.2%) |
| $100,000 to $149,999 | 118 (9.9%) | 117 (6.5%) |
| $150,000 or more | 215 (18.1%) | 10 (0.5%) |
| Total | 1,189 (100.0%) | 1,815 (100.0%) |
Monthly Housing Cost Tiers in Commerce
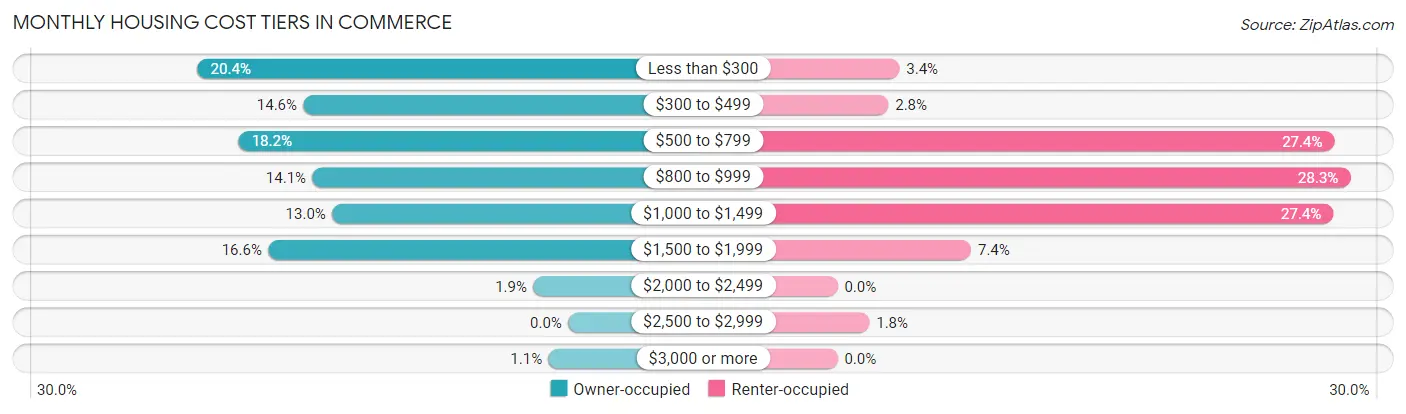
| Monthly Cost | Owner-occupied | Renter-occupied |
| Less than $300 | 243 (20.4%) | 62 (3.4%) |
| $300 to $499 | 174 (14.6%) | 51 (2.8%) |
| $500 to $799 | 216 (18.2%) | 498 (27.4%) |
| $800 to $999 | 168 (14.1%) | 514 (28.3%) |
| $1,000 to $1,499 | 155 (13.0%) | 497 (27.4%) |
| $1,500 to $1,999 | 197 (16.6%) | 134 (7.4%) |
| $2,000 to $2,499 | 23 (1.9%) | 0 (0.0%) |
| $2,500 to $2,999 | 0 (0.0%) | 32 (1.8%) |
| $3,000 or more | 13 (1.1%) | 0 (0.0%) |
| Total | 1,189 (100.0%) | 1,815 (100.0%) |
Physical Housing Characteristics in Commerce
Housing Structures in Commerce
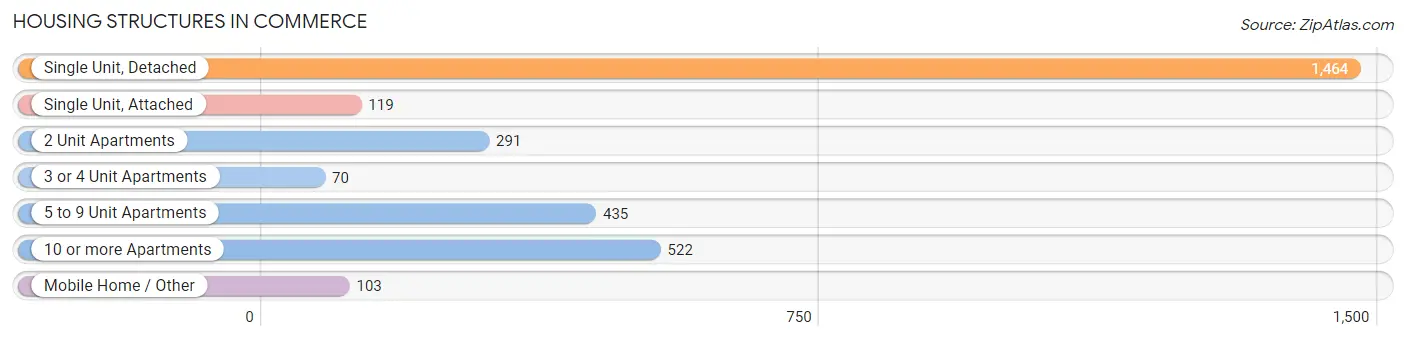
| Structure Type | # Housing Units | % Housing Units |
| Single Unit, Detached | 1,464 | 48.7% |
| Single Unit, Attached | 119 | 4.0% |
| 2 Unit Apartments | 291 | 9.7% |
| 3 or 4 Unit Apartments | 70 | 2.3% |
| 5 to 9 Unit Apartments | 435 | 14.5% |
| 10 or more Apartments | 522 | 17.4% |
| Mobile Home / Other | 103 | 3.4% |
| Total | 3,004 | 100.0% |
Housing Structures by Occupancy in Commerce
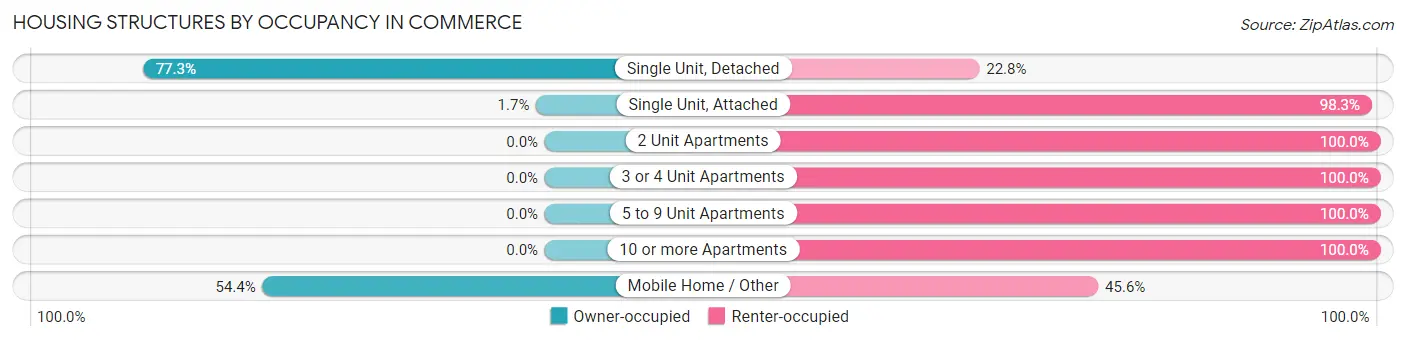
| Structure Type | Owner-occupied | Renter-occupied |
| Single Unit, Detached | 1,131 (77.2%) | 333 (22.8%) |
| Single Unit, Attached | 2 (1.7%) | 117 (98.3%) |
| 2 Unit Apartments | 0 (0.0%) | 291 (100.0%) |
| 3 or 4 Unit Apartments | 0 (0.0%) | 70 (100.0%) |
| 5 to 9 Unit Apartments | 0 (0.0%) | 435 (100.0%) |
| 10 or more Apartments | 0 (0.0%) | 522 (100.0%) |
| Mobile Home / Other | 56 (54.4%) | 47 (45.6%) |
| Total | 1,189 (39.6%) | 1,815 (60.4%) |
Housing Structures by Number of Rooms in Commerce
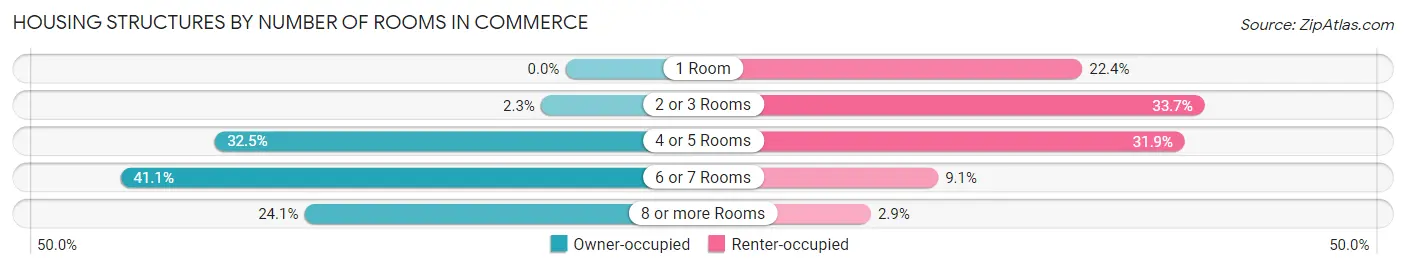
| Number of Rooms | Owner-occupied | Renter-occupied |
| 1 Room | 0 (0.0%) | 407 (22.4%) |
| 2 or 3 Rooms | 27 (2.3%) | 612 (33.7%) |
| 4 or 5 Rooms | 386 (32.5%) | 579 (31.9%) |
| 6 or 7 Rooms | 489 (41.1%) | 165 (9.1%) |
| 8 or more Rooms | 287 (24.1%) | 52 (2.9%) |
| Total | 1,189 (100.0%) | 1,815 (100.0%) |
Housing Structure by Heating Type in Commerce
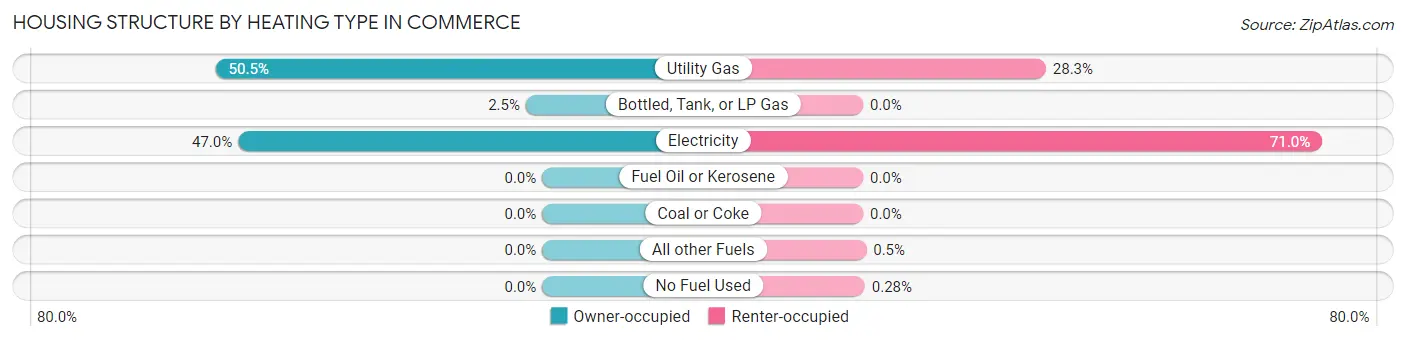
| Heating Type | Owner-occupied | Renter-occupied |
| Utility Gas | 600 (50.5%) | 513 (28.3%) |
| Bottled, Tank, or LP Gas | 30 (2.5%) | 0 (0.0%) |
| Electricity | 559 (47.0%) | 1,288 (71.0%) |
| Fuel Oil or Kerosene | 0 (0.0%) | 0 (0.0%) |
| Coal or Coke | 0 (0.0%) | 0 (0.0%) |
| All other Fuels | 0 (0.0%) | 9 (0.5%) |
| No Fuel Used | 0 (0.0%) | 5 (0.3%) |
| Total | 1,189 (100.0%) | 1,815 (100.0%) |
Household Vehicle Usage in Commerce
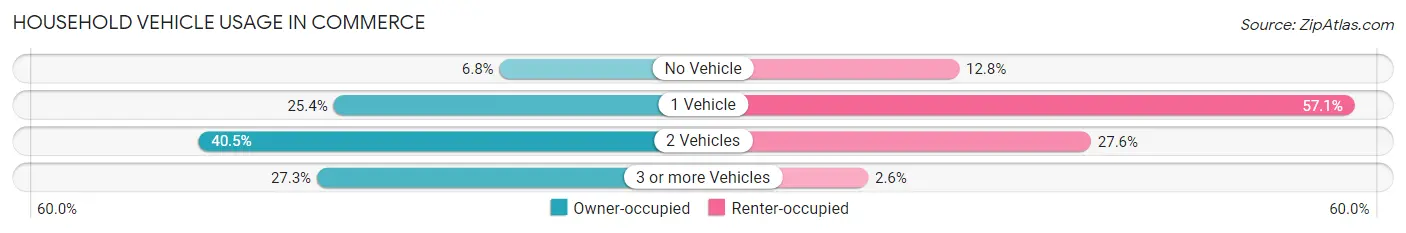
| Vehicles per Household | Owner-occupied | Renter-occupied |
| No Vehicle | 81 (6.8%) | 232 (12.8%) |
| 1 Vehicle | 302 (25.4%) | 1,036 (57.1%) |
| 2 Vehicles | 482 (40.5%) | 500 (27.6%) |
| 3 or more Vehicles | 324 (27.3%) | 47 (2.6%) |
| Total | 1,189 (100.0%) | 1,815 (100.0%) |
Real Estate & Mortgages in Commerce
Real Estate and Mortgage Overview in Commerce
| Characteristic | Without Mortgage | With Mortgage |
| Housing Units | 726 | 463 |
| Median Property Value | $85,000 | $172,900 |
| Median Household Income | $75,259 | $160 |
| Monthly Housing Costs | $430 | $13 |
| Real Estate Taxes | $1,455 | $68 |
Property Value by Mortgage Status in Commerce
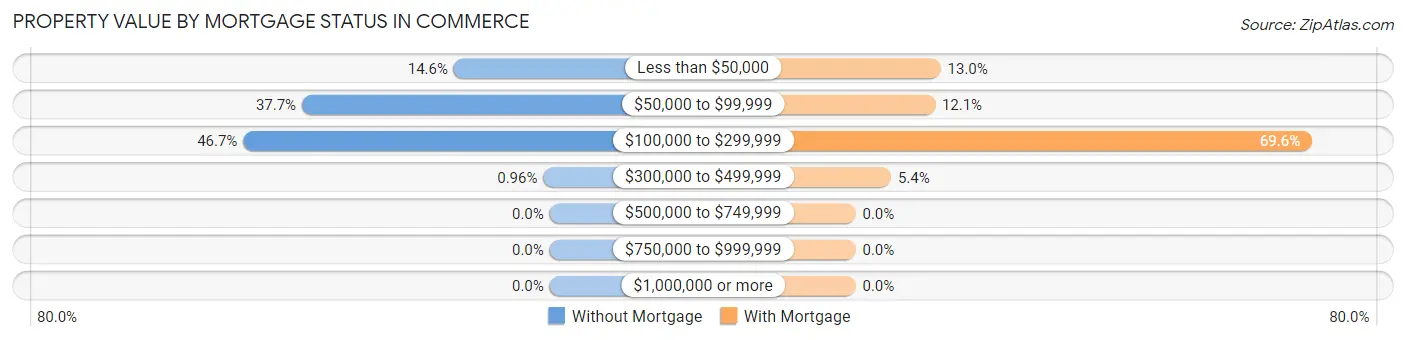
| Property Value | Without Mortgage | With Mortgage |
| Less than $50,000 | 106 (14.6%) | 60 (13.0%) |
| $50,000 to $99,999 | 274 (37.7%) | 56 (12.1%) |
| $100,000 to $299,999 | 339 (46.7%) | 322 (69.6%) |
| $300,000 to $499,999 | 7 (1.0%) | 25 (5.4%) |
| $500,000 to $749,999 | 0 (0.0%) | 0 (0.0%) |
| $750,000 to $999,999 | 0 (0.0%) | 0 (0.0%) |
| $1,000,000 or more | 0 (0.0%) | 0 (0.0%) |
| Total | 726 (100.0%) | 463 (100.0%) |
Household Income by Mortgage Status in Commerce
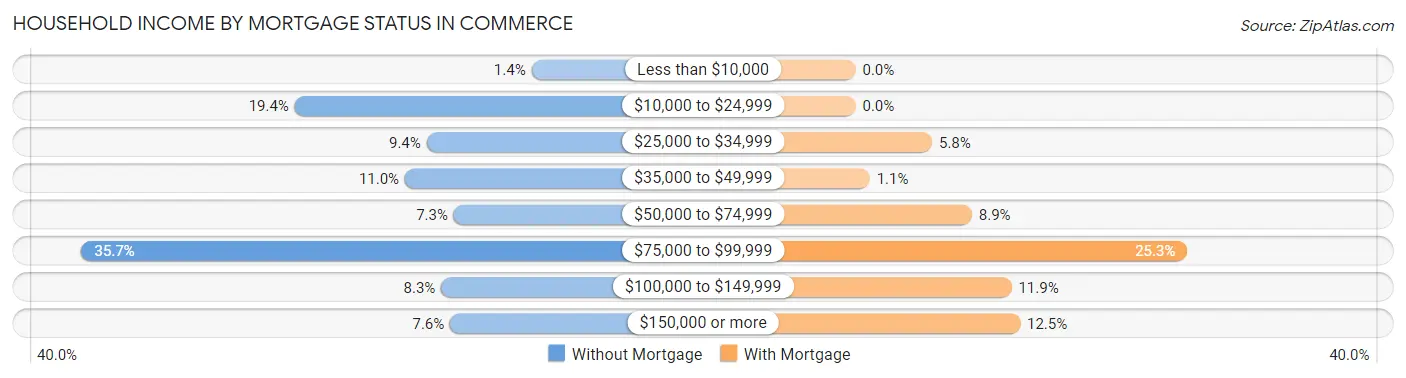
| Household Income | Without Mortgage | With Mortgage |
| Less than $10,000 | 10 (1.4%) | 0 (0.0%) |
| $10,000 to $24,999 | 141 (19.4%) | 0 (0.0%) |
| $25,000 to $34,999 | 68 (9.4%) | 27 (5.8%) |
| $35,000 to $49,999 | 80 (11.0%) | 5 (1.1%) |
| $50,000 to $74,999 | 53 (7.3%) | 41 (8.9%) |
| $75,000 to $99,999 | 259 (35.7%) | 117 (25.3%) |
| $100,000 to $149,999 | 60 (8.3%) | 55 (11.9%) |
| $150,000 or more | 55 (7.6%) | 58 (12.5%) |
| Total | 726 (100.0%) | 463 (100.0%) |
Property Value to Household Income Ratio in Commerce
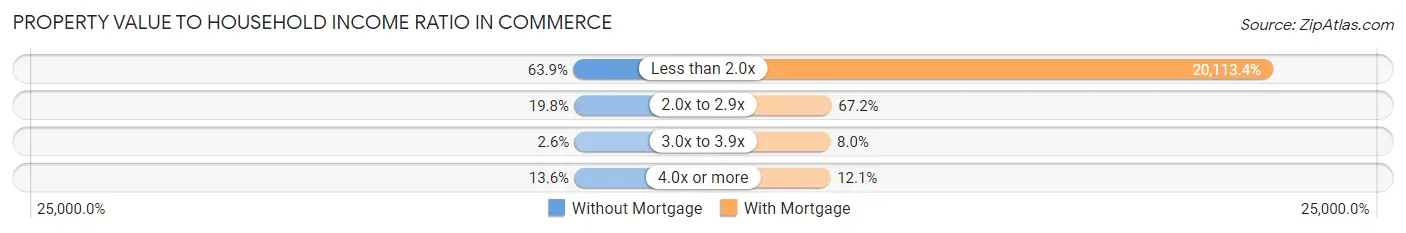
| Value-to-Income Ratio | Without Mortgage | With Mortgage |
| Less than 2.0x | 464 (63.9%) | 93,125 (20,113.4%) |
| 2.0x to 2.9x | 144 (19.8%) | 311 (67.2%) |
| 3.0x to 3.9x | 19 (2.6%) | 37 (8.0%) |
| 4.0x or more | 99 (13.6%) | 56 (12.1%) |
| Total | 726 (100.0%) | 463 (100.0%) |
Real Estate Taxes by Mortgage Status in Commerce
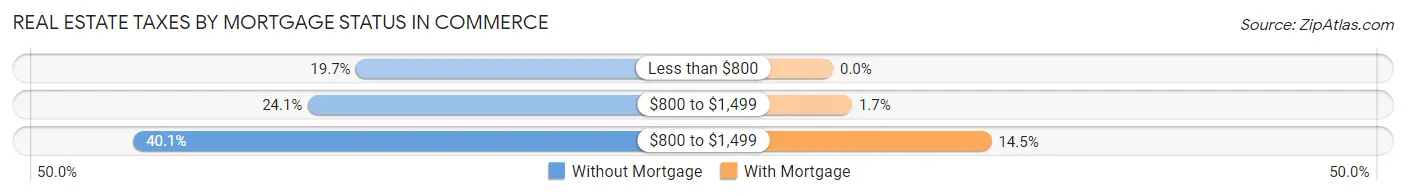
| Property Taxes | Without Mortgage | With Mortgage |
| Less than $800 | 143 (19.7%) | 0 (0.0%) |
| $800 to $1,499 | 175 (24.1%) | 8 (1.7%) |
| $800 to $1,499 | 291 (40.1%) | 67 (14.5%) |
| Total | 726 (100.0%) | 463 (100.0%) |
Health & Disability in Commerce
Health Insurance Coverage by Age in Commerce
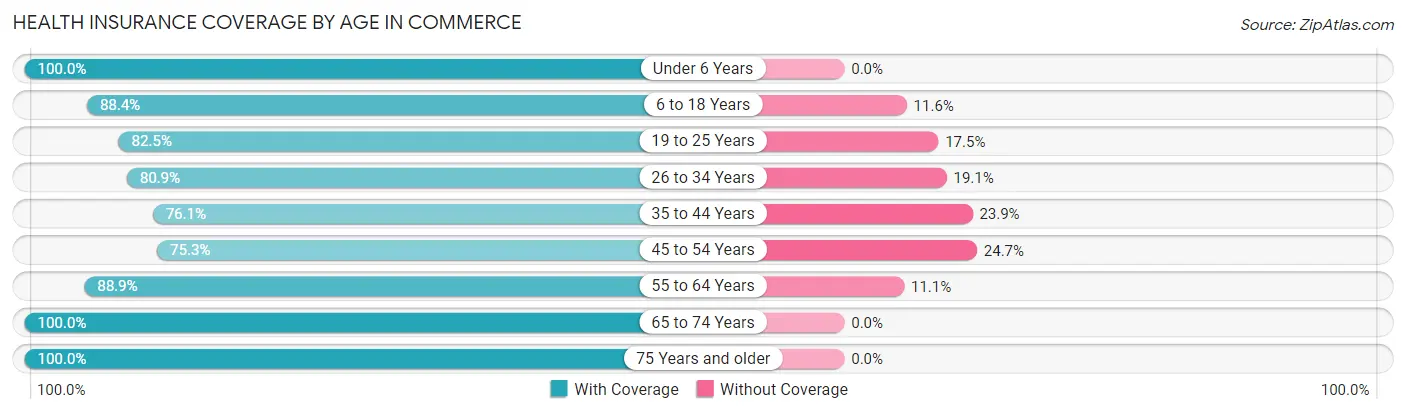
| Age Bracket | With Coverage | Without Coverage |
| Under 6 Years | 841 (100.0%) | 0 (0.0%) |
| 6 to 18 Years | 1,322 (88.4%) | 174 (11.6%) |
| 19 to 25 Years | 1,963 (82.5%) | 417 (17.5%) |
| 26 to 34 Years | 925 (80.9%) | 218 (19.1%) |
| 35 to 44 Years | 707 (76.1%) | 222 (23.9%) |
| 45 to 54 Years | 667 (75.3%) | 219 (24.7%) |
| 55 to 64 Years | 598 (88.9%) | 75 (11.1%) |
| 65 to 74 Years | 345 (100.0%) | 0 (0.0%) |
| 75 Years and older | 324 (100.0%) | 0 (0.0%) |
| Total | 7,692 (85.3%) | 1,325 (14.7%) |
Health Insurance Coverage by Citizenship Status in Commerce
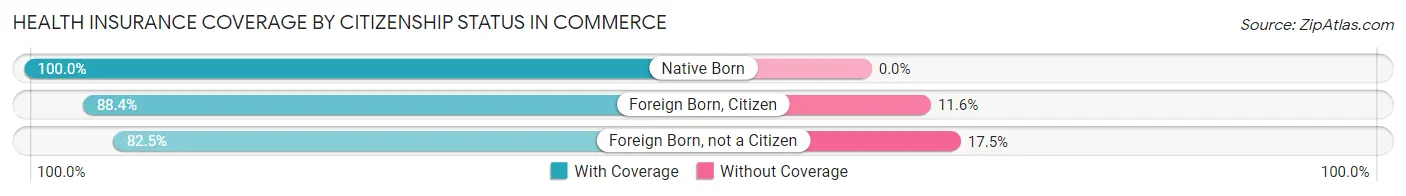
| Citizenship Status | With Coverage | Without Coverage |
| Native Born | 841 (100.0%) | 0 (0.0%) |
| Foreign Born, Citizen | 1,322 (88.4%) | 174 (11.6%) |
| Foreign Born, not a Citizen | 1,963 (82.5%) | 417 (17.5%) |
Health Insurance Coverage by Household Income in Commerce
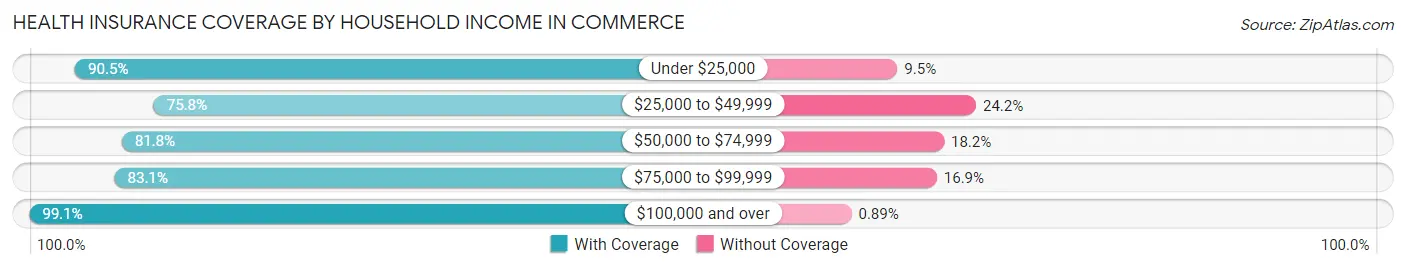
| Household Income | With Coverage | Without Coverage |
| Under $25,000 | 1,662 (90.5%) | 174 (9.5%) |
| $25,000 to $49,999 | 1,196 (75.8%) | 382 (24.2%) |
| $50,000 to $74,999 | 983 (81.8%) | 219 (18.2%) |
| $75,000 to $99,999 | 1,045 (83.1%) | 212 (16.9%) |
| $100,000 and over | 1,226 (99.1%) | 11 (0.9%) |
Public vs Private Health Insurance Coverage by Age in Commerce
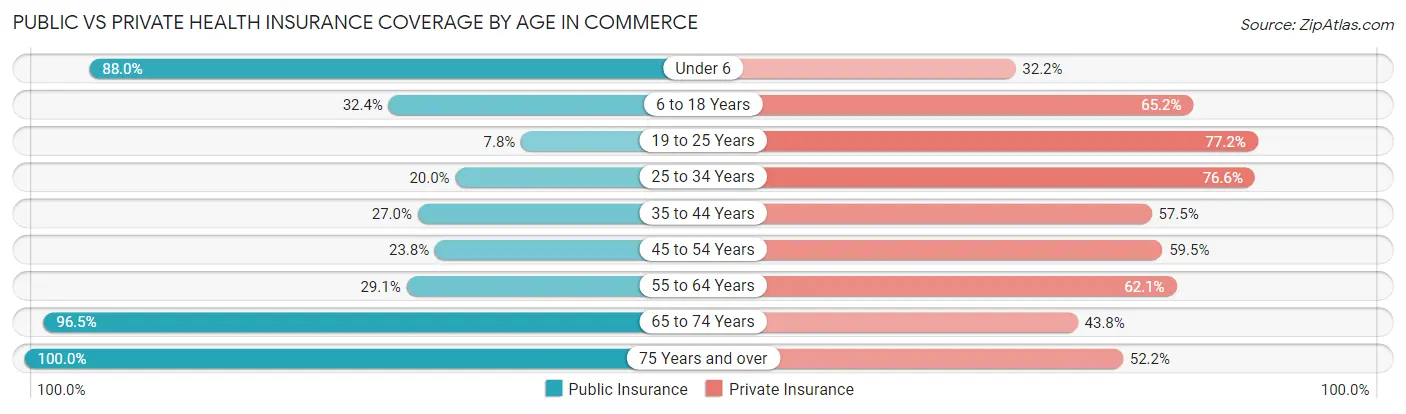
| Age Bracket | Public Insurance | Private Insurance |
| Under 6 | 740 (88.0%) | 271 (32.2%) |
| 6 to 18 Years | 485 (32.4%) | 976 (65.2%) |
| 19 to 25 Years | 186 (7.8%) | 1,837 (77.2%) |
| 25 to 34 Years | 229 (20.0%) | 876 (76.6%) |
| 35 to 44 Years | 251 (27.0%) | 534 (57.5%) |
| 45 to 54 Years | 211 (23.8%) | 527 (59.5%) |
| 55 to 64 Years | 196 (29.1%) | 418 (62.1%) |
| 65 to 74 Years | 333 (96.5%) | 151 (43.8%) |
| 75 Years and over | 324 (100.0%) | 169 (52.2%) |
| Total | 2,955 (32.8%) | 5,759 (63.9%) |
Disability Status by Sex by Age in Commerce
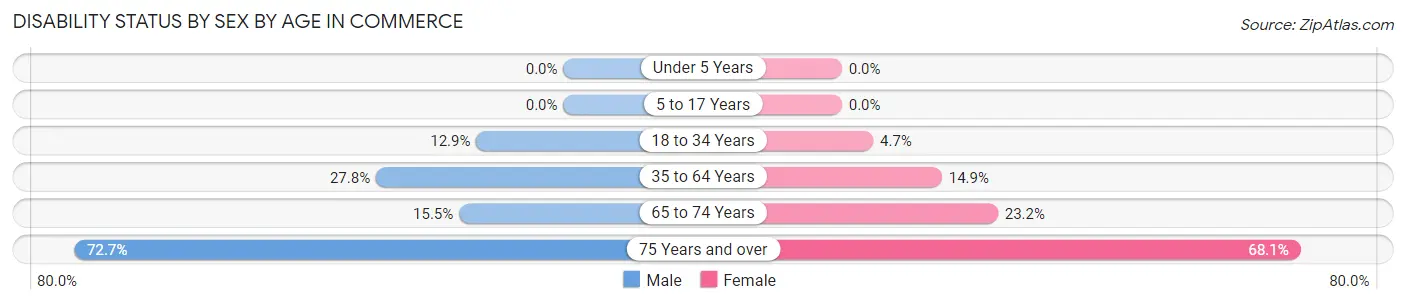
| Age Bracket | Male | Female |
| Under 5 Years | 0 (0.0%) | 0 (0.0%) |
| 5 to 17 Years | 0 (0.0%) | 0 (0.0%) |
| 18 to 34 Years | 226 (12.9%) | 113 (4.6%) |
| 35 to 64 Years | 338 (27.8%) | 189 (14.8%) |
| 65 to 74 Years | 24 (15.5%) | 44 (23.2%) |
| 75 Years and over | 101 (72.7%) | 126 (68.1%) |
Disability Class by Sex by Age in Commerce
Disability Class: Hearing Difficulty
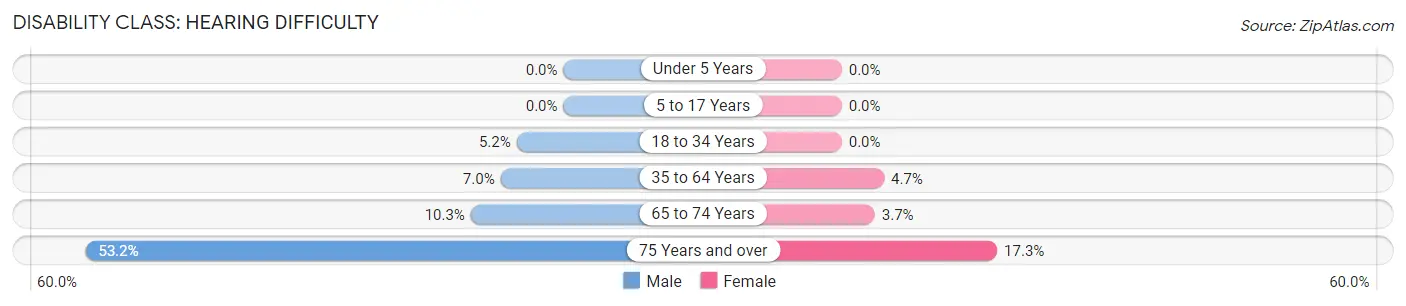
| Age Bracket | Male | Female |
| Under 5 Years | 0 (0.0%) | 0 (0.0%) |
| 5 to 17 Years | 0 (0.0%) | 0 (0.0%) |
| 18 to 34 Years | 91 (5.2%) | 0 (0.0%) |
| 35 to 64 Years | 85 (7.0%) | 60 (4.7%) |
| 65 to 74 Years | 16 (10.3%) | 7 (3.7%) |
| 75 Years and over | 74 (53.2%) | 32 (17.3%) |
Disability Class: Vision Difficulty
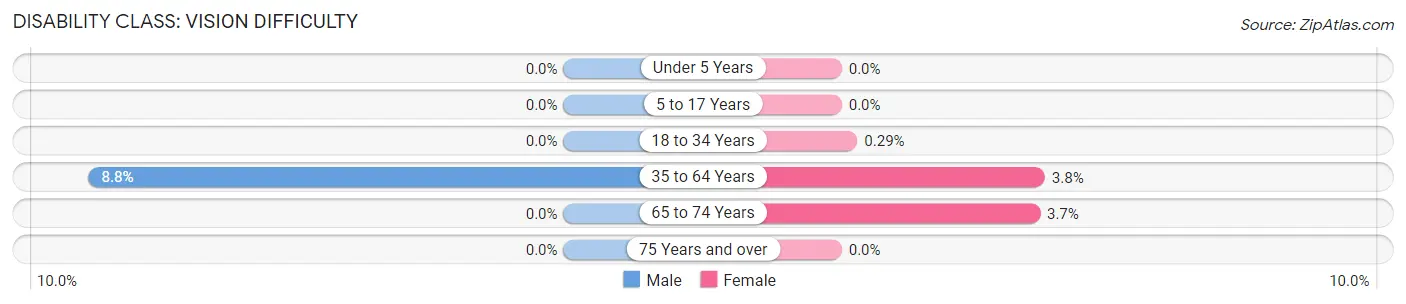
| Age Bracket | Male | Female |
| Under 5 Years | 0 (0.0%) | 0 (0.0%) |
| 5 to 17 Years | 0 (0.0%) | 0 (0.0%) |
| 18 to 34 Years | 0 (0.0%) | 7 (0.3%) |
| 35 to 64 Years | 107 (8.8%) | 48 (3.8%) |
| 65 to 74 Years | 0 (0.0%) | 7 (3.7%) |
| 75 Years and over | 0 (0.0%) | 0 (0.0%) |
Disability Class: Cognitive Difficulty
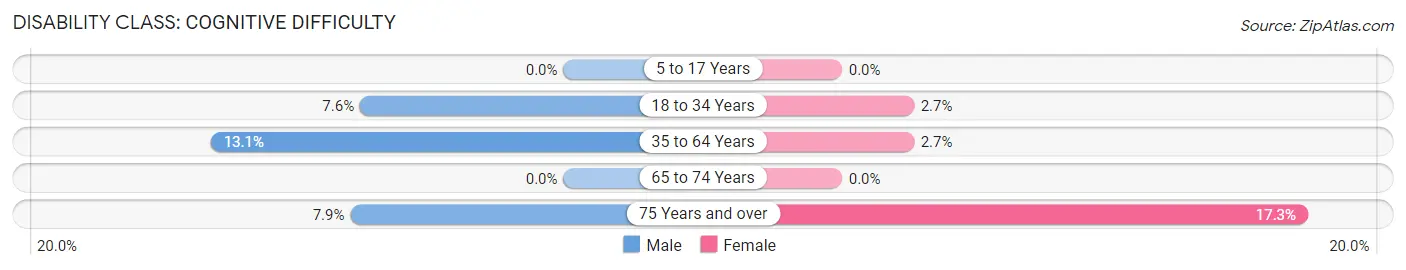
| Age Bracket | Male | Female |
| 5 to 17 Years | 0 (0.0%) | 0 (0.0%) |
| 18 to 34 Years | 132 (7.5%) | 65 (2.7%) |
| 35 to 64 Years | 159 (13.1%) | 34 (2.7%) |
| 65 to 74 Years | 0 (0.0%) | 0 (0.0%) |
| 75 Years and over | 11 (7.9%) | 32 (17.3%) |
Disability Class: Ambulatory Difficulty

| Age Bracket | Male | Female |
| 5 to 17 Years | 0 (0.0%) | 0 (0.0%) |
| 18 to 34 Years | 41 (2.4%) | 41 (1.7%) |
| 35 to 64 Years | 122 (10.0%) | 129 (10.1%) |
| 65 to 74 Years | 15 (9.7%) | 44 (23.2%) |
| 75 Years and over | 38 (27.3%) | 108 (58.4%) |
Disability Class: Self-Care Difficulty
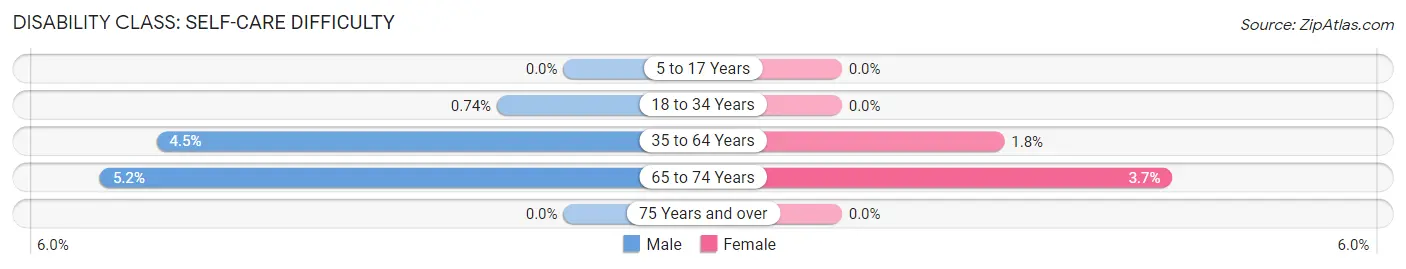
| Age Bracket | Male | Female |
| 5 to 17 Years | 0 (0.0%) | 0 (0.0%) |
| 18 to 34 Years | 13 (0.7%) | 0 (0.0%) |
| 35 to 64 Years | 55 (4.5%) | 23 (1.8%) |
| 65 to 74 Years | 8 (5.2%) | 7 (3.7%) |
| 75 Years and over | 0 (0.0%) | 0 (0.0%) |
Technology Access in Commerce
Computing Device Access in Commerce
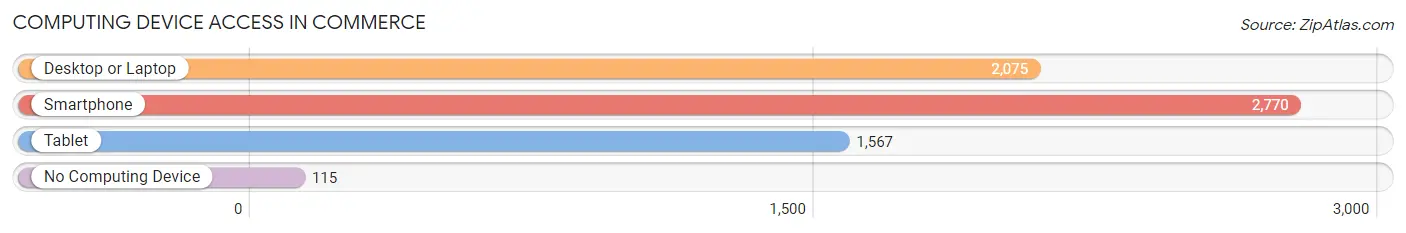
| Device Type | # Households | % Households |
| Desktop or Laptop | 2,075 | 69.1% |
| Smartphone | 2,770 | 92.2% |
| Tablet | 1,567 | 52.2% |
| No Computing Device | 115 | 3.8% |
| Total | 3,004 | 100.0% |
Internet Access in Commerce
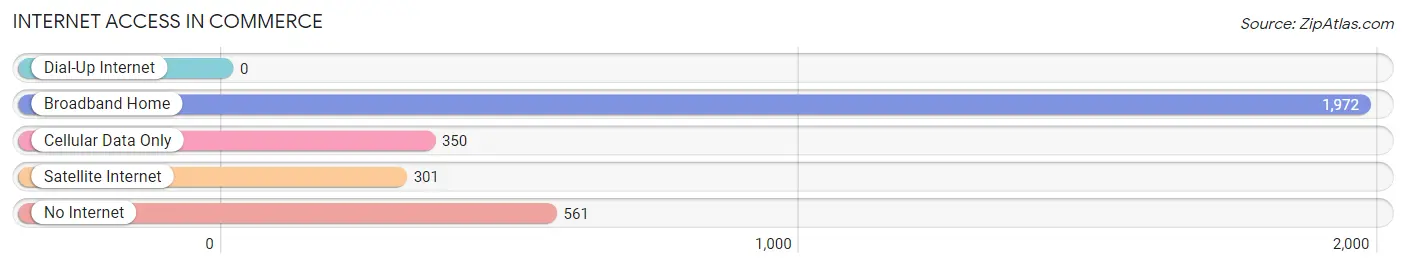
| Internet Type | # Households | % Households |
| Dial-Up Internet | 0 | 0.0% |
| Broadband Home | 1,972 | 65.6% |
| Cellular Data Only | 350 | 11.7% |
| Satellite Internet | 301 | 10.0% |
| No Internet | 561 | 18.7% |
| Total | 3,004 | 100.0% |
Commerce Summary
Commerce is a city located in Hunt County, Texas, United States. It is situated approximately sixty-five miles northeast of Dallas and is a part of the Dallas-Fort Worth Metroplex. As of the 2010 census, the city had a population of 8,078.
History
Commerce was founded in 1872 by William Jernigan, a former Confederate soldier. The city was named after the nearby Commerce Creek, which was used to power a gristmill and cotton gin. The city was incorporated in 1885 and was the first city in Hunt County to receive a post office.
In the early 1900s, Commerce was a thriving agricultural center, with cotton, corn, and wheat being the primary crops. The city also had a number of businesses, including a bank, a hotel, and a newspaper.
In the 1920s, Commerce began to experience a period of growth and development. The city was connected to the outside world by the Texas and Pacific Railway, and the population began to grow. The city also began to attract new businesses, including a cotton mill, a canning factory, and a lumber mill.
In the 1950s, Commerce experienced a period of rapid growth. The city was connected to the outside world by the Dallas-Fort Worth Turnpike, and the population grew to over 5,000. The city also began to attract new businesses, including a hospital, a shopping center, and a college.
Geography
Commerce is located in Hunt County, Texas, approximately sixty-five miles northeast of Dallas. The city is situated at the intersection of Interstate 30 and U.S. Highway 69. The city has a total area of 8.3 square miles, all of which is land.
Economy
Commerce is a thriving economic center in Hunt County. The city is home to a number of businesses, including a hospital, a shopping center, and a college. The city is also home to a number of manufacturing companies, including a cotton mill, a canning factory, and a lumber mill.
The city is also home to Texas A&M University-Commerce, which is a public university that offers a variety of degree programs. The university is the second-largest university in the Texas A&M University System.
Demographics
As of the 2010 census, the city had a population of 8,078. The racial makeup of the city was 75.3% White, 17.2% African American, 0.7% Native American, 0.7% Asian, 0.1% Pacific Islander, 4.2% from other races, and 2.0% from two or more races. Hispanic or Latino of any race were 11.3% of the population.
The median income for a household in the city was $35,938, and the median income for a family was $41,944. The per capita income for the city was $17,845. About 17.2% of families and 20.3% of the population were below the poverty line, including 28.2% of those under age 18 and 11.2% of those age 65 or over.
Common Questions
What is the Total Population of Commerce?
Total Population of Commerce is 9,078.
What is the Total Male Population of Commerce?
Total Male Population of Commerce is 3,948.
What is the Total Female Population of Commerce?
Total Female Population of Commerce is 5,130.
What is the Ratio of Males per 100 Females in Commerce?
There are 76.96 Males per 100 Females in Commerce.
What is the Ratio of Females per 100 Males in Commerce?
There are 129.94 Females per 100 Males in Commerce.
What is the Median Population Age in Commerce?
Median Population Age in Commerce is 24.1 Years.
What is the Average Family Size in Commerce
Average Family Size in Commerce is 3.0 People.
What is the Average Household Size in Commerce
Average Household Size in Commerce is 2.4 People.
What is Per Capita Income in Commerce?
Per Capita income in Commerce is $21,020.
What is the Median Family Income in Commerce?
Median Family Income in Commerce is $53,804.
What is the Median Household income in Commerce?
Median Household Income in Commerce is $41,382.
What is Income or Wage Gap in Commerce?
Income or Wage Gap in Commerce is 26.0%.
Women in Commerce earn 74.0 cents for every dollar earned by a man.
What is Inequality or Gini Index in Commerce?
Inequality or Gini Index in Commerce is 0.47.
How Large is the Labor Force in Commerce?
There are 4,509 People in the Labor Forcein in Commerce.
What is the Percentage of People in the Labor Force in Commerce?
60.1% of People are in the Labor Force in Commerce.
What is the Unemployment Rate in Commerce?
Unemployment Rate in Commerce is 6.9%.