Patton Village, TX
Patton Village Map
Patton Village Overview
1,417
TOTAL POPULATION
745
MALE POPULATION
672
FEMALE POPULATION
110.86
MALES / 100 FEMALES
90.20
FEMALES / 100 MALES
36.3
MEDIAN AGE
3.6
AVG FAMILY SIZE
3.3
AVG HOUSEHOLD SIZE
$24,723
PER CAPITA INCOME
$64,205
AVG FAMILY INCOME
$71,691
AVG HOUSEHOLD INCOME
41.2%
WAGE / INCOME GAP [ % ]
58.8¢/ $1
WAGE / INCOME GAP [ $ ]
0.38
INEQUALITY / GINI INDEX
649
LABOR FORCE [ PEOPLE ]
59.2%
PERCENT IN LABOR FORCE
6.8%
UNEMPLOYMENT RATE
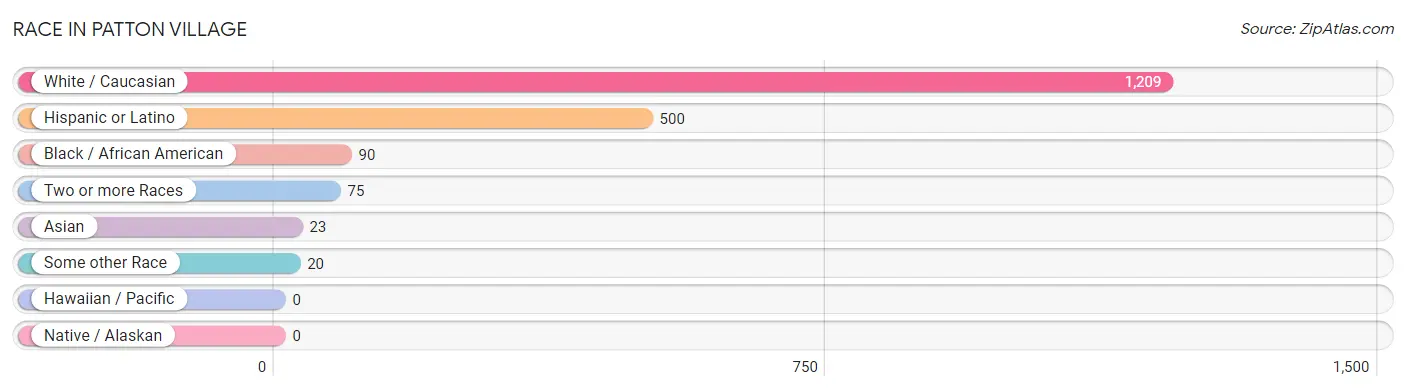
Race in Patton Village
The most populous races in Patton Village are White / Caucasian (1,209 | 85.3%), Hispanic or Latino (500 | 35.3%), and Black / African American (90 | 6.4%).
| Race | # Population | % Population |
| Asian | 23 | 1.6% |
| Black / African American | 90 | 6.4% |
| Hawaiian / Pacific | 0 | 0.0% |
| Hispanic or Latino | 500 | 35.3% |
| Native / Alaskan | 0 | 0.0% |
| White / Caucasian | 1,209 | 85.3% |
| Two or more Races | 75 | 5.3% |
| Some other Race | 20 | 1.4% |
| Total | 1,417 | 100.0% |
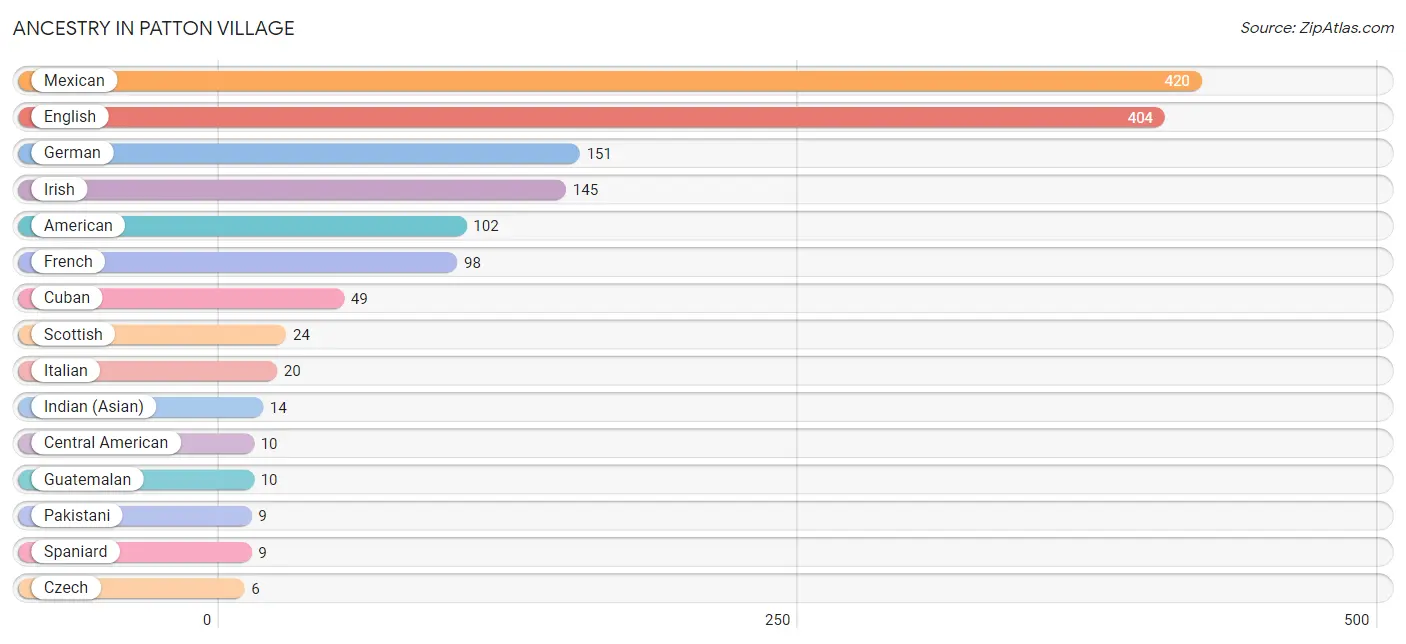
Ancestry in Patton Village
The most populous ancestries reported in Patton Village are Mexican (420 | 29.6%), English (404 | 28.5%), German (151 | 10.7%), Irish (145 | 10.2%), and American (102 | 7.2%), together accounting for 86.2% of all Patton Village residents.
| Ancestry | # Population | % Population |
| African | 3 | 0.2% |
| American | 102 | 7.2% |
| Central American | 10 | 0.7% |
| Cherokee | 4 | 0.3% |
| Colombian | 3 | 0.2% |
| Cuban | 49 | 3.5% |
| Czech | 6 | 0.4% |
| Dutch | 3 | 0.2% |
| English | 404 | 28.5% |
| European | 3 | 0.2% |
| French | 98 | 6.9% |
| German | 151 | 10.7% |
| Guatemalan | 10 | 0.7% |
| Indian (Asian) | 14 | 1.0% |
| Irish | 145 | 10.2% |
| Italian | 20 | 1.4% |
| Mexican | 420 | 29.6% |
| Pakistani | 9 | 0.6% |
| Scandinavian | 1 | 0.1% |
| Scottish | 24 | 1.7% |
| South American | 3 | 0.2% |
| Spaniard | 9 | 0.6% |
| Subsaharan African | 3 | 0.2% |
| Swedish | 4 | 0.3% | View All 24 Rows |
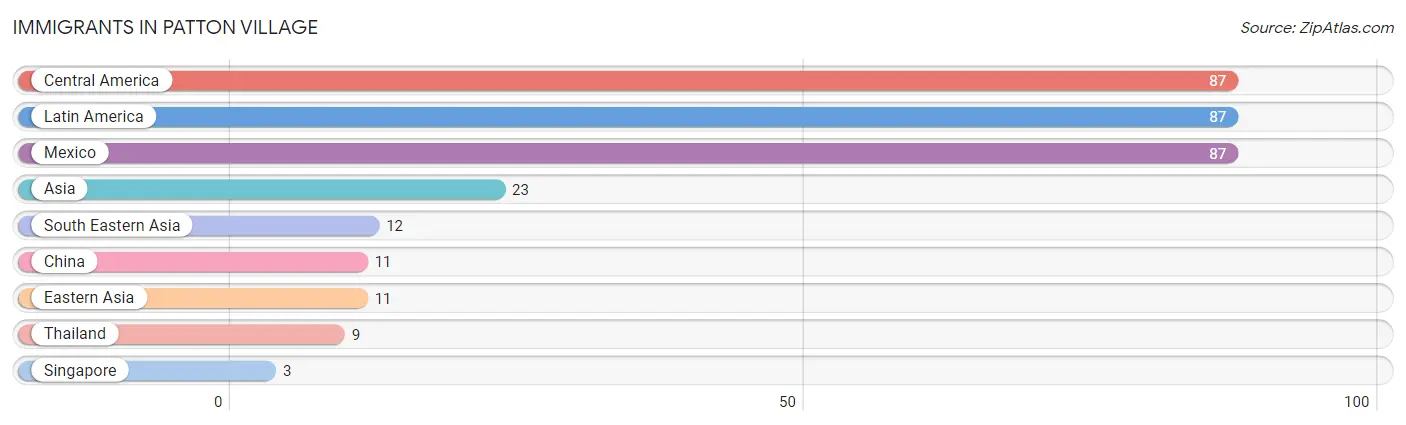
Immigrants in Patton Village
The most numerous immigrant groups reported in Patton Village came from Central America (87 | 6.1%), Latin America (87 | 6.1%), Mexico (87 | 6.1%), Asia (23 | 1.6%), and South Eastern Asia (12 | 0.9%), together accounting for 20.9% of all Patton Village residents.
| Immigration Origin | # Population | % Population |
| Asia | 23 | 1.6% |
| Central America | 87 | 6.1% |
| China | 11 | 0.8% |
| Eastern Asia | 11 | 0.8% |
| Latin America | 87 | 6.1% |
| Mexico | 87 | 6.1% |
| Singapore | 3 | 0.2% |
| South Eastern Asia | 12 | 0.9% |
| Thailand | 9 | 0.6% | View All 9 Rows |
Sex and Age in Patton Village
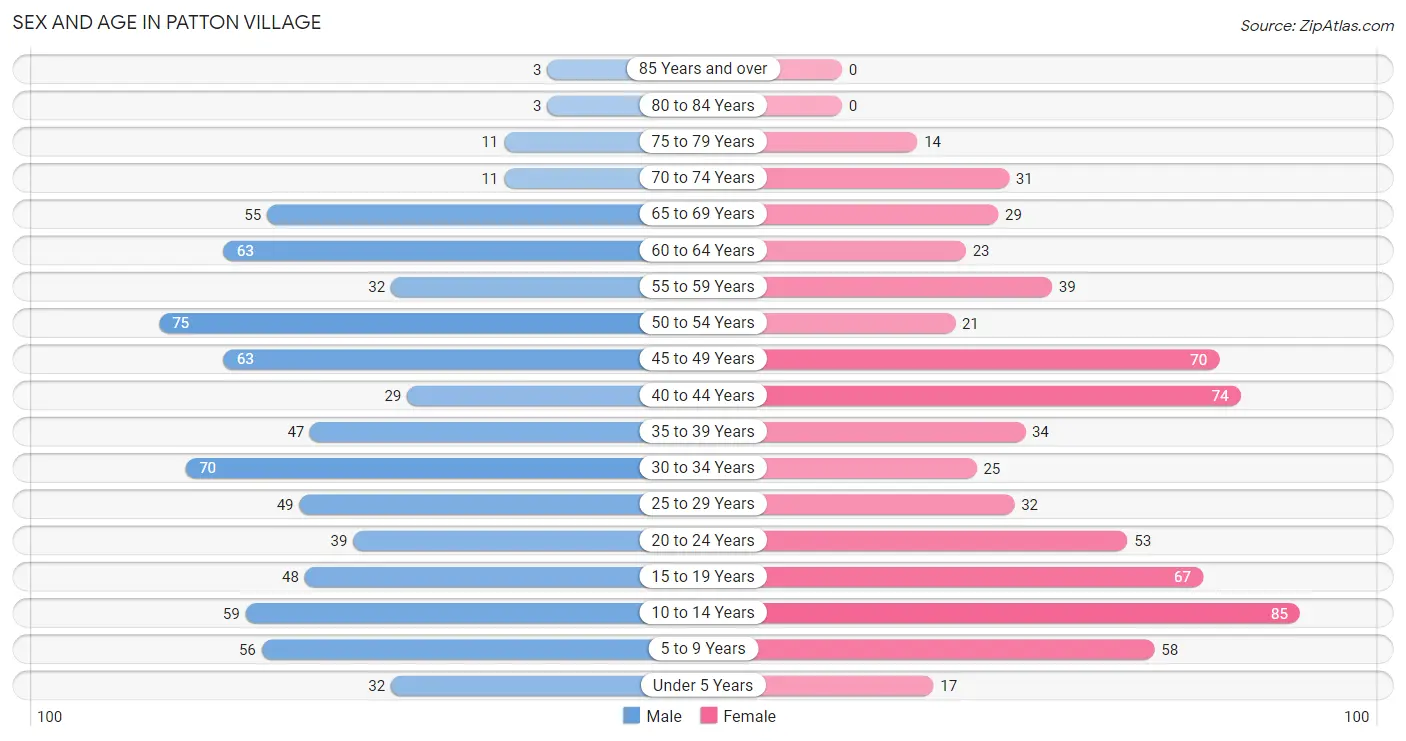
Sex and Age in Patton Village
The most populous age groups in Patton Village are 50 to 54 Years (75 | 10.1%) for men and 10 to 14 Years (85 | 12.7%) for women.
| Age Bracket | Male | Female |
| Under 5 Years | 32 (4.3%) | 17 (2.5%) |
| 5 to 9 Years | 56 (7.5%) | 58 (8.6%) |
| 10 to 14 Years | 59 (7.9%) | 85 (12.7%) |
| 15 to 19 Years | 48 (6.4%) | 67 (10.0%) |
| 20 to 24 Years | 39 (5.2%) | 53 (7.9%) |
| 25 to 29 Years | 49 (6.6%) | 32 (4.8%) |
| 30 to 34 Years | 70 (9.4%) | 25 (3.7%) |
| 35 to 39 Years | 47 (6.3%) | 34 (5.1%) |
| 40 to 44 Years | 29 (3.9%) | 74 (11.0%) |
| 45 to 49 Years | 63 (8.5%) | 70 (10.4%) |
| 50 to 54 Years | 75 (10.1%) | 21 (3.1%) |
| 55 to 59 Years | 32 (4.3%) | 39 (5.8%) |
| 60 to 64 Years | 63 (8.5%) | 23 (3.4%) |
| 65 to 69 Years | 55 (7.4%) | 29 (4.3%) |
| 70 to 74 Years | 11 (1.5%) | 31 (4.6%) |
| 75 to 79 Years | 11 (1.5%) | 14 (2.1%) |
| 80 to 84 Years | 3 (0.4%) | 0 (0.0%) |
| 85 Years and over | 3 (0.4%) | 0 (0.0%) |
| Total | 745 (100.0%) | 672 (100.0%) |
Families and Households in Patton Village
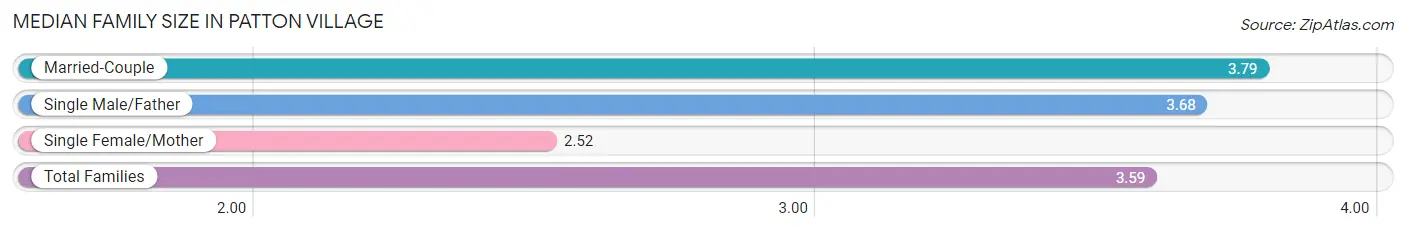
Median Family Size in Patton Village
The median family size in Patton Village is 3.59 persons per family, with married-couple families (251 | 73.6%) accounting for the largest median family size of 3.79 persons per family. On the other hand, single female/mother families (52 | 15.2%) represent the smallest median family size with 2.52 persons per family.
| Family Type | # Families | Family Size |
| Married-Couple | 251 (73.6%) | 3.79 |
| Single Male/Father | 38 (11.1%) | 3.68 |
| Single Female/Mother | 52 (15.2%) | 2.52 |
| Total Families | 341 (100.0%) | 3.59 |
Median Household Size in Patton Village
The median household size in Patton Village is 3.30 persons per household, with single male/father households (38 | 8.9%) accounting for the largest median household size of 4.03 persons per household. non-family households (88 | 20.5%) represent the smallest median household size with 1.20 persons per household.

| Household Type | # Households | Household Size |
| Married-Couple | 251 (58.5%) | 3.86 |
| Single Male/Father | 38 (8.9%) | 4.03 |
| Single Female/Mother | 52 (12.1%) | 3.65 |
| Non-family | 88 (20.5%) | 1.20 |
| Total Households | 429 (100.0%) | 3.30 |
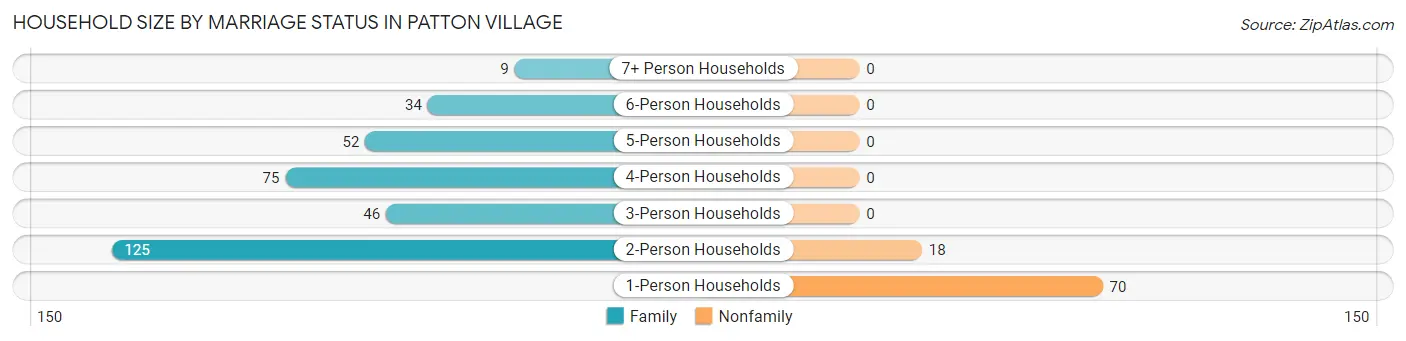
Household Size by Marriage Status in Patton Village
Out of a total of 429 households in Patton Village, 341 (79.5%) are family households, while 88 (20.5%) are nonfamily households. The most numerous type of family households are 2-person households, comprising 125, and the most common type of nonfamily households are 1-person households, comprising 70.
| Household Size | Family Households | Nonfamily Households |
| 1-Person Households | - | 70 (16.3%) |
| 2-Person Households | 125 (29.1%) | 18 (4.2%) |
| 3-Person Households | 46 (10.7%) | 0 (0.0%) |
| 4-Person Households | 75 (17.5%) | 0 (0.0%) |
| 5-Person Households | 52 (12.1%) | 0 (0.0%) |
| 6-Person Households | 34 (7.9%) | 0 (0.0%) |
| 7+ Person Households | 9 (2.1%) | 0 (0.0%) |
| Total | 341 (79.5%) | 88 (20.5%) |
Female Fertility in Patton Village
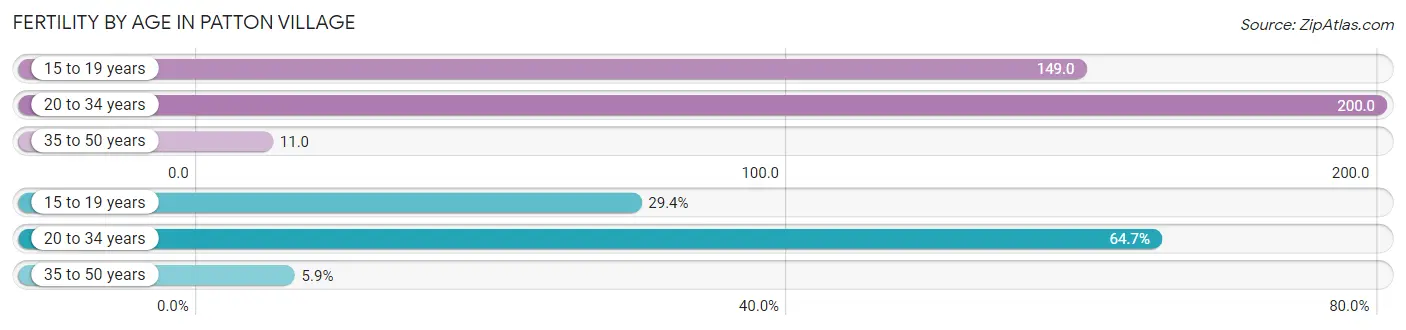
Fertility by Age in Patton Village
Average fertility rate in Patton Village is 93.0 births per 1,000 women. Women in the age bracket of 20 to 34 years have the highest fertility rate with 200.0 births per 1,000 women. Women in the age bracket of 20 to 34 years acount for 64.7% of all women with births.
| Age Bracket | Women with Births | Births / 1,000 Women |
| 15 to 19 years | 10 (29.4%) | 149.0 |
| 20 to 34 years | 22 (64.7%) | 200.0 |
| 35 to 50 years | 2 (5.9%) | 11.0 |
| Total | 34 (100.0%) | 93.0 |
Fertility by Age by Marriage Status in Patton Village
70.6% of women with births (34) in Patton Village are married. The highest percentage of unmarried women with births falls into 15 to 19 years age bracket with 100.0% of them unmarried at the time of birth, while the lowest percentage of unmarried women with births belong to 20 to 34 years age bracket with 0.0% of them unmarried.
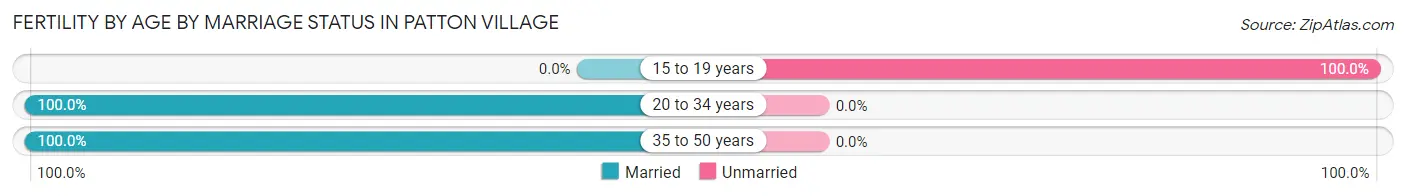
| Age Bracket | Married | Unmarried |
| 15 to 19 years | 0 (0.0%) | 10 (100.0%) |
| 20 to 34 years | 22 (100.0%) | 0 (0.0%) |
| 35 to 50 years | 2 (100.0%) | 0 (0.0%) |
| Total | 24 (70.6%) | 10 (29.4%) |
Fertility by Education in Patton Village
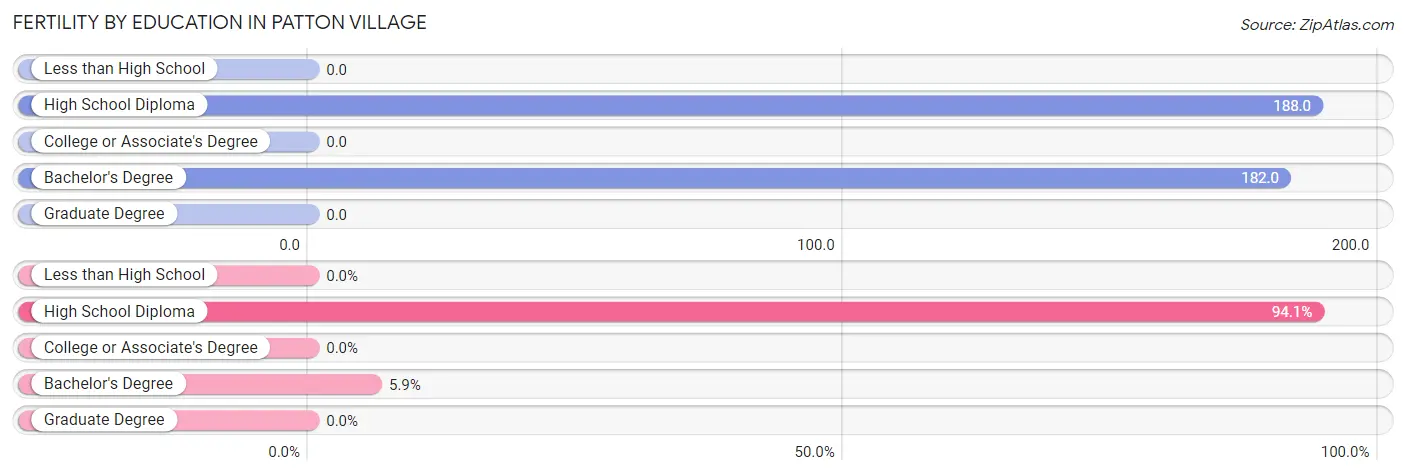
| Educational Attainment | Women with Births | Births / 1,000 Women |
| Less than High School | 0 (0.0%) | 0.0 |
| High School Diploma | 32 (94.1%) | 188.0 |
| College or Associate's Degree | 0 (0.0%) | 0.0 |
| Bachelor's Degree | 2 (5.9%) | 182.0 |
| Graduate Degree | 0 (0.0%) | 0.0 |
| Total | 34 (100.0%) | 93.0 |
Fertility by Education by Marriage Status in Patton Village
29.4% of women with births in Patton Village are unmarried. Women with the educational attainment of bachelor's degree are most likely to be married with 100.0% of them married at childbirth, while women with the educational attainment of high school diploma are least likely to be married with 31.2% of them unmarried at childbirth.
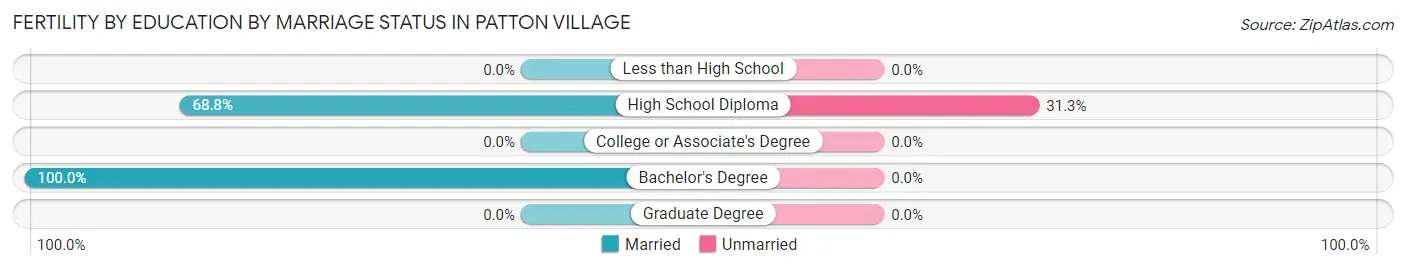
| Educational Attainment | Married | Unmarried |
| Less than High School | 0 (0.0%) | 0 (0.0%) |
| High School Diploma | 22 (68.8%) | 10 (31.2%) |
| College or Associate's Degree | 0 (0.0%) | 0 (0.0%) |
| Bachelor's Degree | 2 (100.0%) | 0 (0.0%) |
| Graduate Degree | 0 (0.0%) | 0 (0.0%) |
| Total | 24 (70.6%) | 10 (29.4%) |
Income in Patton Village
Income Overview in Patton Village
Per Capita Income in Patton Village is $24,723, while median incomes of families and households are $64,205 and $71,691 respectively.
| Characteristic | Number | Measure |
| Per Capita Income | 1,417 | $24,723 |
| Median Family Income | 341 | $64,205 |
| Mean Family Income | 341 | $77,990 |
| Median Household Income | 429 | $71,691 |
| Mean Household Income | 429 | $76,765 |
| Income Deficit | 341 | $0 |
| Wage / Income Gap (%) | 1,417 | 41.17% |
| Wage / Income Gap ($) | 1,417 | 58.83¢ per $1 |
| Gini / Inequality Index | 1,417 | 0.38 |
Earnings by Sex in Patton Village
Average Earnings in Patton Village are $36,250, $48,259 for men and $28,393 for women, a difference of 41.2%.
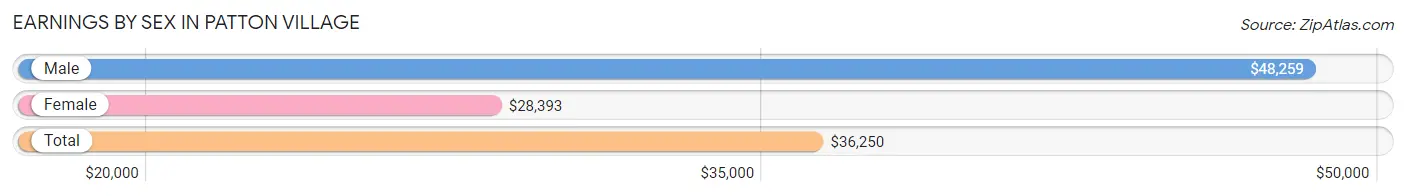
| Sex | Number | Average Earnings |
| Male | 415 (61.1%) | $48,259 |
| Female | 264 (38.9%) | $28,393 |
| Total | 679 (100.0%) | $36,250 |
Earnings by Sex by Income Bracket in Patton Village
The most common earnings brackets in Patton Village are $55,000 to $64,999 for men (60 | 14.5%) and $25,000 to $29,999 for women (42 | 15.9%).
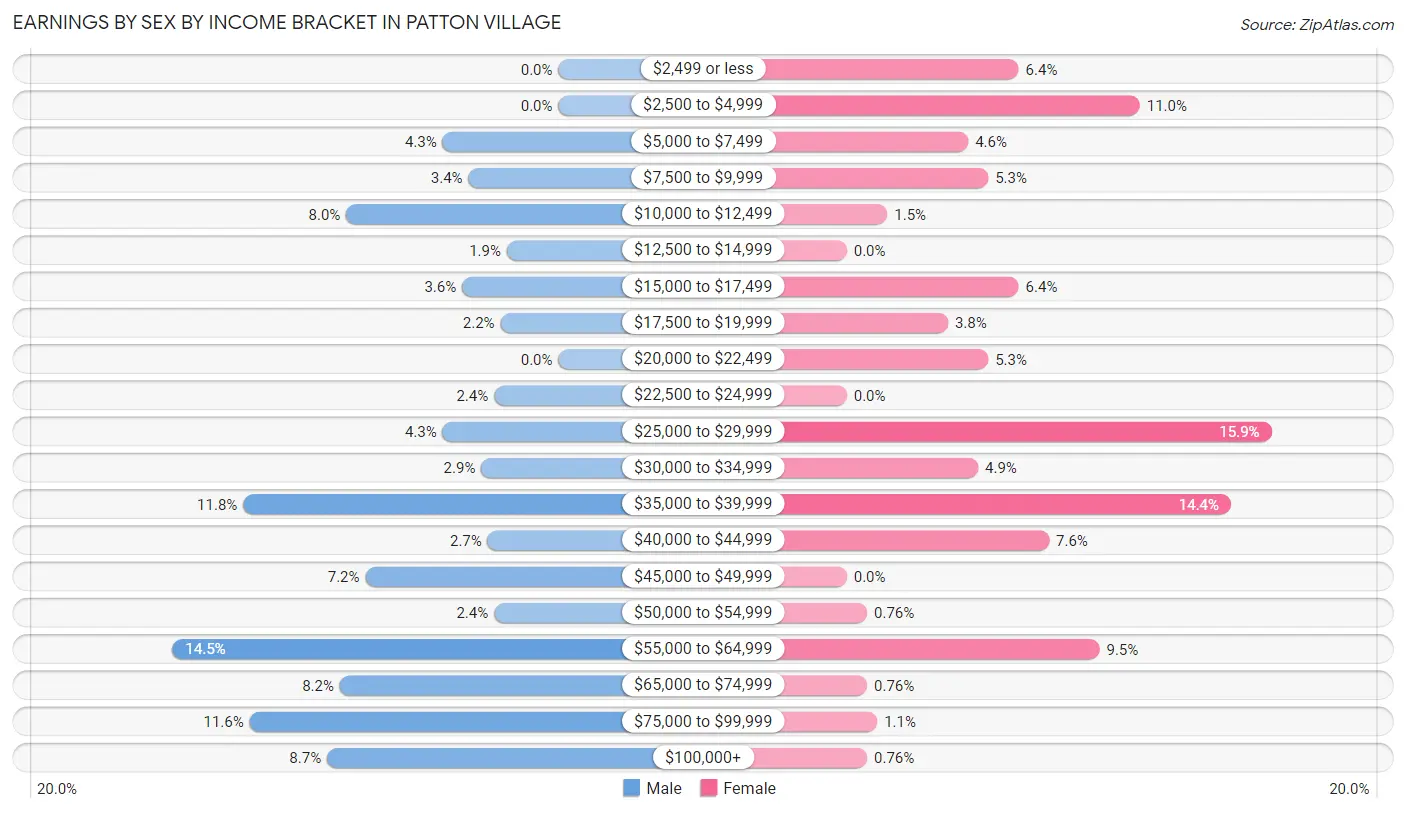
| Income | Male | Female |
| $2,499 or less | 0 (0.0%) | 17 (6.4%) |
| $2,500 to $4,999 | 0 (0.0%) | 29 (11.0%) |
| $5,000 to $7,499 | 18 (4.3%) | 12 (4.5%) |
| $7,500 to $9,999 | 14 (3.4%) | 14 (5.3%) |
| $10,000 to $12,499 | 33 (8.0%) | 4 (1.5%) |
| $12,500 to $14,999 | 8 (1.9%) | 0 (0.0%) |
| $15,000 to $17,499 | 15 (3.6%) | 17 (6.4%) |
| $17,500 to $19,999 | 9 (2.2%) | 10 (3.8%) |
| $20,000 to $22,499 | 0 (0.0%) | 14 (5.3%) |
| $22,500 to $24,999 | 10 (2.4%) | 0 (0.0%) |
| $25,000 to $29,999 | 18 (4.3%) | 42 (15.9%) |
| $30,000 to $34,999 | 12 (2.9%) | 13 (4.9%) |
| $35,000 to $39,999 | 49 (11.8%) | 38 (14.4%) |
| $40,000 to $44,999 | 11 (2.6%) | 20 (7.6%) |
| $45,000 to $49,999 | 30 (7.2%) | 0 (0.0%) |
| $50,000 to $54,999 | 10 (2.4%) | 2 (0.8%) |
| $55,000 to $64,999 | 60 (14.5%) | 25 (9.5%) |
| $65,000 to $74,999 | 34 (8.2%) | 2 (0.8%) |
| $75,000 to $99,999 | 48 (11.6%) | 3 (1.1%) |
| $100,000+ | 36 (8.7%) | 2 (0.8%) |
| Total | 415 (100.0%) | 264 (100.0%) |
Earnings by Sex by Educational Attainment in Patton Village
Average earnings in Patton Village are $53,333 for men and $31,250 for women, a difference of 41.4%. Men with an educational attainment of bachelor's degree enjoy the highest average annual earnings of $127,750, while those with less than high school education earn the least with $47,604. Women with an educational attainment of high school diploma earn the most with the average annual earnings of $35,859, while those with less than high school education have the smallest earnings of $28,152.
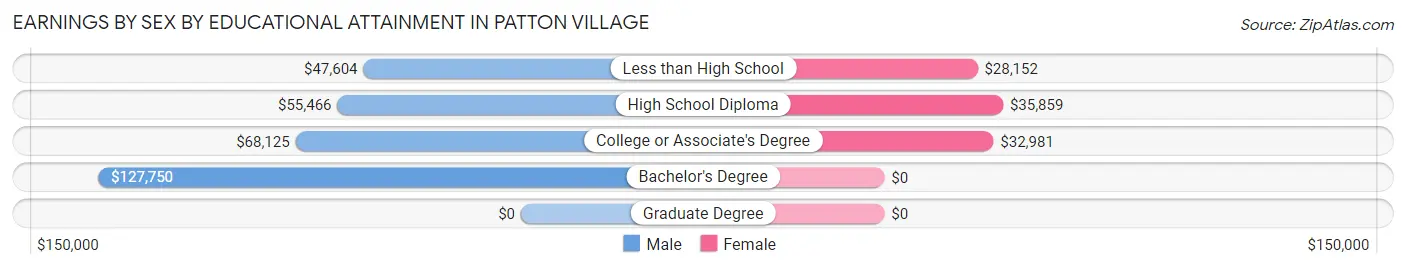
| Educational Attainment | Male Income | Female Income |
| Less than High School | $47,604 | $28,152 |
| High School Diploma | $55,466 | $35,859 |
| College or Associate's Degree | $68,125 | $32,981 |
| Bachelor's Degree | $127,750 | $0 |
| Graduate Degree | - | - |
| Total | $53,333 | $31,250 |
Family Income in Patton Village
Family Income Brackets in Patton Village
According to the Patton Village family income data, there are 80 families falling into the $35,000 to $49,999 income range, which is the most common income bracket and makes up 23.5% of all families. Conversely, the $10,000 to $14,999 income bracket is the least frequent group with only 3 families (0.9%) belonging to this category.
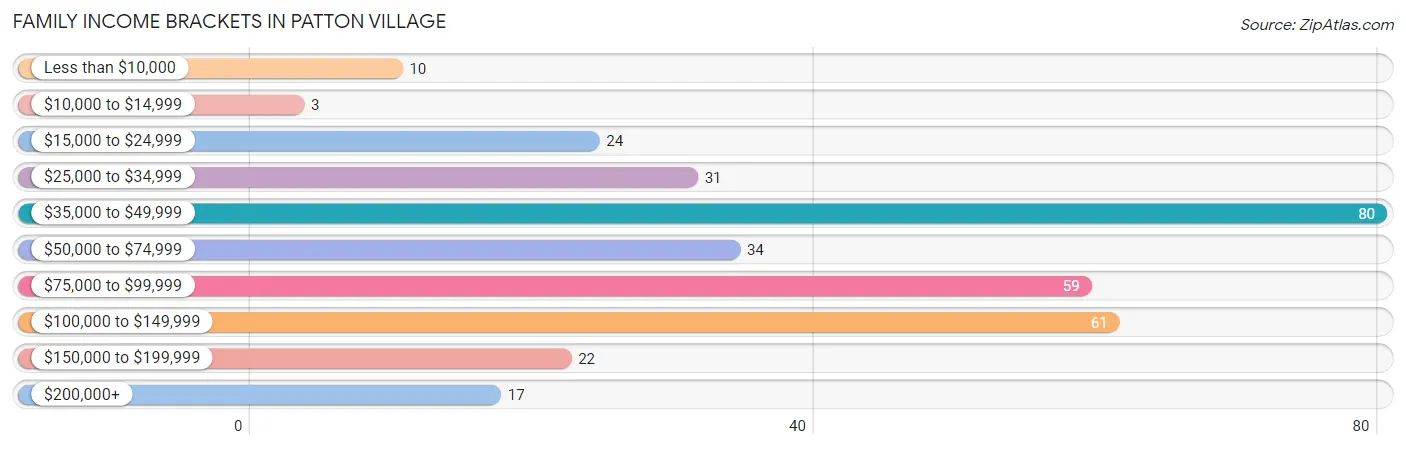
| Income Bracket | # Families | % Families |
| Less than $10,000 | 10 | 2.9% |
| $10,000 to $14,999 | 3 | 0.9% |
| $15,000 to $24,999 | 24 | 7.0% |
| $25,000 to $34,999 | 31 | 9.1% |
| $35,000 to $49,999 | 80 | 23.5% |
| $50,000 to $74,999 | 34 | 10.0% |
| $75,000 to $99,999 | 59 | 17.3% |
| $100,000 to $149,999 | 61 | 17.9% |
| $150,000 to $199,999 | 22 | 6.5% |
| $200,000+ | 17 | 5.0% |
Family Income by Famaliy Size in Patton Village
7+ person families (9 | 2.6%) account for the highest median family income in Patton Village with $115,250 per family, while 2-person families (125 | 36.7%) have the highest median income of $38,042 per family member.
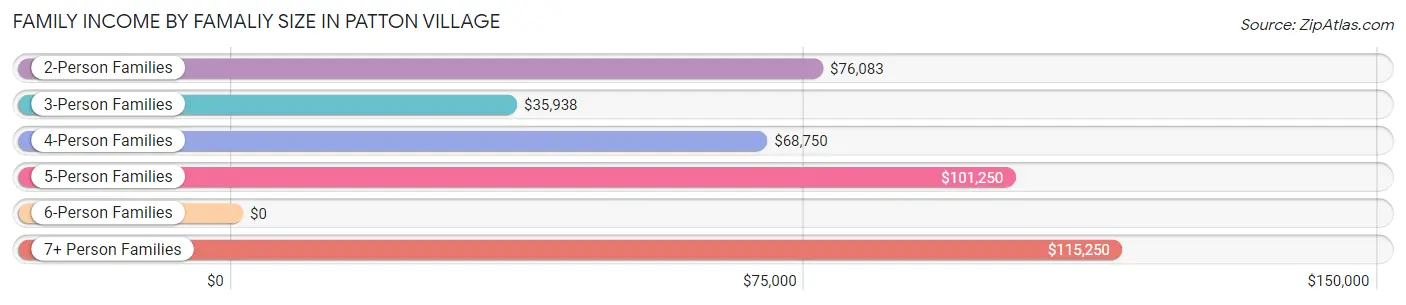
| Income Bracket | # Families | Median Income |
| 2-Person Families | 125 (36.7%) | $76,083 |
| 3-Person Families | 78 (22.9%) | $35,938 |
| 4-Person Families | 54 (15.8%) | $68,750 |
| 5-Person Families | 49 (14.4%) | $101,250 |
| 6-Person Families | 26 (7.6%) | $0 |
| 7+ Person Families | 9 (2.6%) | $115,250 |
| Total | 341 (100.0%) | $64,205 |
Family Income by Number of Earners in Patton Village
The median family income in Patton Village is $64,205, with families comprising 3+ earners (33) having the highest median family income of $100,893, while families with no earners (23) have the lowest median family income of $28,036, accounting for 9.7% and 6.7% of families, respectively.
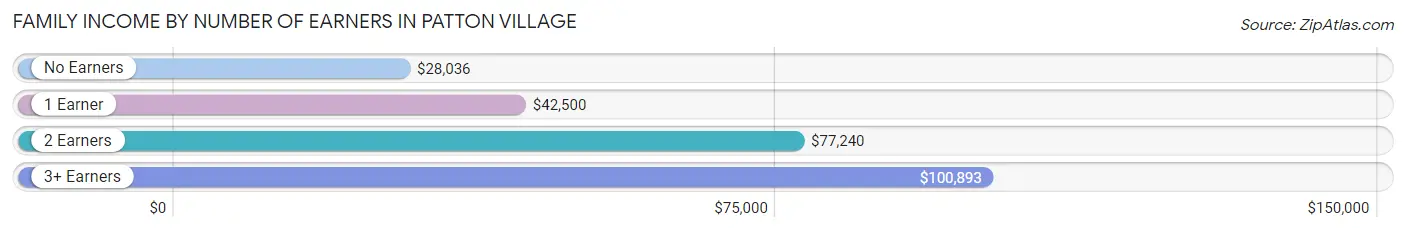
| Number of Earners | # Families | Median Income |
| No Earners | 23 (6.7%) | $28,036 |
| 1 Earner | 166 (48.7%) | $42,500 |
| 2 Earners | 119 (34.9%) | $77,240 |
| 3+ Earners | 33 (9.7%) | $100,893 |
| Total | 341 (100.0%) | $64,205 |
Household Income in Patton Village
Household Income Brackets in Patton Village
With 100 households falling in the category, the $75,000 to $99,999 income range is the most frequent in Patton Village, accounting for 23.3% of all households. In contrast, only 13 households (3.0%) fall into the less than $10,000 income bracket, making it the least populous group.
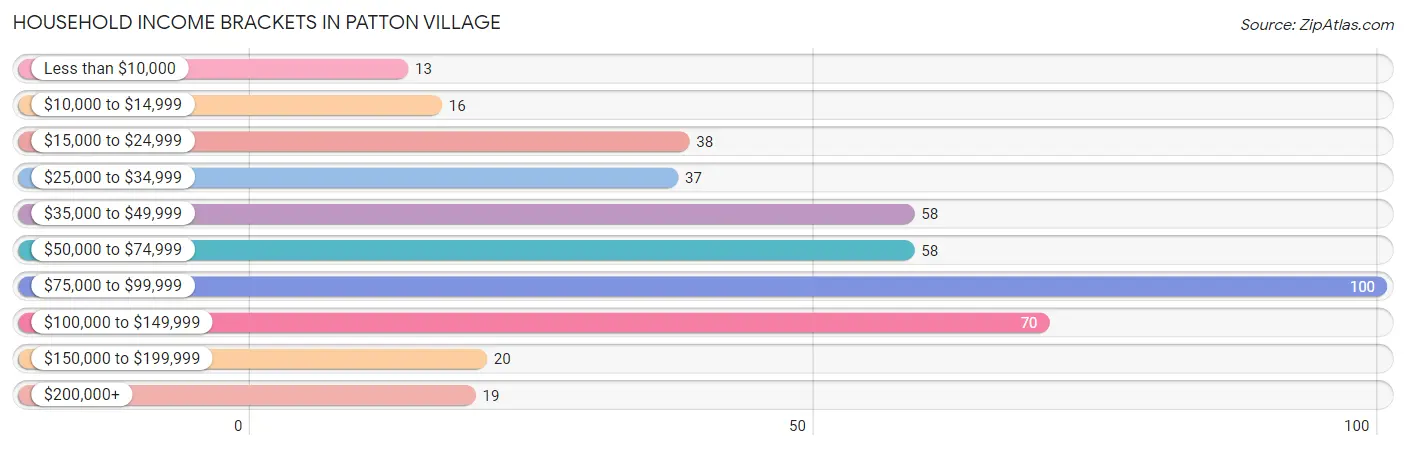
| Income Bracket | # Households | % Households |
| Less than $10,000 | 13 | 3.0% |
| $10,000 to $14,999 | 16 | 3.7% |
| $15,000 to $24,999 | 38 | 8.9% |
| $25,000 to $34,999 | 37 | 8.6% |
| $35,000 to $49,999 | 58 | 13.5% |
| $50,000 to $74,999 | 58 | 13.5% |
| $75,000 to $99,999 | 100 | 23.3% |
| $100,000 to $149,999 | 70 | 16.3% |
| $150,000 to $199,999 | 20 | 4.7% |
| $200,000+ | 19 | 4.4% |
Household Income by Householder Age in Patton Village
The median household income in Patton Village is $71,691, with the highest median household income of $93,633 found in the 25 to 44 years age bracket for the primary householder. A total of 149 households (34.7%) fall into this category.
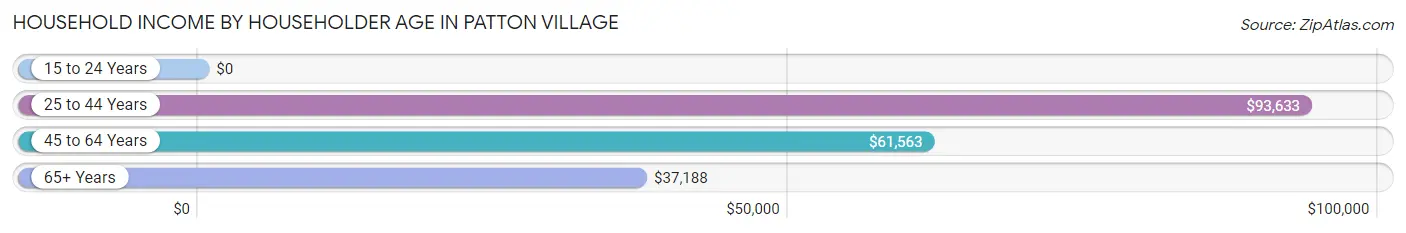
| Income Bracket | # Households | Median Income |
| 15 to 24 Years | 0 (0.0%) | $0 |
| 25 to 44 Years | 149 (34.7%) | $93,633 |
| 45 to 64 Years | 171 (39.9%) | $61,563 |
| 65+ Years | 109 (25.4%) | $37,188 |
| Total | 429 (100.0%) | $71,691 |
Poverty in Patton Village
Income Below Poverty by Sex and Age in Patton Village
With 18.5% poverty level for males and 20.4% for females among the residents of Patton Village, 5 year old males and 75 year old and over females are the most vulnerable to poverty, with 9 males (52.9%) and 10 females (71.4%) in their respective age groups living below the poverty level.
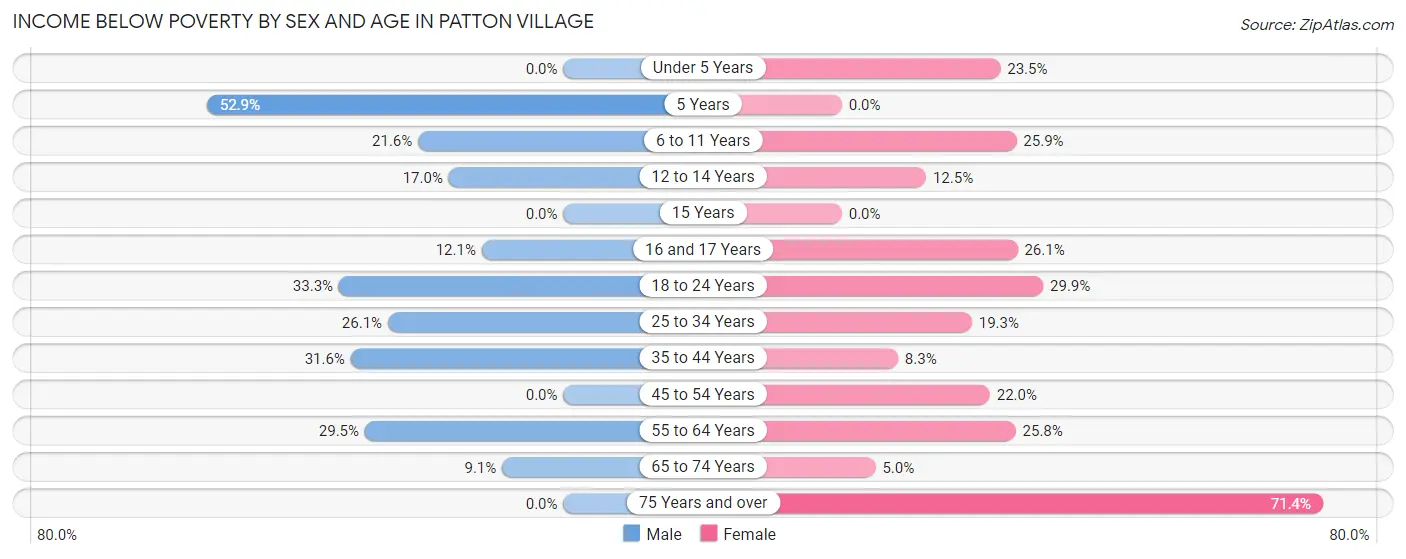
| Age Bracket | Male | Female |
| Under 5 Years | 0 (0.0%) | 4 (23.5%) |
| 5 Years | 9 (52.9%) | 0 (0.0%) |
| 6 to 11 Years | 11 (21.6%) | 28 (25.9%) |
| 12 to 14 Years | 8 (17.0%) | 4 (12.5%) |
| 15 Years | 0 (0.0%) | 0 (0.0%) |
| 16 and 17 Years | 4 (12.1%) | 6 (26.1%) |
| 18 to 24 Years | 17 (33.3%) | 26 (29.9%) |
| 25 to 34 Years | 31 (26.1%) | 11 (19.3%) |
| 35 to 44 Years | 24 (31.6%) | 9 (8.3%) |
| 45 to 54 Years | 0 (0.0%) | 20 (22.0%) |
| 55 to 64 Years | 28 (29.5%) | 16 (25.8%) |
| 65 to 74 Years | 6 (9.1%) | 3 (5.0%) |
| 75 Years and over | 0 (0.0%) | 10 (71.4%) |
| Total | 138 (18.5%) | 137 (20.4%) |
Income Above Poverty by Sex and Age in Patton Village
According to the poverty statistics in Patton Village, males aged under 5 years and females aged 5 years are the age groups that are most secure financially, with 100.0% of males and 100.0% of females in these age groups living above the poverty line.
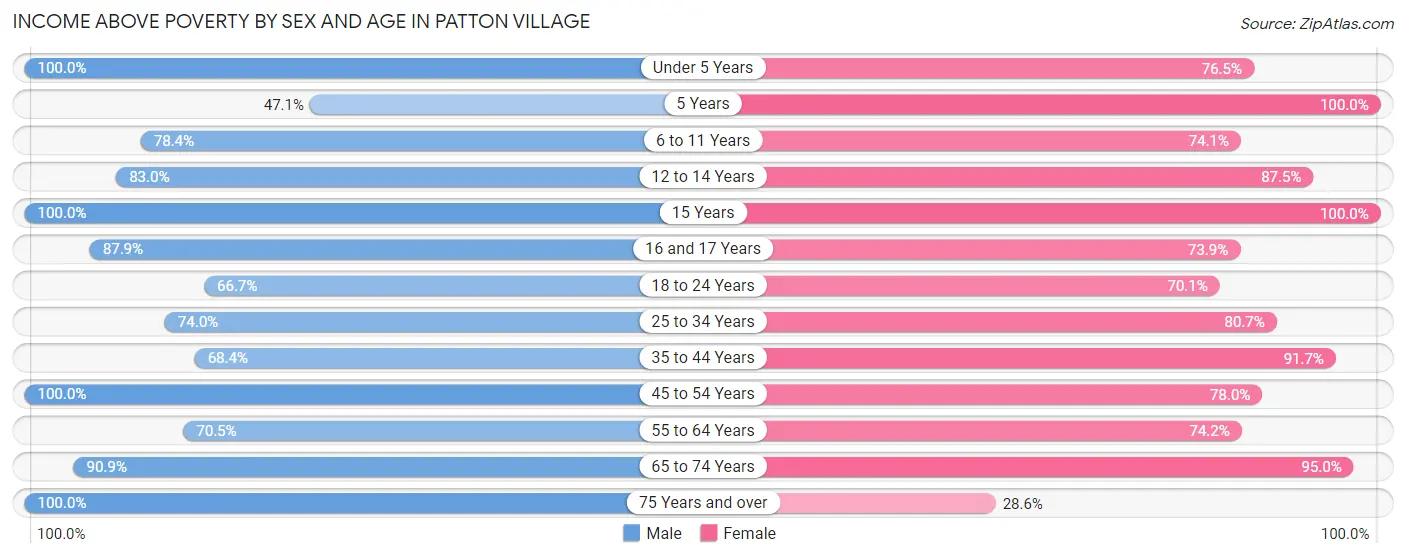
| Age Bracket | Male | Female |
| Under 5 Years | 32 (100.0%) | 13 (76.5%) |
| 5 Years | 8 (47.1%) | 3 (100.0%) |
| 6 to 11 Years | 40 (78.4%) | 80 (74.1%) |
| 12 to 14 Years | 39 (83.0%) | 28 (87.5%) |
| 15 Years | 3 (100.0%) | 10 (100.0%) |
| 16 and 17 Years | 29 (87.9%) | 17 (73.9%) |
| 18 to 24 Years | 34 (66.7%) | 61 (70.1%) |
| 25 to 34 Years | 88 (74.0%) | 46 (80.7%) |
| 35 to 44 Years | 52 (68.4%) | 99 (91.7%) |
| 45 to 54 Years | 138 (100.0%) | 71 (78.0%) |
| 55 to 64 Years | 67 (70.5%) | 46 (74.2%) |
| 65 to 74 Years | 60 (90.9%) | 57 (95.0%) |
| 75 Years and over | 17 (100.0%) | 4 (28.6%) |
| Total | 607 (81.5%) | 535 (79.6%) |
Income Below Poverty Among Married-Couple Families in Patton Village
The poverty statistics for married-couple families in Patton Village show that 13.6% or 34 of the total 251 families live below the poverty line. Families with 5 or more children have the highest poverty rate of 100.0%, comprising of 2 families. On the other hand, families with 1 or 2 children have the lowest poverty rate of 7.1%, which includes 4 families.
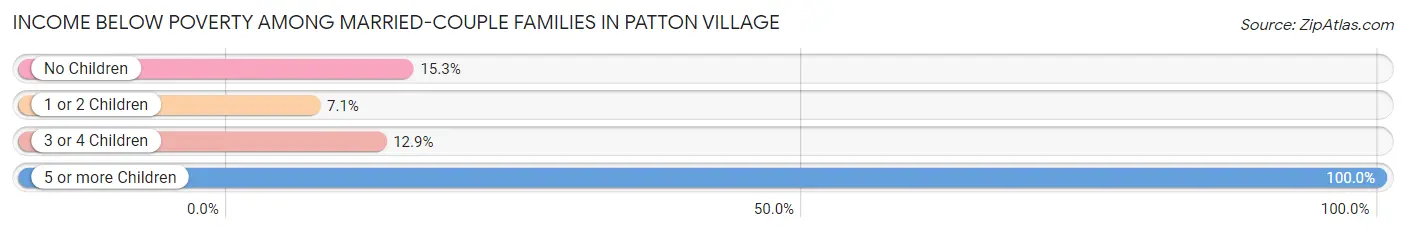
| Children | Above Poverty | Below Poverty |
| No Children | 111 (84.7%) | 20 (15.3%) |
| 1 or 2 Children | 52 (92.9%) | 4 (7.1%) |
| 3 or 4 Children | 54 (87.1%) | 8 (12.9%) |
| 5 or more Children | 0 (0.0%) | 2 (100.0%) |
| Total | 217 (86.5%) | 34 (13.6%) |
Income Below Poverty Among Single-Parent Households in Patton Village
According to the poverty data in Patton Village, 21.0% or 8 single-father households and 5.8% or 3 single-mother households are living below the poverty line. Among single-father households, those with no children have the highest poverty rate, with 8 households (25.8%) experiencing poverty. Likewise, among single-mother households, those with 3 or 4 children have the highest poverty rate, with 3 households (100.0%) falling below the poverty line.
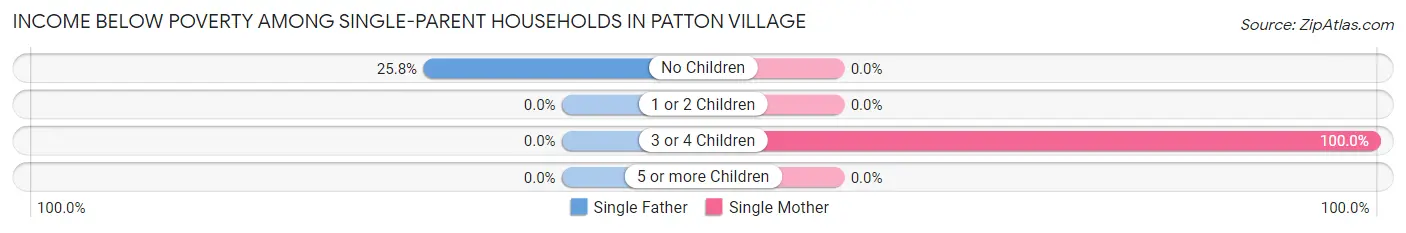
| Children | Single Father | Single Mother |
| No Children | 8 (25.8%) | 0 (0.0%) |
| 1 or 2 Children | 0 (0.0%) | 0 (0.0%) |
| 3 or 4 Children | 0 (0.0%) | 3 (100.0%) |
| 5 or more Children | 0 (0.0%) | 0 (0.0%) |
| Total | 8 (21.0%) | 3 (5.8%) |
Income Below Poverty Among Married-Couple vs Single-Parent Households in Patton Village
The poverty data for Patton Village shows that 34 of the married-couple family households (13.6%) and 11 of the single-parent households (12.2%) are living below the poverty level. Within the married-couple family households, those with 5 or more children have the highest poverty rate, with 2 households (100.0%) falling below the poverty line. Among the single-parent households, those with 3 or 4 children have the highest poverty rate, with 3 household (100.0%) living below poverty.
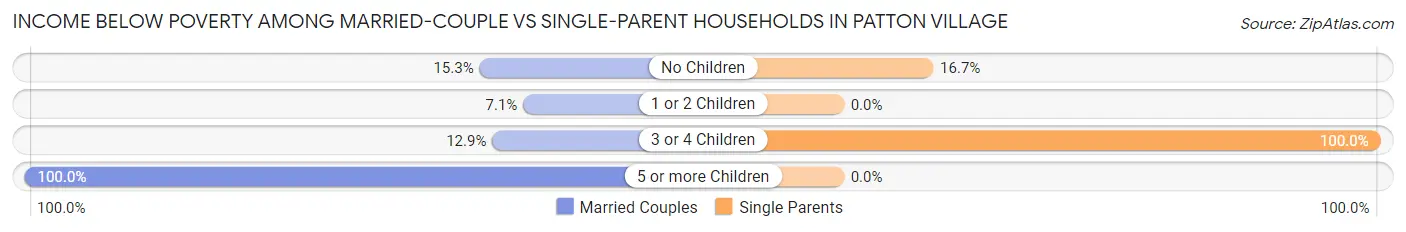
| Children | Married-Couple Families | Single-Parent Households |
| No Children | 20 (15.3%) | 8 (16.7%) |
| 1 or 2 Children | 4 (7.1%) | 0 (0.0%) |
| 3 or 4 Children | 8 (12.9%) | 3 (100.0%) |
| 5 or more Children | 2 (100.0%) | 0 (0.0%) |
| Total | 34 (13.6%) | 11 (12.2%) |
Employment Characteristics in Patton Village
Employment by Class of Employer in Patton Village
Among the 601 employed individuals in Patton Village, private company employees (508 | 84.5%), self-employed (not incorporated) (46 | 7.6%), and local government employees (14 | 2.3%) make up the most common classes of employment.
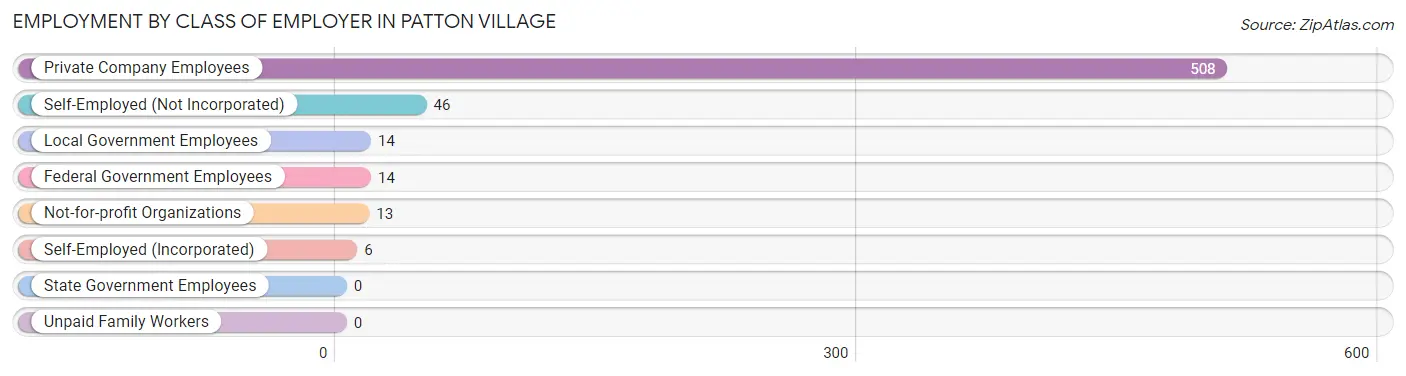
| Employer Class | # Employees | % Employees |
| Private Company Employees | 508 | 84.5% |
| Self-Employed (Incorporated) | 6 | 1.0% |
| Self-Employed (Not Incorporated) | 46 | 7.6% |
| Not-for-profit Organizations | 13 | 2.2% |
| Local Government Employees | 14 | 2.3% |
| State Government Employees | 0 | 0.0% |
| Federal Government Employees | 14 | 2.3% |
| Unpaid Family Workers | 0 | 0.0% |
| Total | 601 | 100.0% |
Employment Status by Age in Patton Village
According to the labor force statistics for Patton Village, out of the total population over 16 years of age (1,097), 59.2% or 649 individuals are in the labor force, with 6.8% or 44 of them unemployed. The age group with the highest labor force participation rate is 45 to 54 years, with 83.4% or 191 individuals in the labor force. Within the labor force, the 16 to 19 years age range has the highest percentage of unemployed individuals, with 23.1% or 12 of them being unemployed.
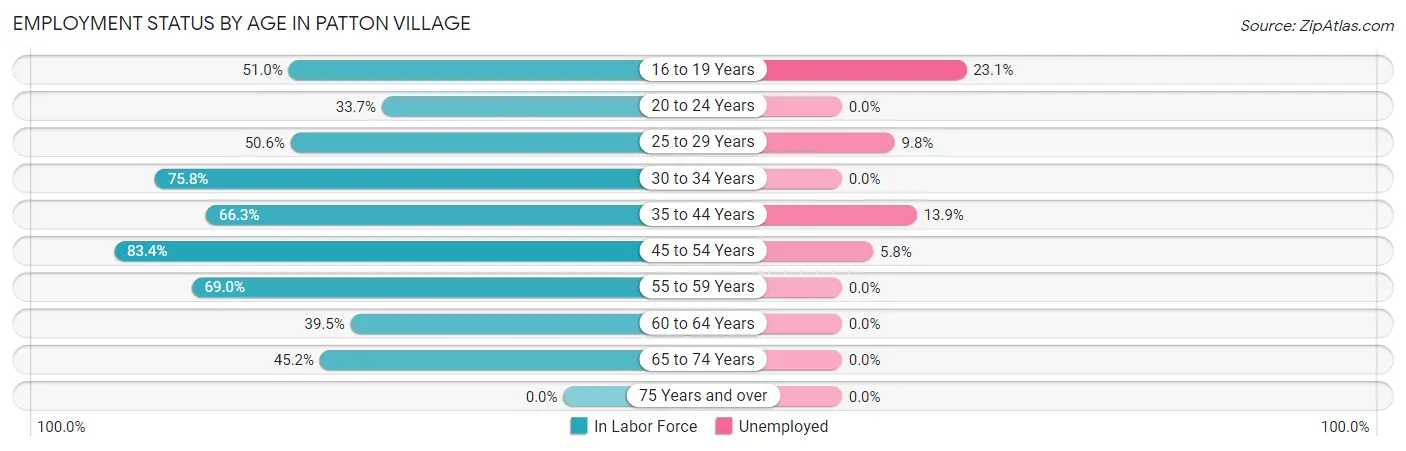
| Age Bracket | In Labor Force | Unemployed |
| 16 to 19 Years | 52 (51.0%) | 12 (23.1%) |
| 20 to 24 Years | 31 (33.7%) | 0 (0.0%) |
| 25 to 29 Years | 41 (50.6%) | 4 (9.8%) |
| 30 to 34 Years | 72 (75.8%) | 0 (0.0%) |
| 35 to 44 Years | 122 (66.3%) | 17 (13.9%) |
| 45 to 54 Years | 191 (83.4%) | 11 (5.8%) |
| 55 to 59 Years | 49 (69.0%) | 0 (0.0%) |
| 60 to 64 Years | 34 (39.5%) | 0 (0.0%) |
| 65 to 74 Years | 57 (45.2%) | 0 (0.0%) |
| 75 Years and over | 0 (0.0%) | 0 (0.0%) |
| Total | 649 (59.2%) | 44 (6.8%) |
Employment Status by Educational Attainment in Patton Village
According to labor force statistics for Patton Village, 68.2% of individuals (509) out of the total population between 25 and 64 years of age (746) are in the labor force, with 6.3% or 32 of them being unemployed. The group with the highest labor force participation rate are those with the educational attainment of college / associate degree, with 80.5% or 107 individuals in the labor force. Within the labor force, individuals with less than high school education have the highest percentage of unemployment, with 11.9% or 16 of them being unemployed.
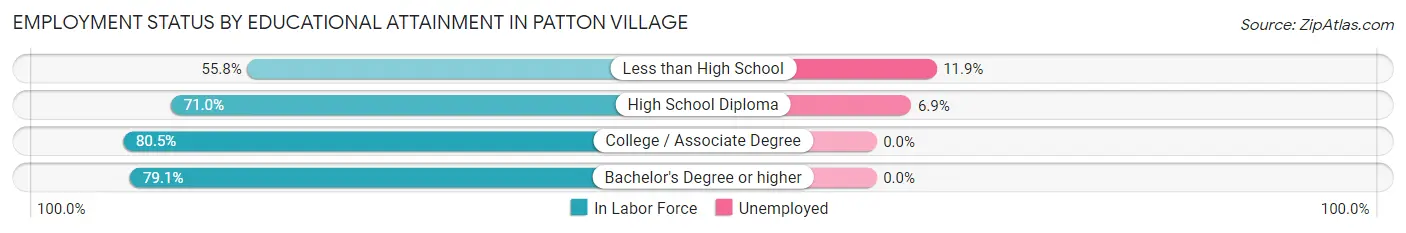
| Educational Attainment | In Labor Force | Unemployed |
| Less than High School | 135 (55.8%) | 29 (11.9%) |
| High School Diploma | 233 (71.0%) | 23 (6.9%) |
| College / Associate Degree | 107 (80.5%) | 0 (0.0%) |
| Bachelor's Degree or higher | 34 (79.1%) | 0 (0.0%) |
| Total | 509 (68.2%) | 47 (6.3%) |
Employment Occupations by Sex in Patton Village
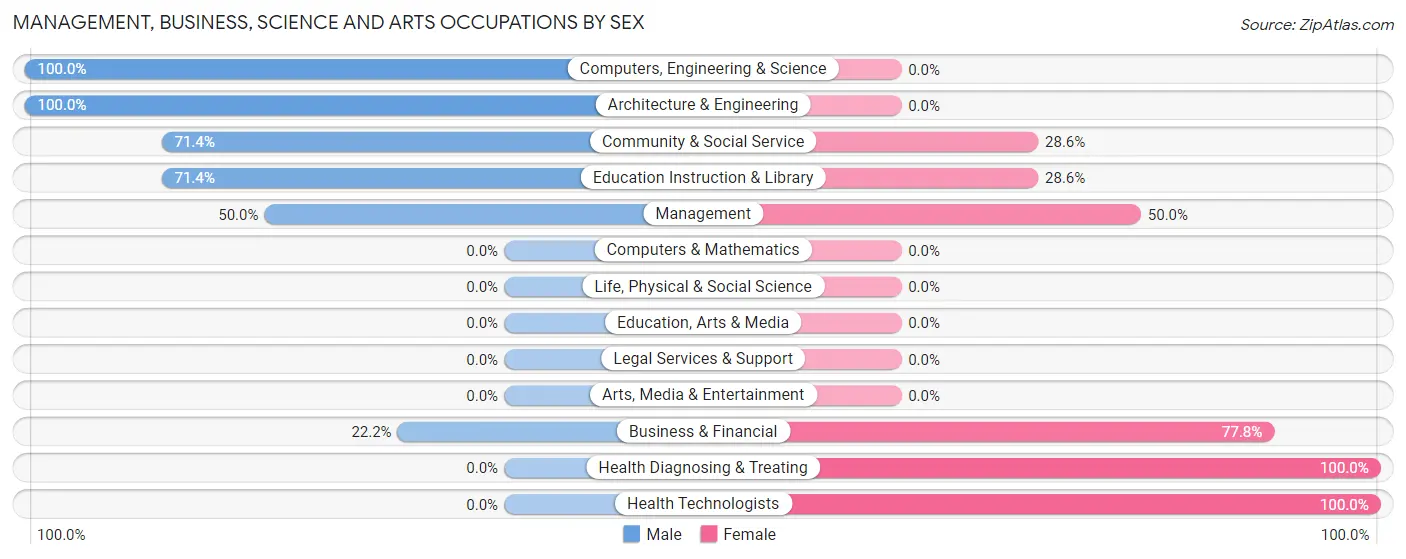
Management, Business, Science and Arts Occupations
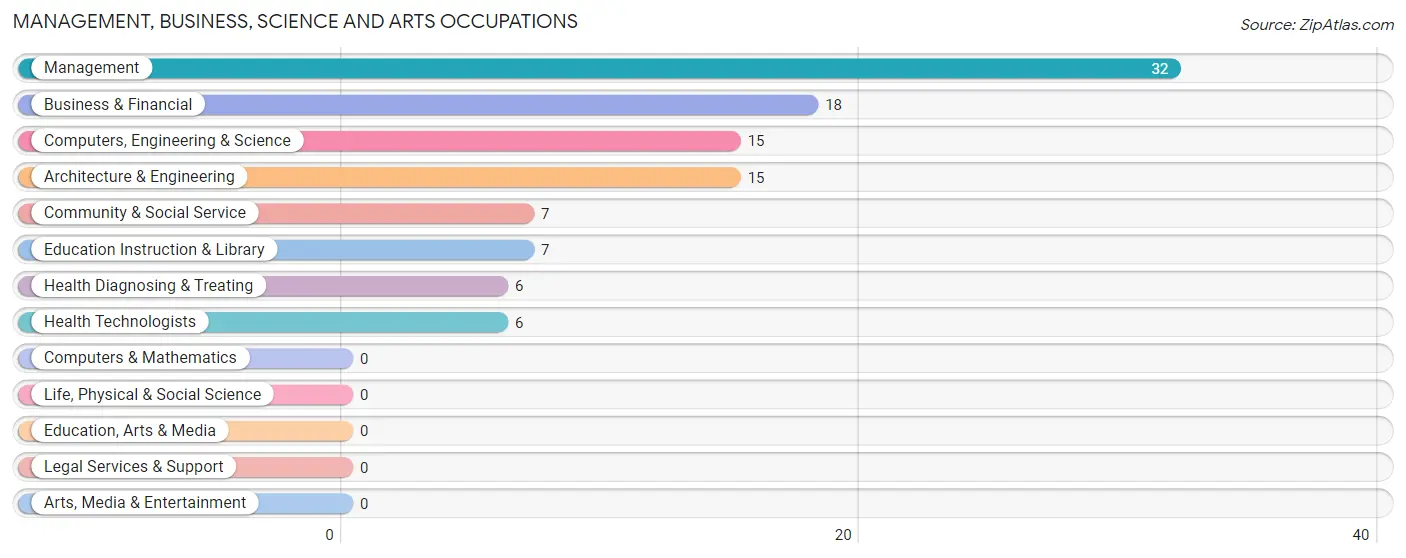
The most common Management, Business, Science and Arts occupations in Patton Village are Management (32 | 5.3%), Business & Financial (18 | 3.0%), Computers, Engineering & Science (15 | 2.5%), Architecture & Engineering (15 | 2.5%), and Community & Social Service (7 | 1.2%).
Management, Business, Science and Arts Occupations by Sex
Within the Management, Business, Science and Arts occupations in Patton Village, the most male-oriented occupations are Computers, Engineering & Science (100.0%), Architecture & Engineering (100.0%), and Community & Social Service (71.4%), while the most female-oriented occupations are Health Diagnosing & Treating (100.0%), Health Technologists (100.0%), and Business & Financial (77.8%).
| Occupation | Male | Female |
| Management | 16 (50.0%) | 16 (50.0%) |
| Business & Financial | 4 (22.2%) | 14 (77.8%) |
| Computers, Engineering & Science | 15 (100.0%) | 0 (0.0%) |
| Computers & Mathematics | 0 (0.0%) | 0 (0.0%) |
| Architecture & Engineering | 15 (100.0%) | 0 (0.0%) |
| Life, Physical & Social Science | 0 (0.0%) | 0 (0.0%) |
| Community & Social Service | 5 (71.4%) | 2 (28.6%) |
| Education, Arts & Media | 0 (0.0%) | 0 (0.0%) |
| Legal Services & Support | 0 (0.0%) | 0 (0.0%) |
| Education Instruction & Library | 5 (71.4%) | 2 (28.6%) |
| Arts, Media & Entertainment | 0 (0.0%) | 0 (0.0%) |
| Health Diagnosing & Treating | 0 (0.0%) | 6 (100.0%) |
| Health Technologists | 0 (0.0%) | 6 (100.0%) |
| Total (Category) | 40 (51.3%) | 38 (48.7%) |
| Total (Overall) | 370 (61.2%) | 235 (38.8%) |
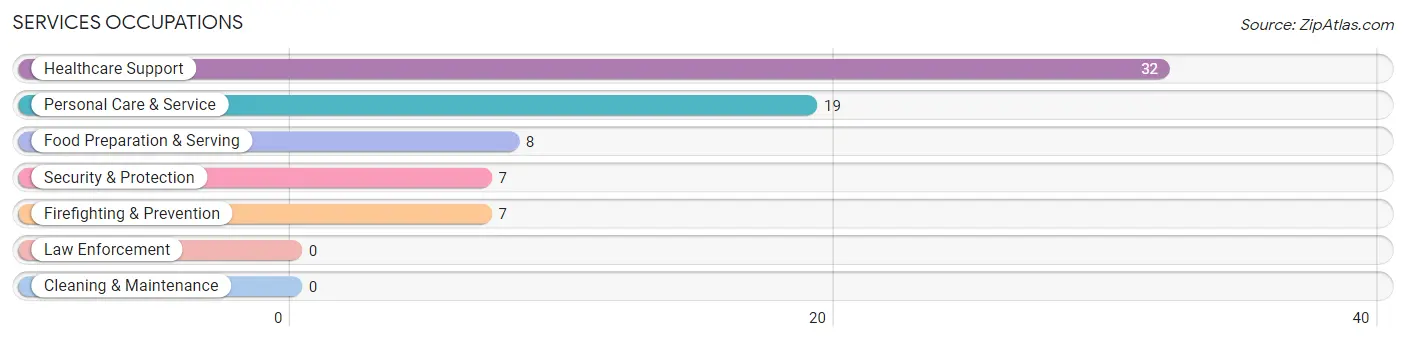
Services Occupations
The most common Services occupations in Patton Village are Healthcare Support (32 | 5.3%), Personal Care & Service (19 | 3.1%), Food Preparation & Serving (8 | 1.3%), Security & Protection (7 | 1.2%), and Firefighting & Prevention (7 | 1.2%).
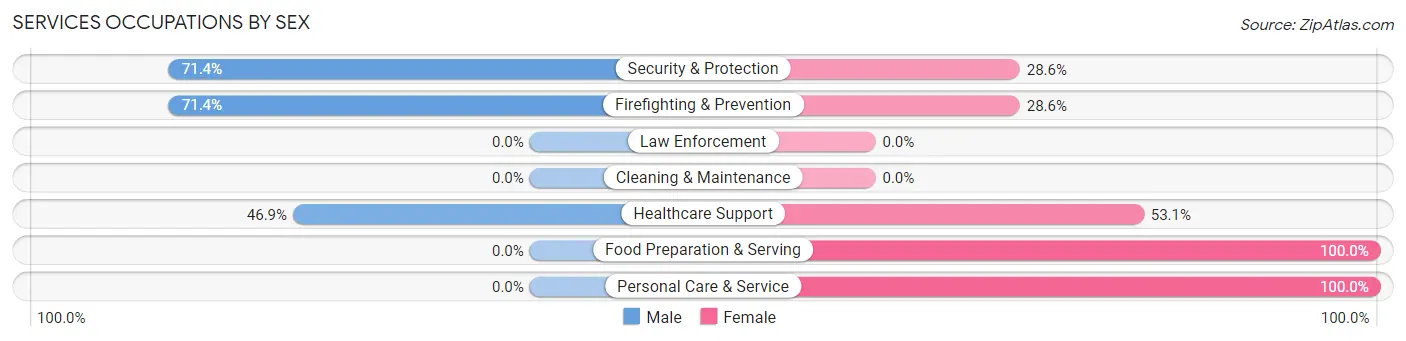
Services Occupations by Sex
Within the Services occupations in Patton Village, the most male-oriented occupations are Security & Protection (71.4%), Firefighting & Prevention (71.4%), and Healthcare Support (46.9%), while the most female-oriented occupations are Food Preparation & Serving (100.0%), Personal Care & Service (100.0%), and Healthcare Support (53.1%).
| Occupation | Male | Female |
| Healthcare Support | 15 (46.9%) | 17 (53.1%) |
| Security & Protection | 5 (71.4%) | 2 (28.6%) |
| Firefighting & Prevention | 5 (71.4%) | 2 (28.6%) |
| Law Enforcement | 0 (0.0%) | 0 (0.0%) |
| Food Preparation & Serving | 0 (0.0%) | 8 (100.0%) |
| Cleaning & Maintenance | 0 (0.0%) | 0 (0.0%) |
| Personal Care & Service | 0 (0.0%) | 19 (100.0%) |
| Total (Category) | 20 (30.3%) | 46 (69.7%) |
| Total (Overall) | 370 (61.2%) | 235 (38.8%) |
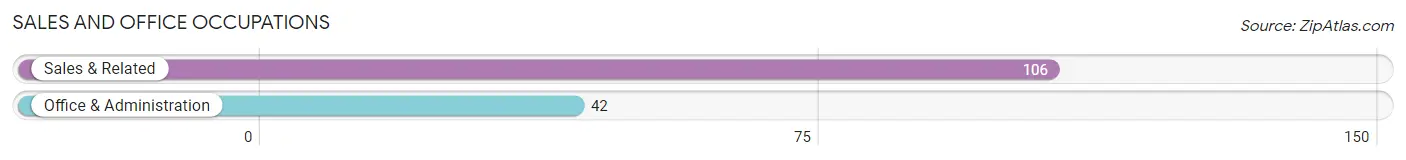
Sales and Office Occupations
The most common Sales and Office occupations in Patton Village are Sales & Related (106 | 17.5%), and Office & Administration (42 | 6.9%).
Sales and Office Occupations by Sex
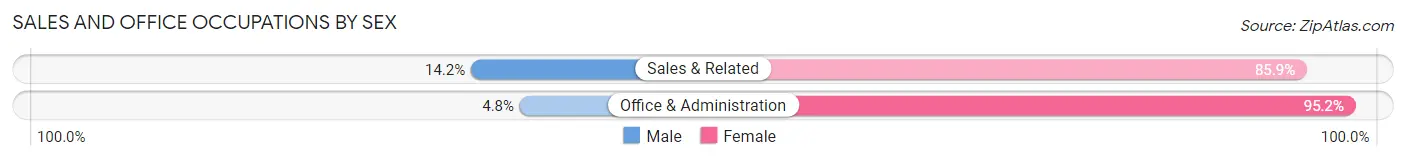
| Occupation | Male | Female |
| Sales & Related | 15 (14.1%) | 91 (85.9%) |
| Office & Administration | 2 (4.8%) | 40 (95.2%) |
| Total (Category) | 17 (11.5%) | 131 (88.5%) |
| Total (Overall) | 370 (61.2%) | 235 (38.8%) |
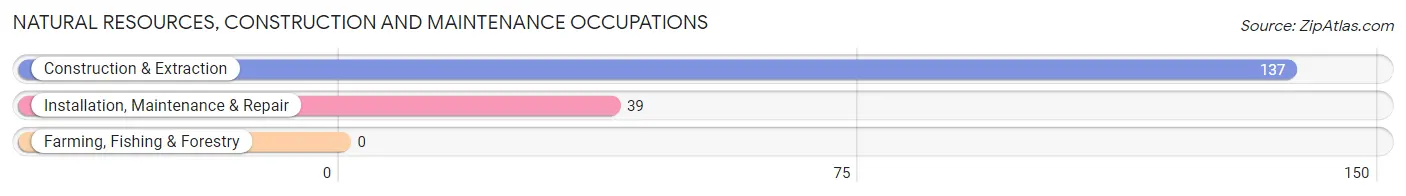
Natural Resources, Construction and Maintenance Occupations
The most common Natural Resources, Construction and Maintenance occupations in Patton Village are Construction & Extraction (137 | 22.6%), and Installation, Maintenance & Repair (39 | 6.5%).
Natural Resources, Construction and Maintenance Occupations by Sex
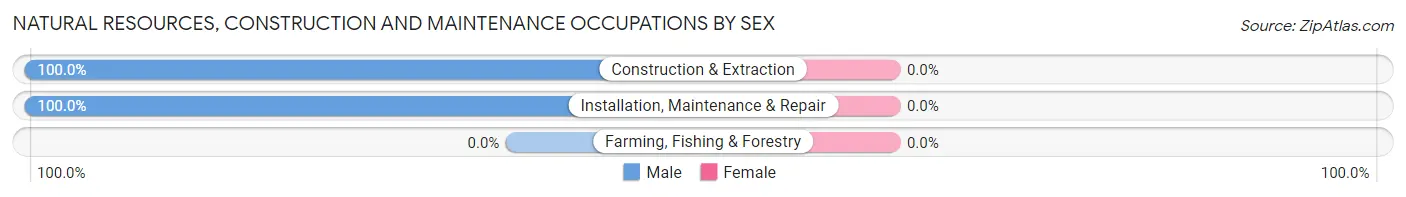
| Occupation | Male | Female |
| Farming, Fishing & Forestry | 0 (0.0%) | 0 (0.0%) |
| Construction & Extraction | 137 (100.0%) | 0 (0.0%) |
| Installation, Maintenance & Repair | 39 (100.0%) | 0 (0.0%) |
| Total (Category) | 176 (100.0%) | 0 (0.0%) |
| Total (Overall) | 370 (61.2%) | 235 (38.8%) |
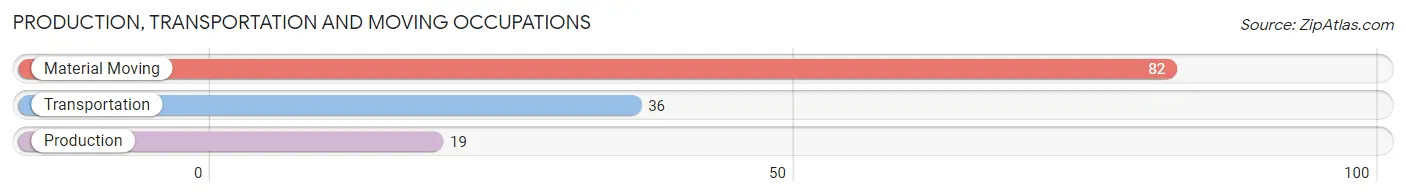
Production, Transportation and Moving Occupations
The most common Production, Transportation and Moving occupations in Patton Village are Material Moving (82 | 13.6%), Transportation (36 | 5.9%), and Production (19 | 3.1%).
Production, Transportation and Moving Occupations by Sex
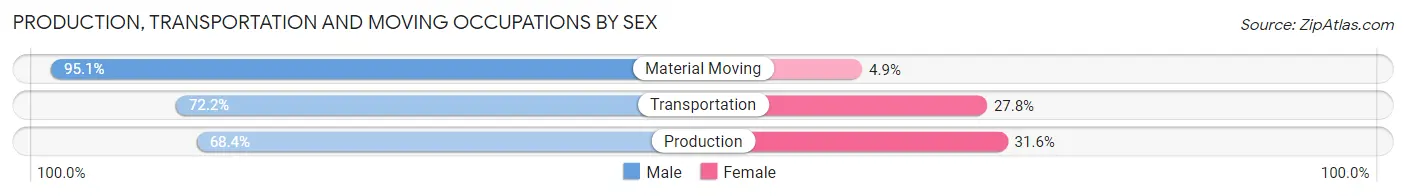
| Occupation | Male | Female |
| Production | 13 (68.4%) | 6 (31.6%) |
| Transportation | 26 (72.2%) | 10 (27.8%) |
| Material Moving | 78 (95.1%) | 4 (4.9%) |
| Total (Category) | 117 (85.4%) | 20 (14.6%) |
| Total (Overall) | 370 (61.2%) | 235 (38.8%) |
Employment Industries by Sex in Patton Village
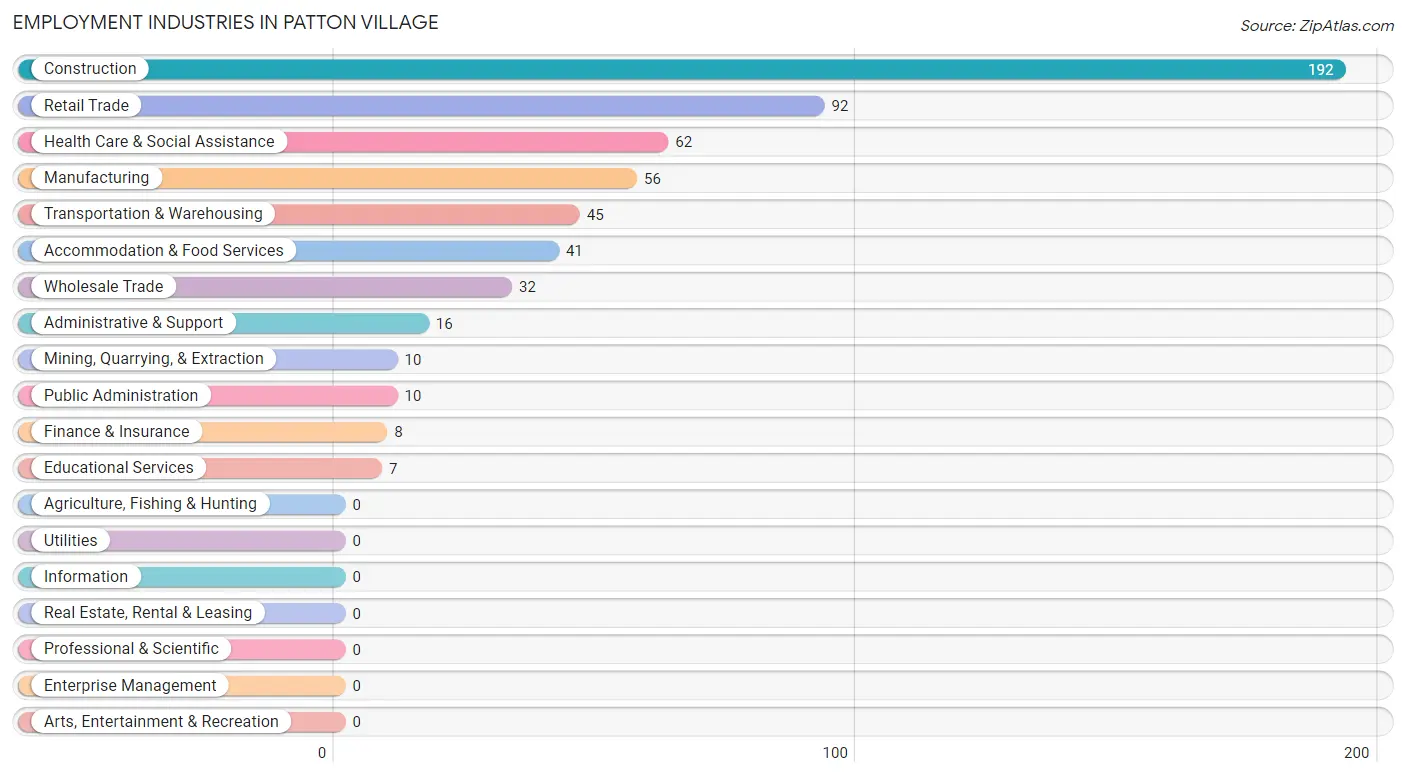
Employment Industries in Patton Village
The major employment industries in Patton Village include Construction (192 | 31.7%), Retail Trade (92 | 15.2%), Health Care & Social Assistance (62 | 10.2%), Manufacturing (56 | 9.3%), and Transportation & Warehousing (45 | 7.4%).
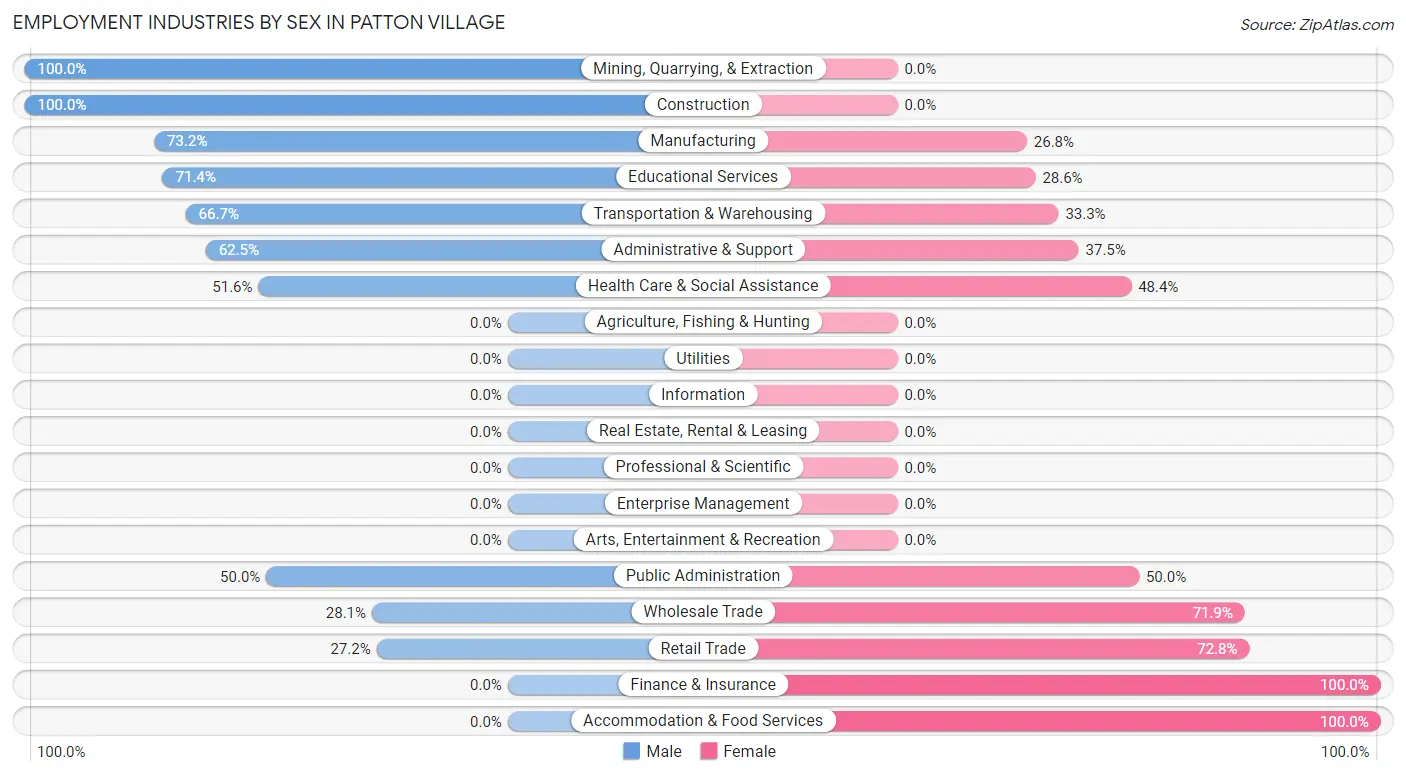
Employment Industries by Sex in Patton Village
The Patton Village industries that see more men than women are Mining, Quarrying, & Extraction (100.0%), Construction (100.0%), and Manufacturing (73.2%), whereas the industries that tend to have a higher number of women are Finance & Insurance (100.0%), Accommodation & Food Services (100.0%), and Retail Trade (72.8%).
| Industry | Male | Female |
| Agriculture, Fishing & Hunting | 0 (0.0%) | 0 (0.0%) |
| Mining, Quarrying, & Extraction | 10 (100.0%) | 0 (0.0%) |
| Construction | 192 (100.0%) | 0 (0.0%) |
| Manufacturing | 41 (73.2%) | 15 (26.8%) |
| Wholesale Trade | 9 (28.1%) | 23 (71.9%) |
| Retail Trade | 25 (27.2%) | 67 (72.8%) |
| Transportation & Warehousing | 30 (66.7%) | 15 (33.3%) |
| Utilities | 0 (0.0%) | 0 (0.0%) |
| Information | 0 (0.0%) | 0 (0.0%) |
| Finance & Insurance | 0 (0.0%) | 8 (100.0%) |
| Real Estate, Rental & Leasing | 0 (0.0%) | 0 (0.0%) |
| Professional & Scientific | 0 (0.0%) | 0 (0.0%) |
| Enterprise Management | 0 (0.0%) | 0 (0.0%) |
| Administrative & Support | 10 (62.5%) | 6 (37.5%) |
| Educational Services | 5 (71.4%) | 2 (28.6%) |
| Health Care & Social Assistance | 32 (51.6%) | 30 (48.4%) |
| Arts, Entertainment & Recreation | 0 (0.0%) | 0 (0.0%) |
| Accommodation & Food Services | 0 (0.0%) | 41 (100.0%) |
| Public Administration | 5 (50.0%) | 5 (50.0%) |
| Total | 370 (61.2%) | 235 (38.8%) |
Education in Patton Village
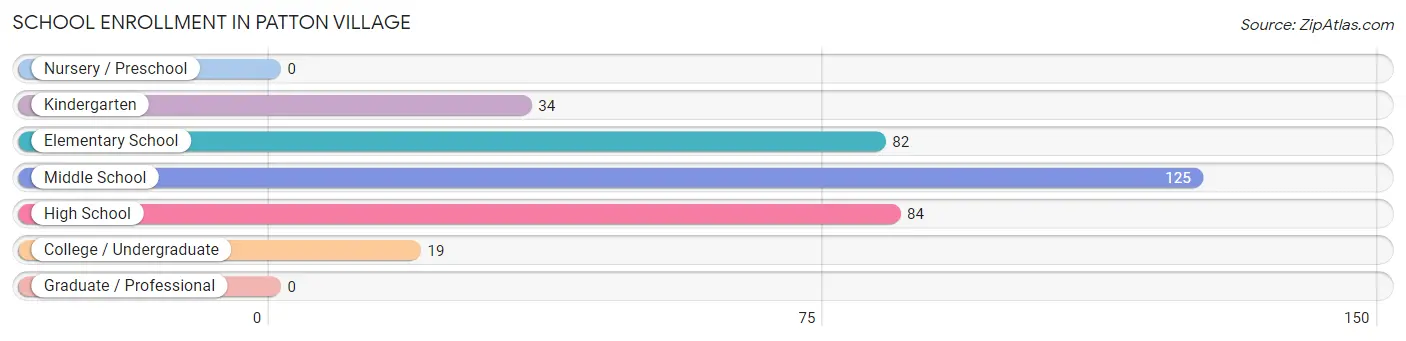
School Enrollment in Patton Village
The most common levels of schooling among the 344 students in Patton Village are middle school (125 | 36.3%), high school (84 | 24.4%), and elementary school (82 | 23.8%).
| School Level | # Students | % Students |
| Nursery / Preschool | 0 | 0.0% |
| Kindergarten | 34 | 9.9% |
| Elementary School | 82 | 23.8% |
| Middle School | 125 | 36.3% |
| High School | 84 | 24.4% |
| College / Undergraduate | 19 | 5.5% |
| Graduate / Professional | 0 | 0.0% |
| Total | 344 | 100.0% |
School Enrollment by Age by Funding Source in Patton Village
Out of a total of 344 students who are enrolled in schools in Patton Village, 13 (3.8%) attend a private institution, while the remaining 331 (96.2%) are enrolled in public schools. The age group of 15 to 17 year olds has the highest likelihood of being enrolled in private schools, with 6 (8.7% in the age bracket) enrolled. Conversely, the age group of 5 to 9 year old has the lowest likelihood of being enrolled in a private school, with 112 (100.0% in the age bracket) attending a public institution.
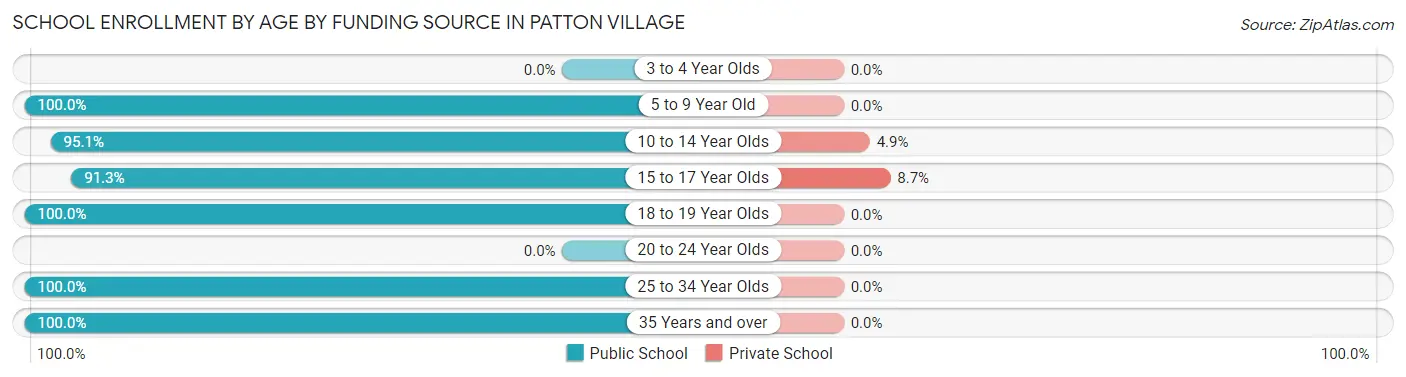
| Age Bracket | Public School | Private School |
| 3 to 4 Year Olds | 0 (0.0%) | 0 (0.0%) |
| 5 to 9 Year Old | 112 (100.0%) | 0 (0.0%) |
| 10 to 14 Year Olds | 137 (95.1%) | 7 (4.9%) |
| 15 to 17 Year Olds | 63 (91.3%) | 6 (8.7%) |
| 18 to 19 Year Olds | 8 (100.0%) | 0 (0.0%) |
| 20 to 24 Year Olds | 0 (0.0%) | 0 (0.0%) |
| 25 to 34 Year Olds | 5 (100.0%) | 0 (0.0%) |
| 35 Years and over | 6 (100.0%) | 0 (0.0%) |
| Total | 331 (96.2%) | 13 (3.8%) |
Educational Attainment by Field of Study in Patton Village
Business (20 | 46.5%), social sciences (8 | 18.6%), engineering (6 | 14.0%), education (6 | 14.0%), and multidisciplinary studies (2 | 4.6%) are the most common fields of study among 43 individuals in Patton Village who have obtained a bachelor's degree or higher.
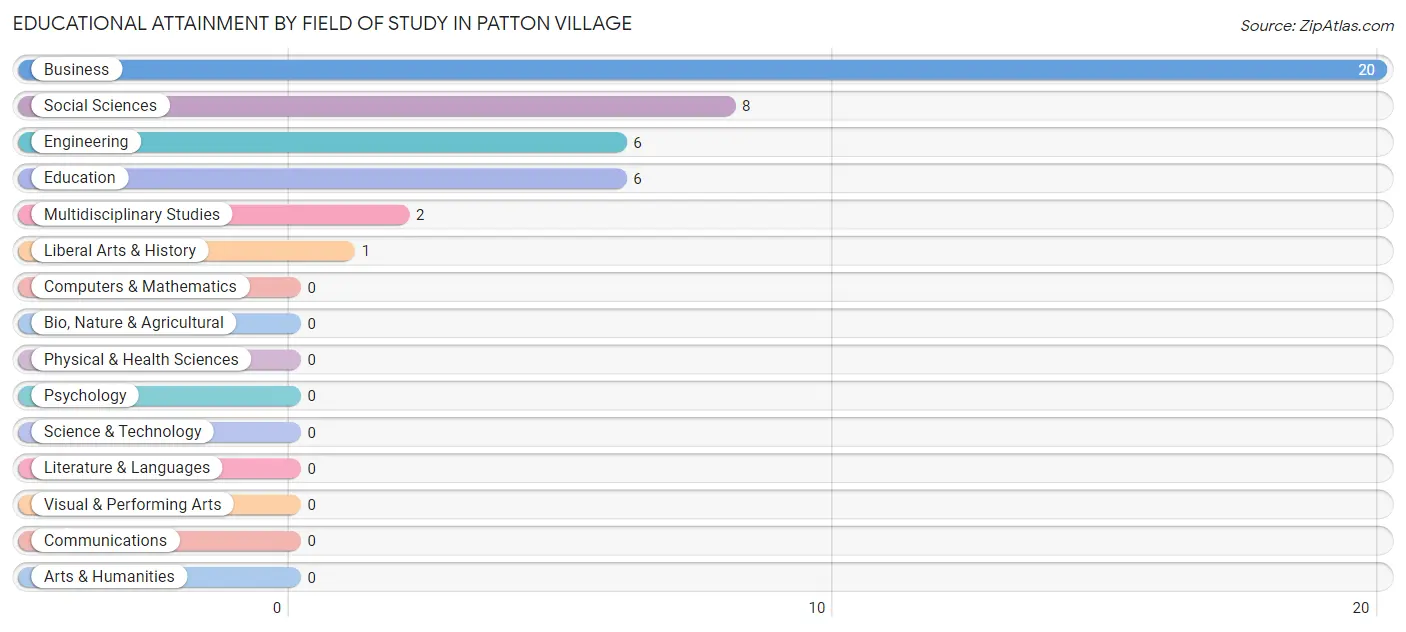
| Field of Study | # Graduates | % Graduates |
| Computers & Mathematics | 0 | 0.0% |
| Bio, Nature & Agricultural | 0 | 0.0% |
| Physical & Health Sciences | 0 | 0.0% |
| Psychology | 0 | 0.0% |
| Social Sciences | 8 | 18.6% |
| Engineering | 6 | 14.0% |
| Multidisciplinary Studies | 2 | 4.6% |
| Science & Technology | 0 | 0.0% |
| Business | 20 | 46.5% |
| Education | 6 | 14.0% |
| Literature & Languages | 0 | 0.0% |
| Liberal Arts & History | 1 | 2.3% |
| Visual & Performing Arts | 0 | 0.0% |
| Communications | 0 | 0.0% |
| Arts & Humanities | 0 | 0.0% |
| Total | 43 | 100.0% |
Transportation & Commute in Patton Village
Vehicle Availability by Sex in Patton Village
The most prevalent vehicle ownership categories in Patton Village are males with 5 or more vehicles (127, accounting for 34.3%) and females with 5 or more vehicles (79, making up 55.0%).
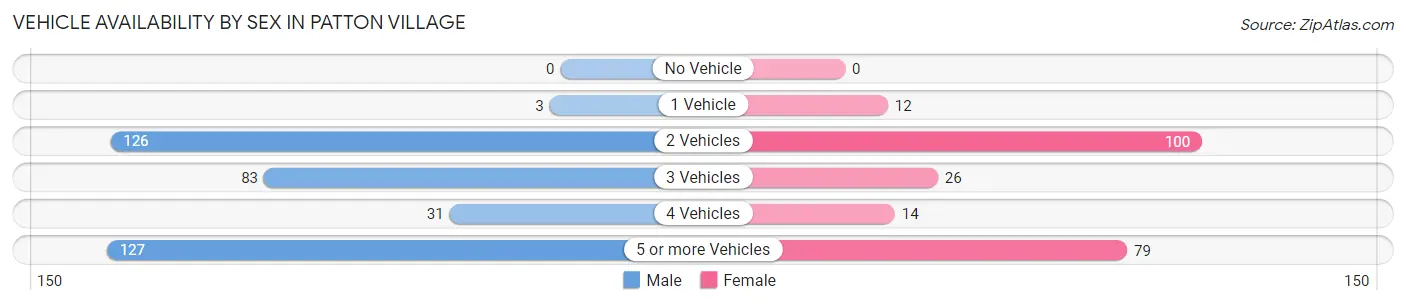
| Vehicles Available | Male | Female |
| No Vehicle | 0 (0.0%) | 0 (0.0%) |
| 1 Vehicle | 3 (0.8%) | 12 (5.2%) |
| 2 Vehicles | 126 (34.1%) | 100 (43.3%) |
| 3 Vehicles | 83 (22.4%) | 26 (11.3%) |
| 4 Vehicles | 31 (8.4%) | 14 (6.1%) |
| 5 or more Vehicles | 127 (34.3%) | 79 (34.2%) |
| Total | 370 (100.0%) | 231 (100.0%) |
Commute Time in Patton Village
The most frequently occuring commute durations in Patton Village are 20 to 24 minutes (110 commuters, 18.6%), 15 to 19 minutes (105 commuters, 17.7%), and 45 to 59 minutes (93 commuters, 15.7%).
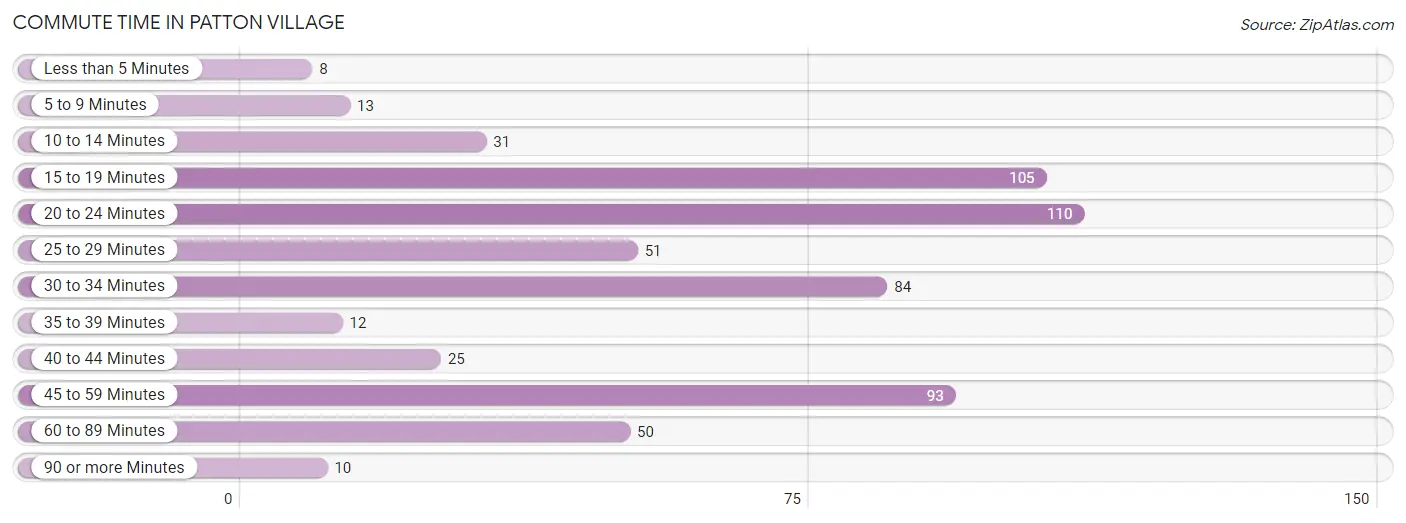
| Commute Time | # Commuters | % Commuters |
| Less than 5 Minutes | 8 | 1.3% |
| 5 to 9 Minutes | 13 | 2.2% |
| 10 to 14 Minutes | 31 | 5.2% |
| 15 to 19 Minutes | 105 | 17.7% |
| 20 to 24 Minutes | 110 | 18.6% |
| 25 to 29 Minutes | 51 | 8.6% |
| 30 to 34 Minutes | 84 | 14.2% |
| 35 to 39 Minutes | 12 | 2.0% |
| 40 to 44 Minutes | 25 | 4.2% |
| 45 to 59 Minutes | 93 | 15.7% |
| 60 to 89 Minutes | 50 | 8.5% |
| 90 or more Minutes | 10 | 1.7% |
Commute Time by Sex in Patton Village
The most common commute times in Patton Village are 45 to 59 minutes (93 commuters, 25.5%) for males and 15 to 19 minutes (70 commuters, 30.8%) for females.
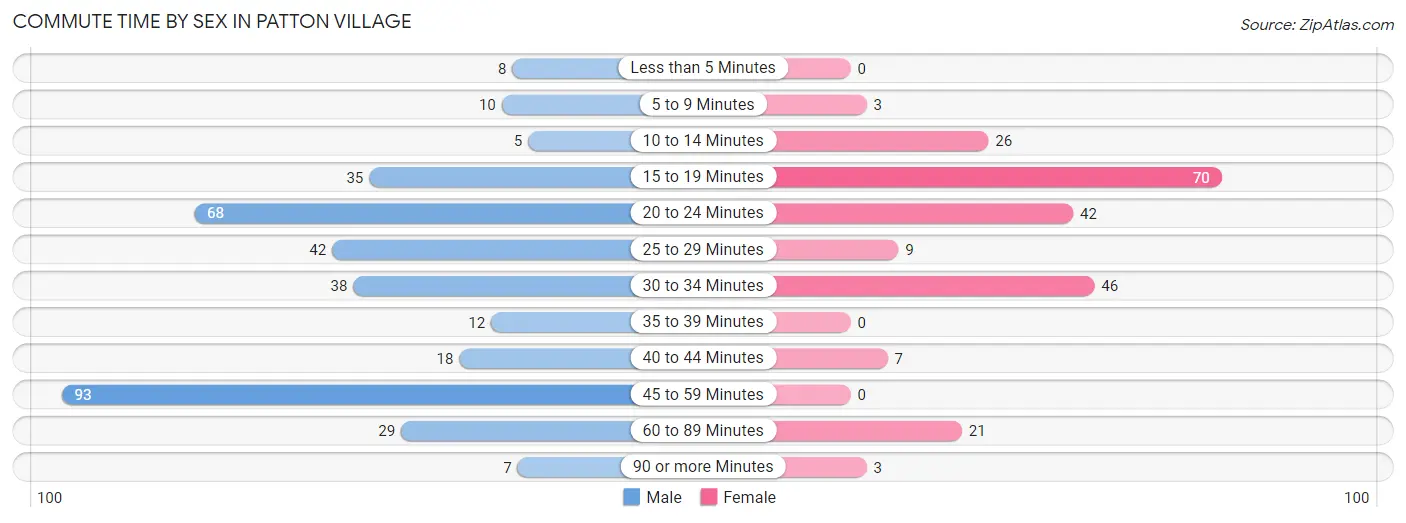
| Commute Time | Male | Female |
| Less than 5 Minutes | 8 (2.2%) | 0 (0.0%) |
| 5 to 9 Minutes | 10 (2.7%) | 3 (1.3%) |
| 10 to 14 Minutes | 5 (1.4%) | 26 (11.5%) |
| 15 to 19 Minutes | 35 (9.6%) | 70 (30.8%) |
| 20 to 24 Minutes | 68 (18.6%) | 42 (18.5%) |
| 25 to 29 Minutes | 42 (11.5%) | 9 (4.0%) |
| 30 to 34 Minutes | 38 (10.4%) | 46 (20.3%) |
| 35 to 39 Minutes | 12 (3.3%) | 0 (0.0%) |
| 40 to 44 Minutes | 18 (4.9%) | 7 (3.1%) |
| 45 to 59 Minutes | 93 (25.5%) | 0 (0.0%) |
| 60 to 89 Minutes | 29 (8.0%) | 21 (9.2%) |
| 90 or more Minutes | 7 (1.9%) | 3 (1.3%) |
Time of Departure to Work by Sex in Patton Village
The most frequent times of departure to work in Patton Village are 12:00 AM to 4:59 AM (142, 38.9%) for males and 12:00 AM to 4:59 AM (57, 25.1%) for females.
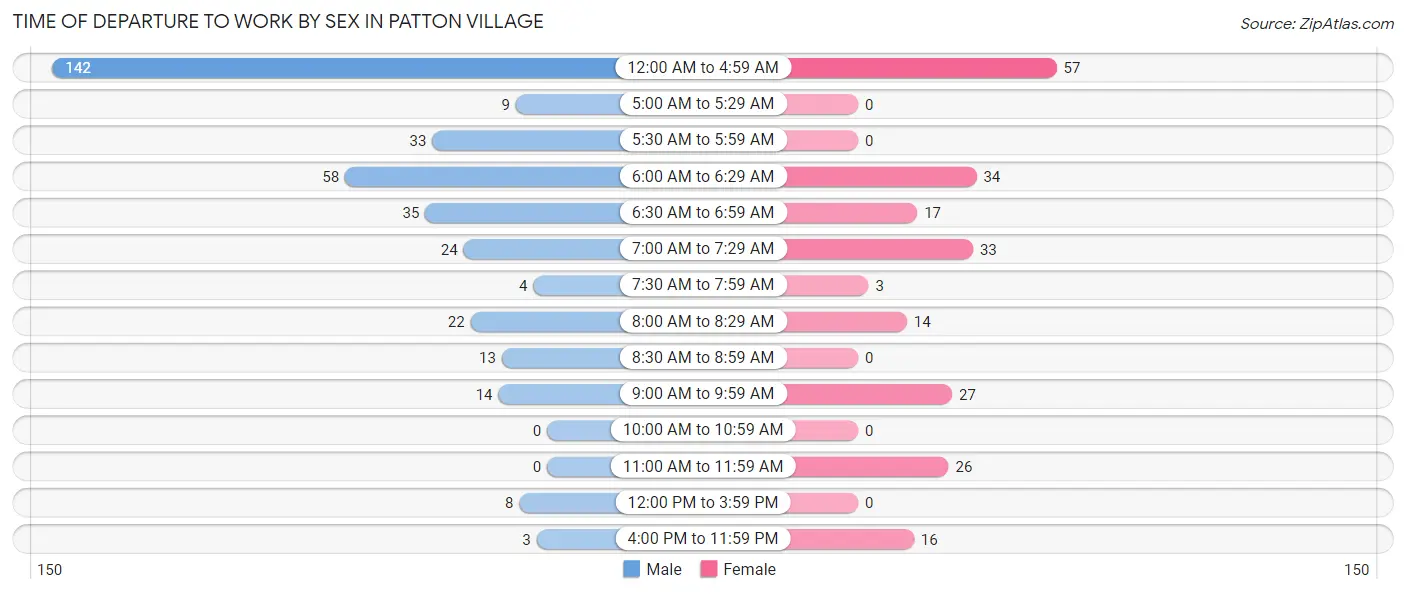
| Time of Departure | Male | Female |
| 12:00 AM to 4:59 AM | 142 (38.9%) | 57 (25.1%) |
| 5:00 AM to 5:29 AM | 9 (2.5%) | 0 (0.0%) |
| 5:30 AM to 5:59 AM | 33 (9.0%) | 0 (0.0%) |
| 6:00 AM to 6:29 AM | 58 (15.9%) | 34 (15.0%) |
| 6:30 AM to 6:59 AM | 35 (9.6%) | 17 (7.5%) |
| 7:00 AM to 7:29 AM | 24 (6.6%) | 33 (14.5%) |
| 7:30 AM to 7:59 AM | 4 (1.1%) | 3 (1.3%) |
| 8:00 AM to 8:29 AM | 22 (6.0%) | 14 (6.2%) |
| 8:30 AM to 8:59 AM | 13 (3.6%) | 0 (0.0%) |
| 9:00 AM to 9:59 AM | 14 (3.8%) | 27 (11.9%) |
| 10:00 AM to 10:59 AM | 0 (0.0%) | 0 (0.0%) |
| 11:00 AM to 11:59 AM | 0 (0.0%) | 26 (11.5%) |
| 12:00 PM to 3:59 PM | 8 (2.2%) | 0 (0.0%) |
| 4:00 PM to 11:59 PM | 3 (0.8%) | 16 (7.0%) |
| Total | 365 (100.0%) | 227 (100.0%) |
Housing Occupancy in Patton Village
Occupancy by Ownership in Patton Village
Of the total 429 dwellings in Patton Village, owner-occupied units account for 392 (91.4%), while renter-occupied units make up 37 (8.6%).
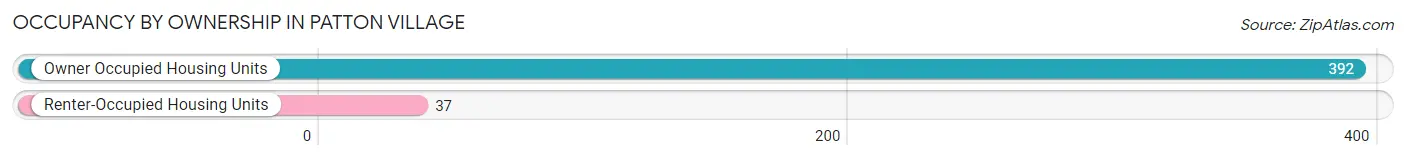
| Occupancy | # Housing Units | % Housing Units |
| Owner Occupied Housing Units | 392 | 91.4% |
| Renter-Occupied Housing Units | 37 | 8.6% |
| Total Occupied Housing Units | 429 | 100.0% |
Occupancy by Household Size in Patton Village
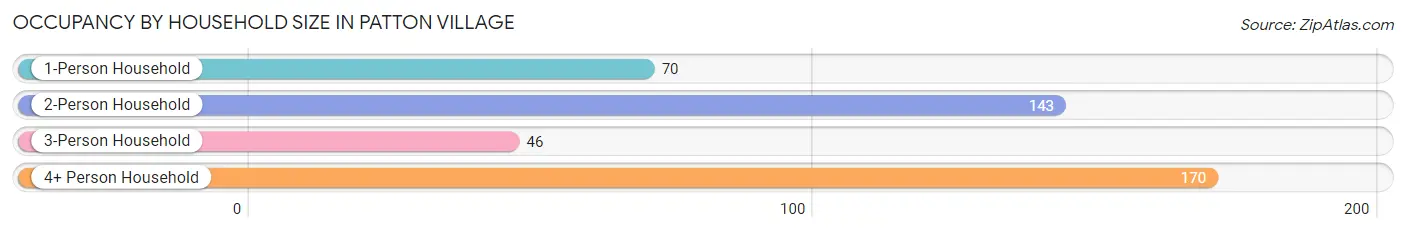
| Household Size | # Housing Units | % Housing Units |
| 1-Person Household | 70 | 16.3% |
| 2-Person Household | 143 | 33.3% |
| 3-Person Household | 46 | 10.7% |
| 4+ Person Household | 170 | 39.6% |
| Total Housing Units | 429 | 100.0% |
Occupancy by Ownership by Household Size in Patton Village
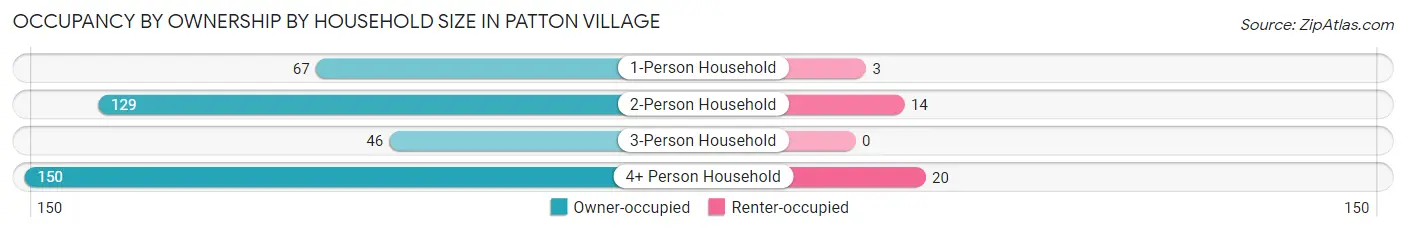
| Household Size | Owner-occupied | Renter-occupied |
| 1-Person Household | 67 (95.7%) | 3 (4.3%) |
| 2-Person Household | 129 (90.2%) | 14 (9.8%) |
| 3-Person Household | 46 (100.0%) | 0 (0.0%) |
| 4+ Person Household | 150 (88.2%) | 20 (11.8%) |
| Total Housing Units | 392 (91.4%) | 37 (8.6%) |
Occupancy by Educational Attainment in Patton Village
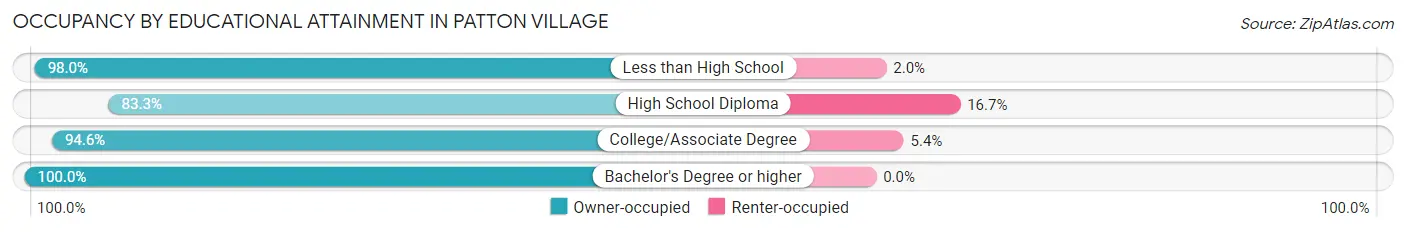
| Household Size | Owner-occupied | Renter-occupied |
| Less than High School | 146 (98.0%) | 3 (2.0%) |
| High School Diploma | 145 (83.3%) | 29 (16.7%) |
| College/Associate Degree | 87 (94.6%) | 5 (5.4%) |
| Bachelor's Degree or higher | 14 (100.0%) | 0 (0.0%) |
Occupancy by Age of Householder in Patton Village
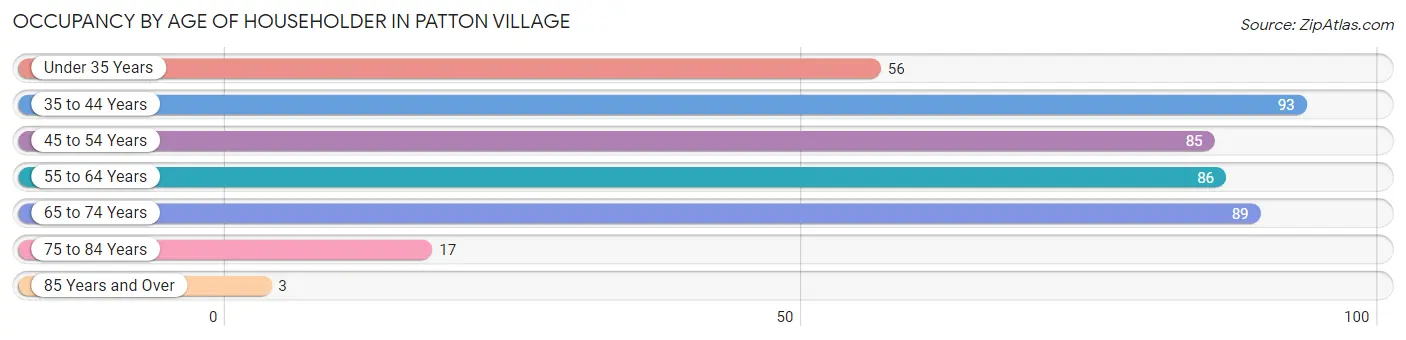
| Age Bracket | # Households | % Households |
| Under 35 Years | 56 | 13.1% |
| 35 to 44 Years | 93 | 21.7% |
| 45 to 54 Years | 85 | 19.8% |
| 55 to 64 Years | 86 | 20.1% |
| 65 to 74 Years | 89 | 20.7% |
| 75 to 84 Years | 17 | 4.0% |
| 85 Years and Over | 3 | 0.7% |
| Total | 429 | 100.0% |
Housing Finances in Patton Village
Median Income by Occupancy in Patton Village
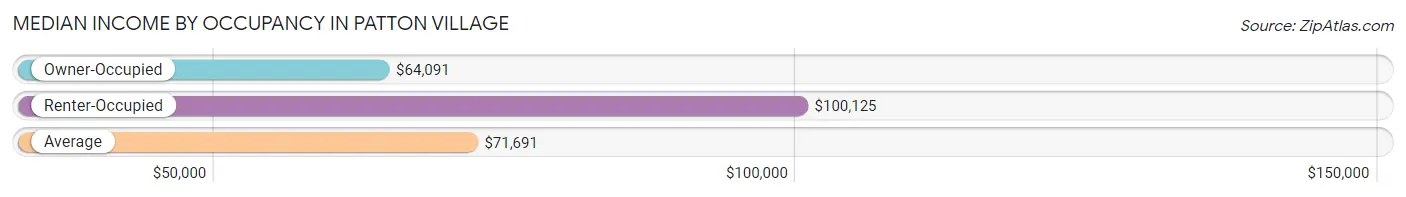
| Occupancy Type | # Households | Median Income |
| Owner-Occupied | 392 (91.4%) | $64,091 |
| Renter-Occupied | 37 (8.6%) | $100,125 |
| Average | 429 (100.0%) | $71,691 |
Occupancy by Householder Income Bracket in Patton Village
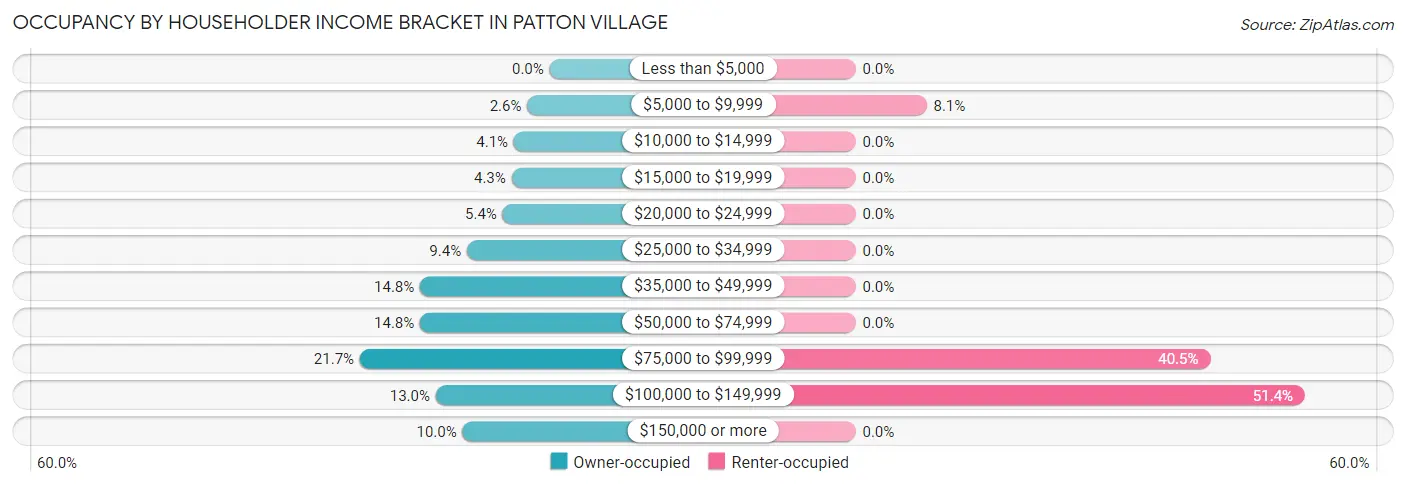
| Income Bracket | Owner-occupied | Renter-occupied |
| Less than $5,000 | 0 (0.0%) | 0 (0.0%) |
| $5,000 to $9,999 | 10 (2.5%) | 3 (8.1%) |
| $10,000 to $14,999 | 16 (4.1%) | 0 (0.0%) |
| $15,000 to $19,999 | 17 (4.3%) | 0 (0.0%) |
| $20,000 to $24,999 | 21 (5.4%) | 0 (0.0%) |
| $25,000 to $34,999 | 37 (9.4%) | 0 (0.0%) |
| $35,000 to $49,999 | 58 (14.8%) | 0 (0.0%) |
| $50,000 to $74,999 | 58 (14.8%) | 0 (0.0%) |
| $75,000 to $99,999 | 85 (21.7%) | 15 (40.5%) |
| $100,000 to $149,999 | 51 (13.0%) | 19 (51.3%) |
| $150,000 or more | 39 (10.0%) | 0 (0.0%) |
| Total | 392 (100.0%) | 37 (100.0%) |
Monthly Housing Cost Tiers in Patton Village
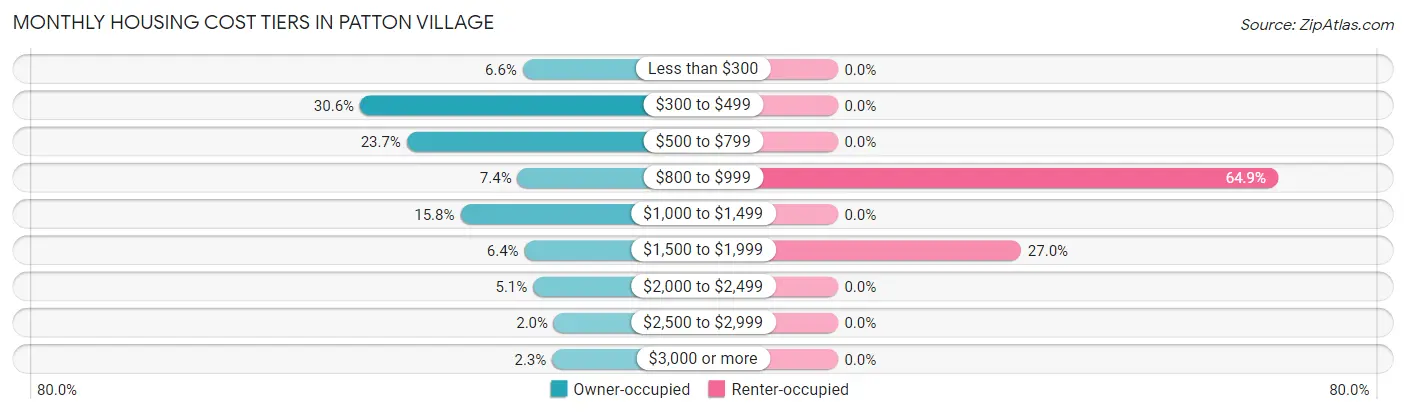
| Monthly Cost | Owner-occupied | Renter-occupied |
| Less than $300 | 26 (6.6%) | 0 (0.0%) |
| $300 to $499 | 120 (30.6%) | 0 (0.0%) |
| $500 to $799 | 93 (23.7%) | 0 (0.0%) |
| $800 to $999 | 29 (7.4%) | 24 (64.9%) |
| $1,000 to $1,499 | 62 (15.8%) | 0 (0.0%) |
| $1,500 to $1,999 | 25 (6.4%) | 10 (27.0%) |
| $2,000 to $2,499 | 20 (5.1%) | 0 (0.0%) |
| $2,500 to $2,999 | 8 (2.0%) | 0 (0.0%) |
| $3,000 or more | 9 (2.3%) | 0 (0.0%) |
| Total | 392 (100.0%) | 37 (100.0%) |
Physical Housing Characteristics in Patton Village
Housing Structures in Patton Village
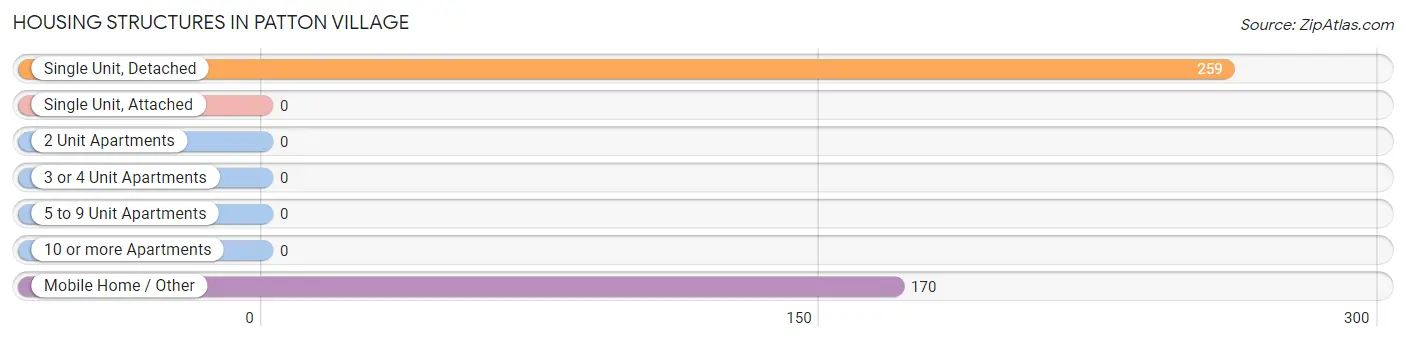
| Structure Type | # Housing Units | % Housing Units |
| Single Unit, Detached | 259 | 60.4% |
| Single Unit, Attached | 0 | 0.0% |
| 2 Unit Apartments | 0 | 0.0% |
| 3 or 4 Unit Apartments | 0 | 0.0% |
| 5 to 9 Unit Apartments | 0 | 0.0% |
| 10 or more Apartments | 0 | 0.0% |
| Mobile Home / Other | 170 | 39.6% |
| Total | 429 | 100.0% |
Housing Structures by Occupancy in Patton Village
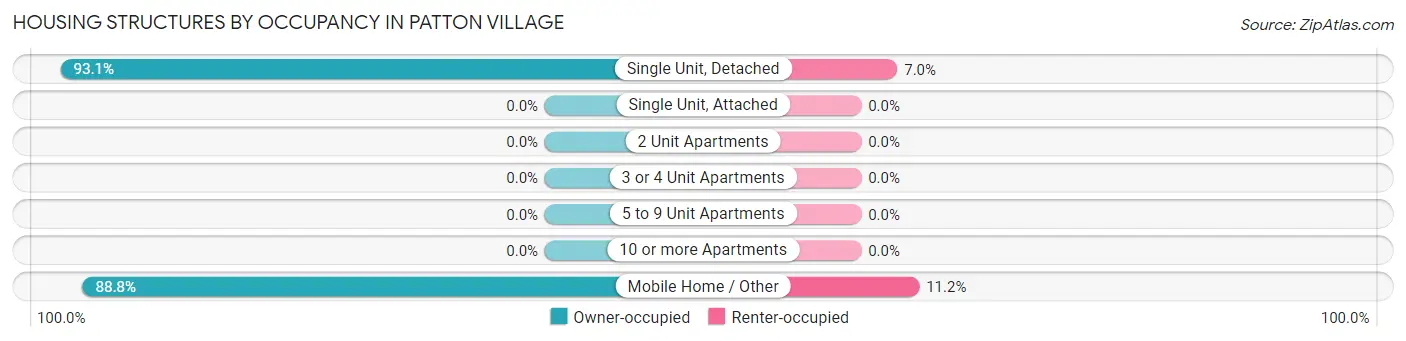
| Structure Type | Owner-occupied | Renter-occupied |
| Single Unit, Detached | 241 (93.0%) | 18 (7.0%) |
| Single Unit, Attached | 0 (0.0%) | 0 (0.0%) |
| 2 Unit Apartments | 0 (0.0%) | 0 (0.0%) |
| 3 or 4 Unit Apartments | 0 (0.0%) | 0 (0.0%) |
| 5 to 9 Unit Apartments | 0 (0.0%) | 0 (0.0%) |
| 10 or more Apartments | 0 (0.0%) | 0 (0.0%) |
| Mobile Home / Other | 151 (88.8%) | 19 (11.2%) |
| Total | 392 (91.4%) | 37 (8.6%) |
Housing Structures by Number of Rooms in Patton Village
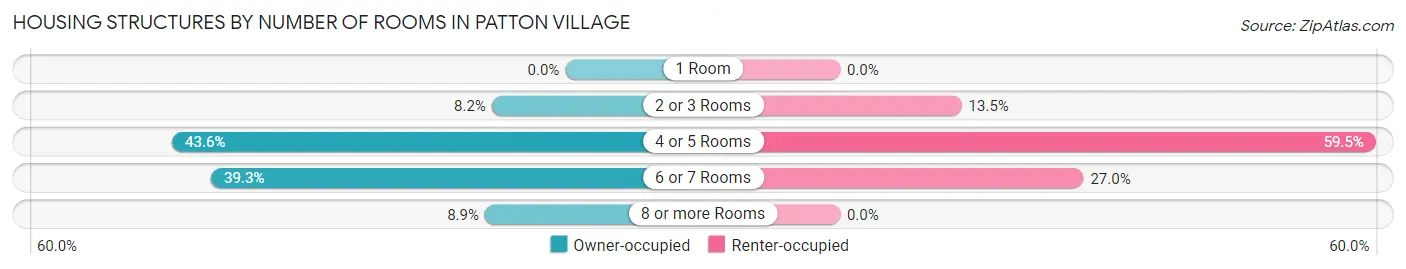
| Number of Rooms | Owner-occupied | Renter-occupied |
| 1 Room | 0 (0.0%) | 0 (0.0%) |
| 2 or 3 Rooms | 32 (8.2%) | 5 (13.5%) |
| 4 or 5 Rooms | 171 (43.6%) | 22 (59.5%) |
| 6 or 7 Rooms | 154 (39.3%) | 10 (27.0%) |
| 8 or more Rooms | 35 (8.9%) | 0 (0.0%) |
| Total | 392 (100.0%) | 37 (100.0%) |
Housing Structure by Heating Type in Patton Village
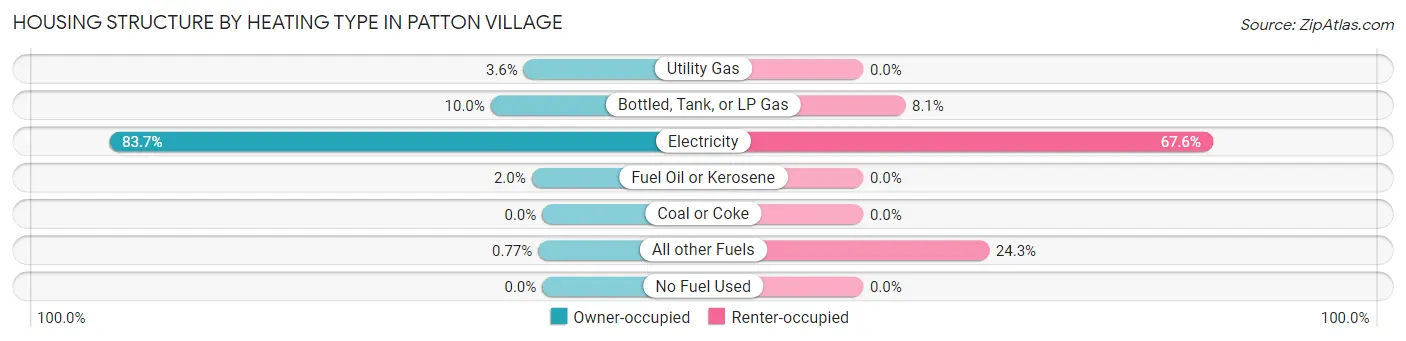
| Heating Type | Owner-occupied | Renter-occupied |
| Utility Gas | 14 (3.6%) | 0 (0.0%) |
| Bottled, Tank, or LP Gas | 39 (10.0%) | 3 (8.1%) |
| Electricity | 328 (83.7%) | 25 (67.6%) |
| Fuel Oil or Kerosene | 8 (2.0%) | 0 (0.0%) |
| Coal or Coke | 0 (0.0%) | 0 (0.0%) |
| All other Fuels | 3 (0.8%) | 9 (24.3%) |
| No Fuel Used | 0 (0.0%) | 0 (0.0%) |
| Total | 392 (100.0%) | 37 (100.0%) |
Household Vehicle Usage in Patton Village
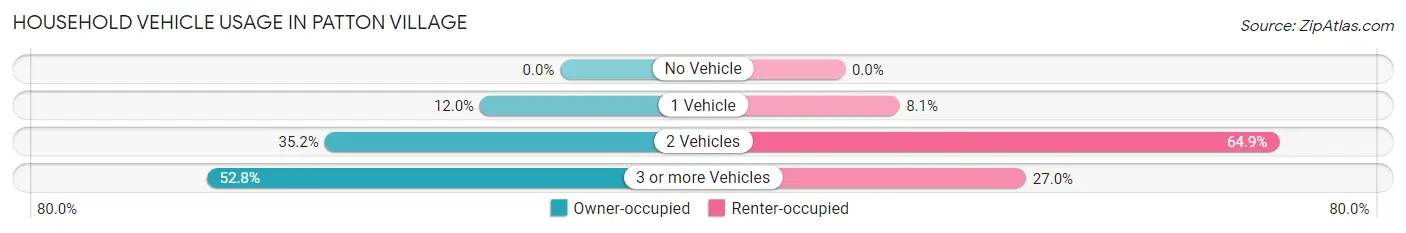
| Vehicles per Household | Owner-occupied | Renter-occupied |
| No Vehicle | 0 (0.0%) | 0 (0.0%) |
| 1 Vehicle | 47 (12.0%) | 3 (8.1%) |
| 2 Vehicles | 138 (35.2%) | 24 (64.9%) |
| 3 or more Vehicles | 207 (52.8%) | 10 (27.0%) |
| Total | 392 (100.0%) | 37 (100.0%) |
Real Estate & Mortgages in Patton Village
Real Estate and Mortgage Overview in Patton Village
| Characteristic | Without Mortgage | With Mortgage |
| Housing Units | 273 | 119 |
| Median Property Value | $96,800 | $174,500 |
| Median Household Income | $54,531 | $10 |
| Monthly Housing Costs | $499 | $5 |
| Real Estate Taxes | $1,211 | $0 |
Property Value by Mortgage Status in Patton Village
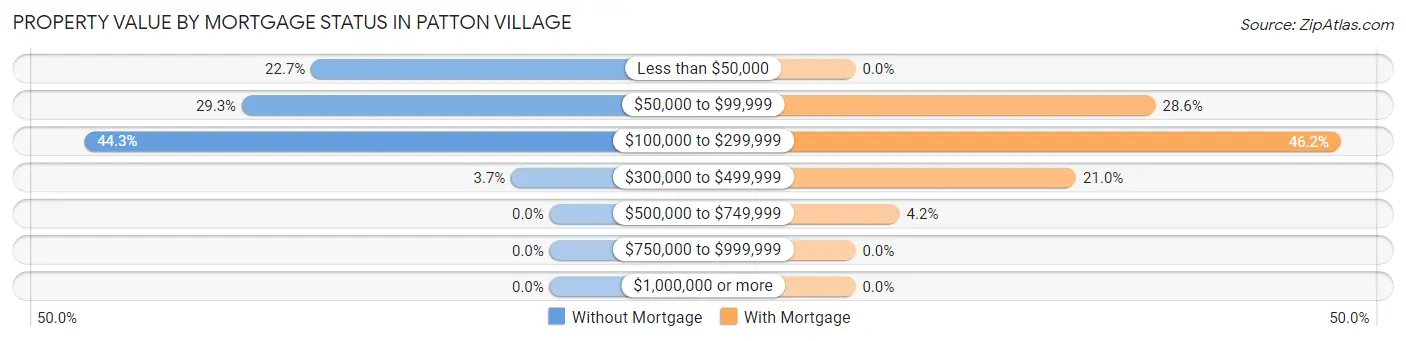
| Property Value | Without Mortgage | With Mortgage |
| Less than $50,000 | 62 (22.7%) | 0 (0.0%) |
| $50,000 to $99,999 | 80 (29.3%) | 34 (28.6%) |
| $100,000 to $299,999 | 121 (44.3%) | 55 (46.2%) |
| $300,000 to $499,999 | 10 (3.7%) | 25 (21.0%) |
| $500,000 to $749,999 | 0 (0.0%) | 5 (4.2%) |
| $750,000 to $999,999 | 0 (0.0%) | 0 (0.0%) |
| $1,000,000 or more | 0 (0.0%) | 0 (0.0%) |
| Total | 273 (100.0%) | 119 (100.0%) |
Household Income by Mortgage Status in Patton Village
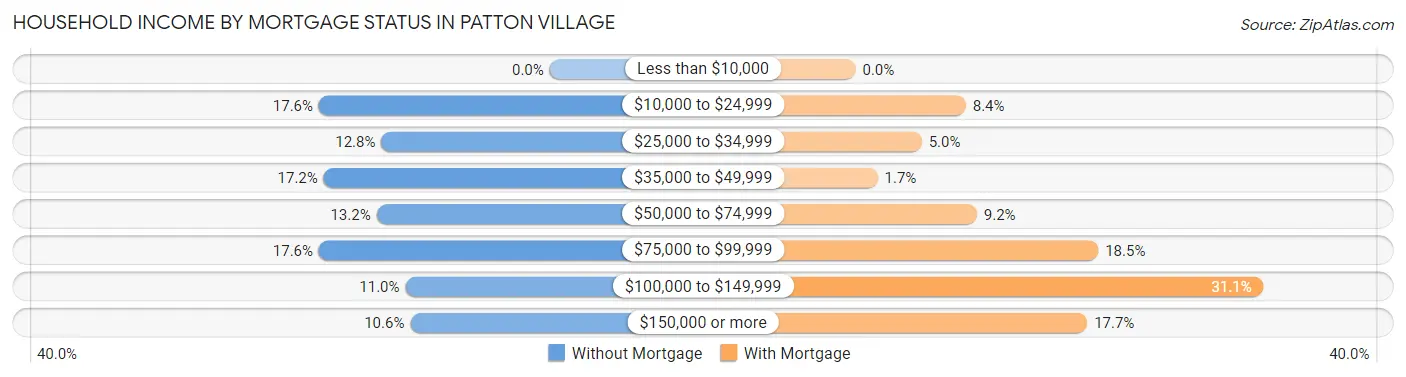
| Household Income | Without Mortgage | With Mortgage |
| Less than $10,000 | 0 (0.0%) | 0 (0.0%) |
| $10,000 to $24,999 | 48 (17.6%) | 10 (8.4%) |
| $25,000 to $34,999 | 35 (12.8%) | 6 (5.0%) |
| $35,000 to $49,999 | 47 (17.2%) | 2 (1.7%) |
| $50,000 to $74,999 | 36 (13.2%) | 11 (9.2%) |
| $75,000 to $99,999 | 48 (17.6%) | 22 (18.5%) |
| $100,000 to $149,999 | 30 (11.0%) | 37 (31.1%) |
| $150,000 or more | 29 (10.6%) | 21 (17.6%) |
| Total | 273 (100.0%) | 119 (100.0%) |
Property Value to Household Income Ratio in Patton Village
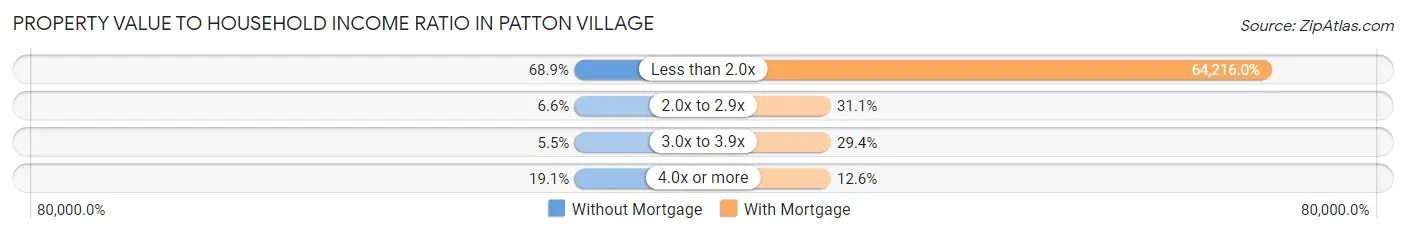
| Value-to-Income Ratio | Without Mortgage | With Mortgage |
| Less than 2.0x | 188 (68.9%) | 76,417 (64,216.0%) |
| 2.0x to 2.9x | 18 (6.6%) | 37 (31.1%) |
| 3.0x to 3.9x | 15 (5.5%) | 35 (29.4%) |
| 4.0x or more | 52 (19.1%) | 15 (12.6%) |
| Total | 273 (100.0%) | 119 (100.0%) |
Real Estate Taxes by Mortgage Status in Patton Village
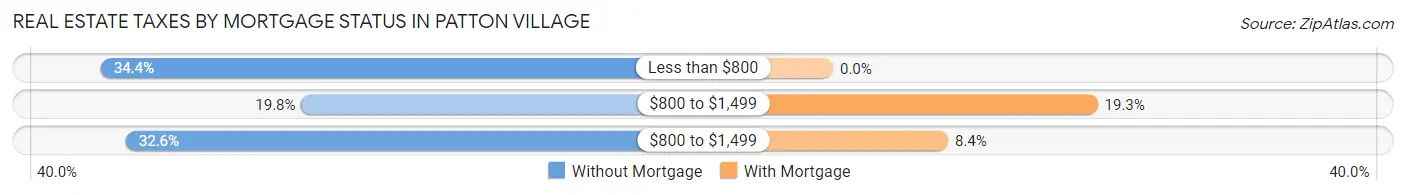
| Property Taxes | Without Mortgage | With Mortgage |
| Less than $800 | 94 (34.4%) | 0 (0.0%) |
| $800 to $1,499 | 54 (19.8%) | 23 (19.3%) |
| $800 to $1,499 | 89 (32.6%) | 10 (8.4%) |
| Total | 273 (100.0%) | 119 (100.0%) |
Health & Disability in Patton Village
Health Insurance Coverage by Age in Patton Village
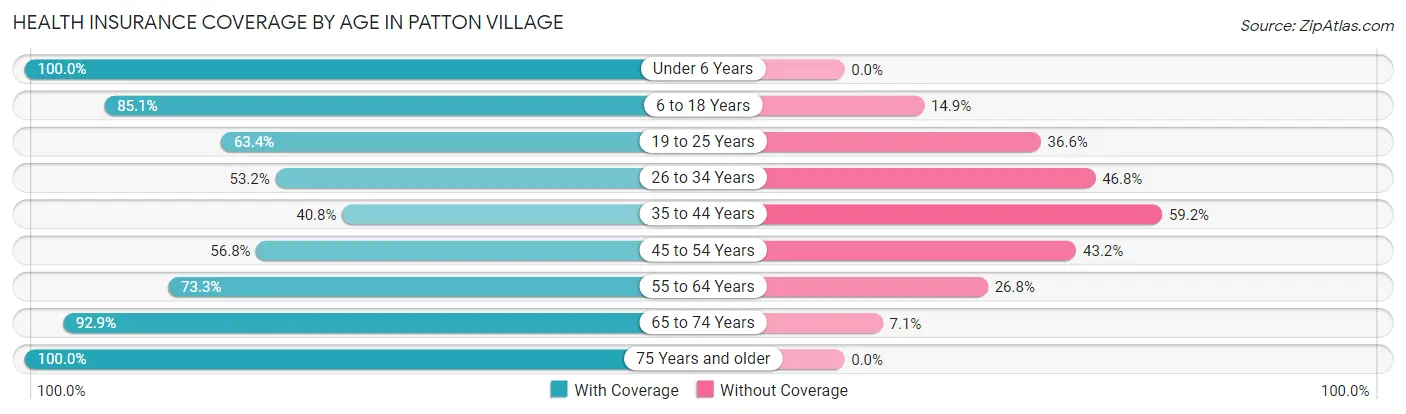
| Age Bracket | With Coverage | Without Coverage |
| Under 6 Years | 69 (100.0%) | 0 (0.0%) |
| 6 to 18 Years | 275 (85.1%) | 48 (14.9%) |
| 19 to 25 Years | 90 (63.4%) | 52 (36.6%) |
| 26 to 34 Years | 83 (53.2%) | 73 (46.8%) |
| 35 to 44 Years | 75 (40.8%) | 109 (59.2%) |
| 45 to 54 Years | 130 (56.8%) | 99 (43.2%) |
| 55 to 64 Years | 115 (73.3%) | 42 (26.8%) |
| 65 to 74 Years | 117 (92.9%) | 9 (7.1%) |
| 75 Years and older | 31 (100.0%) | 0 (0.0%) |
| Total | 985 (69.5%) | 432 (30.5%) |
Health Insurance Coverage by Citizenship Status in Patton Village
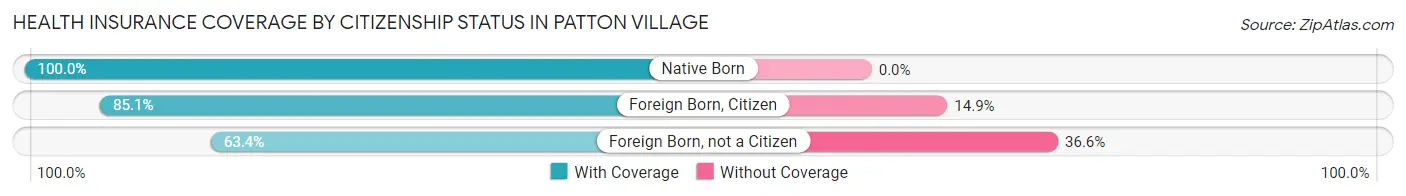
| Citizenship Status | With Coverage | Without Coverage |
| Native Born | 69 (100.0%) | 0 (0.0%) |
| Foreign Born, Citizen | 275 (85.1%) | 48 (14.9%) |
| Foreign Born, not a Citizen | 90 (63.4%) | 52 (36.6%) |
Health Insurance Coverage by Household Income in Patton Village
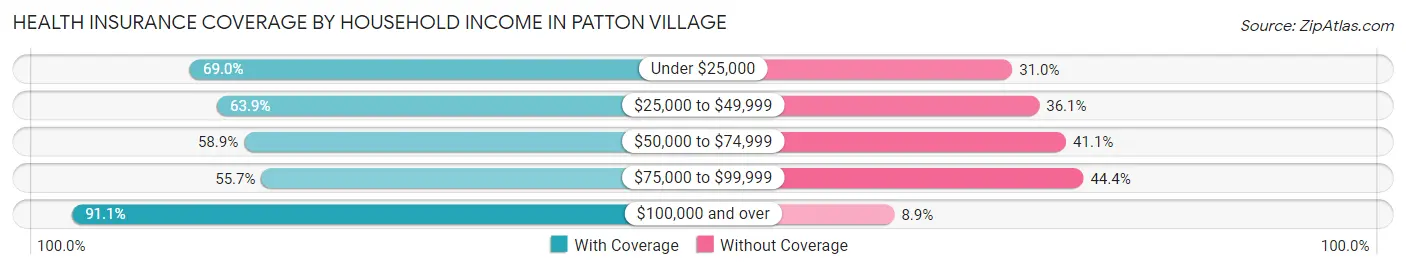
| Household Income | With Coverage | Without Coverage |
| Under $25,000 | 89 (69.0%) | 40 (31.0%) |
| $25,000 to $49,999 | 241 (63.9%) | 136 (36.1%) |
| $50,000 to $74,999 | 96 (58.9%) | 67 (41.1%) |
| $75,000 to $99,999 | 192 (55.6%) | 153 (44.4%) |
| $100,000 and over | 367 (91.1%) | 36 (8.9%) |
Public vs Private Health Insurance Coverage by Age in Patton Village
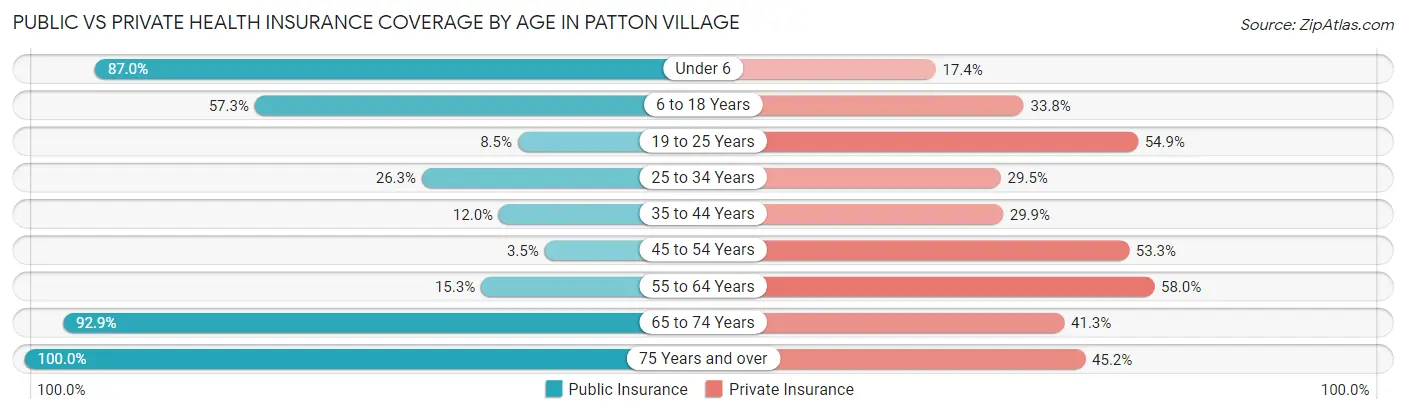
| Age Bracket | Public Insurance | Private Insurance |
| Under 6 | 60 (87.0%) | 12 (17.4%) |
| 6 to 18 Years | 185 (57.3%) | 109 (33.8%) |
| 19 to 25 Years | 12 (8.5%) | 78 (54.9%) |
| 25 to 34 Years | 41 (26.3%) | 46 (29.5%) |
| 35 to 44 Years | 22 (12.0%) | 55 (29.9%) |
| 45 to 54 Years | 8 (3.5%) | 122 (53.3%) |
| 55 to 64 Years | 24 (15.3%) | 91 (58.0%) |
| 65 to 74 Years | 117 (92.9%) | 52 (41.3%) |
| 75 Years and over | 31 (100.0%) | 14 (45.2%) |
| Total | 500 (35.3%) | 579 (40.9%) |
Disability Status by Sex by Age in Patton Village
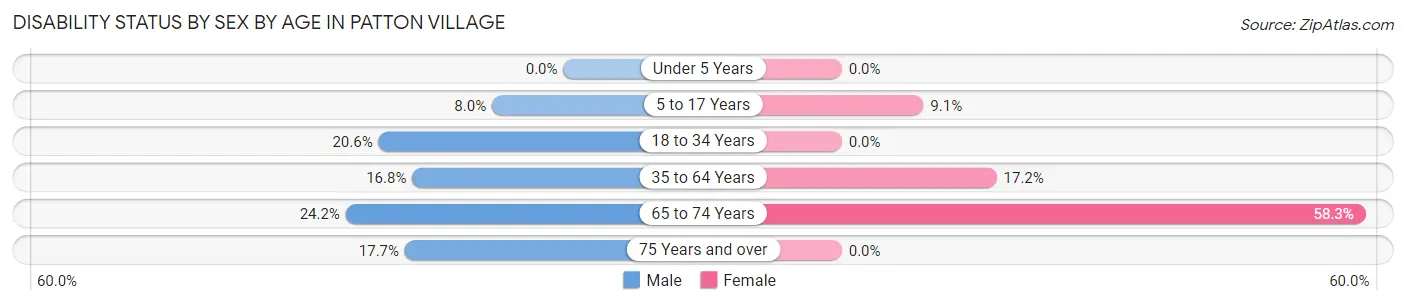
| Age Bracket | Male | Female |
| Under 5 Years | 0 (0.0%) | 0 (0.0%) |
| 5 to 17 Years | 12 (8.0%) | 16 (9.1%) |
| 18 to 34 Years | 35 (20.6%) | 0 (0.0%) |
| 35 to 64 Years | 52 (16.8%) | 45 (17.2%) |
| 65 to 74 Years | 16 (24.2%) | 35 (58.3%) |
| 75 Years and over | 3 (17.6%) | 0 (0.0%) |
Disability Class by Sex by Age in Patton Village
Disability Class: Hearing Difficulty
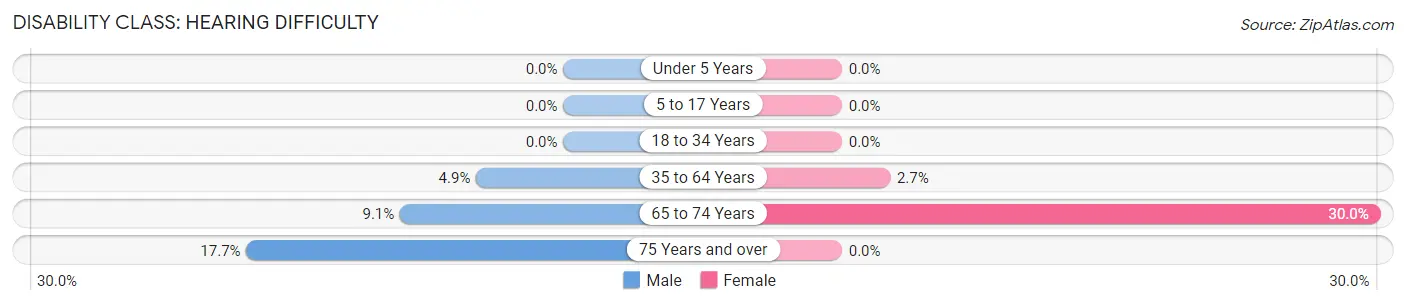
| Age Bracket | Male | Female |
| Under 5 Years | 0 (0.0%) | 0 (0.0%) |
| 5 to 17 Years | 0 (0.0%) | 0 (0.0%) |
| 18 to 34 Years | 0 (0.0%) | 0 (0.0%) |
| 35 to 64 Years | 15 (4.9%) | 7 (2.7%) |
| 65 to 74 Years | 6 (9.1%) | 18 (30.0%) |
| 75 Years and over | 3 (17.6%) | 0 (0.0%) |
Disability Class: Vision Difficulty
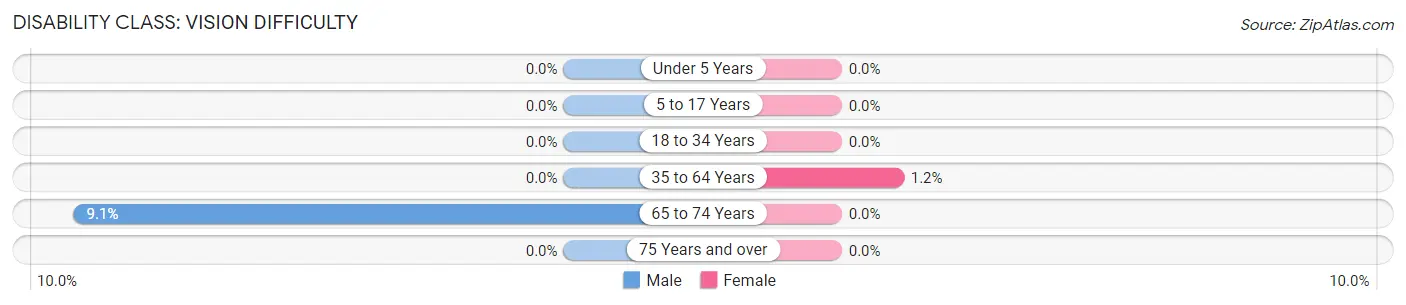
| Age Bracket | Male | Female |
| Under 5 Years | 0 (0.0%) | 0 (0.0%) |
| 5 to 17 Years | 0 (0.0%) | 0 (0.0%) |
| 18 to 34 Years | 0 (0.0%) | 0 (0.0%) |
| 35 to 64 Years | 0 (0.0%) | 3 (1.1%) |
| 65 to 74 Years | 6 (9.1%) | 0 (0.0%) |
| 75 Years and over | 0 (0.0%) | 0 (0.0%) |
Disability Class: Cognitive Difficulty
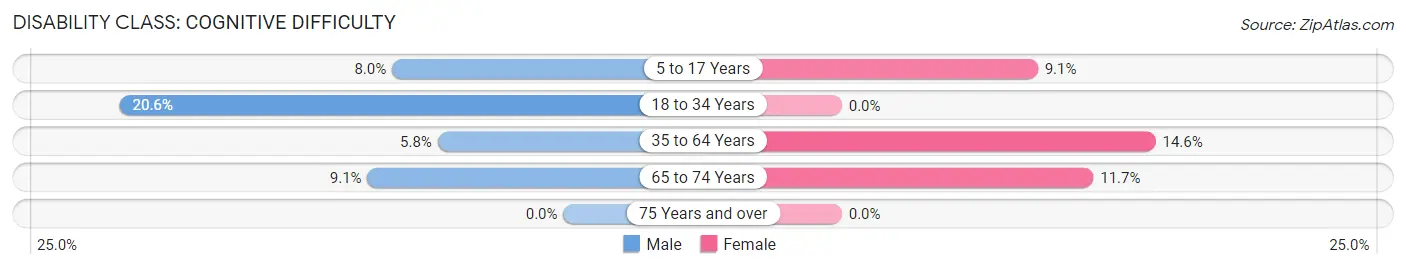
| Age Bracket | Male | Female |
| 5 to 17 Years | 12 (8.0%) | 16 (9.1%) |
| 18 to 34 Years | 35 (20.6%) | 0 (0.0%) |
| 35 to 64 Years | 18 (5.8%) | 38 (14.6%) |
| 65 to 74 Years | 6 (9.1%) | 7 (11.7%) |
| 75 Years and over | 0 (0.0%) | 0 (0.0%) |
Disability Class: Ambulatory Difficulty
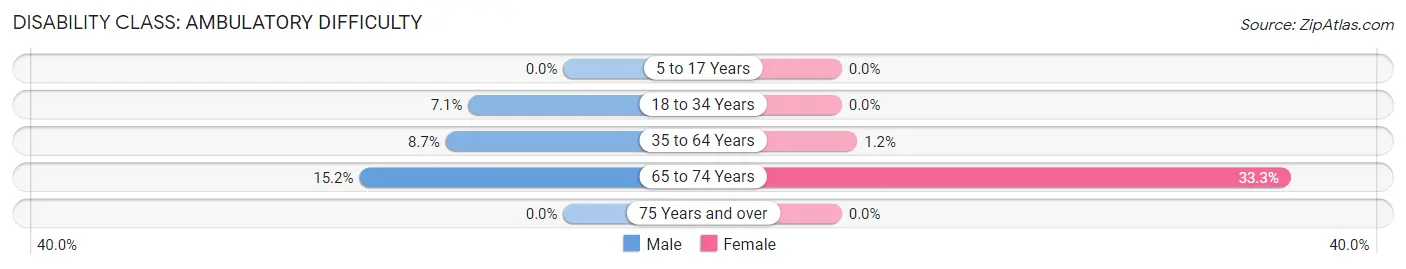
| Age Bracket | Male | Female |
| 5 to 17 Years | 0 (0.0%) | 0 (0.0%) |
| 18 to 34 Years | 12 (7.1%) | 0 (0.0%) |
| 35 to 64 Years | 27 (8.7%) | 3 (1.1%) |
| 65 to 74 Years | 10 (15.1%) | 20 (33.3%) |
| 75 Years and over | 0 (0.0%) | 0 (0.0%) |
Disability Class: Self-Care Difficulty
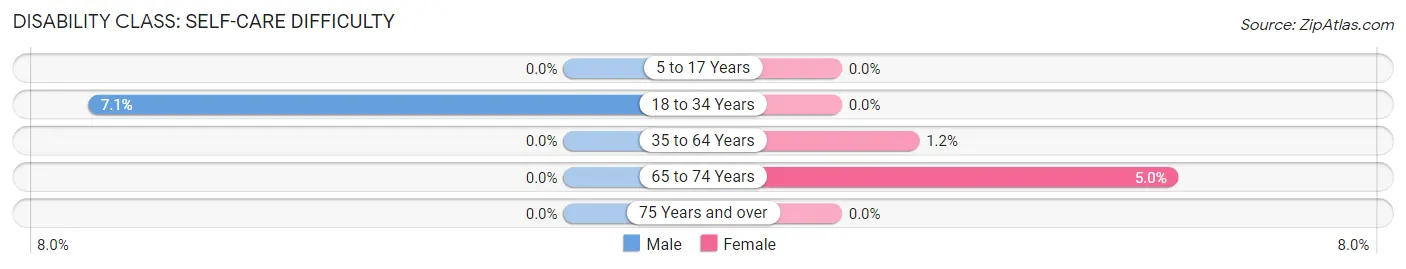
| Age Bracket | Male | Female |
| 5 to 17 Years | 0 (0.0%) | 0 (0.0%) |
| 18 to 34 Years | 12 (7.1%) | 0 (0.0%) |
| 35 to 64 Years | 0 (0.0%) | 3 (1.1%) |
| 65 to 74 Years | 0 (0.0%) | 3 (5.0%) |
| 75 Years and over | 0 (0.0%) | 0 (0.0%) |
Technology Access in Patton Village
Computing Device Access in Patton Village
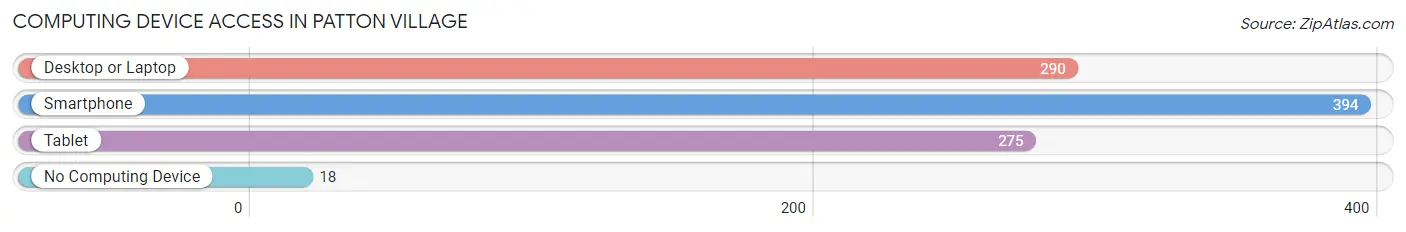
| Device Type | # Households | % Households |
| Desktop or Laptop | 290 | 67.6% |
| Smartphone | 394 | 91.8% |
| Tablet | 275 | 64.1% |
| No Computing Device | 18 | 4.2% |
| Total | 429 | 100.0% |
Internet Access in Patton Village
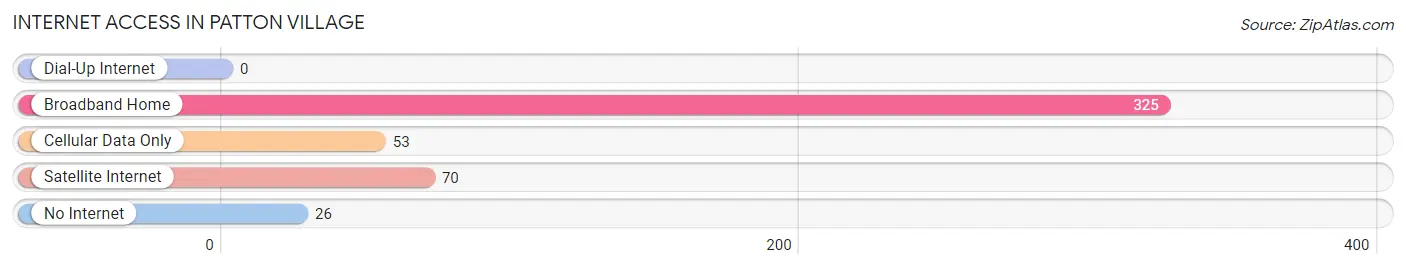
| Internet Type | # Households | % Households |
| Dial-Up Internet | 0 | 0.0% |
| Broadband Home | 325 | 75.8% |
| Cellular Data Only | 53 | 12.3% |
| Satellite Internet | 70 | 16.3% |
| No Internet | 26 | 6.1% |
| Total | 429 | 100.0% |
Patton Village Summary
Patton Village is a small city located in Montgomery County, Texas, United States. It is situated approximately 40 miles north of Houston and is part of the Houston–The Woodlands–Sugar Land metropolitan area. The city was named after the Patton family, who were early settlers in the area. As of the 2010 census, the population of Patton Village was 1,093.
History
The area that is now Patton Village was first settled in the early 1800s by the Patton family. The family was originally from North Carolina and had moved to Texas in search of a better life. The family settled in the area and began farming and ranching. In 1872, the family donated land for the construction of a school, which was named Patton School.
In the early 1900s, the area began to grow as more people moved to the area. In the 1920s, the area was officially incorporated as the City of Patton Village. The city was named after the Patton family, who had been the first settlers in the area.
In the 1950s, the city began to experience rapid growth as the Houston metropolitan area began to expand. The city was annexed by the City of Houston in the 1960s, but was later re-incorporated as an independent city in the 1970s.
Geography
Patton Village is located in Montgomery County, Texas, approximately 40 miles north of Houston. The city is situated on the western edge of the Houston–The Woodlands–Sugar Land metropolitan area. The city covers an area of 2.2 square miles and has a population of 1,093 as of the 2010 census.
The city is located in a predominantly rural area and is surrounded by wooded areas and farmland. The city is located near the Sam Houston National Forest and is home to several parks and recreational areas.
Economy
The economy of Patton Village is largely based on the oil and gas industry. The city is home to several oil and gas companies, including Chevron, ExxonMobil, and Shell. The city is also home to several manufacturing companies, including a paper mill and a plastics factory.
The city is also home to several retail stores, restaurants, and other businesses. The city is served by several major highways, including Interstate 45 and US Highway 59.
Demographics
As of the 2010 census, the population of Patton Village was 1,093. The racial makeup of the city was 79.3% White, 11.2% African American, 0.7% Native American, 0.3% Asian, and 8.5% from other races. Hispanic or Latino of any race were 16.2% of the population.
The median household income in Patton Village was $45,938, and the median family income was $50,625. The per capita income for the city was $20,945. About 11.2% of families and 13.2% of the population were below the poverty line, including 17.2% of those under age 18 and 8.3% of those age 65 or over.
Common Questions
What is the Total Population of Patton Village?
Total Population of Patton Village is 1,417.
What is the Total Male Population of Patton Village?
Total Male Population of Patton Village is 745.
What is the Total Female Population of Patton Village?
Total Female Population of Patton Village is 672.
What is the Ratio of Males per 100 Females in Patton Village?
There are 110.86 Males per 100 Females in Patton Village.
What is the Ratio of Females per 100 Males in Patton Village?
There are 90.20 Females per 100 Males in Patton Village.
What is the Median Population Age in Patton Village?
Median Population Age in Patton Village is 36.3 Years.
What is the Average Family Size in Patton Village
Average Family Size in Patton Village is 3.6 People.
What is the Average Household Size in Patton Village
Average Household Size in Patton Village is 3.3 People.
What is Per Capita Income in Patton Village?
Per Capita income in Patton Village is $24,723.
What is the Median Family Income in Patton Village?
Median Family Income in Patton Village is $64,205.
What is the Median Household income in Patton Village?
Median Household Income in Patton Village is $71,691.
What is Income or Wage Gap in Patton Village?
Income or Wage Gap in Patton Village is 41.2%.
Women in Patton Village earn 58.8 cents for every dollar earned by a man.
What is Inequality or Gini Index in Patton Village?
Inequality or Gini Index in Patton Village is 0.38.
How Large is the Labor Force in Patton Village?
There are 649 People in the Labor Forcein in Patton Village.
What is the Percentage of People in the Labor Force in Patton Village?
59.2% of People are in the Labor Force in Patton Village.
What is the Unemployment Rate in Patton Village?
Unemployment Rate in Patton Village is 6.8%.