Rogers City, MI
Rogers City Map
Rogers City Overview
2,866
TOTAL POPULATION
1,294
MALE POPULATION
1,572
FEMALE POPULATION
82.32
MALES / 100 FEMALES
121.48
FEMALES / 100 MALES
52.9
MEDIAN AGE
2.5
AVG FAMILY SIZE
2.0
AVG HOUSEHOLD SIZE
$31,202
PER CAPITA INCOME
$68,607
AVG FAMILY INCOME
$53,673
AVG HOUSEHOLD INCOME
23.0%
WAGE / INCOME GAP [ % ]
77.0¢/ $1
WAGE / INCOME GAP [ $ ]
0.39
INEQUALITY / GINI INDEX
1,156
LABOR FORCE [ PEOPLE ]
47.5%
PERCENT IN LABOR FORCE
3.2%
UNEMPLOYMENT RATE
Rogers City Zip Codes
Rogers City Area Codes
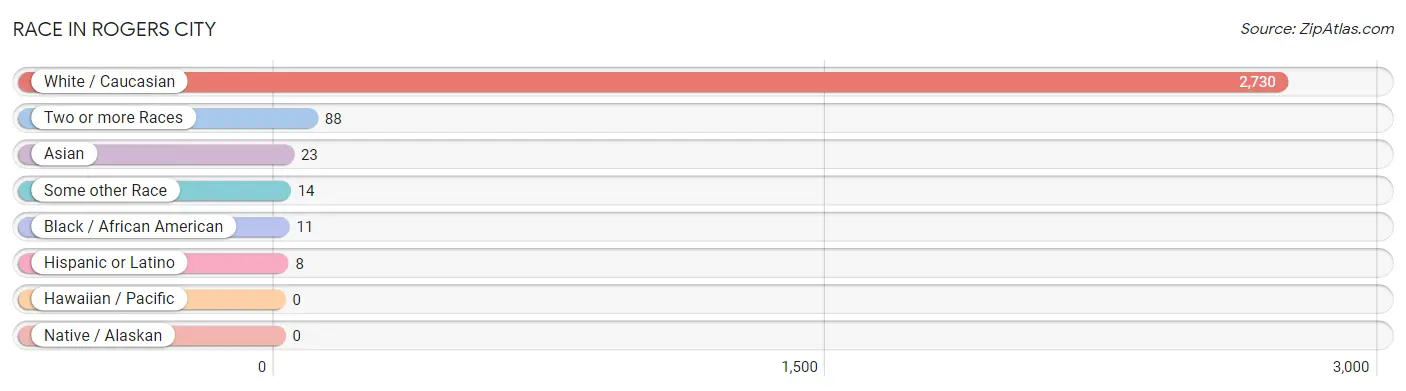
Race in Rogers City
The most populous races in Rogers City are White / Caucasian (2,730 | 95.3%), Two or more Races (88 | 3.1%), and Asian (23 | 0.8%).
| Race | # Population | % Population |
| Asian | 23 | 0.8% |
| Black / African American | 11 | 0.4% |
| Hawaiian / Pacific | 0 | 0.0% |
| Hispanic or Latino | 8 | 0.3% |
| Native / Alaskan | 0 | 0.0% |
| White / Caucasian | 2,730 | 95.3% |
| Two or more Races | 88 | 3.1% |
| Some other Race | 14 | 0.5% |
| Total | 2,866 | 100.0% |
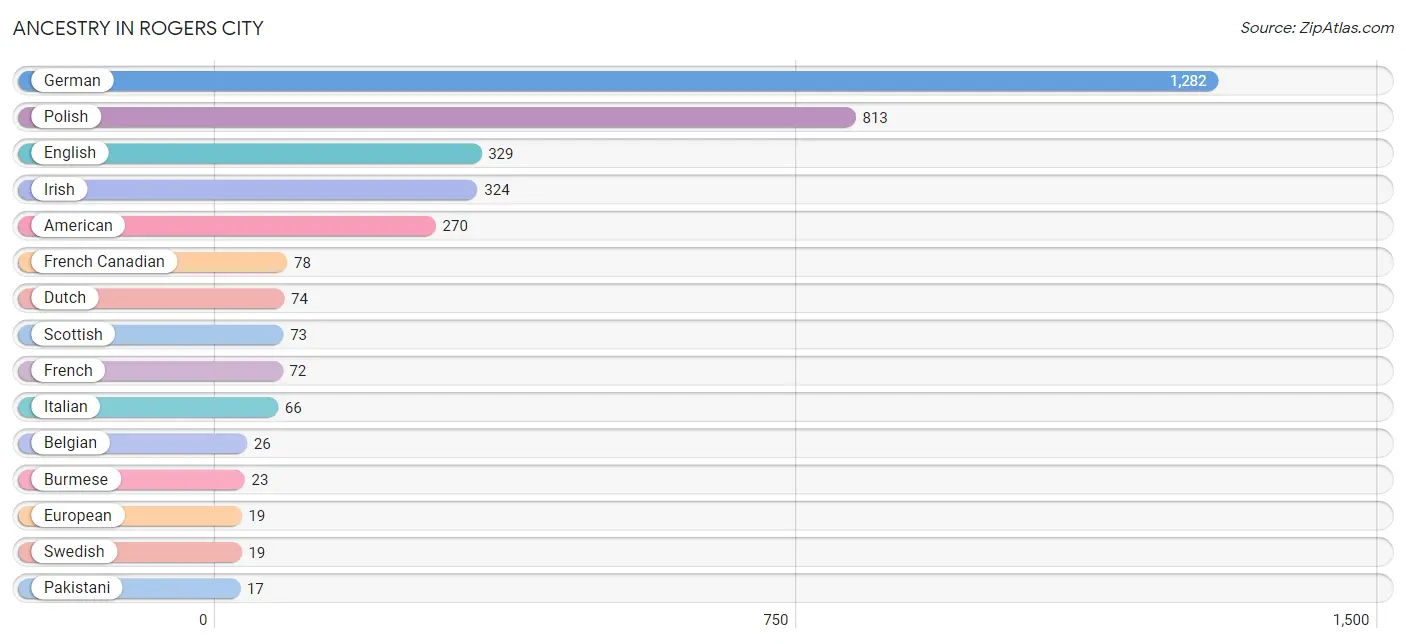
Ancestry in Rogers City
The most populous ancestries reported in Rogers City are German (1,282 | 44.7%), Polish (813 | 28.4%), English (329 | 11.5%), Irish (324 | 11.3%), and American (270 | 9.4%), together accounting for 105.3% of all Rogers City residents.
| Ancestry | # Population | % Population |
| African | 3 | 0.1% |
| American | 270 | 9.4% |
| Belgian | 26 | 0.9% |
| Blackfeet | 5 | 0.2% |
| British | 10 | 0.4% |
| Burmese | 23 | 0.8% |
| Chippewa | 14 | 0.5% |
| Czech | 5 | 0.2% |
| Dutch | 74 | 2.6% |
| English | 329 | 11.5% |
| European | 19 | 0.7% |
| French | 72 | 2.5% |
| French Canadian | 78 | 2.7% |
| German | 1,282 | 44.7% |
| Greek | 9 | 0.3% |
| Hungarian | 14 | 0.5% |
| Irish | 324 | 11.3% |
| Italian | 66 | 2.3% |
| Mexican | 8 | 0.3% |
| Norwegian | 7 | 0.2% |
| Pakistani | 17 | 0.6% |
| Polish | 813 | 28.4% |
| Scotch-Irish | 12 | 0.4% |
| Scottish | 73 | 2.5% |
| Serbian | 9 | 0.3% |
| Slavic | 15 | 0.5% |
| Subsaharan African | 3 | 0.1% |
| Swedish | 19 | 0.7% |
| Swiss | 8 | 0.3% |
| Ukrainian | 10 | 0.4% | View All 30 Rows |
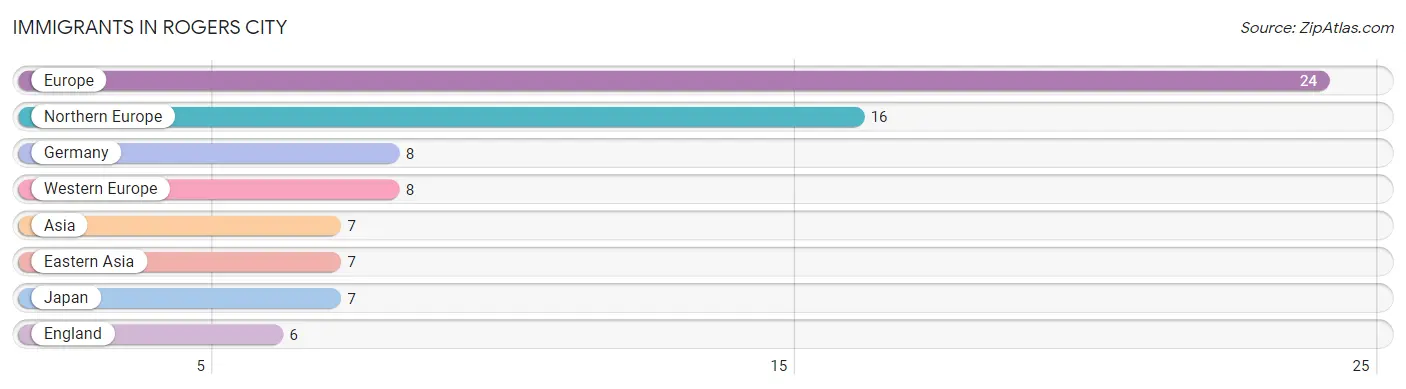
Immigrants in Rogers City
The most numerous immigrant groups reported in Rogers City came from Europe (24 | 0.8%), Northern Europe (16 | 0.6%), Germany (8 | 0.3%), Western Europe (8 | 0.3%), and Asia (7 | 0.2%), together accounting for 2.2% of all Rogers City residents.
| Immigration Origin | # Population | % Population |
| Asia | 7 | 0.2% |
| Eastern Asia | 7 | 0.2% |
| England | 6 | 0.2% |
| Europe | 24 | 0.8% |
| Germany | 8 | 0.3% |
| Japan | 7 | 0.2% |
| Northern Europe | 16 | 0.6% |
| Western Europe | 8 | 0.3% | View All 8 Rows |
Sex and Age in Rogers City
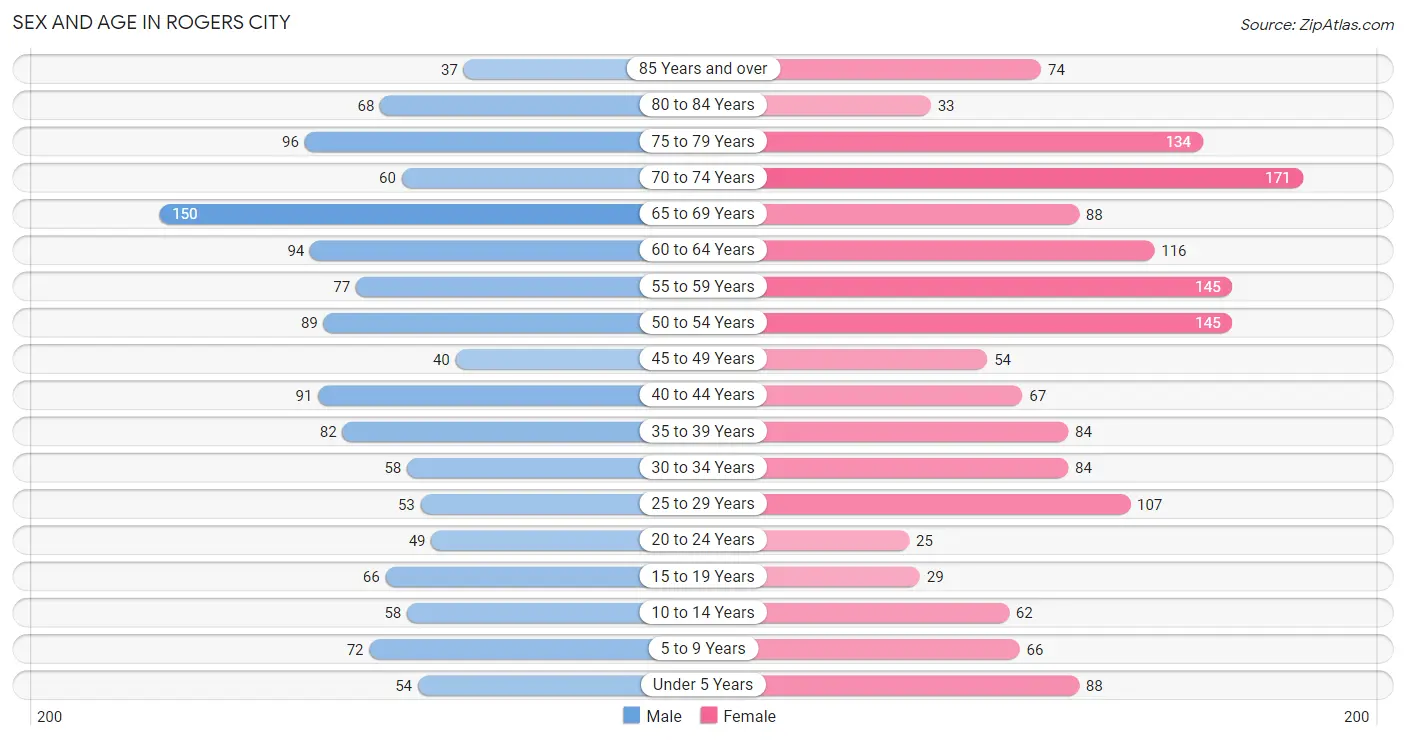
Sex and Age in Rogers City
The most populous age groups in Rogers City are 65 to 69 Years (150 | 11.6%) for men and 70 to 74 Years (171 | 10.9%) for women.
| Age Bracket | Male | Female |
| Under 5 Years | 54 (4.2%) | 88 (5.6%) |
| 5 to 9 Years | 72 (5.6%) | 66 (4.2%) |
| 10 to 14 Years | 58 (4.5%) | 62 (3.9%) |
| 15 to 19 Years | 66 (5.1%) | 29 (1.8%) |
| 20 to 24 Years | 49 (3.8%) | 25 (1.6%) |
| 25 to 29 Years | 53 (4.1%) | 107 (6.8%) |
| 30 to 34 Years | 58 (4.5%) | 84 (5.3%) |
| 35 to 39 Years | 82 (6.3%) | 84 (5.3%) |
| 40 to 44 Years | 91 (7.0%) | 67 (4.3%) |
| 45 to 49 Years | 40 (3.1%) | 54 (3.4%) |
| 50 to 54 Years | 89 (6.9%) | 145 (9.2%) |
| 55 to 59 Years | 77 (5.9%) | 145 (9.2%) |
| 60 to 64 Years | 94 (7.3%) | 116 (7.4%) |
| 65 to 69 Years | 150 (11.6%) | 88 (5.6%) |
| 70 to 74 Years | 60 (4.6%) | 171 (10.9%) |
| 75 to 79 Years | 96 (7.4%) | 134 (8.5%) |
| 80 to 84 Years | 68 (5.3%) | 33 (2.1%) |
| 85 Years and over | 37 (2.9%) | 74 (4.7%) |
| Total | 1,294 (100.0%) | 1,572 (100.0%) |
Families and Households in Rogers City
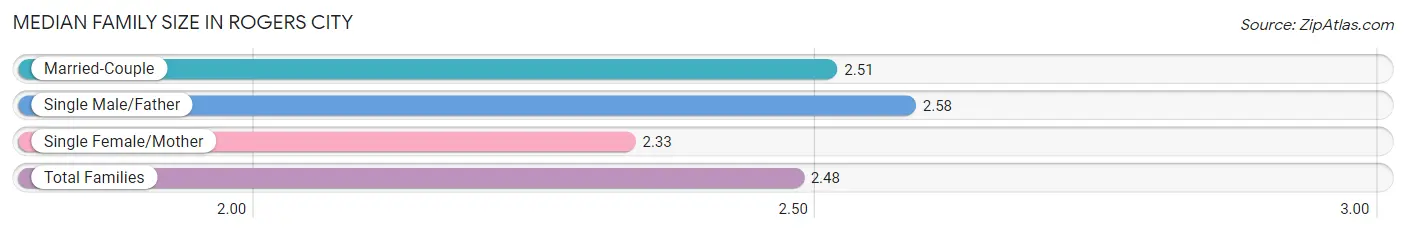
Median Family Size in Rogers City
The median family size in Rogers City is 2.48 persons per family, with single male/father families (66 | 7.5%) accounting for the largest median family size of 2.58 persons per family. On the other hand, single female/mother families (166 | 18.8%) represent the smallest median family size with 2.33 persons per family.
| Family Type | # Families | Family Size |
| Married-Couple | 651 (73.7%) | 2.51 |
| Single Male/Father | 66 (7.5%) | 2.58 |
| Single Female/Mother | 166 (18.8%) | 2.33 |
| Total Families | 883 (100.0%) | 2.48 |
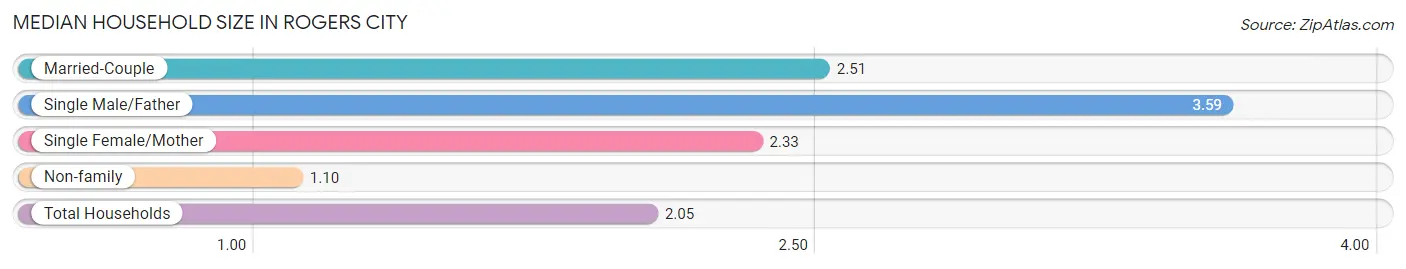
Median Household Size in Rogers City
The median household size in Rogers City is 2.05 persons per household, with single male/father households (66 | 4.9%) accounting for the largest median household size of 3.59 persons per household. non-family households (465 | 34.5%) represent the smallest median household size with 1.10 persons per household.
| Household Type | # Households | Household Size |
| Married-Couple | 651 (48.3%) | 2.51 |
| Single Male/Father | 66 (4.9%) | 3.59 |
| Single Female/Mother | 166 (12.3%) | 2.33 |
| Non-family | 465 (34.5%) | 1.10 |
| Total Households | 1,348 (100.0%) | 2.05 |
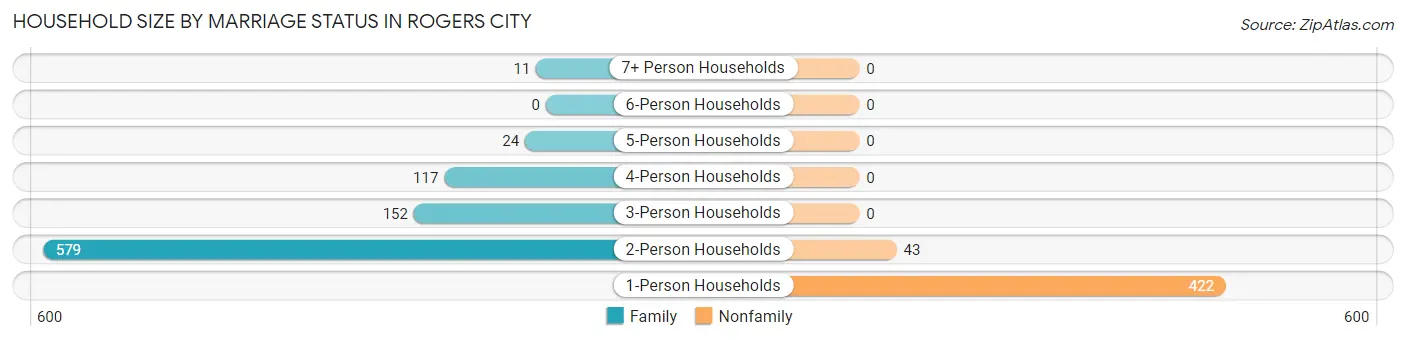
Household Size by Marriage Status in Rogers City
Out of a total of 1,348 households in Rogers City, 883 (65.5%) are family households, while 465 (34.5%) are nonfamily households. The most numerous type of family households are 2-person households, comprising 579, and the most common type of nonfamily households are 1-person households, comprising 422.
| Household Size | Family Households | Nonfamily Households |
| 1-Person Households | - | 422 (31.3%) |
| 2-Person Households | 579 (42.9%) | 43 (3.2%) |
| 3-Person Households | 152 (11.3%) | 0 (0.0%) |
| 4-Person Households | 117 (8.7%) | 0 (0.0%) |
| 5-Person Households | 24 (1.8%) | 0 (0.0%) |
| 6-Person Households | 0 (0.0%) | 0 (0.0%) |
| 7+ Person Households | 11 (0.8%) | 0 (0.0%) |
| Total | 883 (65.5%) | 465 (34.5%) |
Female Fertility in Rogers City
Fertility by Age in Rogers City
Average fertility rate in Rogers City is 10.0 births per 1,000 women. Women in the age bracket of 20 to 34 years have the highest fertility rate with 23.0 births per 1,000 women. Women in the age bracket of 20 to 34 years acount for 100.0% of all women with births.
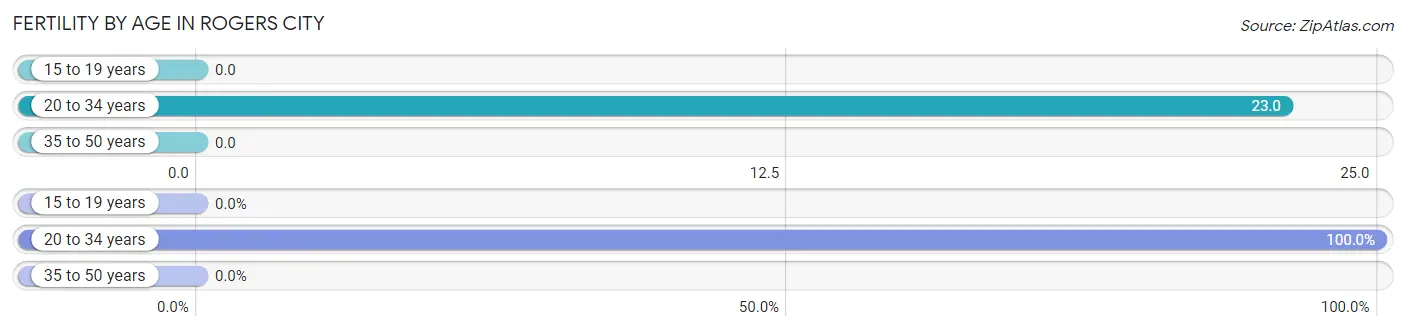
| Age Bracket | Women with Births | Births / 1,000 Women |
| 15 to 19 years | 0 (0.0%) | 0.0 |
| 20 to 34 years | 5 (100.0%) | 23.0 |
| 35 to 50 years | 0 (0.0%) | 0.0 |
| Total | 5 (100.0%) | 10.0 |
Fertility by Age by Marriage Status in Rogers City
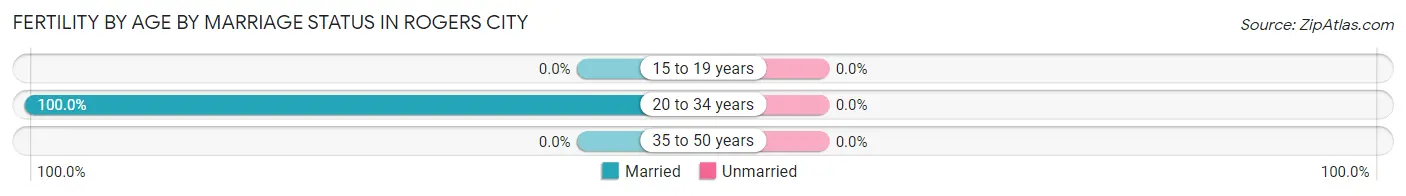
| Age Bracket | Married | Unmarried |
| 15 to 19 years | 0 (0.0%) | 0 (0.0%) |
| 20 to 34 years | 5 (100.0%) | 0 (0.0%) |
| 35 to 50 years | 0 (0.0%) | 0 (0.0%) |
| Total | 5 (100.0%) | 0 (0.0%) |
Fertility by Education in Rogers City
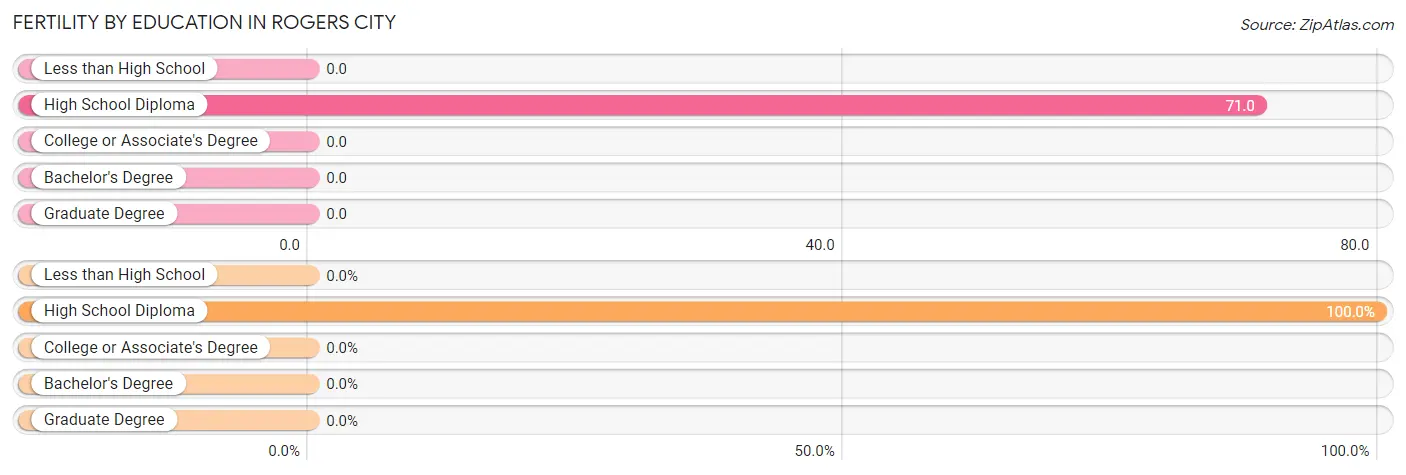
| Educational Attainment | Women with Births | Births / 1,000 Women |
| Less than High School | 0 (0.0%) | 0.0 |
| High School Diploma | 5 (100.0%) | 71.0 |
| College or Associate's Degree | 0 (0.0%) | 0.0 |
| Bachelor's Degree | 0 (0.0%) | 0.0 |
| Graduate Degree | 0 (0.0%) | 0.0 |
| Total | 5 (100.0%) | 10.0 |
Fertility by Education by Marriage Status in Rogers City
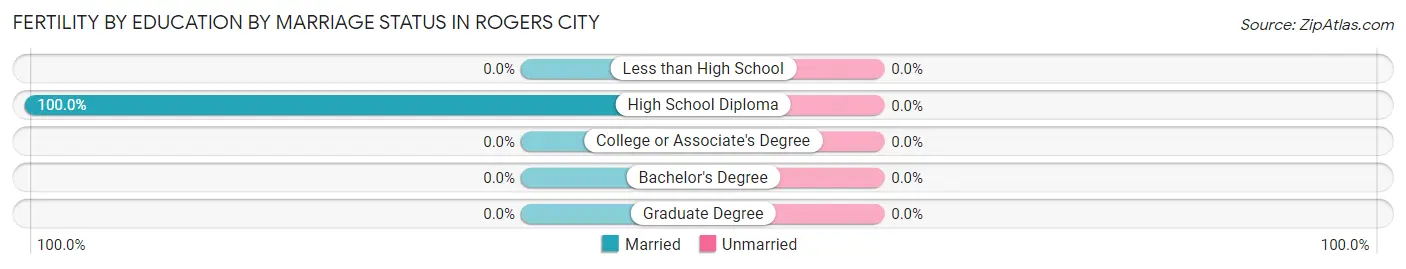
| Educational Attainment | Married | Unmarried |
| Less than High School | 0 (0.0%) | 0 (0.0%) |
| High School Diploma | 5 (100.0%) | 0 (0.0%) |
| College or Associate's Degree | 0 (0.0%) | 0 (0.0%) |
| Bachelor's Degree | 0 (0.0%) | 0 (0.0%) |
| Graduate Degree | 0 (0.0%) | 0 (0.0%) |
| Total | 5 (100.0%) | 0 (0.0%) |
Income in Rogers City
Income Overview in Rogers City
Per Capita Income in Rogers City is $31,202, while median incomes of families and households are $68,607 and $53,673 respectively.
| Characteristic | Number | Measure |
| Per Capita Income | 2,866 | $31,202 |
| Median Family Income | 883 | $68,607 |
| Mean Family Income | 883 | $75,797 |
| Median Household Income | 1,348 | $53,673 |
| Mean Household Income | 1,348 | $65,084 |
| Income Deficit | 883 | $0 |
| Wage / Income Gap (%) | 2,866 | 22.96% |
| Wage / Income Gap ($) | 2,866 | 77.04¢ per $1 |
| Gini / Inequality Index | 2,866 | 0.39 |
Earnings by Sex in Rogers City
Average Earnings in Rogers City are $30,705, $38,098 for men and $29,350 for women, a difference of 23.0%.
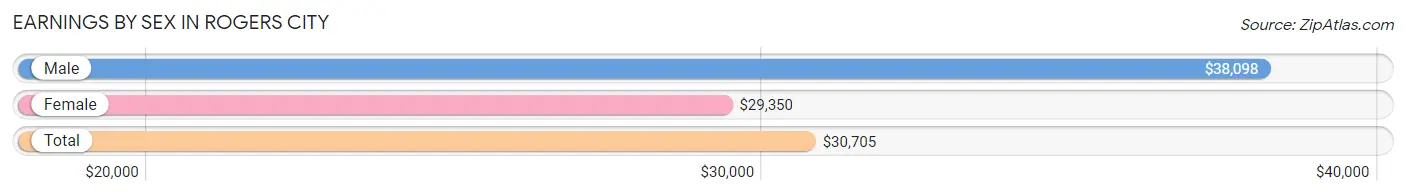
| Sex | Number | Average Earnings |
| Male | 631 (51.8%) | $38,098 |
| Female | 588 (48.2%) | $29,350 |
| Total | 1,219 (100.0%) | $30,705 |
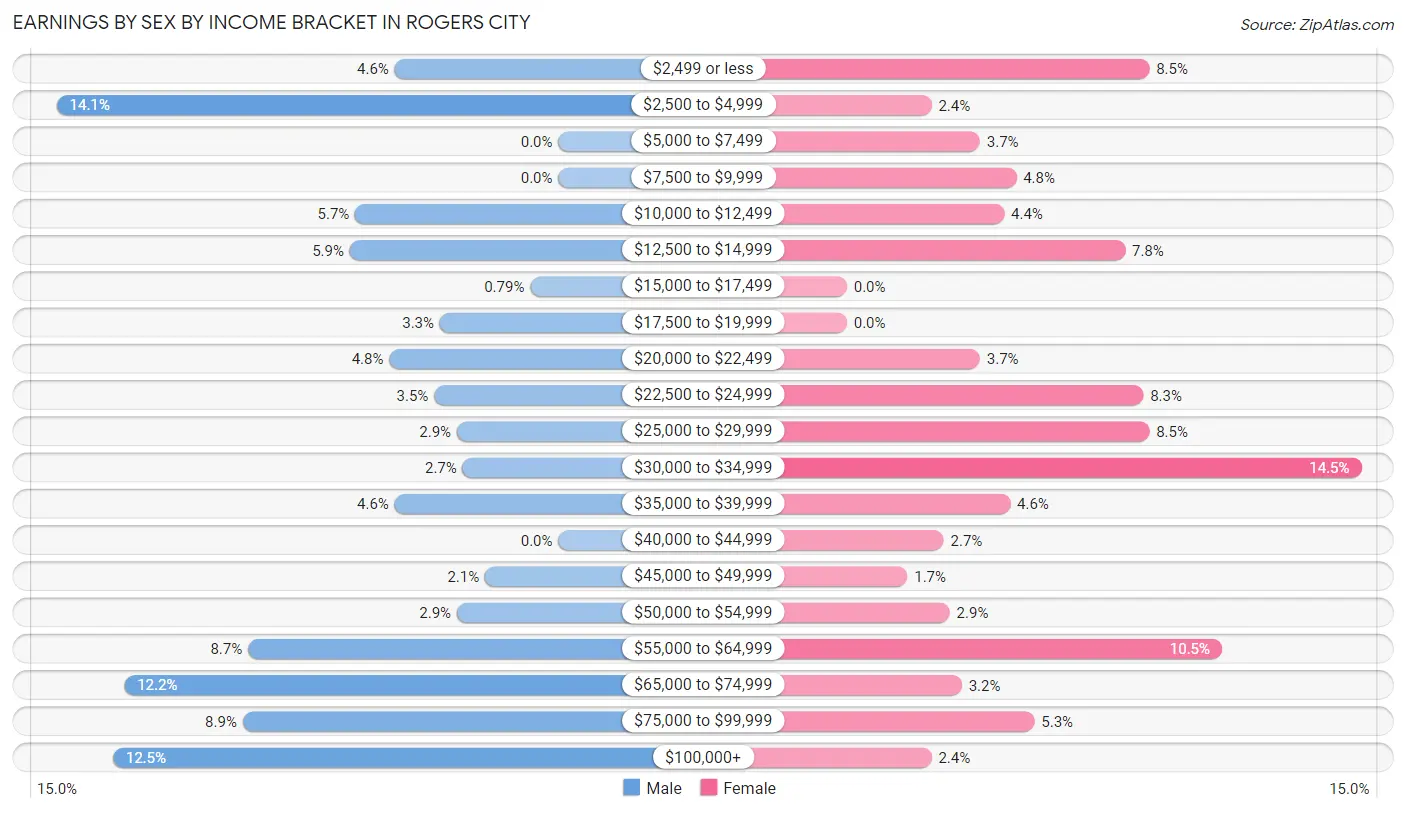
Earnings by Sex by Income Bracket in Rogers City
The most common earnings brackets in Rogers City are $2,500 to $4,999 for men (89 | 14.1%) and $30,000 to $34,999 for women (85 | 14.5%).
| Income | Male | Female |
| $2,499 or less | 29 (4.6%) | 50 (8.5%) |
| $2,500 to $4,999 | 89 (14.1%) | 14 (2.4%) |
| $5,000 to $7,499 | 0 (0.0%) | 22 (3.7%) |
| $7,500 to $9,999 | 0 (0.0%) | 28 (4.8%) |
| $10,000 to $12,499 | 36 (5.7%) | 26 (4.4%) |
| $12,500 to $14,999 | 37 (5.9%) | 46 (7.8%) |
| $15,000 to $17,499 | 5 (0.8%) | 0 (0.0%) |
| $17,500 to $19,999 | 21 (3.3%) | 0 (0.0%) |
| $20,000 to $22,499 | 30 (4.8%) | 22 (3.7%) |
| $22,500 to $24,999 | 22 (3.5%) | 49 (8.3%) |
| $25,000 to $29,999 | 18 (2.9%) | 50 (8.5%) |
| $30,000 to $34,999 | 17 (2.7%) | 85 (14.5%) |
| $35,000 to $39,999 | 29 (4.6%) | 27 (4.6%) |
| $40,000 to $44,999 | 0 (0.0%) | 16 (2.7%) |
| $45,000 to $49,999 | 13 (2.1%) | 10 (1.7%) |
| $50,000 to $54,999 | 18 (2.9%) | 17 (2.9%) |
| $55,000 to $64,999 | 55 (8.7%) | 62 (10.5%) |
| $65,000 to $74,999 | 77 (12.2%) | 19 (3.2%) |
| $75,000 to $99,999 | 56 (8.9%) | 31 (5.3%) |
| $100,000+ | 79 (12.5%) | 14 (2.4%) |
| Total | 631 (100.0%) | 588 (100.0%) |
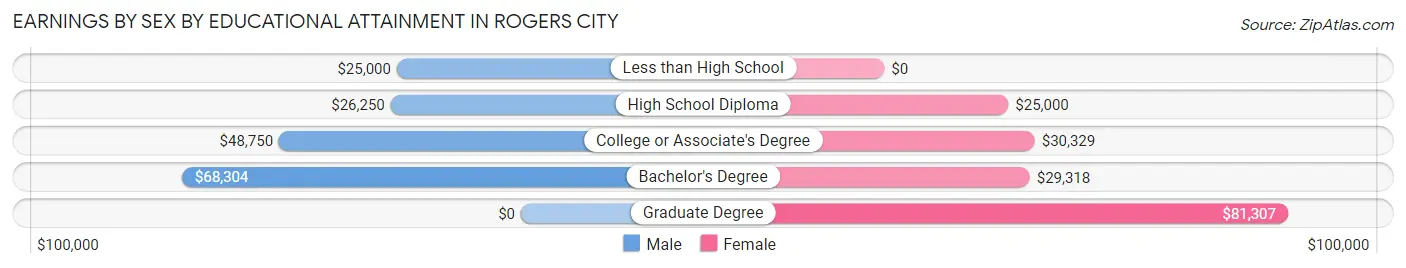
Earnings by Sex by Educational Attainment in Rogers City
Average earnings in Rogers City are $54,792 for men and $30,164 for women, a difference of 45.0%. Men with an educational attainment of bachelor's degree enjoy the highest average annual earnings of $68,304, while those with less than high school education earn the least with $25,000. Women with an educational attainment of graduate degree earn the most with the average annual earnings of $81,307, while those with high school diploma education have the smallest earnings of $25,000.
| Educational Attainment | Male Income | Female Income |
| Less than High School | $25,000 | $0 |
| High School Diploma | $26,250 | $25,000 |
| College or Associate's Degree | $48,750 | $30,329 |
| Bachelor's Degree | $68,304 | $29,318 |
| Graduate Degree | - | - |
| Total | $54,792 | $30,164 |
Family Income in Rogers City
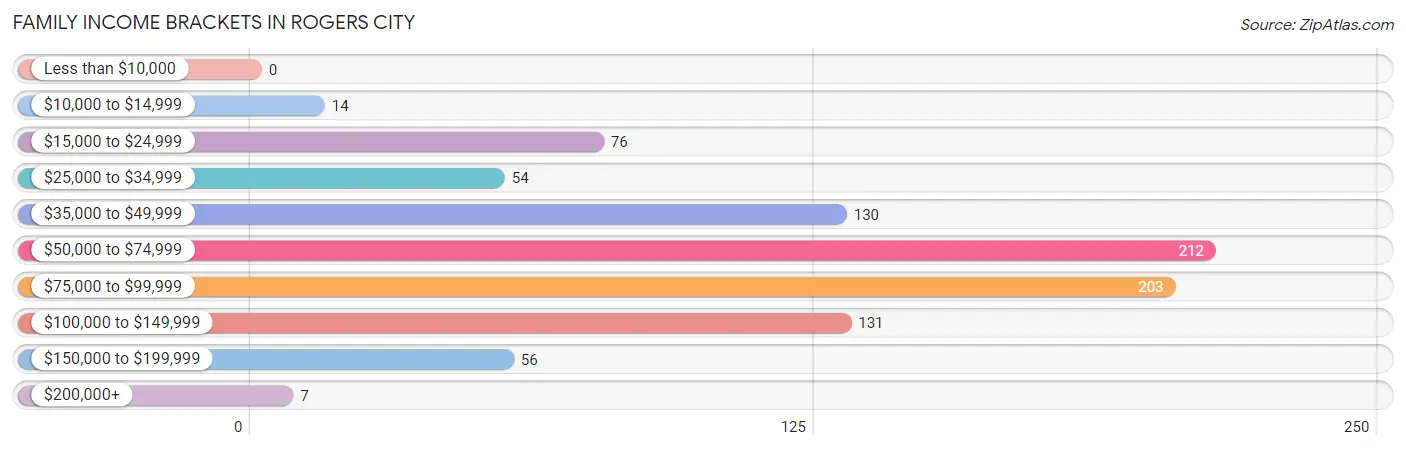
Family Income Brackets in Rogers City
According to the Rogers City family income data, there are 212 families falling into the $50,000 to $74,999 income range, which is the most common income bracket and makes up 24.0% of all families.
| Income Bracket | # Families | % Families |
| Less than $10,000 | 0 | 0.0% |
| $10,000 to $14,999 | 14 | 1.6% |
| $15,000 to $24,999 | 76 | 8.6% |
| $25,000 to $34,999 | 54 | 6.1% |
| $35,000 to $49,999 | 130 | 14.7% |
| $50,000 to $74,999 | 212 | 24.0% |
| $75,000 to $99,999 | 203 | 23.0% |
| $100,000 to $149,999 | 131 | 14.8% |
| $150,000 to $199,999 | 56 | 6.3% |
| $200,000+ | 7 | 0.8% |
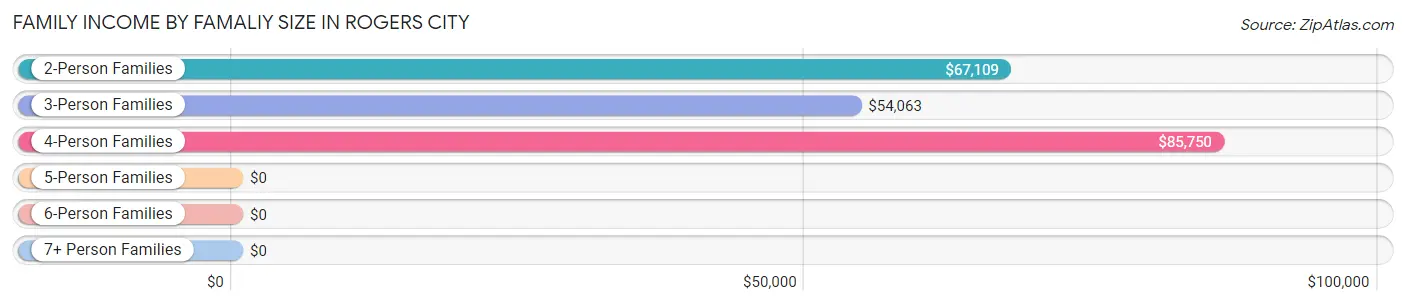
Family Income by Famaliy Size in Rogers City
4-person families (131 | 14.8%) account for the highest median family income in Rogers City with $85,750 per family, while 2-person families (615 | 69.7%) have the highest median income of $33,554 per family member.
| Income Bracket | # Families | Median Income |
| 2-Person Families | 615 (69.7%) | $67,109 |
| 3-Person Families | 116 (13.1%) | $54,063 |
| 4-Person Families | 131 (14.8%) | $85,750 |
| 5-Person Families | 10 (1.1%) | $0 |
| 6-Person Families | 0 (0.0%) | $0 |
| 7+ Person Families | 11 (1.3%) | $0 |
| Total | 883 (100.0%) | $68,607 |
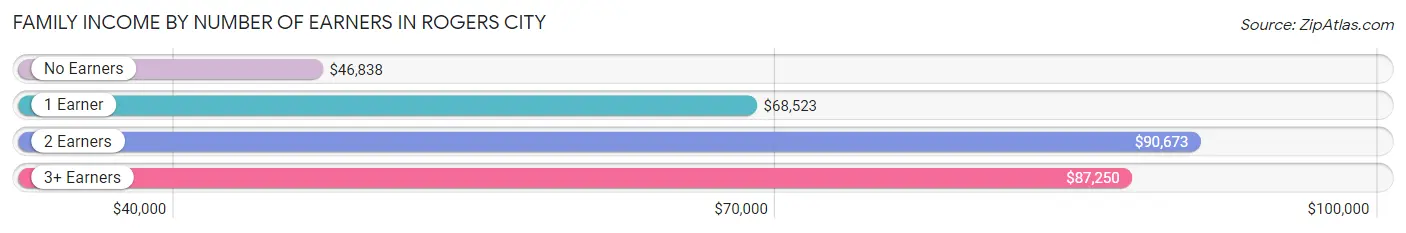
Family Income by Number of Earners in Rogers City
The median family income in Rogers City is $68,607, with families comprising 2 earners (327) having the highest median family income of $90,673, while families with no earners (253) have the lowest median family income of $46,838, accounting for 37.0% and 28.6% of families, respectively.
| Number of Earners | # Families | Median Income |
| No Earners | 253 (28.6%) | $46,838 |
| 1 Earner | 258 (29.2%) | $68,523 |
| 2 Earners | 327 (37.0%) | $90,673 |
| 3+ Earners | 45 (5.1%) | $87,250 |
| Total | 883 (100.0%) | $68,607 |
Household Income in Rogers City
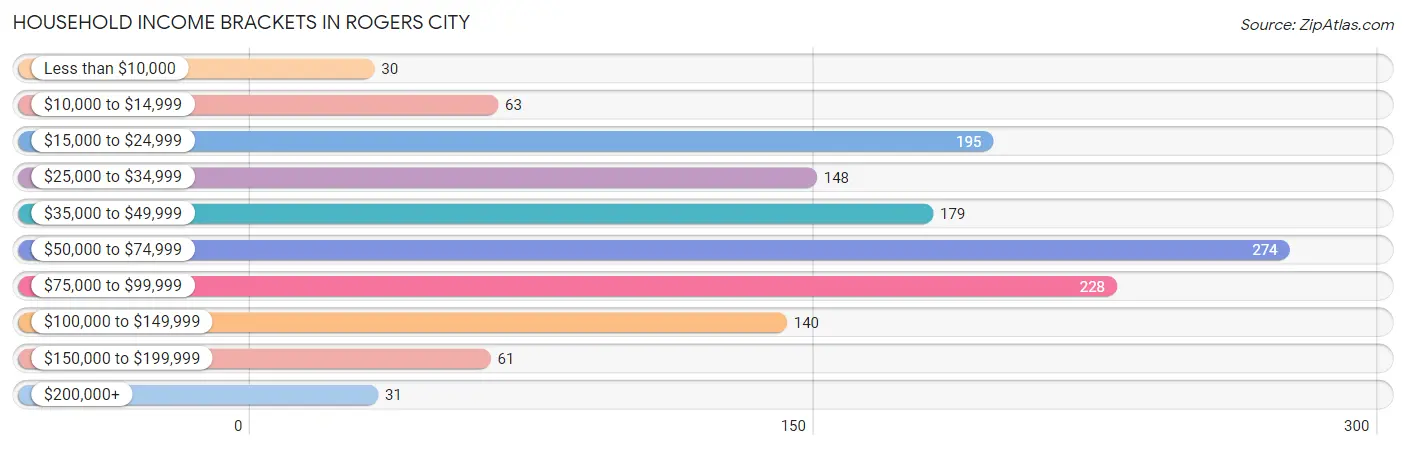
Household Income Brackets in Rogers City
With 274 households falling in the category, the $50,000 to $74,999 income range is the most frequent in Rogers City, accounting for 20.3% of all households. In contrast, only 30 households (2.2%) fall into the less than $10,000 income bracket, making it the least populous group.
| Income Bracket | # Households | % Households |
| Less than $10,000 | 30 | 2.2% |
| $10,000 to $14,999 | 63 | 4.7% |
| $15,000 to $24,999 | 195 | 14.5% |
| $25,000 to $34,999 | 148 | 11.0% |
| $35,000 to $49,999 | 179 | 13.3% |
| $50,000 to $74,999 | 274 | 20.3% |
| $75,000 to $99,999 | 228 | 16.9% |
| $100,000 to $149,999 | 140 | 10.4% |
| $150,000 to $199,999 | 61 | 4.5% |
| $200,000+ | 31 | 2.3% |
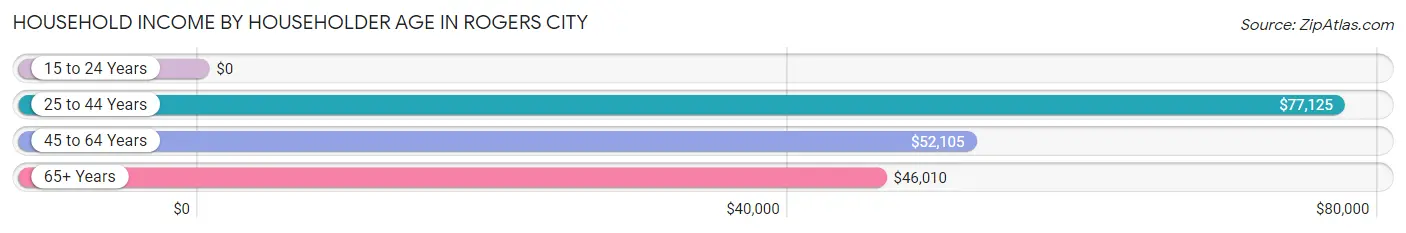
Household Income by Householder Age in Rogers City
The median household income in Rogers City is $53,673, with the highest median household income of $77,125 found in the 25 to 44 years age bracket for the primary householder. A total of 329 households (24.4%) fall into this category. Meanwhile, the 15 to 24 years age bracket for the primary householder has the lowest median household income of $0, with 16 households (1.2%) in this group.
| Income Bracket | # Households | Median Income |
| 15 to 24 Years | 16 (1.2%) | $0 |
| 25 to 44 Years | 329 (24.4%) | $77,125 |
| 45 to 64 Years | 442 (32.8%) | $52,105 |
| 65+ Years | 561 (41.6%) | $46,010 |
| Total | 1,348 (100.0%) | $53,673 |
Poverty in Rogers City
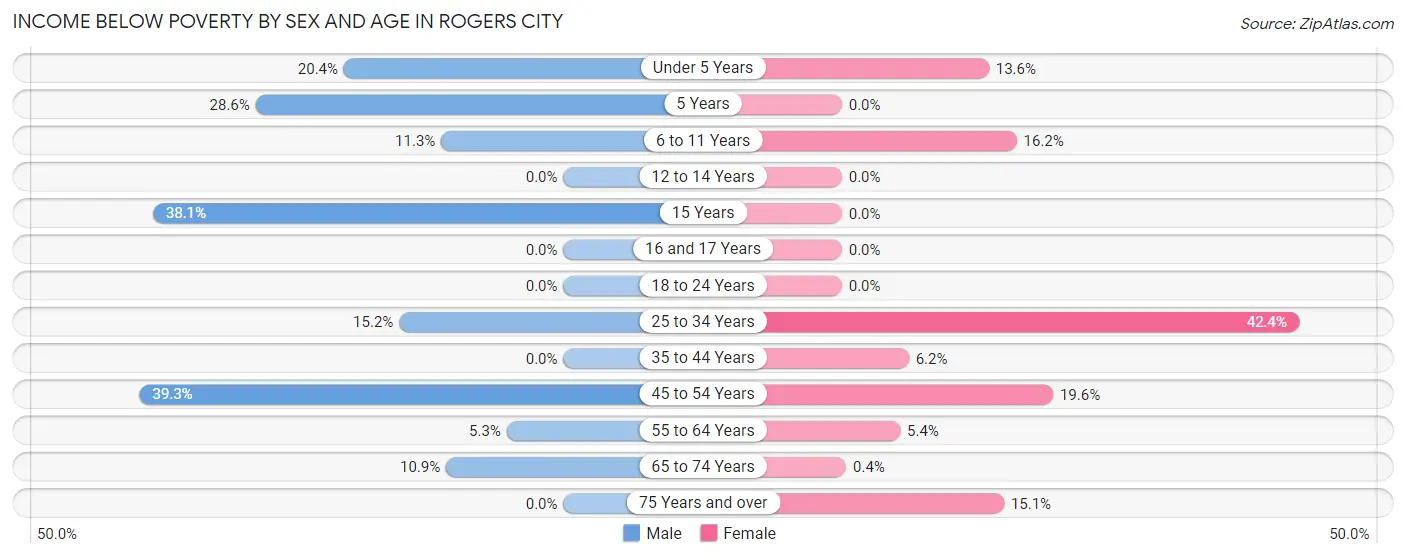
Income Below Poverty by Sex and Age in Rogers City
With 10.6% poverty level for males and 13.1% for females among the residents of Rogers City, 45 to 54 year old males and 25 to 34 year old females are the most vulnerable to poverty, with 48 males (39.3%) and 81 females (42.4%) in their respective age groups living below the poverty level.
| Age Bracket | Male | Female |
| Under 5 Years | 11 (20.4%) | 12 (13.6%) |
| 5 Years | 8 (28.6%) | 0 (0.0%) |
| 6 to 11 Years | 11 (11.3%) | 12 (16.2%) |
| 12 to 14 Years | 0 (0.0%) | 0 (0.0%) |
| 15 Years | 8 (38.1%) | 0 (0.0%) |
| 16 and 17 Years | 0 (0.0%) | 0 (0.0%) |
| 18 to 24 Years | 0 (0.0%) | 0 (0.0%) |
| 25 to 34 Years | 16 (15.2%) | 81 (42.4%) |
| 35 to 44 Years | 0 (0.0%) | 9 (6.2%) |
| 45 to 54 Years | 48 (39.3%) | 39 (19.6%) |
| 55 to 64 Years | 9 (5.3%) | 14 (5.4%) |
| 65 to 74 Years | 22 (10.9%) | 1 (0.4%) |
| 75 Years and over | 0 (0.0%) | 31 (15.0%) |
| Total | 133 (10.6%) | 199 (13.1%) |
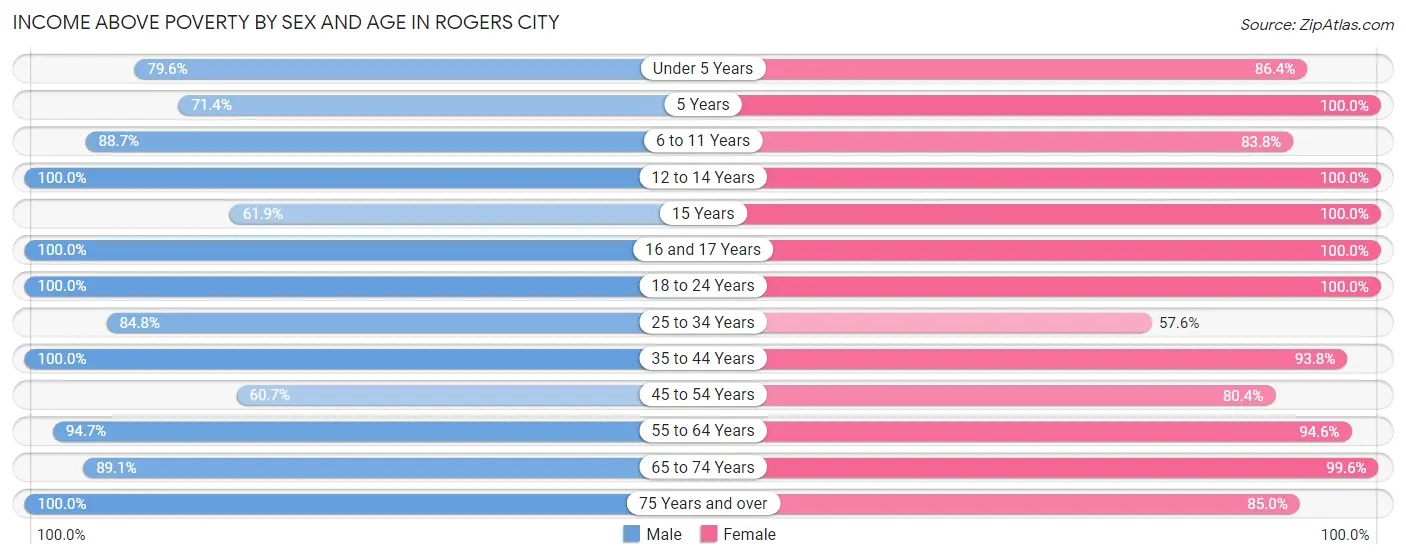
Income Above Poverty by Sex and Age in Rogers City
According to the poverty statistics in Rogers City, males aged 12 to 14 years and females aged 5 years are the age groups that are most secure financially, with 100.0% of males and 100.0% of females in these age groups living above the poverty line.
| Age Bracket | Male | Female |
| Under 5 Years | 43 (79.6%) | 76 (86.4%) |
| 5 Years | 20 (71.4%) | 7 (100.0%) |
| 6 to 11 Years | 86 (88.7%) | 62 (83.8%) |
| 12 to 14 Years | 5 (100.0%) | 47 (100.0%) |
| 15 Years | 13 (61.9%) | 11 (100.0%) |
| 16 and 17 Years | 33 (100.0%) | 6 (100.0%) |
| 18 to 24 Years | 60 (100.0%) | 37 (100.0%) |
| 25 to 34 Years | 89 (84.8%) | 110 (57.6%) |
| 35 to 44 Years | 165 (100.0%) | 136 (93.8%) |
| 45 to 54 Years | 74 (60.7%) | 160 (80.4%) |
| 55 to 64 Years | 162 (94.7%) | 245 (94.6%) |
| 65 to 74 Years | 180 (89.1%) | 252 (99.6%) |
| 75 Years and over | 188 (100.0%) | 175 (85.0%) |
| Total | 1,118 (89.4%) | 1,324 (86.9%) |
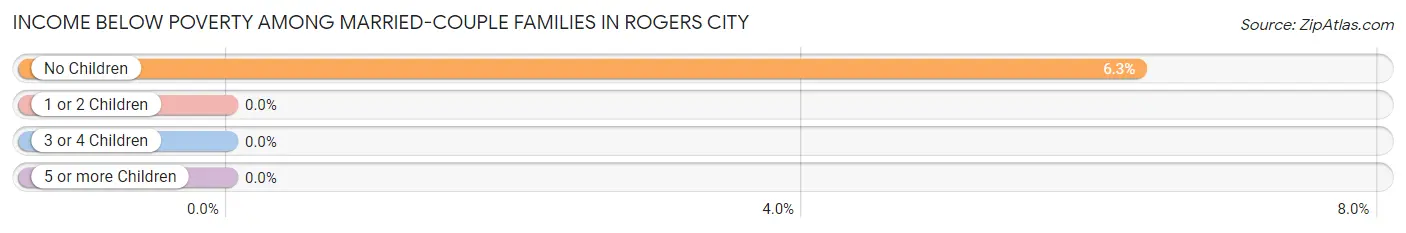
Income Below Poverty Among Married-Couple Families in Rogers City
The poverty statistics for married-couple families in Rogers City show that 4.8% or 31 of the total 651 families live below the poverty line. Families with no children have the highest poverty rate of 6.3%, comprising of 31 families. On the other hand, families with 1 or 2 children have the lowest poverty rate of 0.0%, which includes 0 families.
| Children | Above Poverty | Below Poverty |
| No Children | 459 (93.7%) | 31 (6.3%) |
| 1 or 2 Children | 150 (100.0%) | 0 (0.0%) |
| 3 or 4 Children | 11 (100.0%) | 0 (0.0%) |
| 5 or more Children | 0 (0.0%) | 0 (0.0%) |
| Total | 620 (95.2%) | 31 (4.8%) |
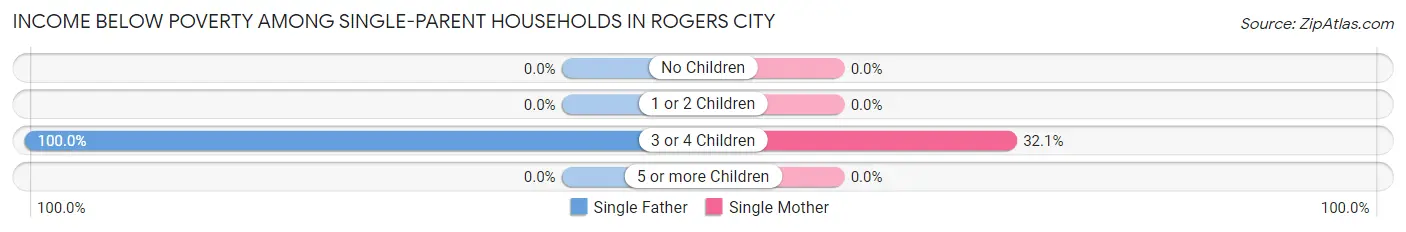
Income Below Poverty Among Single-Parent Households in Rogers City
According to the poverty data in Rogers City, 21.2% or 14 single-father households and 5.4% or 9 single-mother households are living below the poverty line. Among single-father households, those with 3 or 4 children have the highest poverty rate, with 14 households (100.0%) experiencing poverty. Likewise, among single-mother households, those with 3 or 4 children have the highest poverty rate, with 9 households (32.1%) falling below the poverty line.
| Children | Single Father | Single Mother |
| No Children | 0 (0.0%) | 0 (0.0%) |
| 1 or 2 Children | 0 (0.0%) | 0 (0.0%) |
| 3 or 4 Children | 14 (100.0%) | 9 (32.1%) |
| 5 or more Children | 0 (0.0%) | 0 (0.0%) |
| Total | 14 (21.2%) | 9 (5.4%) |
Income Below Poverty Among Married-Couple vs Single-Parent Households in Rogers City
The poverty data for Rogers City shows that 31 of the married-couple family households (4.8%) and 23 of the single-parent households (9.9%) are living below the poverty level. Within the married-couple family households, those with no children have the highest poverty rate, with 31 households (6.3%) falling below the poverty line. Among the single-parent households, those with 3 or 4 children have the highest poverty rate, with 23 household (54.8%) living below poverty.
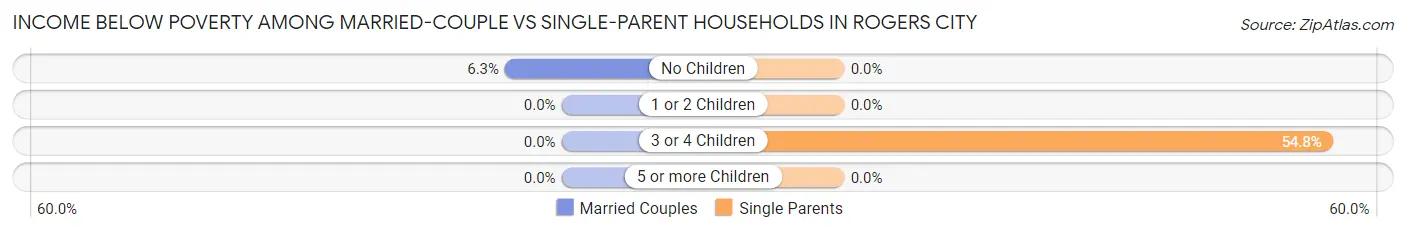
| Children | Married-Couple Families | Single-Parent Households |
| No Children | 31 (6.3%) | 0 (0.0%) |
| 1 or 2 Children | 0 (0.0%) | 0 (0.0%) |
| 3 or 4 Children | 0 (0.0%) | 23 (54.8%) |
| 5 or more Children | 0 (0.0%) | 0 (0.0%) |
| Total | 31 (4.8%) | 23 (9.9%) |
Employment Characteristics in Rogers City
Employment by Class of Employer in Rogers City
Among the 1,108 employed individuals in Rogers City, private company employees (696 | 62.8%), not-for-profit organizations (159 | 14.3%), and local government employees (93 | 8.4%) make up the most common classes of employment.
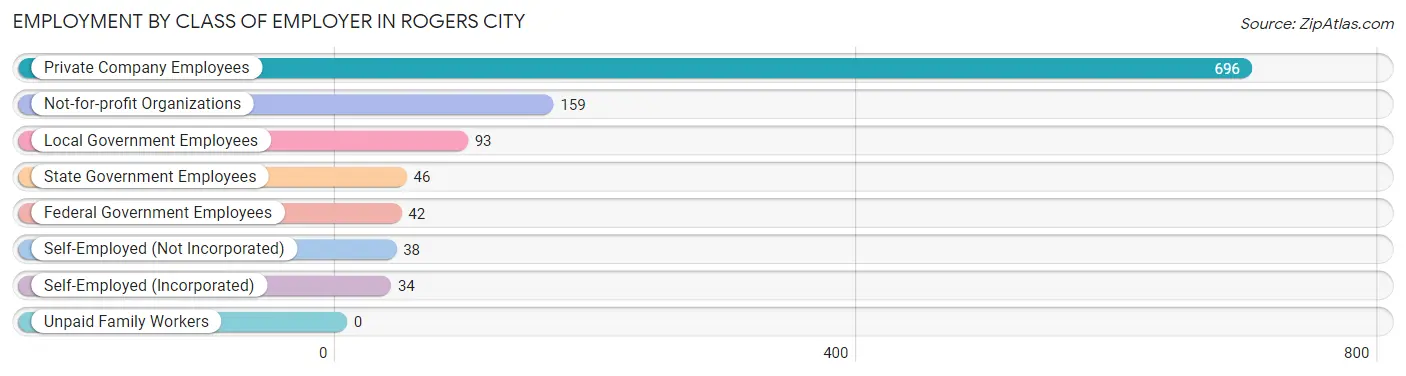
| Employer Class | # Employees | % Employees |
| Private Company Employees | 696 | 62.8% |
| Self-Employed (Incorporated) | 34 | 3.1% |
| Self-Employed (Not Incorporated) | 38 | 3.4% |
| Not-for-profit Organizations | 159 | 14.3% |
| Local Government Employees | 93 | 8.4% |
| State Government Employees | 46 | 4.2% |
| Federal Government Employees | 42 | 3.8% |
| Unpaid Family Workers | 0 | 0.0% |
| Total | 1,108 | 100.0% |
Employment Status by Age in Rogers City
According to the labor force statistics for Rogers City, out of the total population over 16 years of age (2,434), 47.5% or 1,156 individuals are in the labor force, with 3.2% or 37 of them unemployed. The age group with the highest labor force participation rate is 20 to 24 years, with 98.6% or 73 individuals in the labor force. Within the labor force, the 65 to 74 years age range has the highest percentage of unemployed individuals, with 12.4% or 12 of them being unemployed.
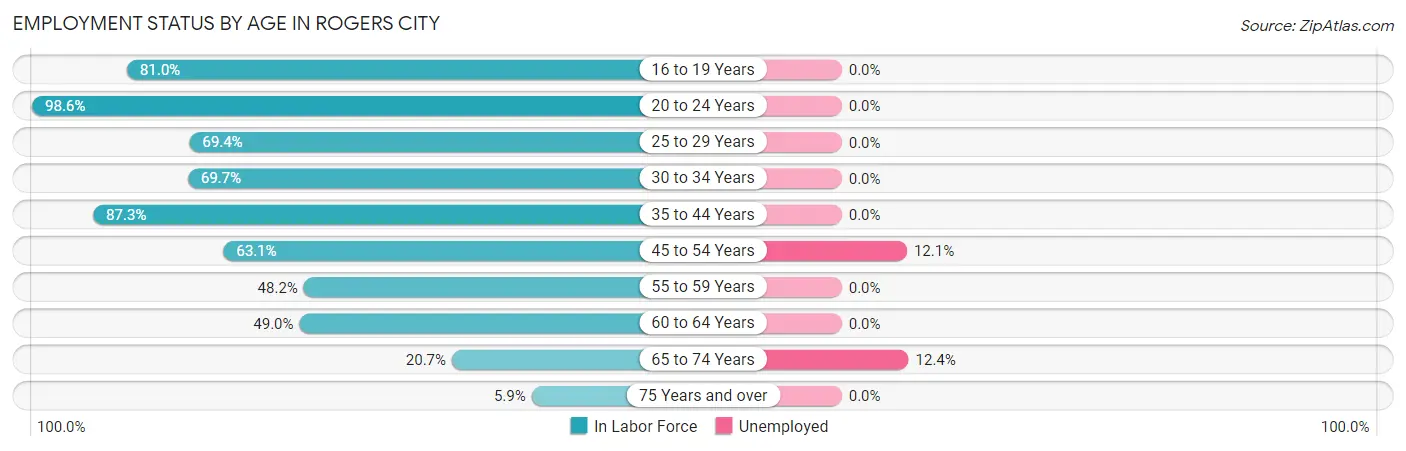
| Age Bracket | In Labor Force | Unemployed |
| 16 to 19 Years | 51 (81.0%) | 0 (0.0%) |
| 20 to 24 Years | 73 (98.6%) | 0 (0.0%) |
| 25 to 29 Years | 111 (69.4%) | 0 (0.0%) |
| 30 to 34 Years | 99 (69.7%) | 0 (0.0%) |
| 35 to 44 Years | 283 (87.3%) | 0 (0.0%) |
| 45 to 54 Years | 207 (63.1%) | 25 (12.1%) |
| 55 to 59 Years | 107 (48.2%) | 0 (0.0%) |
| 60 to 64 Years | 103 (49.0%) | 0 (0.0%) |
| 65 to 74 Years | 97 (20.7%) | 12 (12.4%) |
| 75 Years and over | 26 (5.9%) | 0 (0.0%) |
| Total | 1,156 (47.5%) | 37 (3.2%) |
Employment Status by Educational Attainment in Rogers City
According to labor force statistics for Rogers City, 65.7% of individuals (911) out of the total population between 25 and 64 years of age (1,386) are in the labor force, with 2.7% or 25 of them being unemployed. The group with the highest labor force participation rate are those with the educational attainment of bachelor's degree or higher, with 93.2% or 289 individuals in the labor force. Within the labor force, individuals with less than high school education have the highest percentage of unemployment, with 25.8% or 8 of them being unemployed.
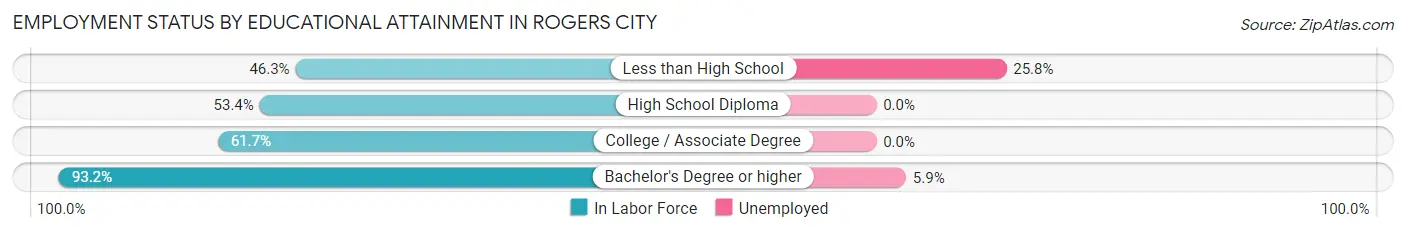
| Educational Attainment | In Labor Force | Unemployed |
| Less than High School | 31 (46.3%) | 17 (25.8%) |
| High School Diploma | 210 (53.4%) | 0 (0.0%) |
| College / Associate Degree | 380 (61.7%) | 0 (0.0%) |
| Bachelor's Degree or higher | 289 (93.2%) | 18 (5.9%) |
| Total | 911 (65.7%) | 37 (2.7%) |
Employment Occupations by Sex in Rogers City
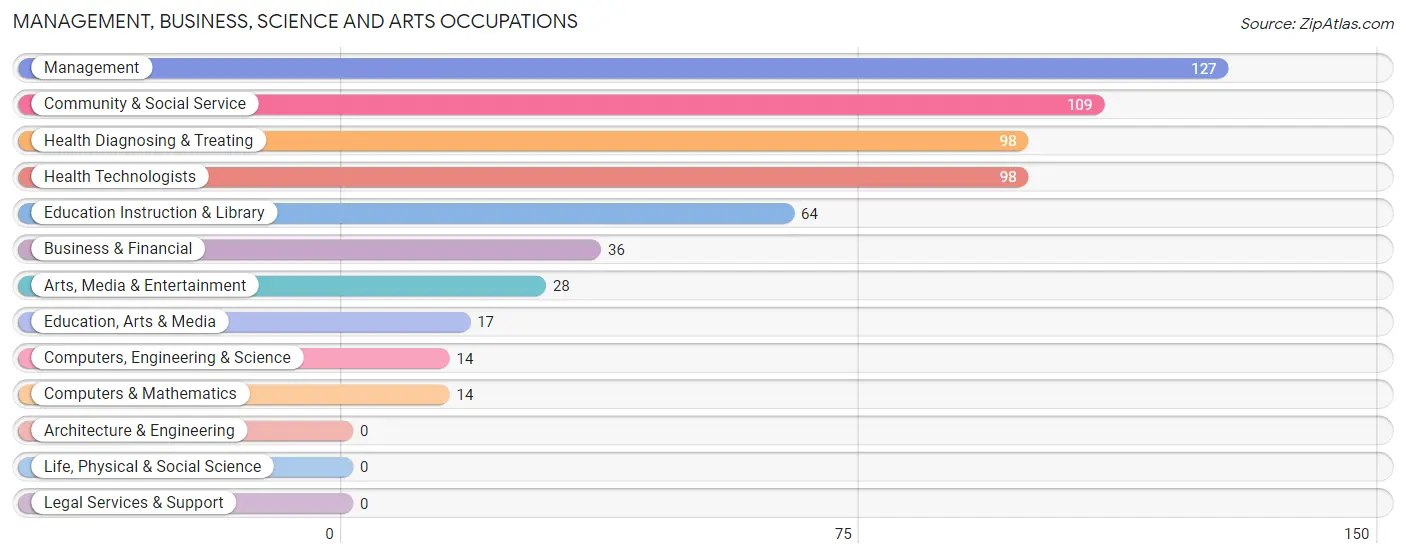
Management, Business, Science and Arts Occupations
The most common Management, Business, Science and Arts occupations in Rogers City are Management (127 | 11.3%), Community & Social Service (109 | 9.7%), Health Diagnosing & Treating (98 | 8.7%), Health Technologists (98 | 8.7%), and Education Instruction & Library (64 | 5.7%).
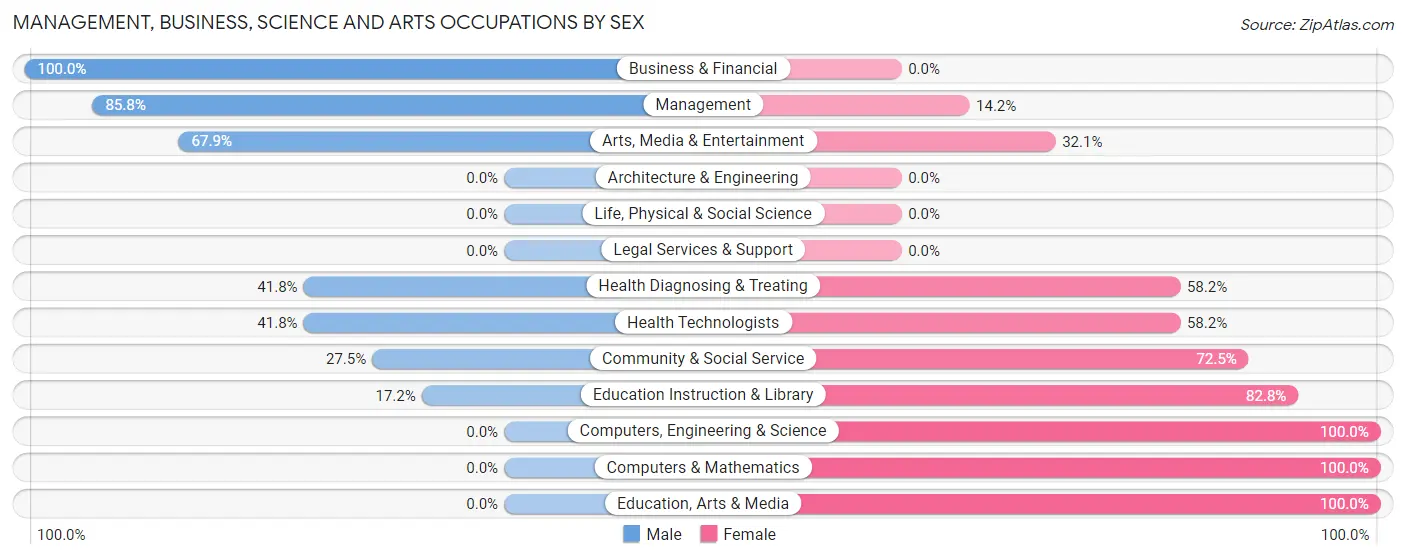
Management, Business, Science and Arts Occupations by Sex
Within the Management, Business, Science and Arts occupations in Rogers City, the most male-oriented occupations are Business & Financial (100.0%), Management (85.8%), and Arts, Media & Entertainment (67.9%), while the most female-oriented occupations are Computers, Engineering & Science (100.0%), Computers & Mathematics (100.0%), and Education, Arts & Media (100.0%).
| Occupation | Male | Female |
| Management | 109 (85.8%) | 18 (14.2%) |
| Business & Financial | 36 (100.0%) | 0 (0.0%) |
| Computers, Engineering & Science | 0 (0.0%) | 14 (100.0%) |
| Computers & Mathematics | 0 (0.0%) | 14 (100.0%) |
| Architecture & Engineering | 0 (0.0%) | 0 (0.0%) |
| Life, Physical & Social Science | 0 (0.0%) | 0 (0.0%) |
| Community & Social Service | 30 (27.5%) | 79 (72.5%) |
| Education, Arts & Media | 0 (0.0%) | 17 (100.0%) |
| Legal Services & Support | 0 (0.0%) | 0 (0.0%) |
| Education Instruction & Library | 11 (17.2%) | 53 (82.8%) |
| Arts, Media & Entertainment | 19 (67.9%) | 9 (32.1%) |
| Health Diagnosing & Treating | 41 (41.8%) | 57 (58.2%) |
| Health Technologists | 41 (41.8%) | 57 (58.2%) |
| Total (Category) | 216 (56.2%) | 168 (43.8%) |
| Total (Overall) | 578 (51.6%) | 542 (48.4%) |
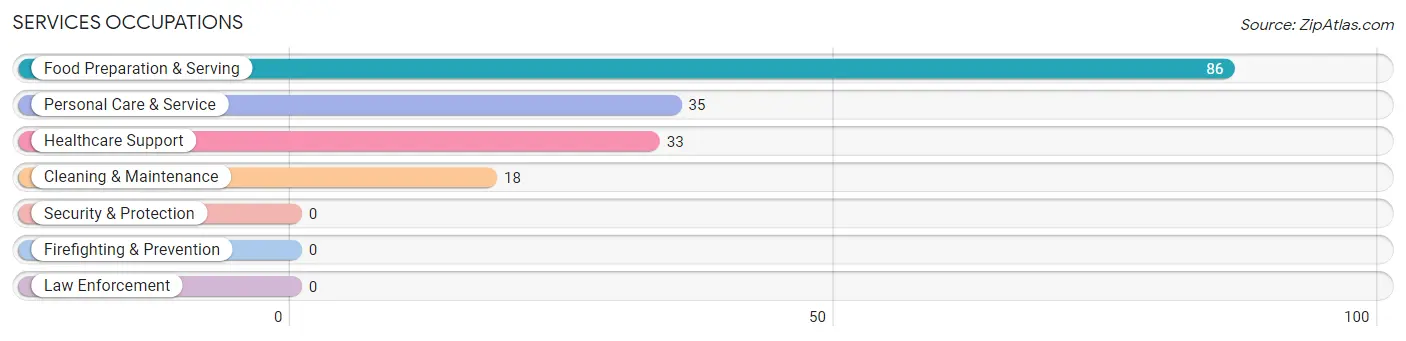
Services Occupations
The most common Services occupations in Rogers City are Food Preparation & Serving (86 | 7.7%), Personal Care & Service (35 | 3.1%), Healthcare Support (33 | 2.9%), and Cleaning & Maintenance (18 | 1.6%).
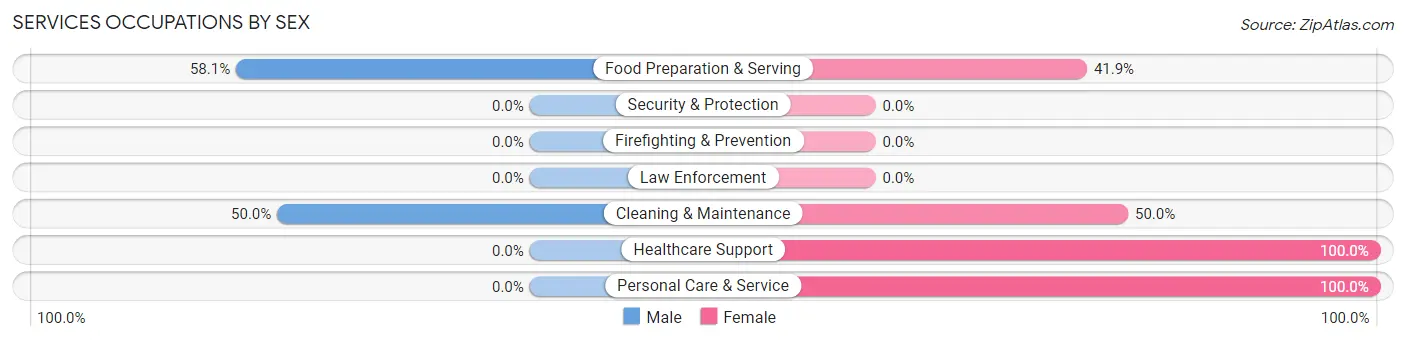
Services Occupations by Sex
Within the Services occupations in Rogers City, the most male-oriented occupations are Food Preparation & Serving (58.1%), and Cleaning & Maintenance (50.0%), while the most female-oriented occupations are Healthcare Support (100.0%), Personal Care & Service (100.0%), and Cleaning & Maintenance (50.0%).
| Occupation | Male | Female |
| Healthcare Support | 0 (0.0%) | 33 (100.0%) |
| Security & Protection | 0 (0.0%) | 0 (0.0%) |
| Firefighting & Prevention | 0 (0.0%) | 0 (0.0%) |
| Law Enforcement | 0 (0.0%) | 0 (0.0%) |
| Food Preparation & Serving | 50 (58.1%) | 36 (41.9%) |
| Cleaning & Maintenance | 9 (50.0%) | 9 (50.0%) |
| Personal Care & Service | 0 (0.0%) | 35 (100.0%) |
| Total (Category) | 59 (34.3%) | 113 (65.7%) |
| Total (Overall) | 578 (51.6%) | 542 (48.4%) |
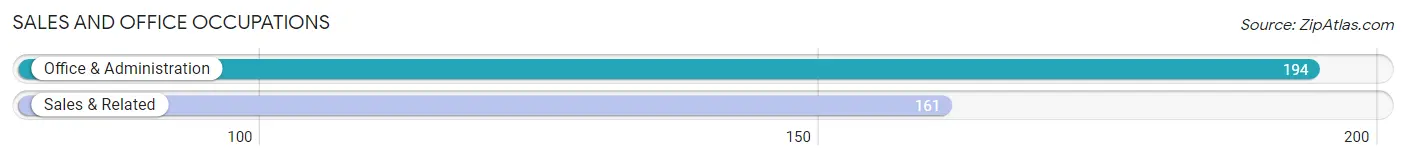
Sales and Office Occupations
The most common Sales and Office occupations in Rogers City are Office & Administration (194 | 17.3%), and Sales & Related (161 | 14.4%).
Sales and Office Occupations by Sex
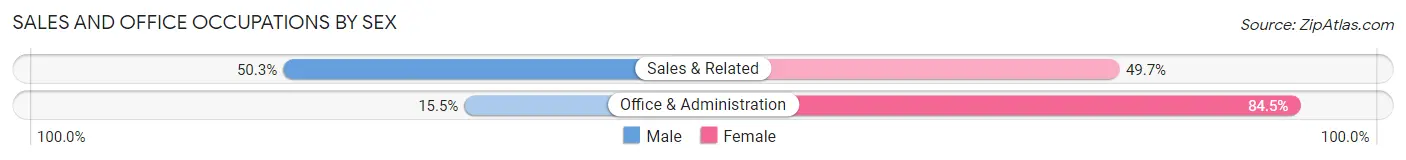
| Occupation | Male | Female |
| Sales & Related | 81 (50.3%) | 80 (49.7%) |
| Office & Administration | 30 (15.5%) | 164 (84.5%) |
| Total (Category) | 111 (31.3%) | 244 (68.7%) |
| Total (Overall) | 578 (51.6%) | 542 (48.4%) |
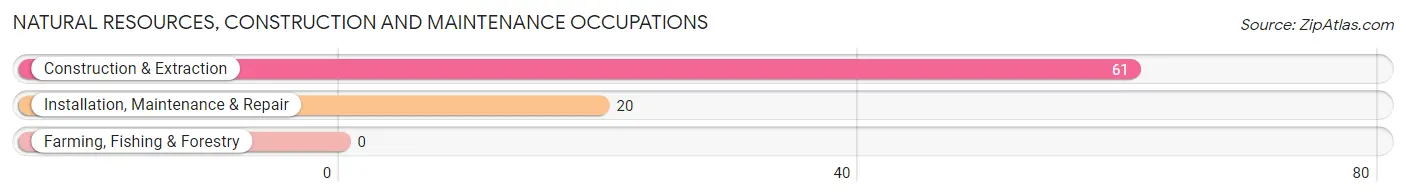
Natural Resources, Construction and Maintenance Occupations
The most common Natural Resources, Construction and Maintenance occupations in Rogers City are Construction & Extraction (61 | 5.4%), and Installation, Maintenance & Repair (20 | 1.8%).
Natural Resources, Construction and Maintenance Occupations by Sex
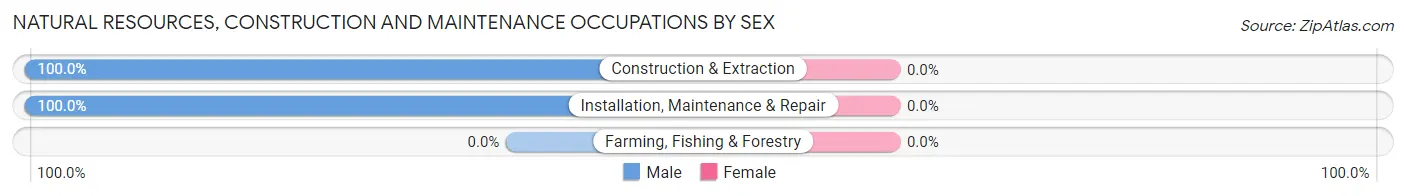
| Occupation | Male | Female |
| Farming, Fishing & Forestry | 0 (0.0%) | 0 (0.0%) |
| Construction & Extraction | 61 (100.0%) | 0 (0.0%) |
| Installation, Maintenance & Repair | 20 (100.0%) | 0 (0.0%) |
| Total (Category) | 81 (100.0%) | 0 (0.0%) |
| Total (Overall) | 578 (51.6%) | 542 (48.4%) |
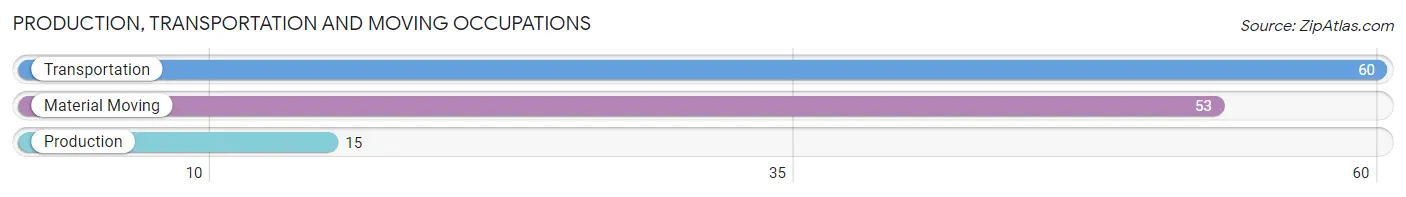
Production, Transportation and Moving Occupations
The most common Production, Transportation and Moving occupations in Rogers City are Transportation (60 | 5.4%), Material Moving (53 | 4.7%), and Production (15 | 1.3%).
Production, Transportation and Moving Occupations by Sex
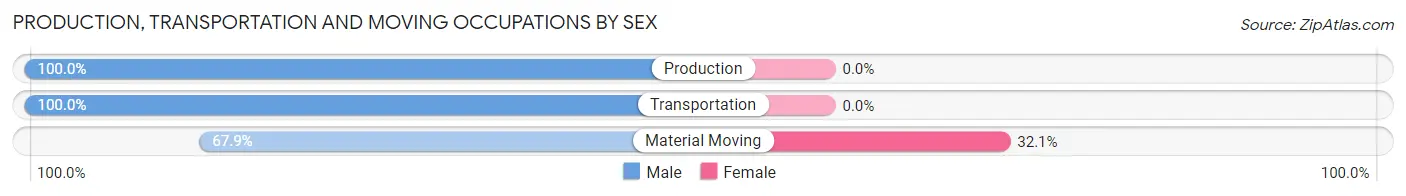
| Occupation | Male | Female |
| Production | 15 (100.0%) | 0 (0.0%) |
| Transportation | 60 (100.0%) | 0 (0.0%) |
| Material Moving | 36 (67.9%) | 17 (32.1%) |
| Total (Category) | 111 (86.7%) | 17 (13.3%) |
| Total (Overall) | 578 (51.6%) | 542 (48.4%) |
Employment Industries by Sex in Rogers City
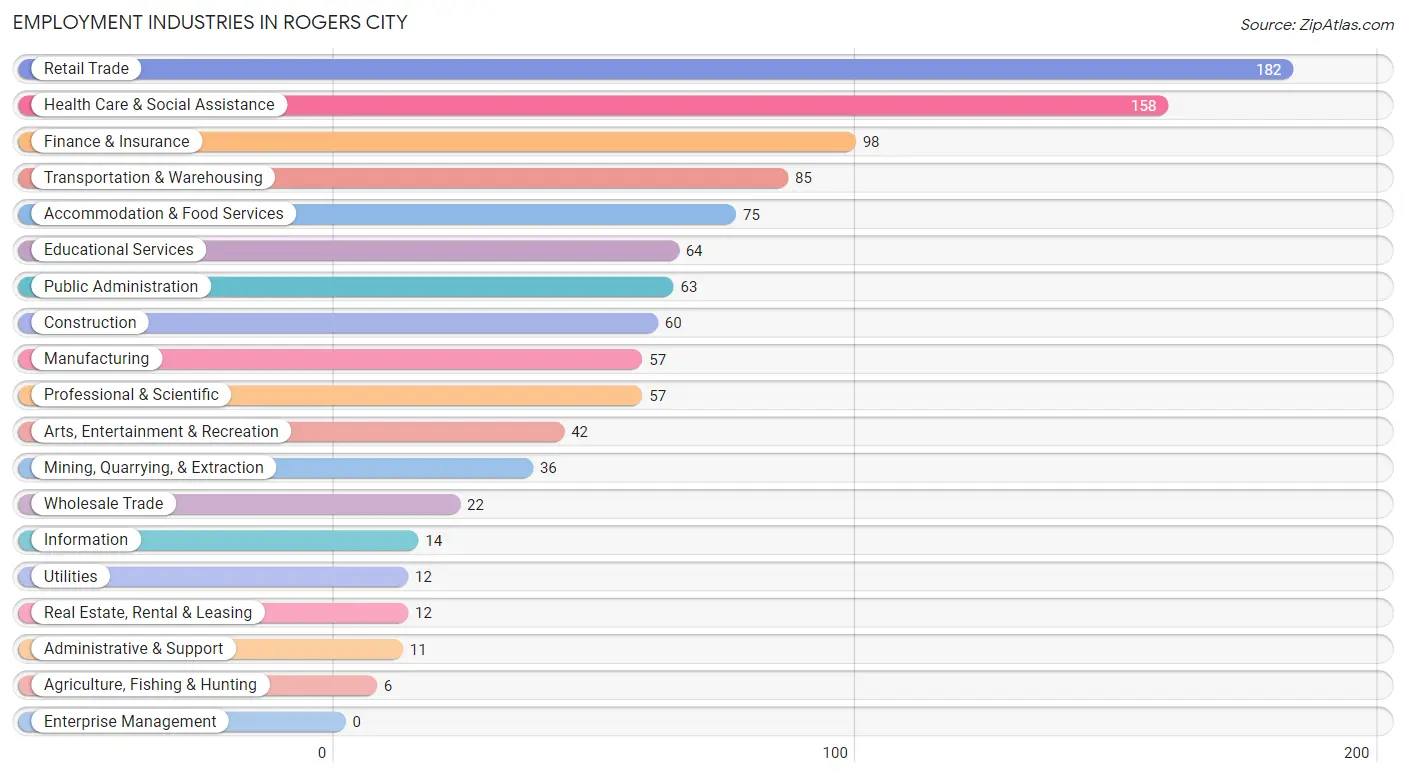
Employment Industries in Rogers City
The major employment industries in Rogers City include Retail Trade (182 | 16.3%), Health Care & Social Assistance (158 | 14.1%), Finance & Insurance (98 | 8.7%), Transportation & Warehousing (85 | 7.6%), and Accommodation & Food Services (75 | 6.7%).
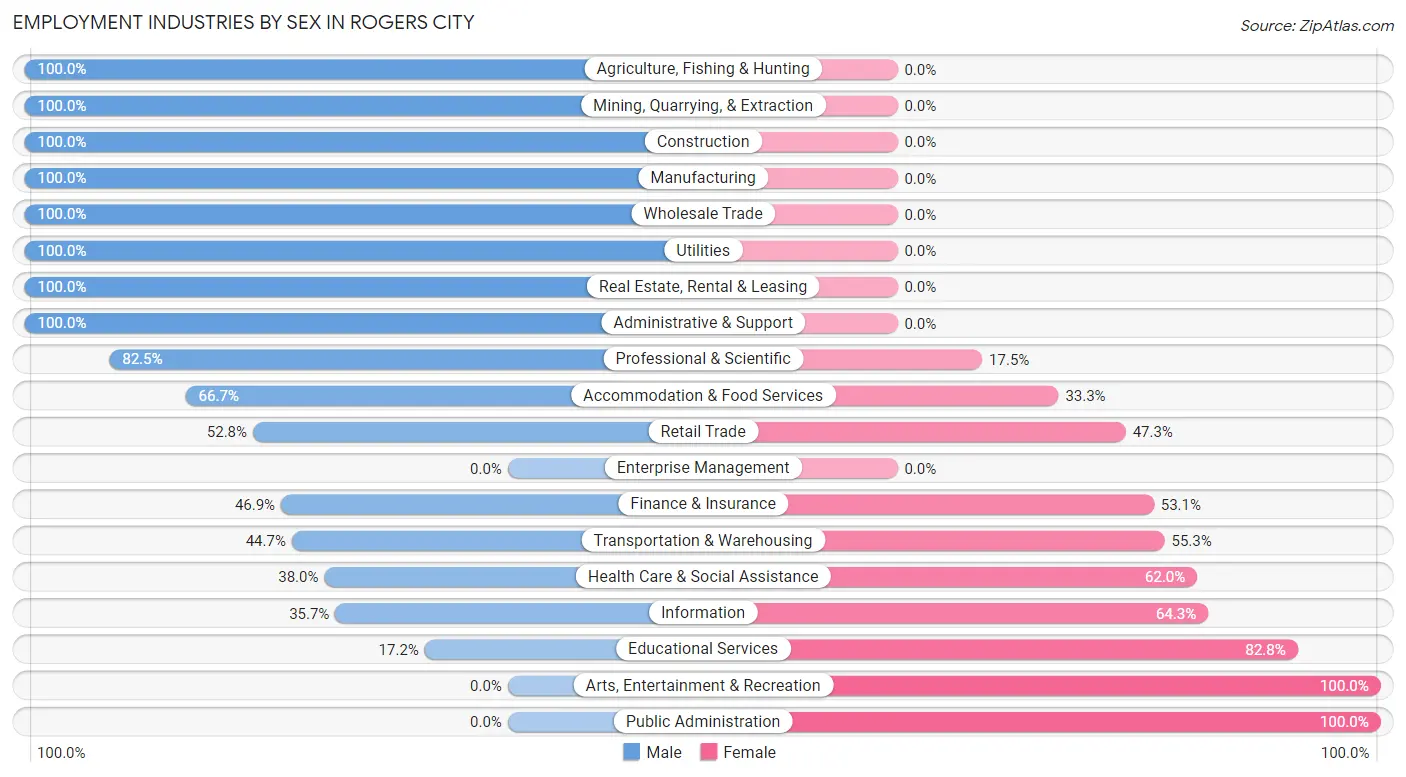
Employment Industries by Sex in Rogers City
The Rogers City industries that see more men than women are Agriculture, Fishing & Hunting (100.0%), Mining, Quarrying, & Extraction (100.0%), and Construction (100.0%), whereas the industries that tend to have a higher number of women are Arts, Entertainment & Recreation (100.0%), Public Administration (100.0%), and Educational Services (82.8%).
| Industry | Male | Female |
| Agriculture, Fishing & Hunting | 6 (100.0%) | 0 (0.0%) |
| Mining, Quarrying, & Extraction | 36 (100.0%) | 0 (0.0%) |
| Construction | 60 (100.0%) | 0 (0.0%) |
| Manufacturing | 57 (100.0%) | 0 (0.0%) |
| Wholesale Trade | 22 (100.0%) | 0 (0.0%) |
| Retail Trade | 96 (52.7%) | 86 (47.2%) |
| Transportation & Warehousing | 38 (44.7%) | 47 (55.3%) |
| Utilities | 12 (100.0%) | 0 (0.0%) |
| Information | 5 (35.7%) | 9 (64.3%) |
| Finance & Insurance | 46 (46.9%) | 52 (53.1%) |
| Real Estate, Rental & Leasing | 12 (100.0%) | 0 (0.0%) |
| Professional & Scientific | 47 (82.5%) | 10 (17.5%) |
| Enterprise Management | 0 (0.0%) | 0 (0.0%) |
| Administrative & Support | 11 (100.0%) | 0 (0.0%) |
| Educational Services | 11 (17.2%) | 53 (82.8%) |
| Health Care & Social Assistance | 60 (38.0%) | 98 (62.0%) |
| Arts, Entertainment & Recreation | 0 (0.0%) | 42 (100.0%) |
| Accommodation & Food Services | 50 (66.7%) | 25 (33.3%) |
| Public Administration | 0 (0.0%) | 63 (100.0%) |
| Total | 578 (51.6%) | 542 (48.4%) |
Education in Rogers City
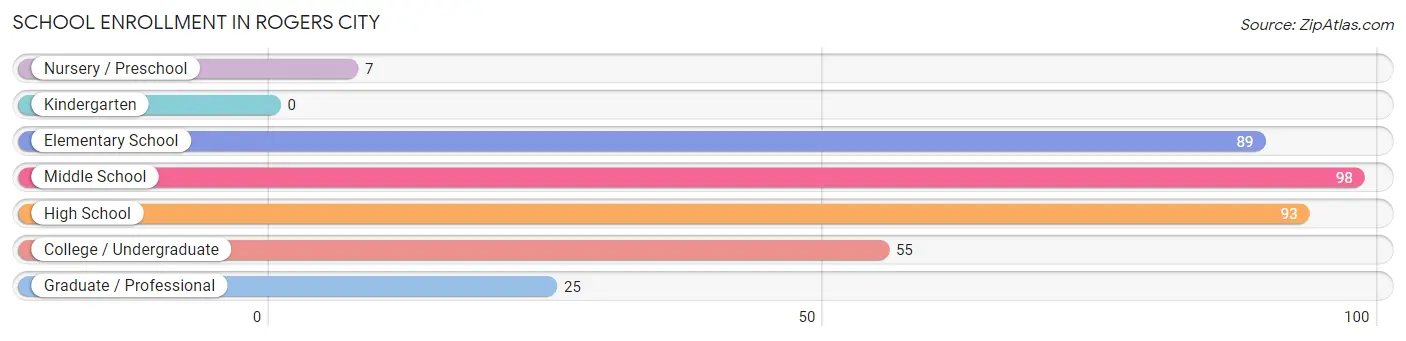
School Enrollment in Rogers City
The most common levels of schooling among the 367 students in Rogers City are middle school (98 | 26.7%), high school (93 | 25.3%), and elementary school (89 | 24.2%).
| School Level | # Students | % Students |
| Nursery / Preschool | 7 | 1.9% |
| Kindergarten | 0 | 0.0% |
| Elementary School | 89 | 24.2% |
| Middle School | 98 | 26.7% |
| High School | 93 | 25.3% |
| College / Undergraduate | 55 | 15.0% |
| Graduate / Professional | 25 | 6.8% |
| Total | 367 | 100.0% |
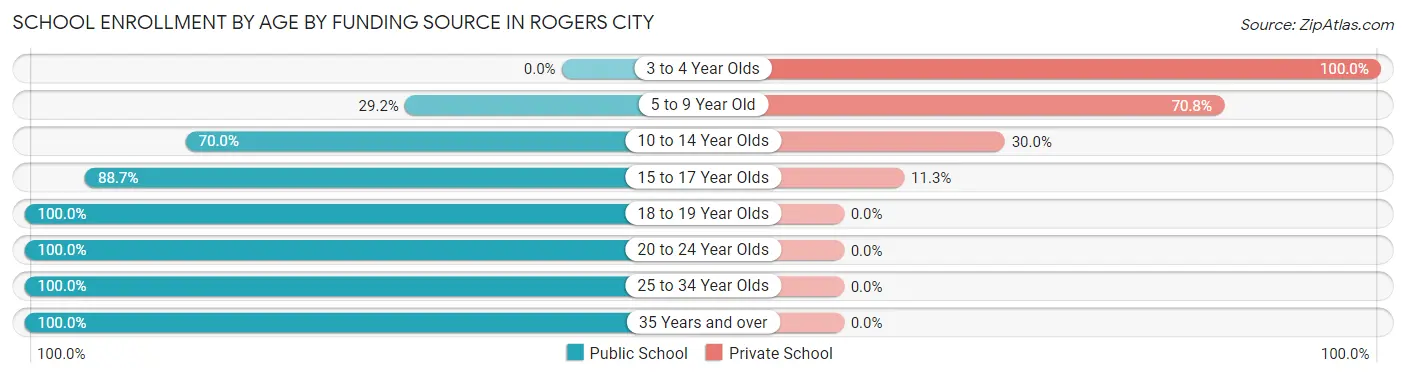
School Enrollment by Age by Funding Source in Rogers City
Out of a total of 367 students who are enrolled in schools in Rogers City, 114 (31.1%) attend a private institution, while the remaining 253 (68.9%) are enrolled in public schools. The age group of 3 to 4 year olds has the highest likelihood of being enrolled in private schools, with 7 (100.0% in the age bracket) enrolled. Conversely, the age group of 18 to 19 year olds has the lowest likelihood of being enrolled in a private school, with 12 (100.0% in the age bracket) attending a public institution.
| Age Bracket | Public School | Private School |
| 3 to 4 Year Olds | 0 (0.0%) | 7 (100.0%) |
| 5 to 9 Year Old | 26 (29.2%) | 63 (70.8%) |
| 10 to 14 Year Olds | 84 (70.0%) | 36 (30.0%) |
| 15 to 17 Year Olds | 63 (88.7%) | 8 (11.3%) |
| 18 to 19 Year Olds | 12 (100.0%) | 0 (0.0%) |
| 20 to 24 Year Olds | 25 (100.0%) | 0 (0.0%) |
| 25 to 34 Year Olds | 18 (100.0%) | 0 (0.0%) |
| 35 Years and over | 25 (100.0%) | 0 (0.0%) |
| Total | 253 (68.9%) | 114 (31.1%) |
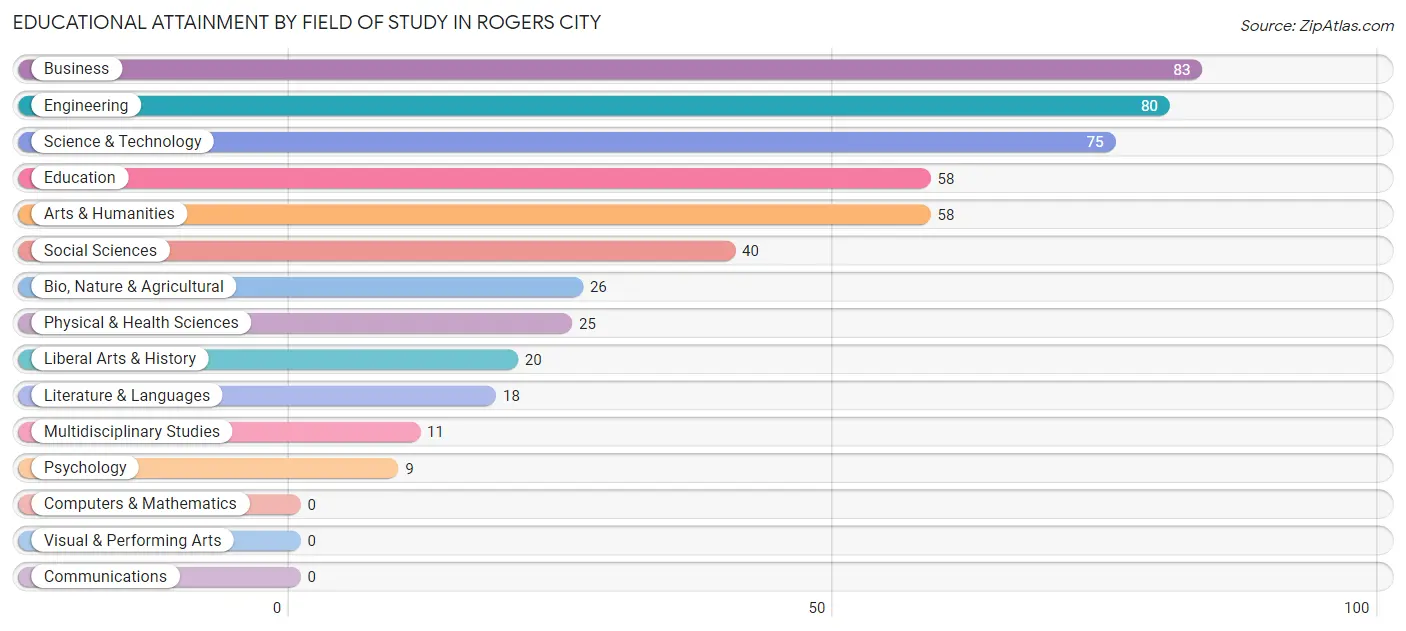
Educational Attainment by Field of Study in Rogers City
Business (83 | 16.5%), engineering (80 | 15.9%), science & technology (75 | 14.9%), education (58 | 11.5%), and arts & humanities (58 | 11.5%) are the most common fields of study among 503 individuals in Rogers City who have obtained a bachelor's degree or higher.
| Field of Study | # Graduates | % Graduates |
| Computers & Mathematics | 0 | 0.0% |
| Bio, Nature & Agricultural | 26 | 5.2% |
| Physical & Health Sciences | 25 | 5.0% |
| Psychology | 9 | 1.8% |
| Social Sciences | 40 | 8.0% |
| Engineering | 80 | 15.9% |
| Multidisciplinary Studies | 11 | 2.2% |
| Science & Technology | 75 | 14.9% |
| Business | 83 | 16.5% |
| Education | 58 | 11.5% |
| Literature & Languages | 18 | 3.6% |
| Liberal Arts & History | 20 | 4.0% |
| Visual & Performing Arts | 0 | 0.0% |
| Communications | 0 | 0.0% |
| Arts & Humanities | 58 | 11.5% |
| Total | 503 | 100.0% |
Transportation & Commute in Rogers City
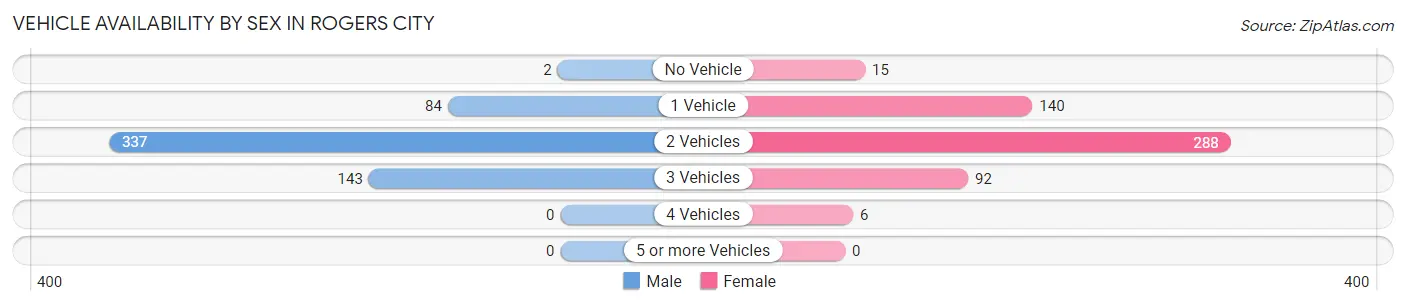
Vehicle Availability by Sex in Rogers City
The most prevalent vehicle ownership categories in Rogers City are males with 2 vehicles (337, accounting for 59.5%) and females with 2 vehicles (288, making up 62.3%).
| Vehicles Available | Male | Female |
| No Vehicle | 2 (0.4%) | 15 (2.8%) |
| 1 Vehicle | 84 (14.8%) | 140 (25.9%) |
| 2 Vehicles | 337 (59.5%) | 288 (53.2%) |
| 3 Vehicles | 143 (25.3%) | 92 (17.0%) |
| 4 Vehicles | 0 (0.0%) | 6 (1.1%) |
| 5 or more Vehicles | 0 (0.0%) | 0 (0.0%) |
| Total | 566 (100.0%) | 541 (100.0%) |
Commute Time in Rogers City
The most frequently occuring commute durations in Rogers City are 5 to 9 minutes (313 commuters, 30.1%), less than 5 minutes (302 commuters, 29.0%), and 45 to 59 minutes (176 commuters, 16.9%).
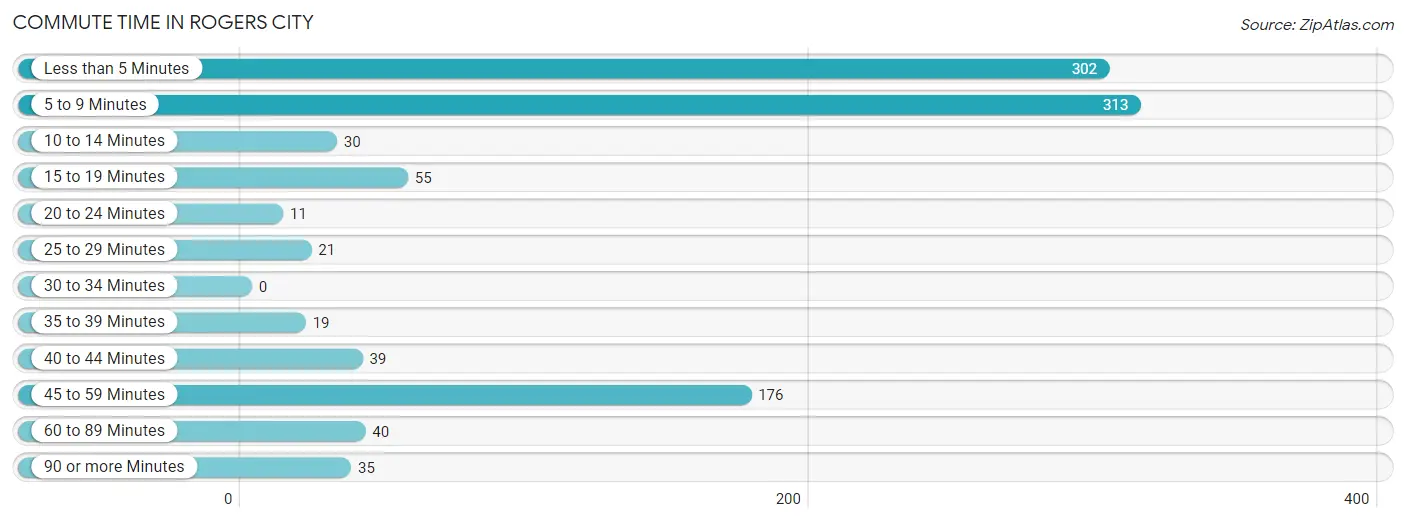
| Commute Time | # Commuters | % Commuters |
| Less than 5 Minutes | 302 | 29.0% |
| 5 to 9 Minutes | 313 | 30.1% |
| 10 to 14 Minutes | 30 | 2.9% |
| 15 to 19 Minutes | 55 | 5.3% |
| 20 to 24 Minutes | 11 | 1.1% |
| 25 to 29 Minutes | 21 | 2.0% |
| 30 to 34 Minutes | 0 | 0.0% |
| 35 to 39 Minutes | 19 | 1.8% |
| 40 to 44 Minutes | 39 | 3.7% |
| 45 to 59 Minutes | 176 | 16.9% |
| 60 to 89 Minutes | 40 | 3.8% |
| 90 or more Minutes | 35 | 3.4% |
Commute Time by Sex in Rogers City
The most common commute times in Rogers City are 5 to 9 minutes (133 commuters, 25.6%) for males and less than 5 minutes (190 commuters, 36.5%) for females.
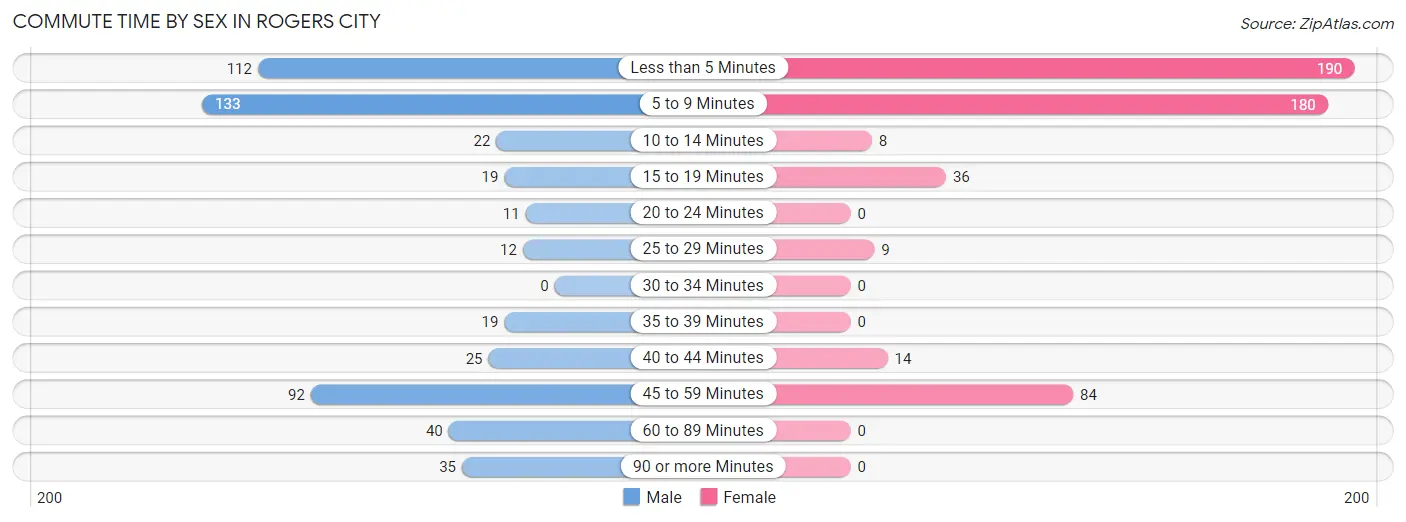
| Commute Time | Male | Female |
| Less than 5 Minutes | 112 (21.5%) | 190 (36.5%) |
| 5 to 9 Minutes | 133 (25.6%) | 180 (34.5%) |
| 10 to 14 Minutes | 22 (4.2%) | 8 (1.5%) |
| 15 to 19 Minutes | 19 (3.6%) | 36 (6.9%) |
| 20 to 24 Minutes | 11 (2.1%) | 0 (0.0%) |
| 25 to 29 Minutes | 12 (2.3%) | 9 (1.7%) |
| 30 to 34 Minutes | 0 (0.0%) | 0 (0.0%) |
| 35 to 39 Minutes | 19 (3.6%) | 0 (0.0%) |
| 40 to 44 Minutes | 25 (4.8%) | 14 (2.7%) |
| 45 to 59 Minutes | 92 (17.7%) | 84 (16.1%) |
| 60 to 89 Minutes | 40 (7.7%) | 0 (0.0%) |
| 90 or more Minutes | 35 (6.7%) | 0 (0.0%) |
Time of Departure to Work by Sex in Rogers City
The most frequent times of departure to work in Rogers City are 6:00 AM to 6:29 AM (113, 21.7%) for males and 7:30 AM to 7:59 AM (180, 34.5%) for females.
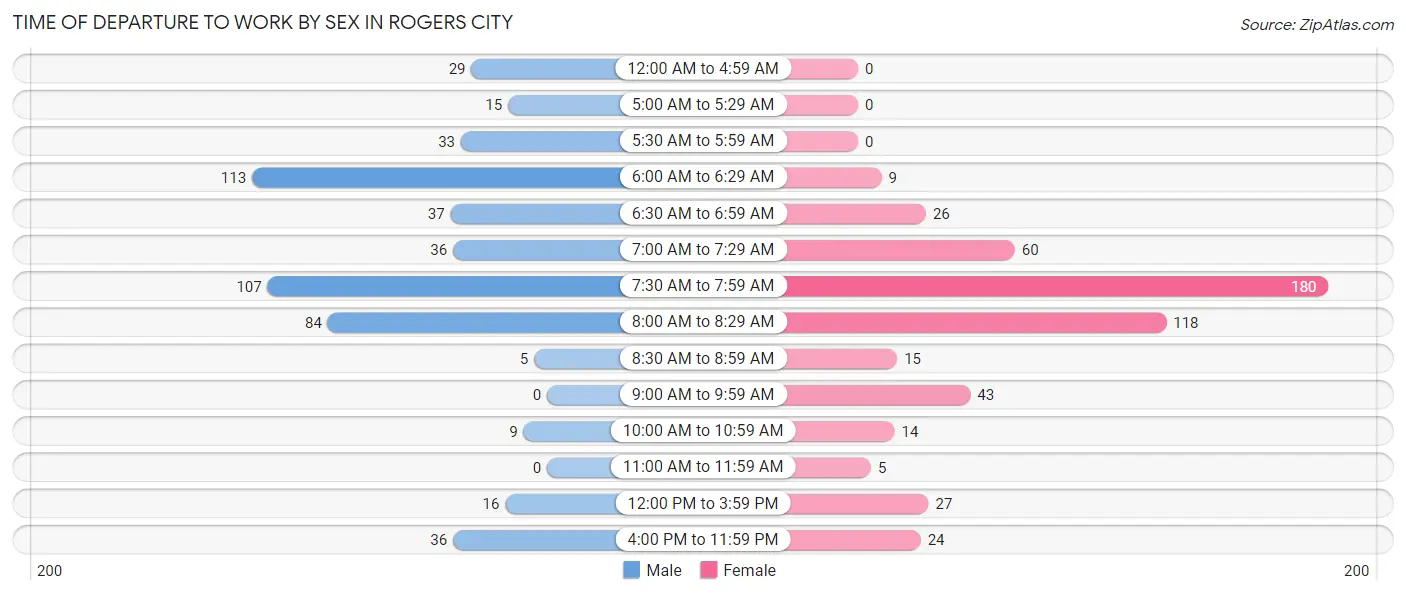
| Time of Departure | Male | Female |
| 12:00 AM to 4:59 AM | 29 (5.6%) | 0 (0.0%) |
| 5:00 AM to 5:29 AM | 15 (2.9%) | 0 (0.0%) |
| 5:30 AM to 5:59 AM | 33 (6.4%) | 0 (0.0%) |
| 6:00 AM to 6:29 AM | 113 (21.7%) | 9 (1.7%) |
| 6:30 AM to 6:59 AM | 37 (7.1%) | 26 (5.0%) |
| 7:00 AM to 7:29 AM | 36 (6.9%) | 60 (11.5%) |
| 7:30 AM to 7:59 AM | 107 (20.6%) | 180 (34.5%) |
| 8:00 AM to 8:29 AM | 84 (16.2%) | 118 (22.7%) |
| 8:30 AM to 8:59 AM | 5 (1.0%) | 15 (2.9%) |
| 9:00 AM to 9:59 AM | 0 (0.0%) | 43 (8.3%) |
| 10:00 AM to 10:59 AM | 9 (1.7%) | 14 (2.7%) |
| 11:00 AM to 11:59 AM | 0 (0.0%) | 5 (1.0%) |
| 12:00 PM to 3:59 PM | 16 (3.1%) | 27 (5.2%) |
| 4:00 PM to 11:59 PM | 36 (6.9%) | 24 (4.6%) |
| Total | 520 (100.0%) | 521 (100.0%) |
Housing Occupancy in Rogers City
Occupancy by Ownership in Rogers City
Of the total 1,348 dwellings in Rogers City, owner-occupied units account for 1,111 (82.4%), while renter-occupied units make up 237 (17.6%).
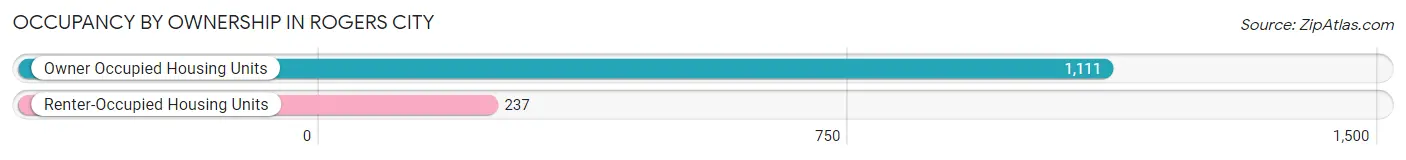
| Occupancy | # Housing Units | % Housing Units |
| Owner Occupied Housing Units | 1,111 | 82.4% |
| Renter-Occupied Housing Units | 237 | 17.6% |
| Total Occupied Housing Units | 1,348 | 100.0% |
Occupancy by Household Size in Rogers City
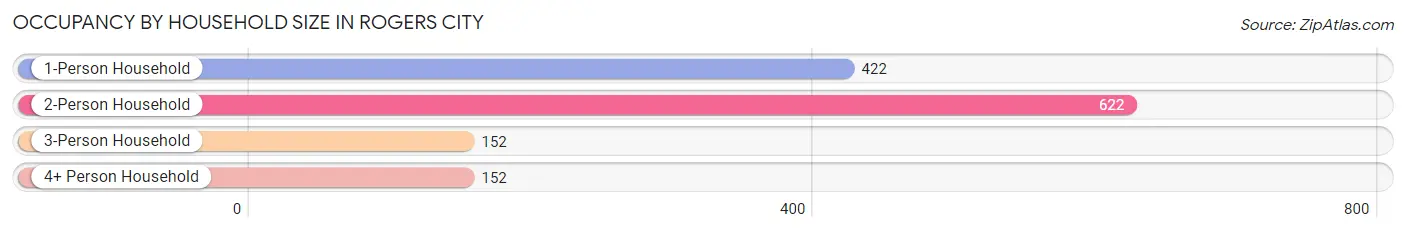
| Household Size | # Housing Units | % Housing Units |
| 1-Person Household | 422 | 31.3% |
| 2-Person Household | 622 | 46.1% |
| 3-Person Household | 152 | 11.3% |
| 4+ Person Household | 152 | 11.3% |
| Total Housing Units | 1,348 | 100.0% |
Occupancy by Ownership by Household Size in Rogers City
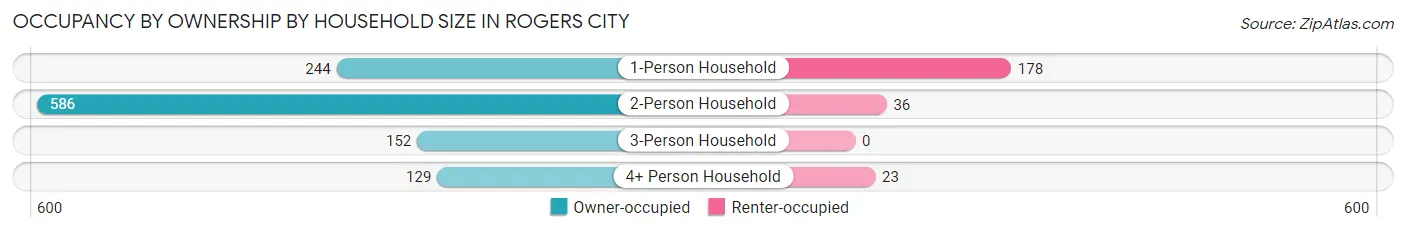
| Household Size | Owner-occupied | Renter-occupied |
| 1-Person Household | 244 (57.8%) | 178 (42.2%) |
| 2-Person Household | 586 (94.2%) | 36 (5.8%) |
| 3-Person Household | 152 (100.0%) | 0 (0.0%) |
| 4+ Person Household | 129 (84.9%) | 23 (15.1%) |
| Total Housing Units | 1,111 (82.4%) | 237 (17.6%) |
Occupancy by Educational Attainment in Rogers City
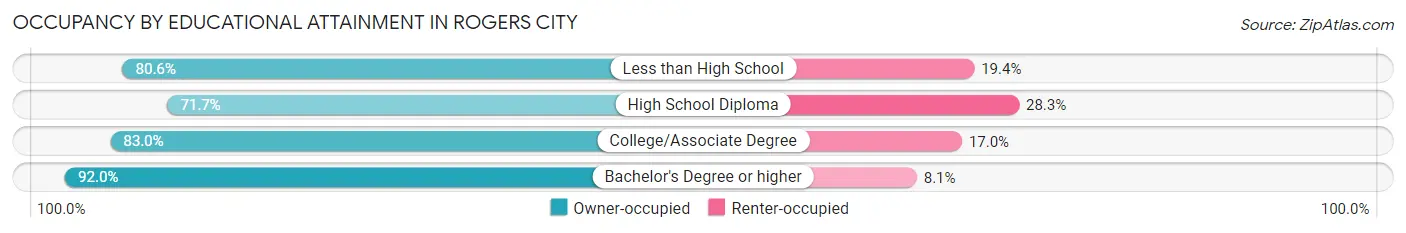
| Household Size | Owner-occupied | Renter-occupied |
| Less than High School | 116 (80.6%) | 28 (19.4%) |
| High School Diploma | 210 (71.7%) | 83 (28.3%) |
| College/Associate Degree | 488 (83.0%) | 100 (17.0%) |
| Bachelor's Degree or higher | 297 (91.9%) | 26 (8.1%) |
Occupancy by Age of Householder in Rogers City
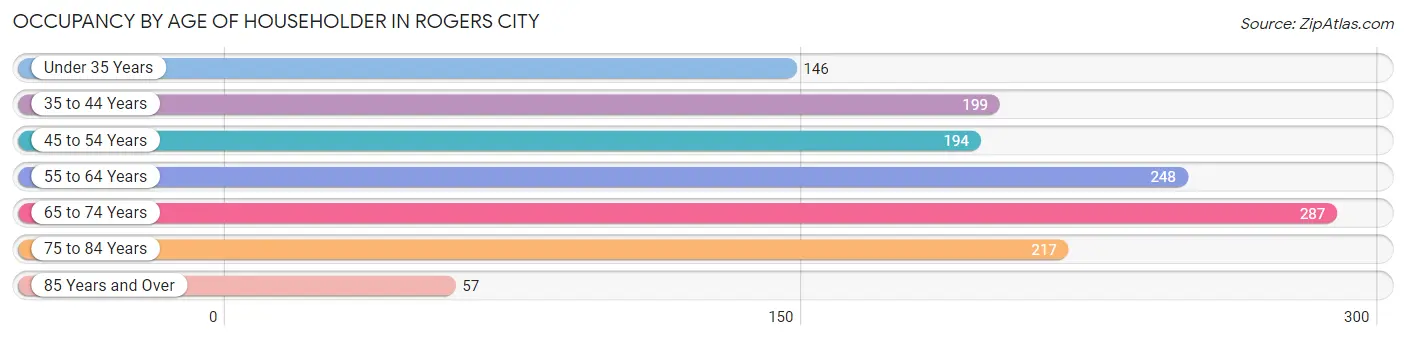
| Age Bracket | # Households | % Households |
| Under 35 Years | 146 | 10.8% |
| 35 to 44 Years | 199 | 14.8% |
| 45 to 54 Years | 194 | 14.4% |
| 55 to 64 Years | 248 | 18.4% |
| 65 to 74 Years | 287 | 21.3% |
| 75 to 84 Years | 217 | 16.1% |
| 85 Years and Over | 57 | 4.2% |
| Total | 1,348 | 100.0% |
Housing Finances in Rogers City
Median Income by Occupancy in Rogers City
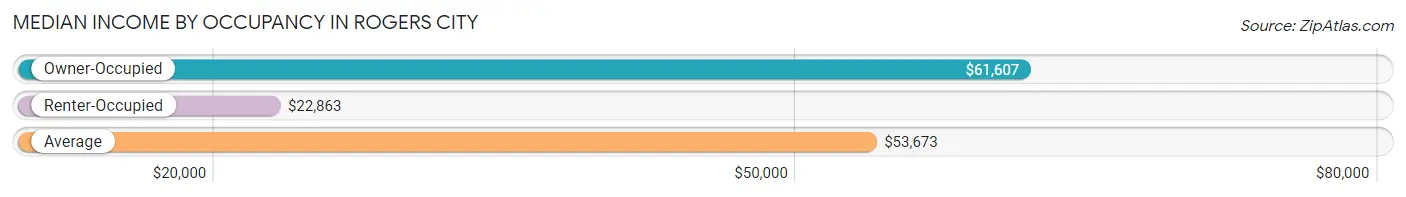
| Occupancy Type | # Households | Median Income |
| Owner-Occupied | 1,111 (82.4%) | $61,607 |
| Renter-Occupied | 237 (17.6%) | $22,863 |
| Average | 1,348 (100.0%) | $53,673 |
Occupancy by Householder Income Bracket in Rogers City
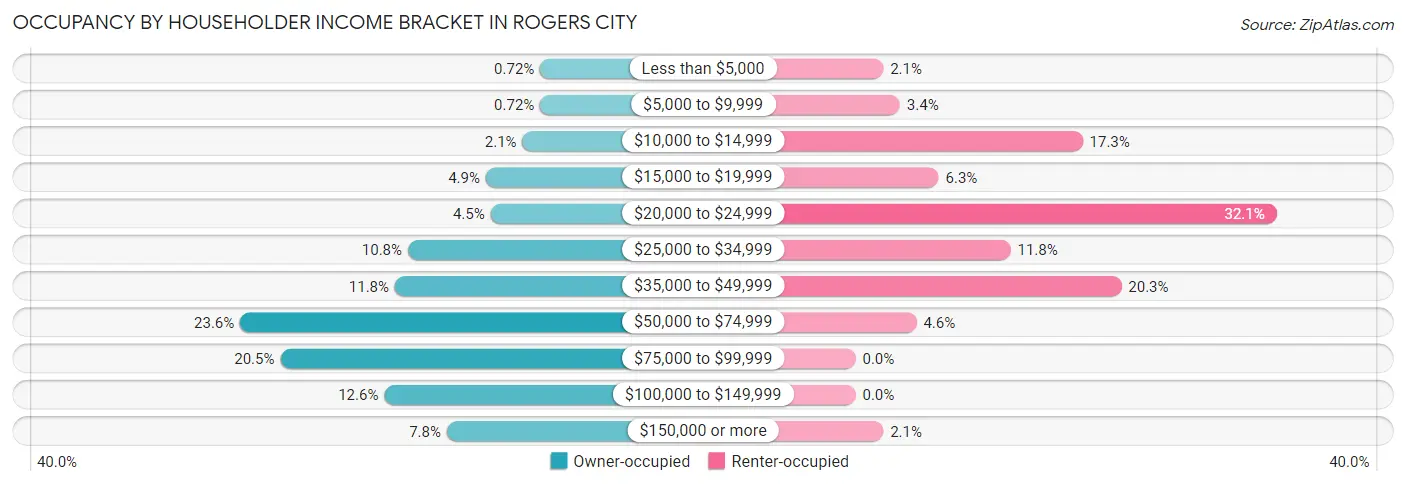
| Income Bracket | Owner-occupied | Renter-occupied |
| Less than $5,000 | 8 (0.7%) | 5 (2.1%) |
| $5,000 to $9,999 | 8 (0.7%) | 8 (3.4%) |
| $10,000 to $14,999 | 23 (2.1%) | 41 (17.3%) |
| $15,000 to $19,999 | 54 (4.9%) | 15 (6.3%) |
| $20,000 to $24,999 | 50 (4.5%) | 76 (32.1%) |
| $25,000 to $34,999 | 120 (10.8%) | 28 (11.8%) |
| $35,000 to $49,999 | 131 (11.8%) | 48 (20.3%) |
| $50,000 to $74,999 | 262 (23.6%) | 11 (4.6%) |
| $75,000 to $99,999 | 228 (20.5%) | 0 (0.0%) |
| $100,000 to $149,999 | 140 (12.6%) | 0 (0.0%) |
| $150,000 or more | 87 (7.8%) | 5 (2.1%) |
| Total | 1,111 (100.0%) | 237 (100.0%) |
Monthly Housing Cost Tiers in Rogers City
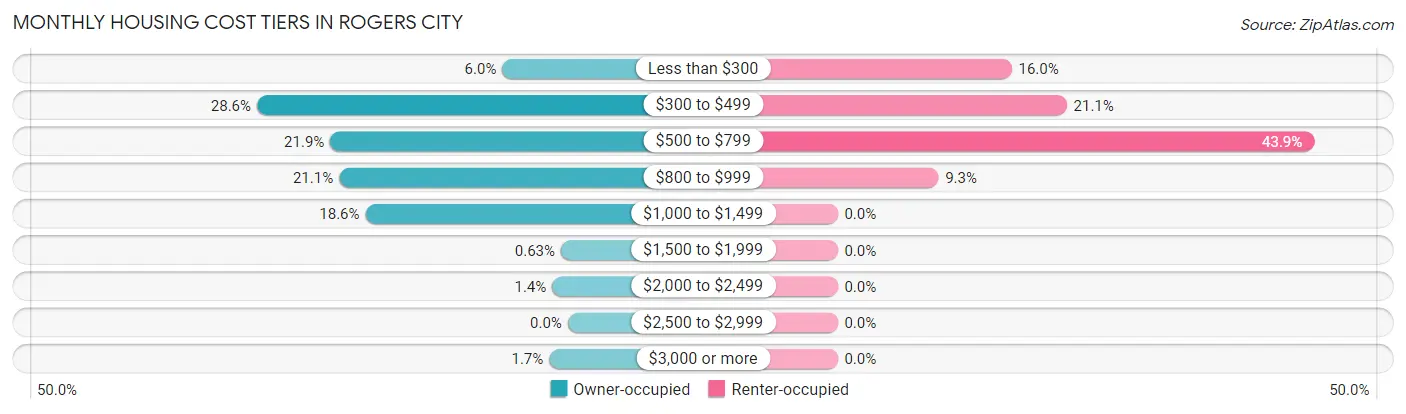
| Monthly Cost | Owner-occupied | Renter-occupied |
| Less than $300 | 67 (6.0%) | 38 (16.0%) |
| $300 to $499 | 318 (28.6%) | 50 (21.1%) |
| $500 to $799 | 243 (21.9%) | 104 (43.9%) |
| $800 to $999 | 234 (21.1%) | 22 (9.3%) |
| $1,000 to $1,499 | 207 (18.6%) | 0 (0.0%) |
| $1,500 to $1,999 | 7 (0.6%) | 0 (0.0%) |
| $2,000 to $2,499 | 16 (1.4%) | 0 (0.0%) |
| $2,500 to $2,999 | 0 (0.0%) | 0 (0.0%) |
| $3,000 or more | 19 (1.7%) | 0 (0.0%) |
| Total | 1,111 (100.0%) | 237 (100.0%) |
Physical Housing Characteristics in Rogers City
Housing Structures in Rogers City
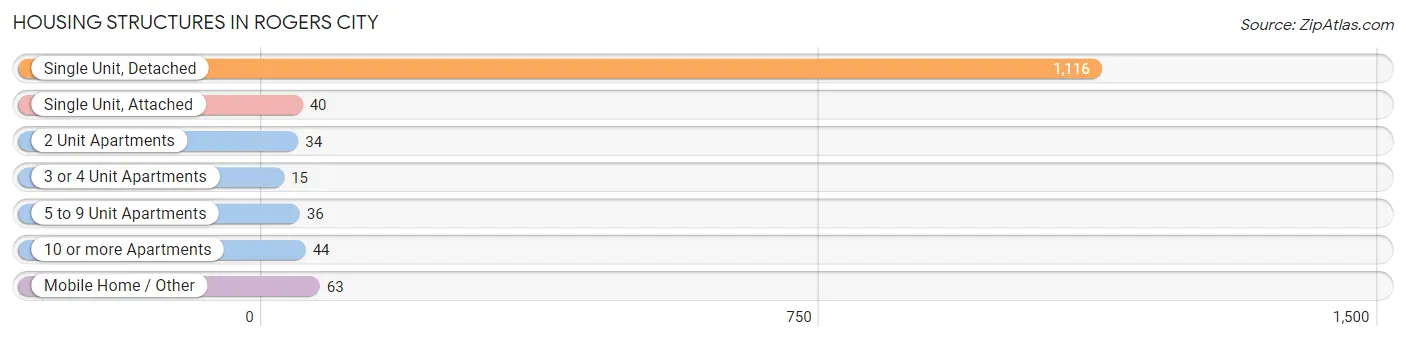
| Structure Type | # Housing Units | % Housing Units |
| Single Unit, Detached | 1,116 | 82.8% |
| Single Unit, Attached | 40 | 3.0% |
| 2 Unit Apartments | 34 | 2.5% |
| 3 or 4 Unit Apartments | 15 | 1.1% |
| 5 to 9 Unit Apartments | 36 | 2.7% |
| 10 or more Apartments | 44 | 3.3% |
| Mobile Home / Other | 63 | 4.7% |
| Total | 1,348 | 100.0% |
Housing Structures by Occupancy in Rogers City
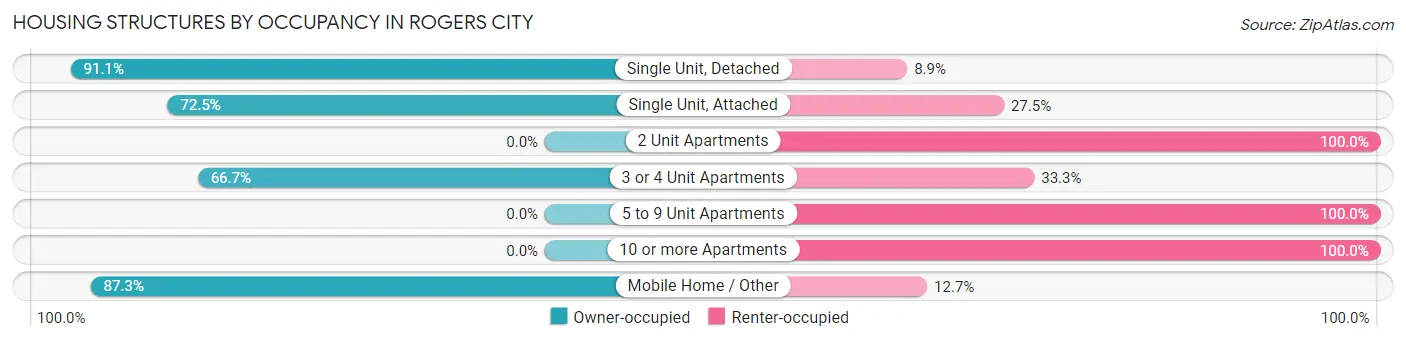
| Structure Type | Owner-occupied | Renter-occupied |
| Single Unit, Detached | 1,017 (91.1%) | 99 (8.9%) |
| Single Unit, Attached | 29 (72.5%) | 11 (27.5%) |
| 2 Unit Apartments | 0 (0.0%) | 34 (100.0%) |
| 3 or 4 Unit Apartments | 10 (66.7%) | 5 (33.3%) |
| 5 to 9 Unit Apartments | 0 (0.0%) | 36 (100.0%) |
| 10 or more Apartments | 0 (0.0%) | 44 (100.0%) |
| Mobile Home / Other | 55 (87.3%) | 8 (12.7%) |
| Total | 1,111 (82.4%) | 237 (17.6%) |
Housing Structures by Number of Rooms in Rogers City
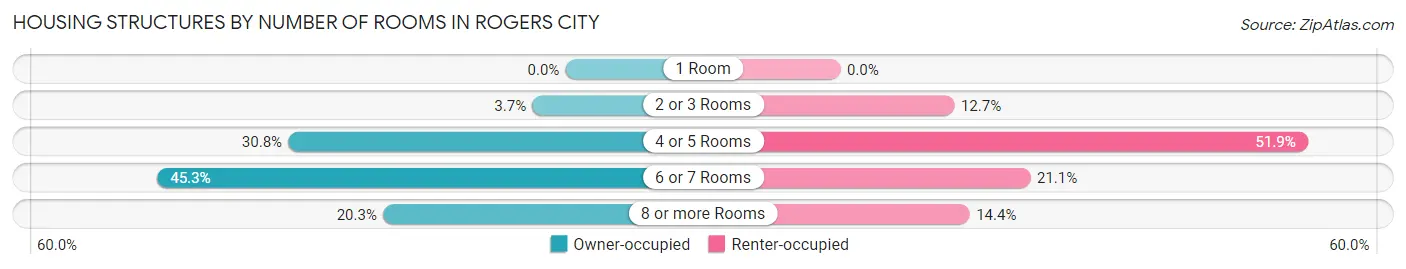
| Number of Rooms | Owner-occupied | Renter-occupied |
| 1 Room | 0 (0.0%) | 0 (0.0%) |
| 2 or 3 Rooms | 41 (3.7%) | 30 (12.7%) |
| 4 or 5 Rooms | 342 (30.8%) | 123 (51.9%) |
| 6 or 7 Rooms | 503 (45.3%) | 50 (21.1%) |
| 8 or more Rooms | 225 (20.3%) | 34 (14.3%) |
| Total | 1,111 (100.0%) | 237 (100.0%) |
Housing Structure by Heating Type in Rogers City
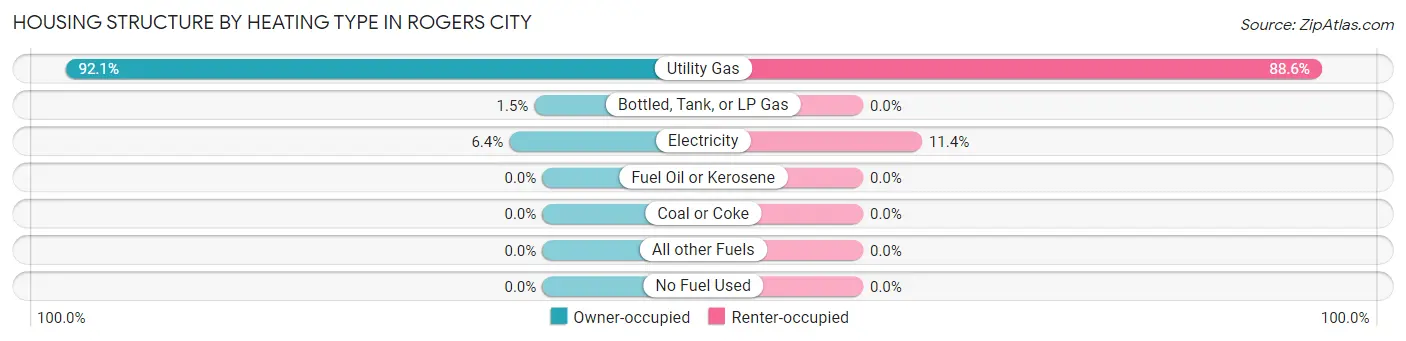
| Heating Type | Owner-occupied | Renter-occupied |
| Utility Gas | 1,023 (92.1%) | 210 (88.6%) |
| Bottled, Tank, or LP Gas | 17 (1.5%) | 0 (0.0%) |
| Electricity | 71 (6.4%) | 27 (11.4%) |
| Fuel Oil or Kerosene | 0 (0.0%) | 0 (0.0%) |
| Coal or Coke | 0 (0.0%) | 0 (0.0%) |
| All other Fuels | 0 (0.0%) | 0 (0.0%) |
| No Fuel Used | 0 (0.0%) | 0 (0.0%) |
| Total | 1,111 (100.0%) | 237 (100.0%) |
Household Vehicle Usage in Rogers City
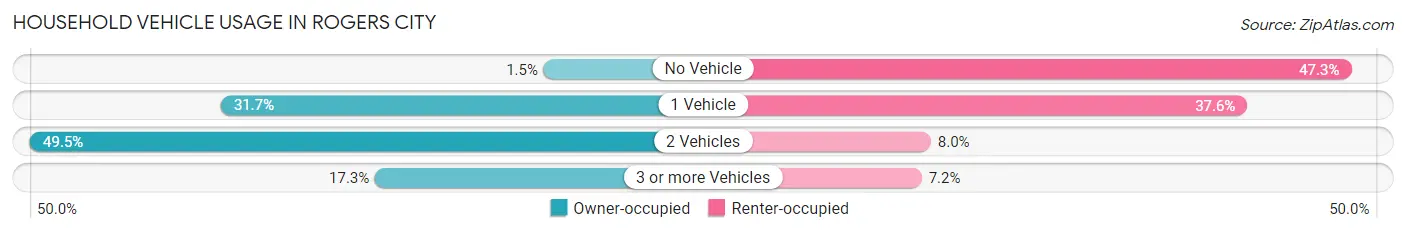
| Vehicles per Household | Owner-occupied | Renter-occupied |
| No Vehicle | 17 (1.5%) | 112 (47.3%) |
| 1 Vehicle | 352 (31.7%) | 89 (37.6%) |
| 2 Vehicles | 550 (49.5%) | 19 (8.0%) |
| 3 or more Vehicles | 192 (17.3%) | 17 (7.2%) |
| Total | 1,111 (100.0%) | 237 (100.0%) |
Real Estate & Mortgages in Rogers City
Real Estate and Mortgage Overview in Rogers City
| Characteristic | Without Mortgage | With Mortgage |
| Housing Units | 509 | 602 |
| Median Property Value | $98,900 | $100,900 |
| Median Household Income | $54,816 | $63 |
| Monthly Housing Costs | $412 | $19 |
| Real Estate Taxes | $1,397 | $15 |
Property Value by Mortgage Status in Rogers City
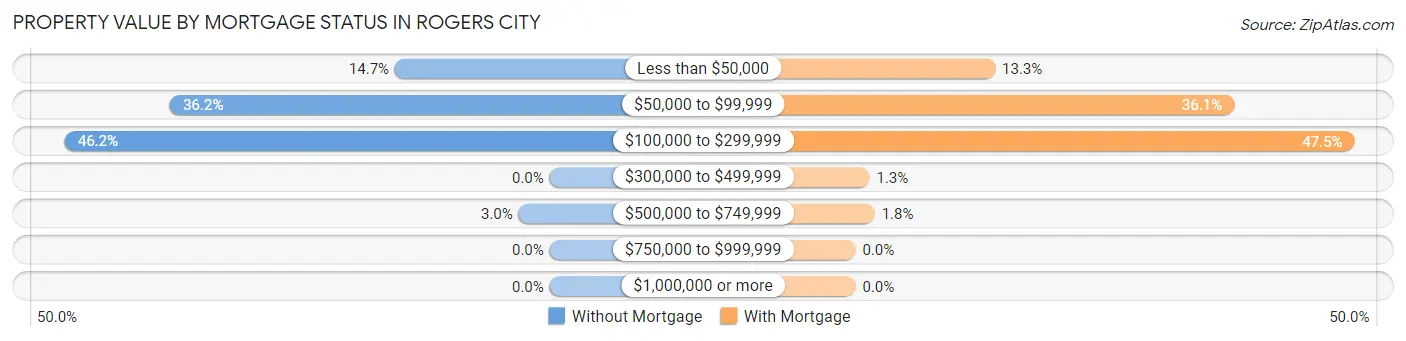
| Property Value | Without Mortgage | With Mortgage |
| Less than $50,000 | 75 (14.7%) | 80 (13.3%) |
| $50,000 to $99,999 | 184 (36.1%) | 217 (36.0%) |
| $100,000 to $299,999 | 235 (46.2%) | 286 (47.5%) |
| $300,000 to $499,999 | 0 (0.0%) | 8 (1.3%) |
| $500,000 to $749,999 | 15 (2.9%) | 11 (1.8%) |
| $750,000 to $999,999 | 0 (0.0%) | 0 (0.0%) |
| $1,000,000 or more | 0 (0.0%) | 0 (0.0%) |
| Total | 509 (100.0%) | 602 (100.0%) |
Household Income by Mortgage Status in Rogers City
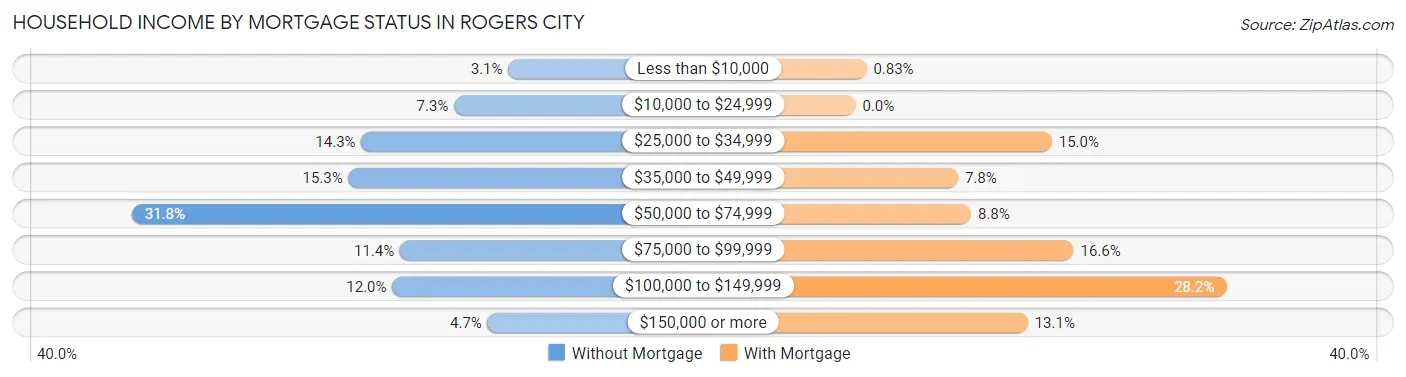
| Household Income | Without Mortgage | With Mortgage |
| Less than $10,000 | 16 (3.1%) | 5 (0.8%) |
| $10,000 to $24,999 | 37 (7.3%) | 0 (0.0%) |
| $25,000 to $34,999 | 73 (14.3%) | 90 (14.9%) |
| $35,000 to $49,999 | 78 (15.3%) | 47 (7.8%) |
| $50,000 to $74,999 | 162 (31.8%) | 53 (8.8%) |
| $75,000 to $99,999 | 58 (11.4%) | 100 (16.6%) |
| $100,000 to $149,999 | 61 (12.0%) | 170 (28.2%) |
| $150,000 or more | 24 (4.7%) | 79 (13.1%) |
| Total | 509 (100.0%) | 602 (100.0%) |
Property Value to Household Income Ratio in Rogers City
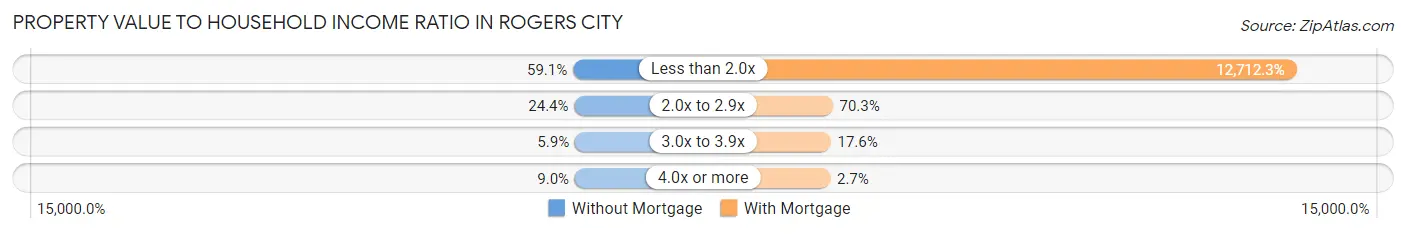
| Value-to-Income Ratio | Without Mortgage | With Mortgage |
| Less than 2.0x | 301 (59.1%) | 76,528 (12,712.3%) |
| 2.0x to 2.9x | 124 (24.4%) | 423 (70.3%) |
| 3.0x to 3.9x | 30 (5.9%) | 106 (17.6%) |
| 4.0x or more | 46 (9.0%) | 16 (2.7%) |
| Total | 509 (100.0%) | 602 (100.0%) |
Real Estate Taxes by Mortgage Status in Rogers City
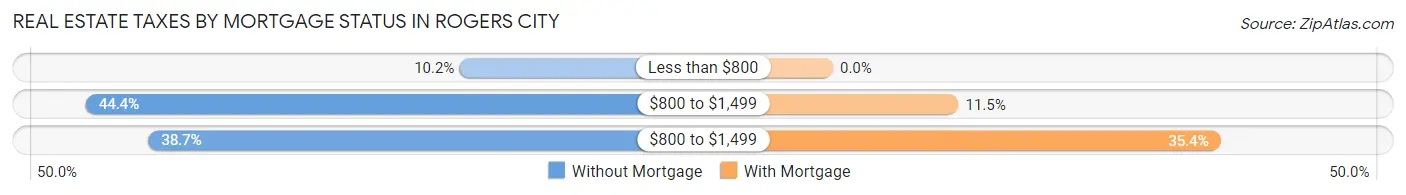
| Property Taxes | Without Mortgage | With Mortgage |
| Less than $800 | 52 (10.2%) | 0 (0.0%) |
| $800 to $1,499 | 226 (44.4%) | 69 (11.5%) |
| $800 to $1,499 | 197 (38.7%) | 213 (35.4%) |
| Total | 509 (100.0%) | 602 (100.0%) |
Health & Disability in Rogers City
Health Insurance Coverage by Age in Rogers City
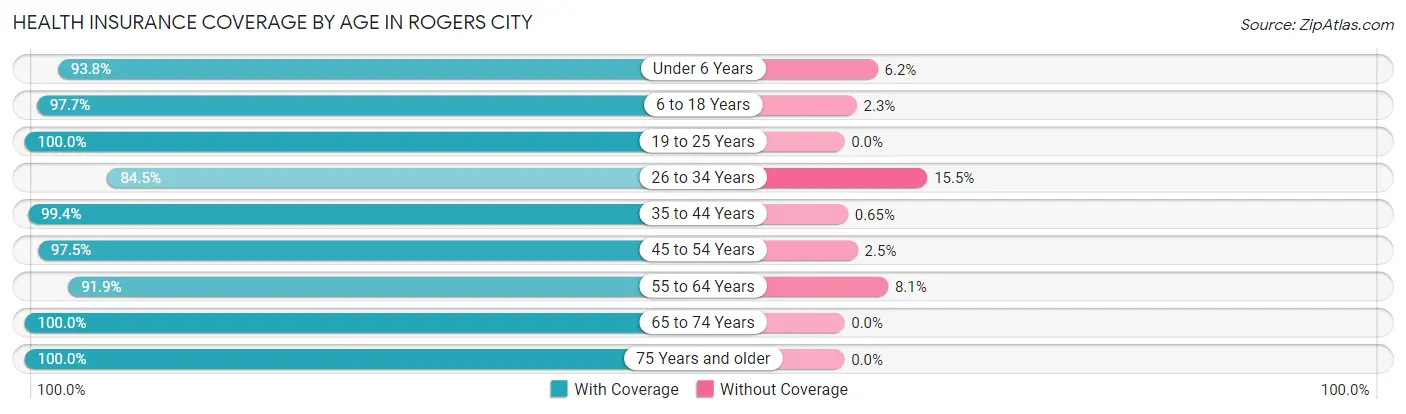
| Age Bracket | With Coverage | Without Coverage |
| Under 6 Years | 166 (93.8%) | 11 (6.2%) |
| 6 to 18 Years | 299 (97.7%) | 7 (2.3%) |
| 19 to 25 Years | 90 (100.0%) | 0 (0.0%) |
| 26 to 34 Years | 246 (84.5%) | 45 (15.5%) |
| 35 to 44 Years | 308 (99.4%) | 2 (0.6%) |
| 45 to 54 Years | 313 (97.5%) | 8 (2.5%) |
| 55 to 64 Years | 395 (91.9%) | 35 (8.1%) |
| 65 to 74 Years | 455 (100.0%) | 0 (0.0%) |
| 75 Years and older | 394 (100.0%) | 0 (0.0%) |
| Total | 2,666 (96.1%) | 108 (3.9%) |
Health Insurance Coverage by Citizenship Status in Rogers City
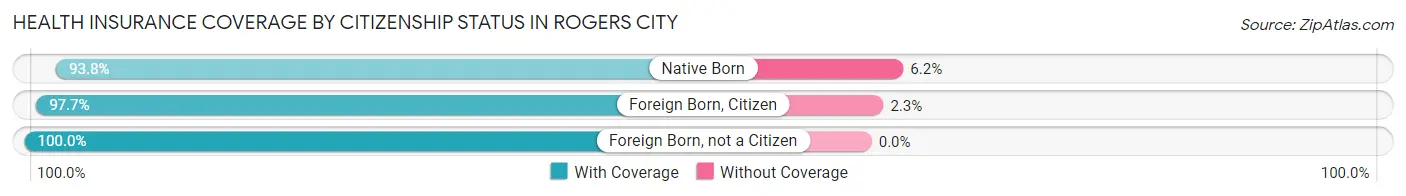
| Citizenship Status | With Coverage | Without Coverage |
| Native Born | 166 (93.8%) | 11 (6.2%) |
| Foreign Born, Citizen | 299 (97.7%) | 7 (2.3%) |
| Foreign Born, not a Citizen | 90 (100.0%) | 0 (0.0%) |
Health Insurance Coverage by Household Income in Rogers City
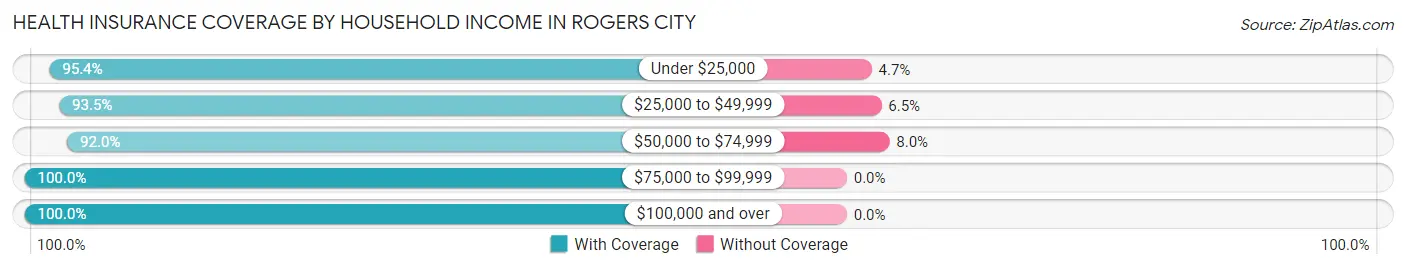
| Household Income | With Coverage | Without Coverage |
| Under $25,000 | 451 (95.4%) | 22 (4.6%) |
| $25,000 to $49,999 | 534 (93.5%) | 37 (6.5%) |
| $50,000 to $74,999 | 566 (92.0%) | 49 (8.0%) |
| $75,000 to $99,999 | 496 (100.0%) | 0 (0.0%) |
| $100,000 and over | 614 (100.0%) | 0 (0.0%) |
Public vs Private Health Insurance Coverage by Age in Rogers City
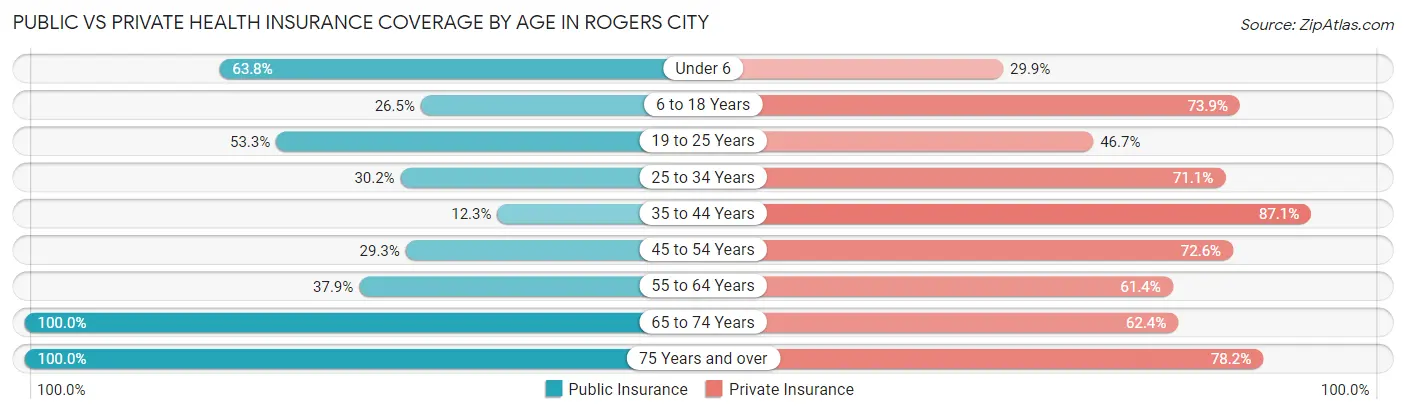
| Age Bracket | Public Insurance | Private Insurance |
| Under 6 | 113 (63.8%) | 53 (29.9%) |
| 6 to 18 Years | 81 (26.5%) | 226 (73.9%) |
| 19 to 25 Years | 48 (53.3%) | 42 (46.7%) |
| 25 to 34 Years | 88 (30.2%) | 207 (71.1%) |
| 35 to 44 Years | 38 (12.3%) | 270 (87.1%) |
| 45 to 54 Years | 94 (29.3%) | 233 (72.6%) |
| 55 to 64 Years | 163 (37.9%) | 264 (61.4%) |
| 65 to 74 Years | 455 (100.0%) | 284 (62.4%) |
| 75 Years and over | 394 (100.0%) | 308 (78.2%) |
| Total | 1,474 (53.1%) | 1,887 (68.0%) |
Disability Status by Sex by Age in Rogers City
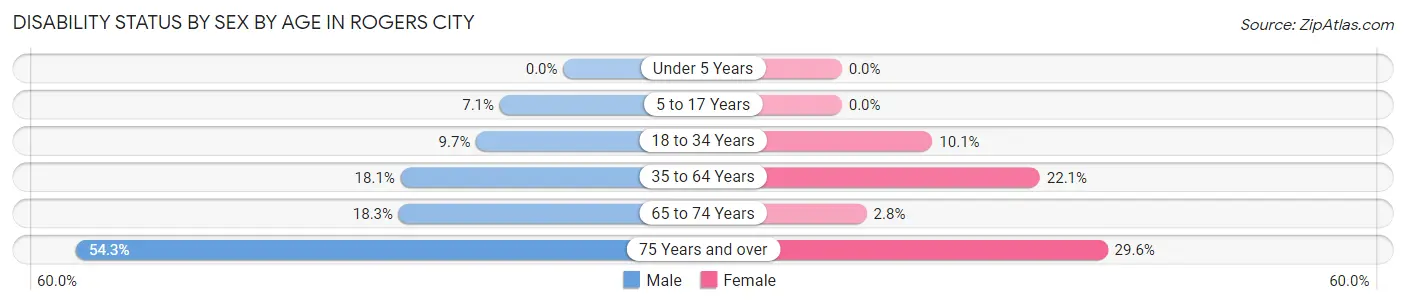
| Age Bracket | Male | Female |
| Under 5 Years | 0 (0.0%) | 0 (0.0%) |
| 5 to 17 Years | 13 (7.1%) | 0 (0.0%) |
| 18 to 34 Years | 16 (9.7%) | 23 (10.1%) |
| 35 to 64 Years | 83 (18.1%) | 133 (22.1%) |
| 65 to 74 Years | 37 (18.3%) | 7 (2.8%) |
| 75 Years and over | 102 (54.3%) | 61 (29.6%) |
Disability Class by Sex by Age in Rogers City
Disability Class: Hearing Difficulty
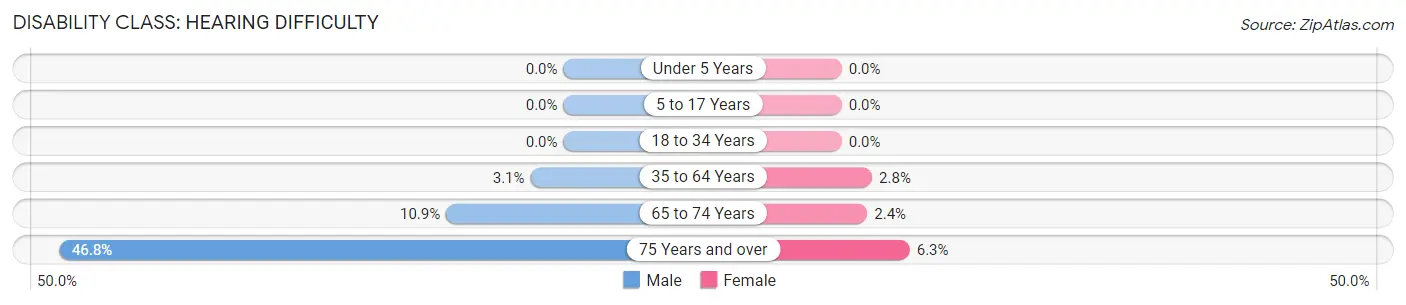
| Age Bracket | Male | Female |
| Under 5 Years | 0 (0.0%) | 0 (0.0%) |
| 5 to 17 Years | 0 (0.0%) | 0 (0.0%) |
| 18 to 34 Years | 0 (0.0%) | 0 (0.0%) |
| 35 to 64 Years | 14 (3.1%) | 17 (2.8%) |
| 65 to 74 Years | 22 (10.9%) | 6 (2.4%) |
| 75 Years and over | 88 (46.8%) | 13 (6.3%) |
Disability Class: Vision Difficulty
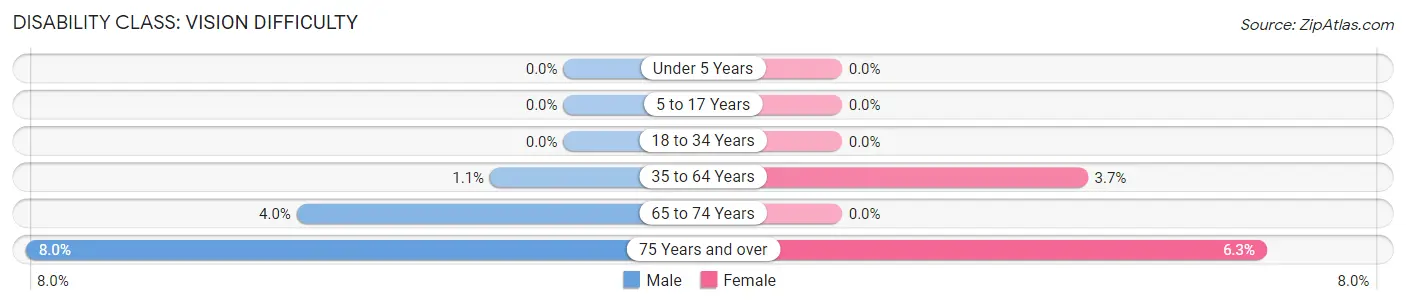
| Age Bracket | Male | Female |
| Under 5 Years | 0 (0.0%) | 0 (0.0%) |
| 5 to 17 Years | 0 (0.0%) | 0 (0.0%) |
| 18 to 34 Years | 0 (0.0%) | 0 (0.0%) |
| 35 to 64 Years | 5 (1.1%) | 22 (3.6%) |
| 65 to 74 Years | 8 (4.0%) | 0 (0.0%) |
| 75 Years and over | 15 (8.0%) | 13 (6.3%) |
Disability Class: Cognitive Difficulty
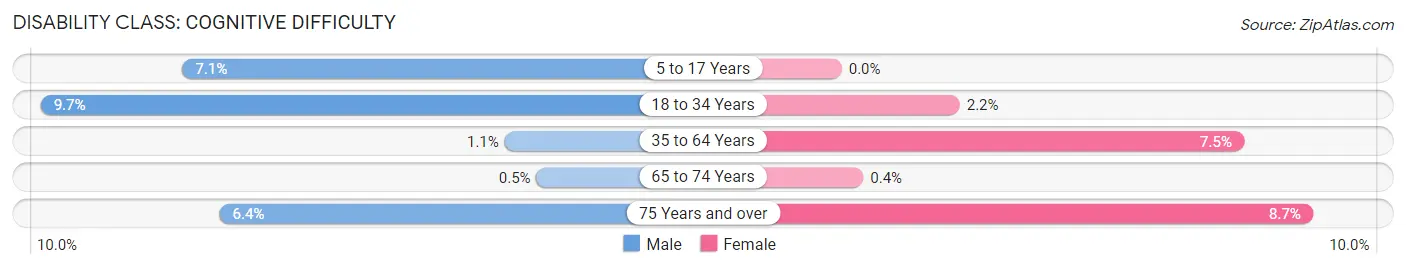
| Age Bracket | Male | Female |
| 5 to 17 Years | 13 (7.1%) | 0 (0.0%) |
| 18 to 34 Years | 16 (9.7%) | 5 (2.2%) |
| 35 to 64 Years | 5 (1.1%) | 45 (7.5%) |
| 65 to 74 Years | 1 (0.5%) | 1 (0.4%) |
| 75 Years and over | 12 (6.4%) | 18 (8.7%) |
Disability Class: Ambulatory Difficulty
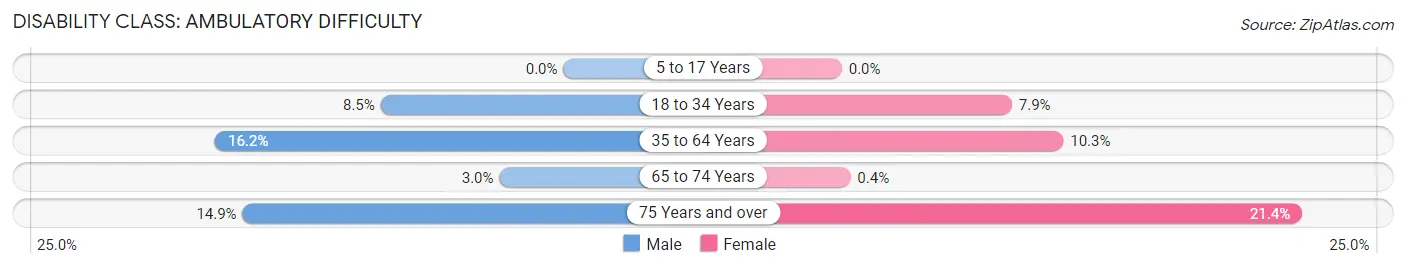
| Age Bracket | Male | Female |
| 5 to 17 Years | 0 (0.0%) | 0 (0.0%) |
| 18 to 34 Years | 14 (8.5%) | 18 (7.9%) |
| 35 to 64 Years | 74 (16.2%) | 62 (10.3%) |
| 65 to 74 Years | 6 (3.0%) | 1 (0.4%) |
| 75 Years and over | 28 (14.9%) | 44 (21.4%) |
Disability Class: Self-Care Difficulty
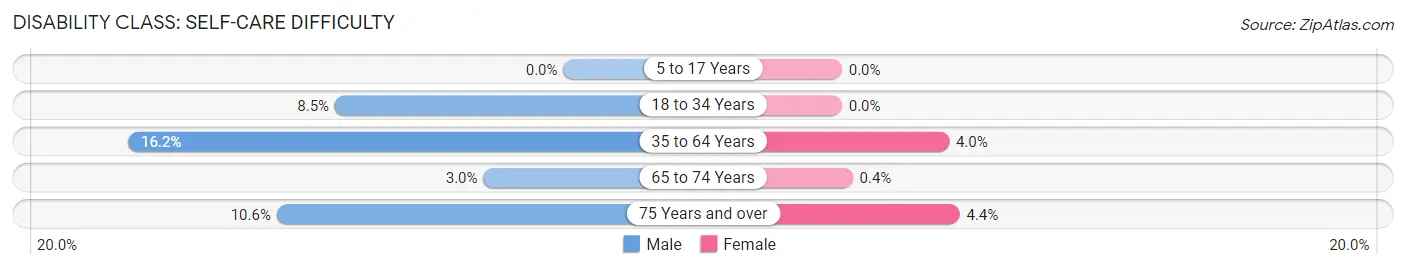
| Age Bracket | Male | Female |
| 5 to 17 Years | 0 (0.0%) | 0 (0.0%) |
| 18 to 34 Years | 14 (8.5%) | 0 (0.0%) |
| 35 to 64 Years | 74 (16.2%) | 24 (4.0%) |
| 65 to 74 Years | 6 (3.0%) | 1 (0.4%) |
| 75 Years and over | 20 (10.6%) | 9 (4.4%) |
Technology Access in Rogers City
Computing Device Access in Rogers City
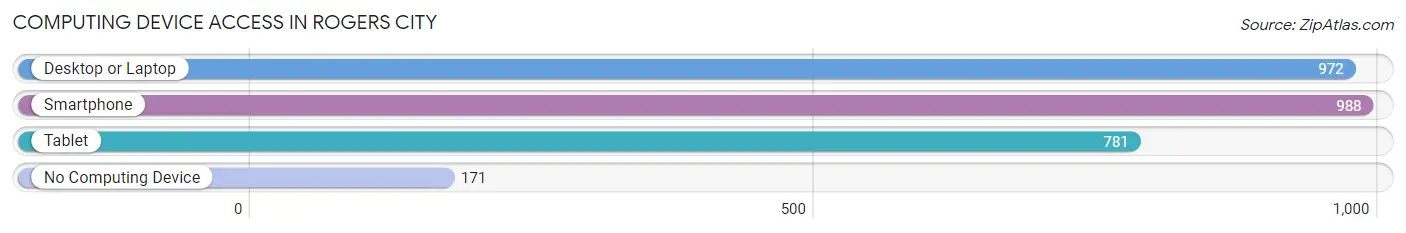
| Device Type | # Households | % Households |
| Desktop or Laptop | 972 | 72.1% |
| Smartphone | 988 | 73.3% |
| Tablet | 781 | 57.9% |
| No Computing Device | 171 | 12.7% |
| Total | 1,348 | 100.0% |
Internet Access in Rogers City
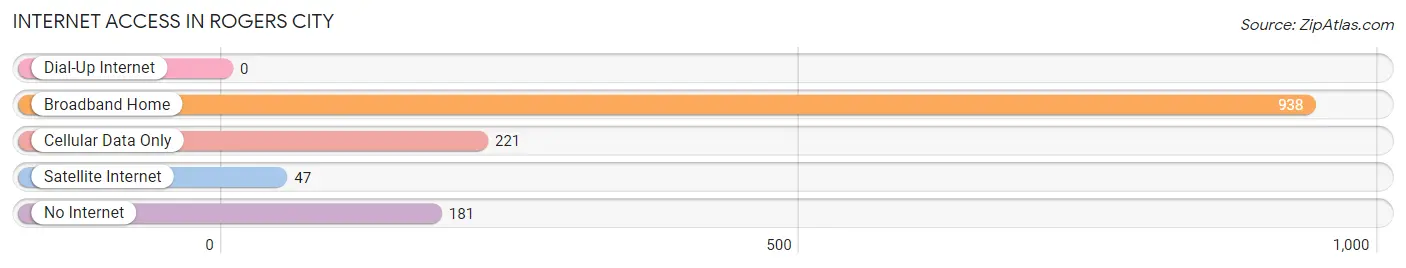
| Internet Type | # Households | % Households |
| Dial-Up Internet | 0 | 0.0% |
| Broadband Home | 938 | 69.6% |
| Cellular Data Only | 221 | 16.4% |
| Satellite Internet | 47 | 3.5% |
| No Internet | 181 | 13.4% |
| Total | 1,348 | 100.0% |
Rogers City Summary
Rogers City is a city located in the state of Michigan in the United States. It is the county seat of Presque Isle County and is located on the shores of Lake Huron. The city has a population of 2,827 as of the 2010 census.
History
The area that is now Rogers City was first settled in 1868 by William Rogers, who established a lumber mill and a dock. The city was incorporated in 1881 and was named after William Rogers. The city grew rapidly due to its location on Lake Huron and its proximity to the lumber industry. By the early 1900s, the city had become a major port for the Great Lakes shipping industry.
In the 1920s, the city began to diversify its economy by establishing a limestone quarry and a cement plant. The limestone quarry and cement plant were the first of their kind in the United States and provided employment for many of the city’s residents. The city also became a major tourist destination due to its location on Lake Huron and its proximity to the Mackinac Bridge.
Geography
Rogers City is located in the northern part of Michigan’s Lower Peninsula, on the shores of Lake Huron. The city is situated on the Presque Isle River, which flows into Lake Huron. The city is surrounded by forests and lakes, and is located approximately 30 miles east of the Mackinac Bridge.
The city has a total area of 4.2 square miles, of which 4.1 square miles is land and 0.1 square miles is water. The city has a humid continental climate, with cold winters and warm summers.
Economy
The economy of Rogers City is largely based on tourism, manufacturing, and shipping. The city is home to a number of tourist attractions, including the Great Lakes Maritime Heritage Center, the Rogers City Marina, and the Presque Isle Lighthouse. The city is also home to a number of manufacturing companies, including the limestone quarry and cement plant.
The city is also a major port for the Great Lakes shipping industry. The city is home to a number of shipping companies, including the Great Lakes Towing Company and the Great Lakes Shipping Company. The city is also home to a number of marinas, which provide services to recreational boaters.
Demographics
As of the 2010 census, the population of Rogers City was 2,827. The racial makeup of the city was 97.2% White, 0.7% African American, 0.3% Native American, 0.2% Asian, 0.1% Pacific Islander, 0.3% from other races, and 1.3% from two or more races. Hispanic or Latino of any race were 1.3% of the population.
The median income for a household in the city was $37,917, and the median income for a family was $45,938. The per capita income for the city was $19,945. About 11.2% of families and 14.2% of the population were below the poverty line, including 19.2% of those under age 18 and 8.2% of those age 65 or over.
Common Questions
What is the Total Population of Rogers City?
Total Population of Rogers City is 2,866.
What is the Total Male Population of Rogers City?
Total Male Population of Rogers City is 1,294.
What is the Total Female Population of Rogers City?
Total Female Population of Rogers City is 1,572.
What is the Ratio of Males per 100 Females in Rogers City?
There are 82.32 Males per 100 Females in Rogers City.
What is the Ratio of Females per 100 Males in Rogers City?
There are 121.48 Females per 100 Males in Rogers City.
What is the Median Population Age in Rogers City?
Median Population Age in Rogers City is 52.9 Years.
What is the Average Family Size in Rogers City
Average Family Size in Rogers City is 2.5 People.
What is the Average Household Size in Rogers City
Average Household Size in Rogers City is 2.0 People.
What is Per Capita Income in Rogers City?
Per Capita income in Rogers City is $31,202.
What is the Median Family Income in Rogers City?
Median Family Income in Rogers City is $68,607.
What is the Median Household income in Rogers City?
Median Household Income in Rogers City is $53,673.
What is Income or Wage Gap in Rogers City?
Income or Wage Gap in Rogers City is 23.0%.
Women in Rogers City earn 77.0 cents for every dollar earned by a man.
What is Inequality or Gini Index in Rogers City?
Inequality or Gini Index in Rogers City is 0.39.
How Large is the Labor Force in Rogers City?
There are 1,156 People in the Labor Forcein in Rogers City.
What is the Percentage of People in the Labor Force in Rogers City?
47.5% of People are in the Labor Force in Rogers City.
What is the Unemployment Rate in Rogers City?
Unemployment Rate in Rogers City is 3.2%.