Au Gres, MI
Au Gres Map
Au Gres Overview
930
TOTAL POPULATION
483
MALE POPULATION
447
FEMALE POPULATION
108.05
MALES / 100 FEMALES
92.55
FEMALES / 100 MALES
55.7
MEDIAN AGE
2.8
AVG FAMILY SIZE
2.0
AVG HOUSEHOLD SIZE
$30,352
PER CAPITA INCOME
$64,327
AVG FAMILY INCOME
$55,313
AVG HOUSEHOLD INCOME
61.5%
WAGE / INCOME GAP [ % ]
38.5¢/ $1
WAGE / INCOME GAP [ $ ]
0.40
INEQUALITY / GINI INDEX
373
LABOR FORCE [ PEOPLE ]
45.6%
PERCENT IN LABOR FORCE
21.7%
UNEMPLOYMENT RATE
Au Gres Zip Codes
Au Gres Area Codes
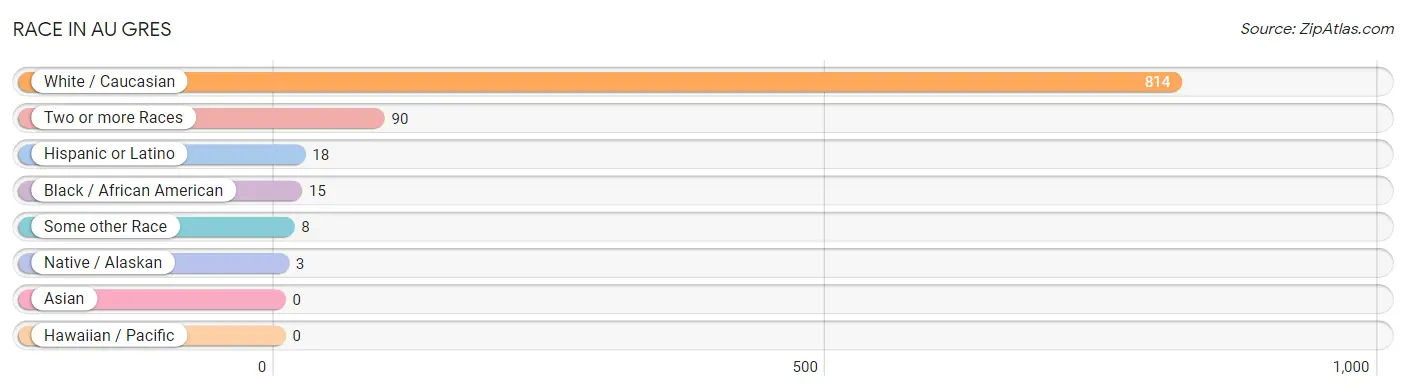
Race in Au Gres
The most populous races in Au Gres are White / Caucasian (814 | 87.5%), Two or more Races (90 | 9.7%), and Hispanic or Latino (18 | 1.9%).
| Race | # Population | % Population |
| Asian | 0 | 0.0% |
| Black / African American | 15 | 1.6% |
| Hawaiian / Pacific | 0 | 0.0% |
| Hispanic or Latino | 18 | 1.9% |
| Native / Alaskan | 3 | 0.3% |
| White / Caucasian | 814 | 87.5% |
| Two or more Races | 90 | 9.7% |
| Some other Race | 8 | 0.9% |
| Total | 930 | 100.0% |
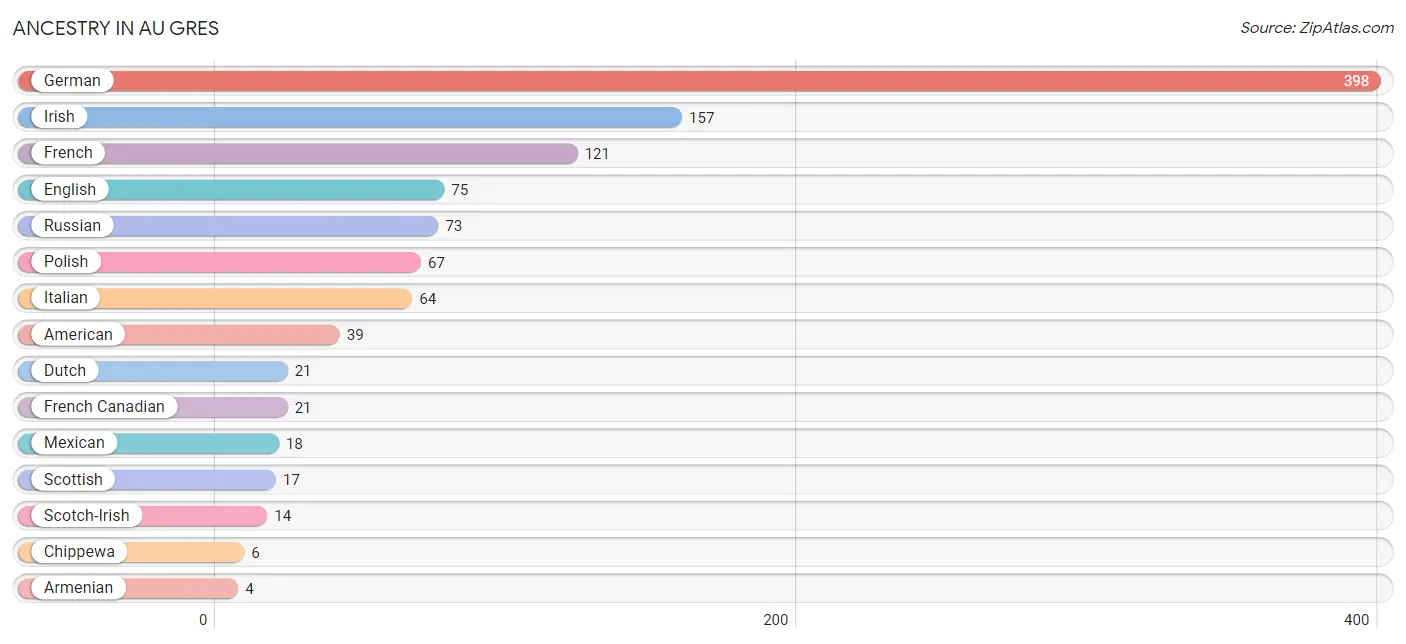
Ancestry in Au Gres
The most populous ancestries reported in Au Gres are German (398 | 42.8%), Irish (157 | 16.9%), French (121 | 13.0%), English (75 | 8.1%), and Russian (73 | 7.9%), together accounting for 88.6% of all Au Gres residents.
| Ancestry | # Population | % Population |
| American | 39 | 4.2% |
| Armenian | 4 | 0.4% |
| Chippewa | 6 | 0.6% |
| Dutch | 21 | 2.3% |
| English | 75 | 8.1% |
| Finnish | 3 | 0.3% |
| French | 121 | 13.0% |
| French Canadian | 21 | 2.3% |
| German | 398 | 42.8% |
| Irish | 157 | 16.9% |
| Italian | 64 | 6.9% |
| Korean | 4 | 0.4% |
| Mexican | 18 | 1.9% |
| Norwegian | 4 | 0.4% |
| Polish | 67 | 7.2% |
| Portuguese | 3 | 0.3% |
| Russian | 73 | 7.9% |
| Scotch-Irish | 14 | 1.5% |
| Scottish | 17 | 1.8% |
| Slovak | 3 | 0.3% |
| Swedish | 3 | 0.3% |
| Welsh | 3 | 0.3% | View All 22 Rows |
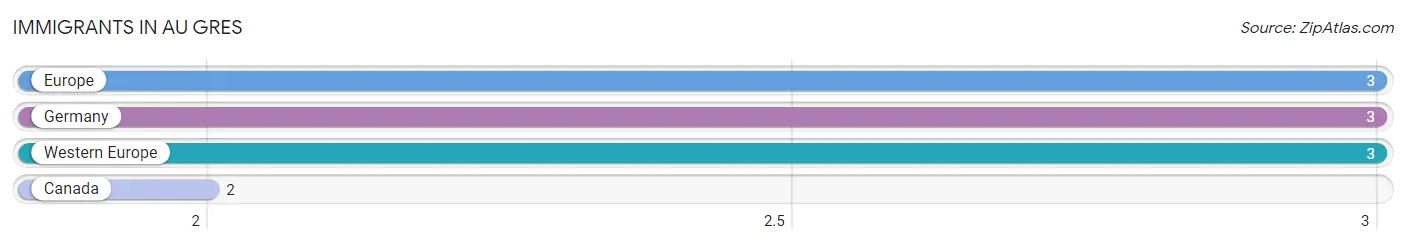
Immigrants in Au Gres
The most numerous immigrant groups reported in Au Gres came from Europe (3 | 0.3%), Germany (3 | 0.3%), Western Europe (3 | 0.3%), and Canada (2 | 0.2%), together accounting for 1.2% of all Au Gres residents.
| Immigration Origin | # Population | % Population |
| Canada | 2 | 0.2% |
| Europe | 3 | 0.3% |
| Germany | 3 | 0.3% |
| Western Europe | 3 | 0.3% | View All 4 Rows |
Sex and Age in Au Gres
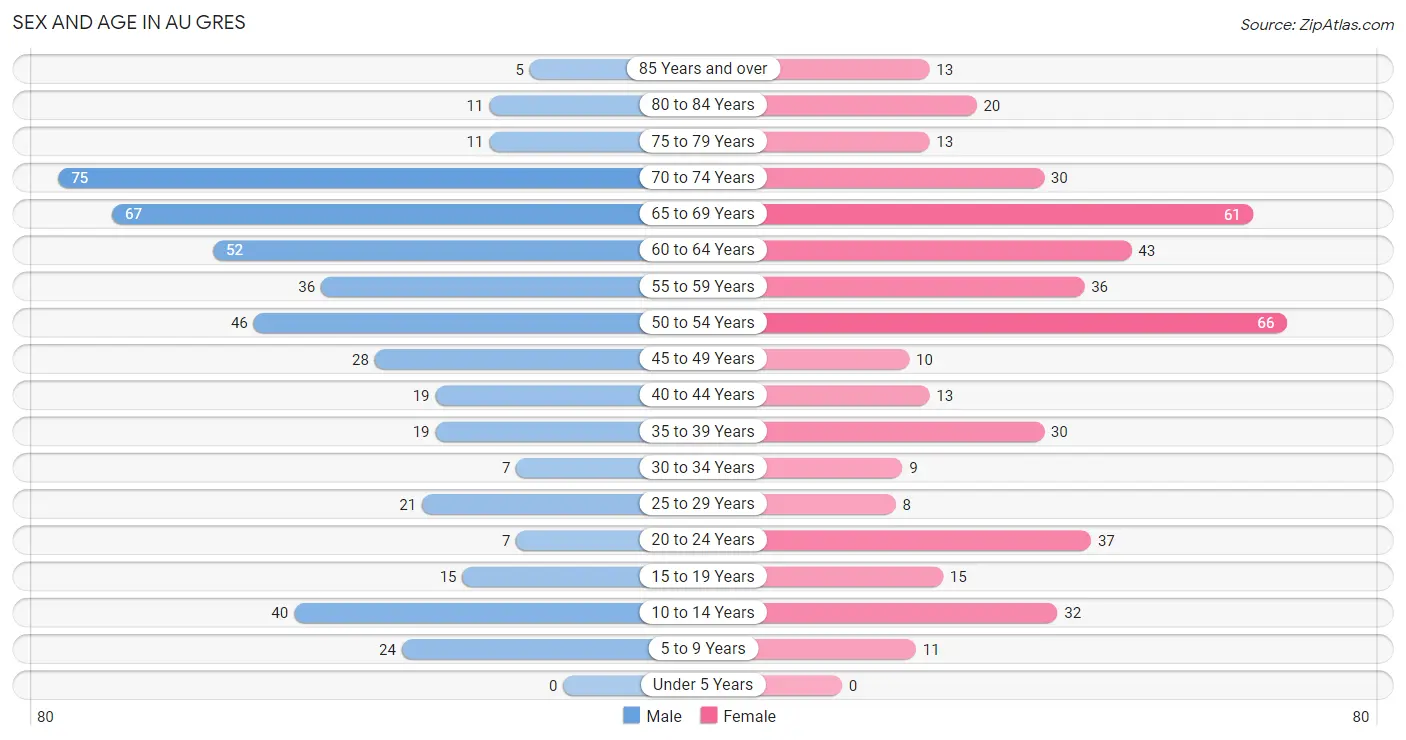
Sex and Age in Au Gres
The most populous age groups in Au Gres are 70 to 74 Years (75 | 15.5%) for men and 50 to 54 Years (66 | 14.8%) for women.
| Age Bracket | Male | Female |
| Under 5 Years | 0 (0.0%) | 0 (0.0%) |
| 5 to 9 Years | 24 (5.0%) | 11 (2.5%) |
| 10 to 14 Years | 40 (8.3%) | 32 (7.2%) |
| 15 to 19 Years | 15 (3.1%) | 15 (3.4%) |
| 20 to 24 Years | 7 (1.5%) | 37 (8.3%) |
| 25 to 29 Years | 21 (4.3%) | 8 (1.8%) |
| 30 to 34 Years | 7 (1.5%) | 9 (2.0%) |
| 35 to 39 Years | 19 (3.9%) | 30 (6.7%) |
| 40 to 44 Years | 19 (3.9%) | 13 (2.9%) |
| 45 to 49 Years | 28 (5.8%) | 10 (2.2%) |
| 50 to 54 Years | 46 (9.5%) | 66 (14.8%) |
| 55 to 59 Years | 36 (7.4%) | 36 (8.1%) |
| 60 to 64 Years | 52 (10.8%) | 43 (9.6%) |
| 65 to 69 Years | 67 (13.9%) | 61 (13.7%) |
| 70 to 74 Years | 75 (15.5%) | 30 (6.7%) |
| 75 to 79 Years | 11 (2.3%) | 13 (2.9%) |
| 80 to 84 Years | 11 (2.3%) | 20 (4.5%) |
| 85 Years and over | 5 (1.0%) | 13 (2.9%) |
| Total | 483 (100.0%) | 447 (100.0%) |
Families and Households in Au Gres
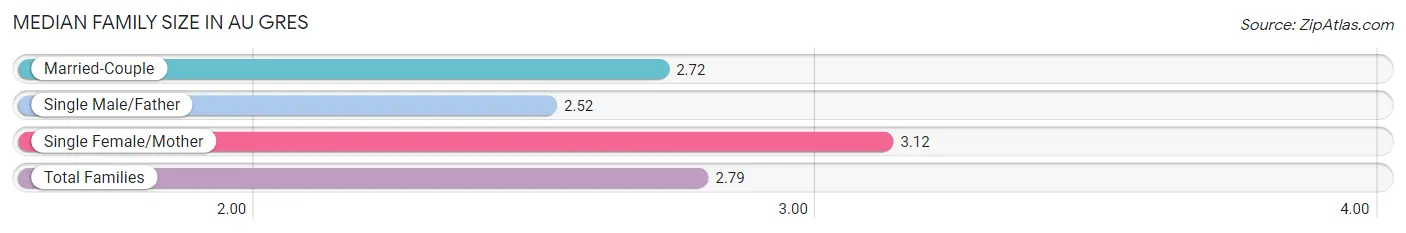
Median Family Size in Au Gres
The median family size in Au Gres is 2.79 persons per family, with single female/mother families (52 | 23.1%) accounting for the largest median family size of 3.12 persons per family. On the other hand, single male/father families (21 | 9.3%) represent the smallest median family size with 2.52 persons per family.
| Family Type | # Families | Family Size |
| Married-Couple | 152 (67.6%) | 2.72 |
| Single Male/Father | 21 (9.3%) | 2.52 |
| Single Female/Mother | 52 (23.1%) | 3.12 |
| Total Families | 225 (100.0%) | 2.79 |
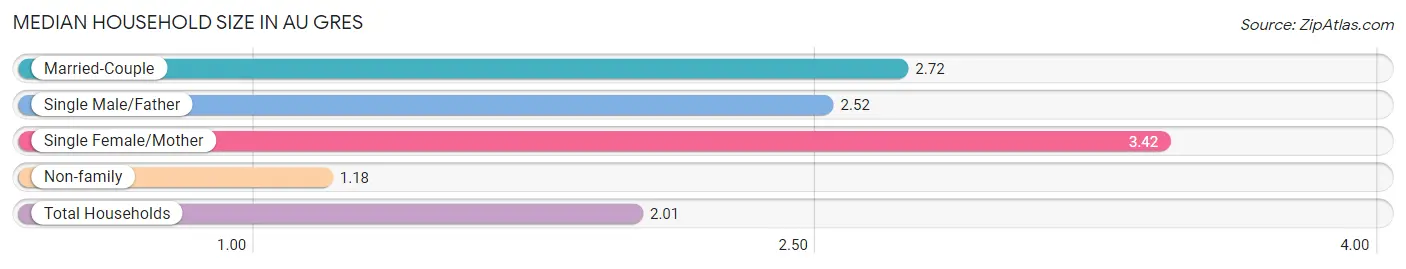
Median Household Size in Au Gres
The median household size in Au Gres is 2.01 persons per household, with single female/mother households (52 | 11.5%) accounting for the largest median household size of 3.42 persons per household. non-family households (228 | 50.3%) represent the smallest median household size with 1.18 persons per household.
| Household Type | # Households | Household Size |
| Married-Couple | 152 (33.6%) | 2.72 |
| Single Male/Father | 21 (4.6%) | 2.52 |
| Single Female/Mother | 52 (11.5%) | 3.42 |
| Non-family | 228 (50.3%) | 1.18 |
| Total Households | 453 (100.0%) | 2.01 |
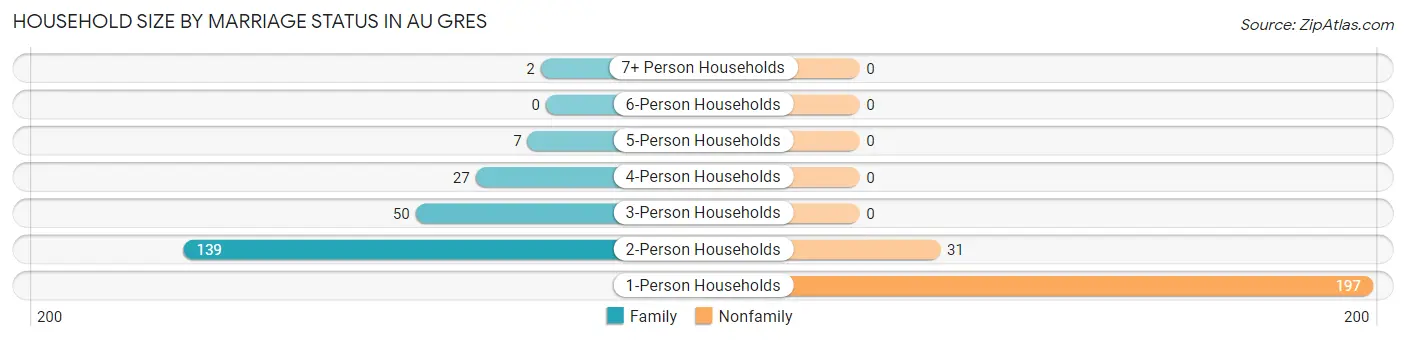
Household Size by Marriage Status in Au Gres
Out of a total of 453 households in Au Gres, 225 (49.7%) are family households, while 228 (50.3%) are nonfamily households. The most numerous type of family households are 2-person households, comprising 139, and the most common type of nonfamily households are 1-person households, comprising 197.
| Household Size | Family Households | Nonfamily Households |
| 1-Person Households | - | 197 (43.5%) |
| 2-Person Households | 139 (30.7%) | 31 (6.8%) |
| 3-Person Households | 50 (11.0%) | 0 (0.0%) |
| 4-Person Households | 27 (6.0%) | 0 (0.0%) |
| 5-Person Households | 7 (1.5%) | 0 (0.0%) |
| 6-Person Households | 0 (0.0%) | 0 (0.0%) |
| 7+ Person Households | 2 (0.4%) | 0 (0.0%) |
| Total | 225 (49.7%) | 228 (50.3%) |
Female Fertility in Au Gres
Fertility by Age in Au Gres
| Age Bracket | Women with Births | Births / 1,000 Women |
| 15 to 19 years | 0 (0.0%) | 0.0 |
| 20 to 34 years | 0 (0.0%) | 0.0 |
| 35 to 50 years | 0 (0.0%) | 0.0 |
| Total | 0 (0.0%) | 0.0 |
Fertility by Age by Marriage Status in Au Gres
| Age Bracket | Married | Unmarried |
| 15 to 19 years | 0 (0.0%) | 0 (0.0%) |
| 20 to 34 years | 0 (0.0%) | 0 (0.0%) |
| 35 to 50 years | 0 (0.0%) | 0 (0.0%) |
| Total | 0 (0.0%) | 0 (0.0%) |
Fertility by Education in Au Gres
| Educational Attainment | Women with Births | Births / 1,000 Women |
| Less than High School | 0 (0.0%) | 0.0 |
| High School Diploma | 0 (0.0%) | 0.0 |
| College or Associate's Degree | 0 (0.0%) | 0.0 |
| Bachelor's Degree | 0 (0.0%) | 0.0 |
| Graduate Degree | 0 (0.0%) | 0.0 |
| Total | 0 (0.0%) | 0.0 |
Fertility by Education by Marriage Status in Au Gres
| Educational Attainment | Married | Unmarried |
| Less than High School | 0 (0.0%) | 0 (0.0%) |
| High School Diploma | 0 (0.0%) | 0 (0.0%) |
| College or Associate's Degree | 0 (0.0%) | 0 (0.0%) |
| Bachelor's Degree | 0 (0.0%) | 0 (0.0%) |
| Graduate Degree | 0 (0.0%) | 0 (0.0%) |
| Total | 0 (0.0%) | 0 (0.0%) |
Income in Au Gres
Income Overview in Au Gres
Per Capita Income in Au Gres is $30,352, while median incomes of families and households are $64,327 and $55,313 respectively.
| Characteristic | Number | Measure |
| Per Capita Income | 930 | $30,352 |
| Median Family Income | 225 | $64,327 |
| Mean Family Income | 225 | $69,434 |
| Median Household Income | 453 | $55,313 |
| Mean Household Income | 453 | $61,564 |
| Income Deficit | 225 | $0 |
| Wage / Income Gap (%) | 930 | 61.49% |
| Wage / Income Gap ($) | 930 | 38.51¢ per $1 |
| Gini / Inequality Index | 930 | 0.40 |
Earnings by Sex in Au Gres
Average Earnings in Au Gres are $33,542, $64,286 for men and $24,757 for women, a difference of 61.5%.
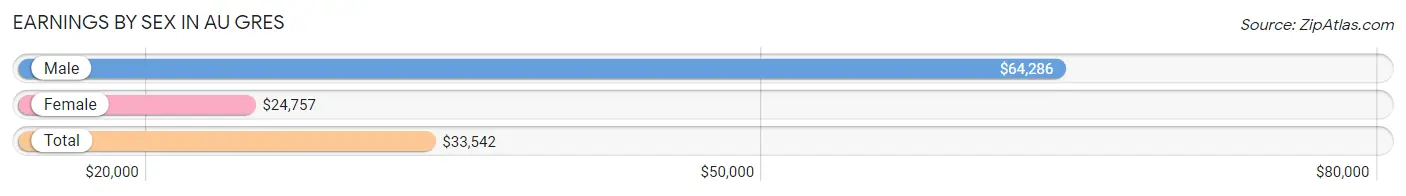
| Sex | Number | Average Earnings |
| Male | 168 (47.1%) | $64,286 |
| Female | 189 (52.9%) | $24,757 |
| Total | 357 (100.0%) | $33,542 |
Earnings by Sex by Income Bracket in Au Gres
The most common earnings brackets in Au Gres are $75,000 to $99,999 for men (68 | 40.5%) and $22,500 to $24,999 for women (36 | 19.1%).
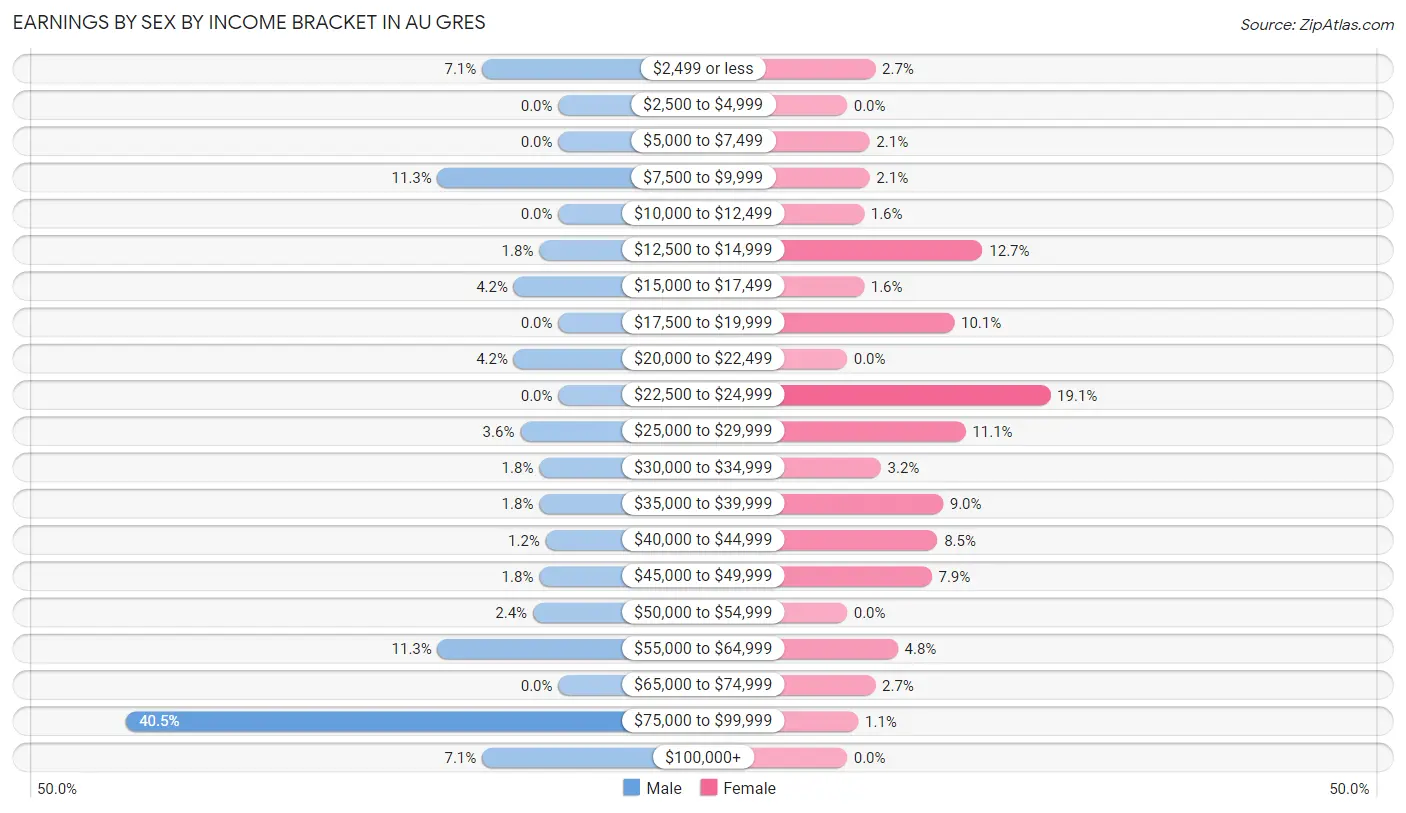
| Income | Male | Female |
| $2,499 or less | 12 (7.1%) | 5 (2.6%) |
| $2,500 to $4,999 | 0 (0.0%) | 0 (0.0%) |
| $5,000 to $7,499 | 0 (0.0%) | 4 (2.1%) |
| $7,500 to $9,999 | 19 (11.3%) | 4 (2.1%) |
| $10,000 to $12,499 | 0 (0.0%) | 3 (1.6%) |
| $12,500 to $14,999 | 3 (1.8%) | 24 (12.7%) |
| $15,000 to $17,499 | 7 (4.2%) | 3 (1.6%) |
| $17,500 to $19,999 | 0 (0.0%) | 19 (10.1%) |
| $20,000 to $22,499 | 7 (4.2%) | 0 (0.0%) |
| $22,500 to $24,999 | 0 (0.0%) | 36 (19.1%) |
| $25,000 to $29,999 | 6 (3.6%) | 21 (11.1%) |
| $30,000 to $34,999 | 3 (1.8%) | 6 (3.2%) |
| $35,000 to $39,999 | 3 (1.8%) | 17 (9.0%) |
| $40,000 to $44,999 | 2 (1.2%) | 16 (8.5%) |
| $45,000 to $49,999 | 3 (1.8%) | 15 (7.9%) |
| $50,000 to $54,999 | 4 (2.4%) | 0 (0.0%) |
| $55,000 to $64,999 | 19 (11.3%) | 9 (4.8%) |
| $65,000 to $74,999 | 0 (0.0%) | 5 (2.6%) |
| $75,000 to $99,999 | 68 (40.5%) | 2 (1.1%) |
| $100,000+ | 12 (7.1%) | 0 (0.0%) |
| Total | 168 (100.0%) | 189 (100.0%) |
Earnings by Sex by Educational Attainment in Au Gres
Average earnings in Au Gres are $75,250 for men and $26,131 for women, a difference of 65.3%. Men with an educational attainment of college or associate's degree enjoy the highest average annual earnings of $85,528, while those with less than high school education earn the least with $26,875. Women with an educational attainment of bachelor's degree earn the most with the average annual earnings of $35,000, while those with high school diploma education have the smallest earnings of $24,053.
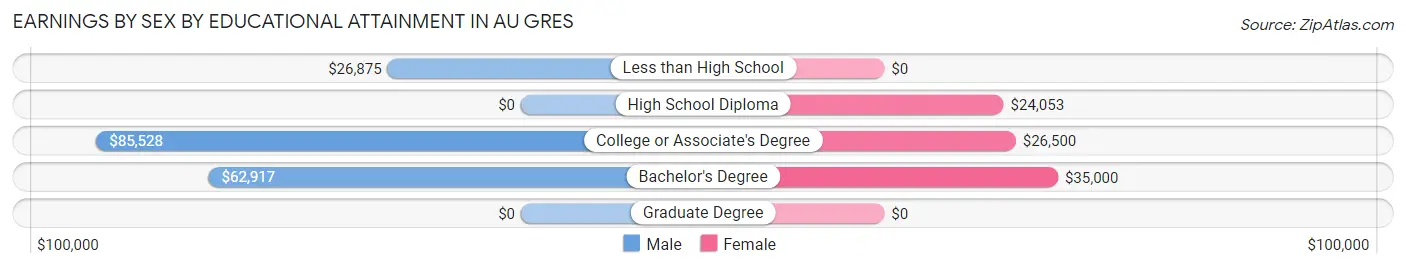
| Educational Attainment | Male Income | Female Income |
| Less than High School | $26,875 | $0 |
| High School Diploma | - | - |
| College or Associate's Degree | $85,528 | $26,500 |
| Bachelor's Degree | $62,917 | $35,000 |
| Graduate Degree | - | - |
| Total | $75,250 | $26,131 |
Family Income in Au Gres
Family Income Brackets in Au Gres
According to the Au Gres family income data, there are 54 families falling into the $75,000 to $99,999 income range, which is the most common income bracket and makes up 24.0% of all families.
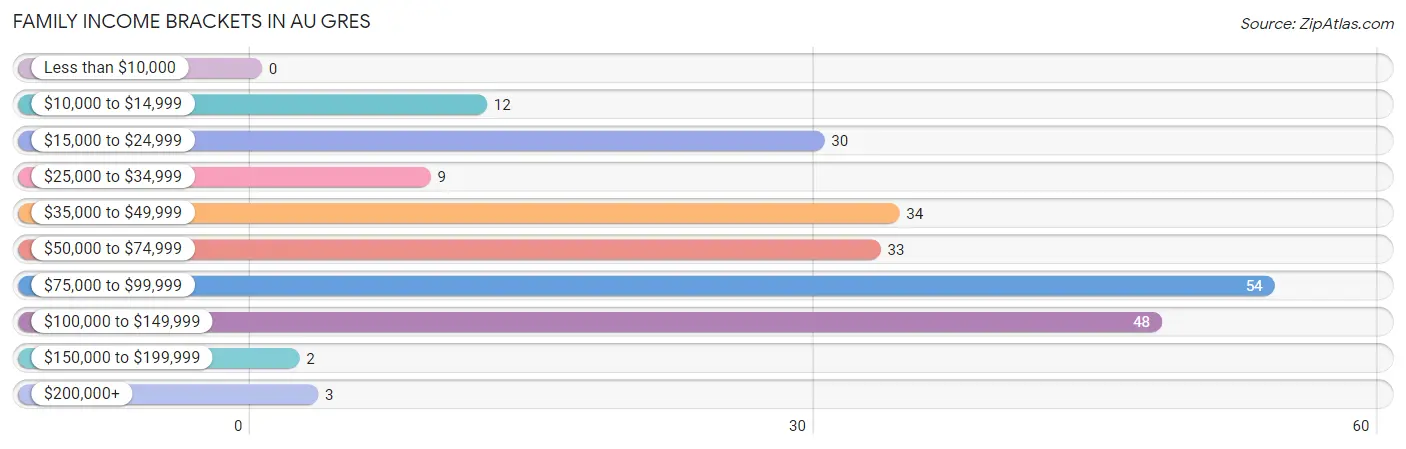
| Income Bracket | # Families | % Families |
| Less than $10,000 | 0 | 0.0% |
| $10,000 to $14,999 | 12 | 5.3% |
| $15,000 to $24,999 | 30 | 13.3% |
| $25,000 to $34,999 | 9 | 4.0% |
| $35,000 to $49,999 | 34 | 15.1% |
| $50,000 to $74,999 | 33 | 14.7% |
| $75,000 to $99,999 | 54 | 24.0% |
| $100,000 to $149,999 | 48 | 21.3% |
| $150,000 to $199,999 | 2 | 0.9% |
| $200,000+ | 3 | 1.3% |
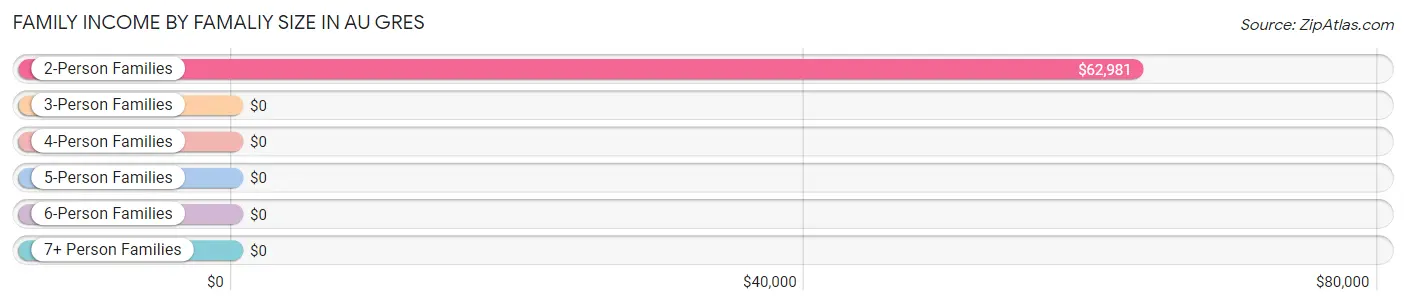
Family Income by Famaliy Size in Au Gres
2-person families (153 | 68.0%) account for the highest median family income in Au Gres with $62,981 per family, while 2-person families (153 | 68.0%) have the highest median income of $31,490 per family member.
| Income Bracket | # Families | Median Income |
| 2-Person Families | 153 (68.0%) | $62,981 |
| 3-Person Families | 39 (17.3%) | $0 |
| 4-Person Families | 24 (10.7%) | $0 |
| 5-Person Families | 7 (3.1%) | $0 |
| 6-Person Families | 0 (0.0%) | $0 |
| 7+ Person Families | 2 (0.9%) | $0 |
| Total | 225 (100.0%) | $64,327 |
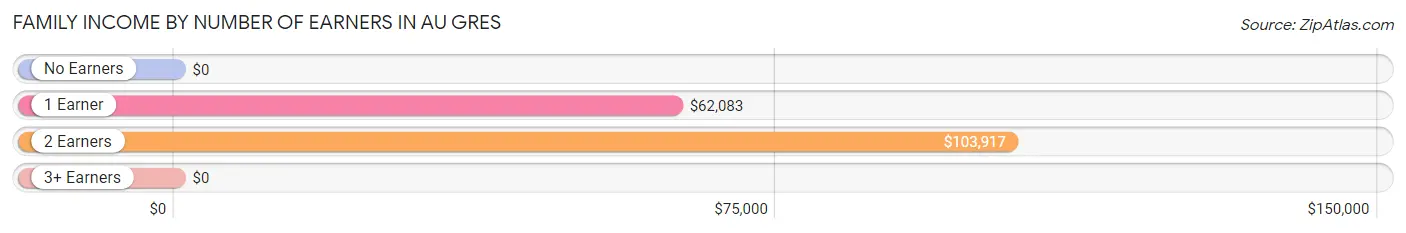
Family Income by Number of Earners in Au Gres
| Number of Earners | # Families | Median Income |
| No Earners | 83 (36.9%) | $0 |
| 1 Earner | 87 (38.7%) | $62,083 |
| 2 Earners | 49 (21.8%) | $103,917 |
| 3+ Earners | 6 (2.7%) | $0 |
| Total | 225 (100.0%) | $64,327 |
Household Income in Au Gres
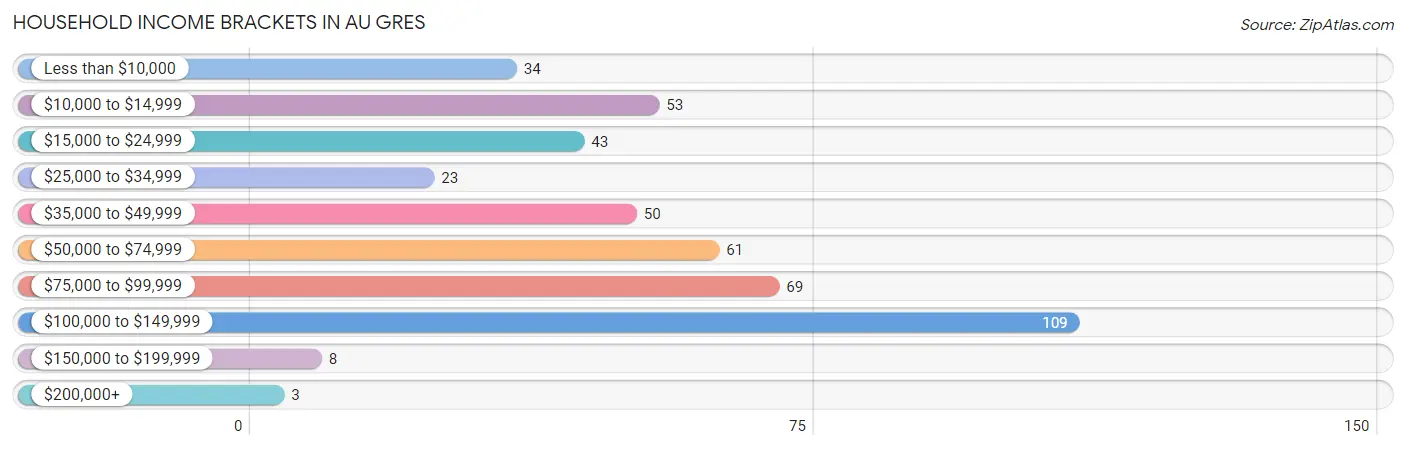
Household Income Brackets in Au Gres
With 109 households falling in the category, the $100,000 to $149,999 income range is the most frequent in Au Gres, accounting for 24.1% of all households. In contrast, only 3 households (0.7%) fall into the $200,000+ income bracket, making it the least populous group.
| Income Bracket | # Households | % Households |
| Less than $10,000 | 34 | 7.5% |
| $10,000 to $14,999 | 53 | 11.7% |
| $15,000 to $24,999 | 43 | 9.5% |
| $25,000 to $34,999 | 23 | 5.1% |
| $35,000 to $49,999 | 50 | 11.0% |
| $50,000 to $74,999 | 61 | 13.5% |
| $75,000 to $99,999 | 69 | 15.2% |
| $100,000 to $149,999 | 109 | 24.1% |
| $150,000 to $199,999 | 8 | 1.8% |
| $200,000+ | 3 | 0.7% |
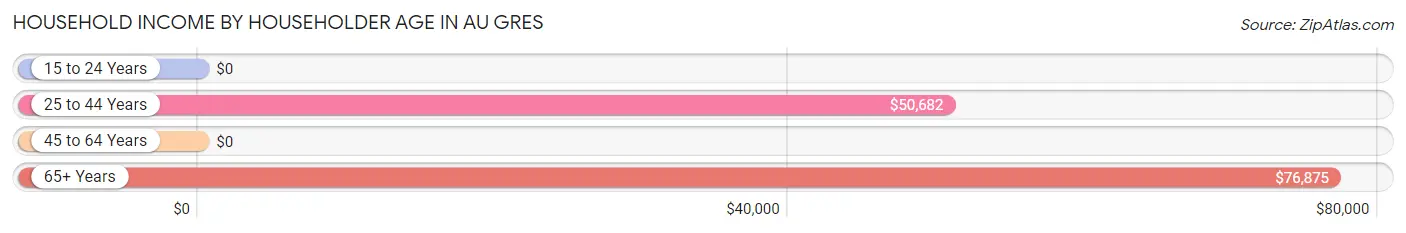
Household Income by Householder Age in Au Gres
The median household income in Au Gres is $55,313, with the highest median household income of $76,875 found in the 65+ years age bracket for the primary householder. A total of 215 households (47.5%) fall into this category.
| Income Bracket | # Households | Median Income |
| 15 to 24 Years | 0 (0.0%) | $0 |
| 25 to 44 Years | 54 (11.9%) | $50,682 |
| 45 to 64 Years | 184 (40.6%) | $0 |
| 65+ Years | 215 (47.5%) | $76,875 |
| Total | 453 (100.0%) | $55,313 |
Poverty in Au Gres
Income Below Poverty by Sex and Age in Au Gres
With 29.2% poverty level for males and 21.0% for females among the residents of Au Gres, 35 to 44 year old males and 45 to 54 year old females are the most vulnerable to poverty, with 34 males (89.5%) and 38 females (50.0%) in their respective age groups living below the poverty level.
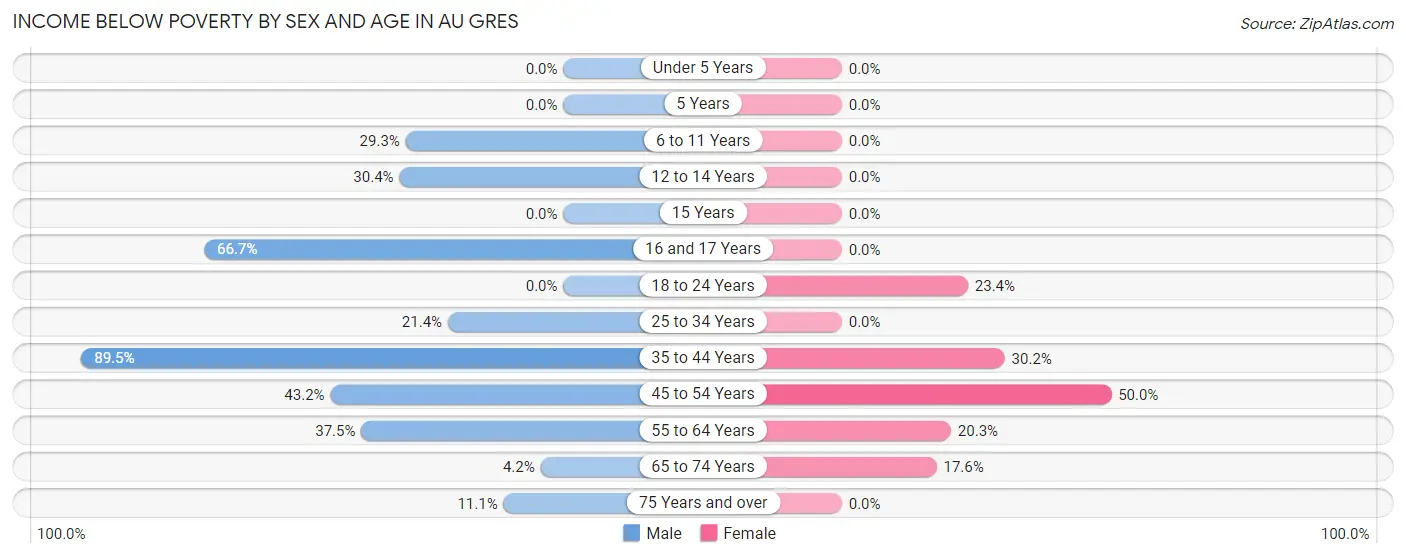
| Age Bracket | Male | Female |
| Under 5 Years | 0 (0.0%) | 0 (0.0%) |
| 5 Years | 0 (0.0%) | 0 (0.0%) |
| 6 to 11 Years | 12 (29.3%) | 0 (0.0%) |
| 12 to 14 Years | 7 (30.4%) | 0 (0.0%) |
| 15 Years | 0 (0.0%) | 0 (0.0%) |
| 16 and 17 Years | 8 (66.7%) | 0 (0.0%) |
| 18 to 24 Years | 0 (0.0%) | 11 (23.4%) |
| 25 to 34 Years | 6 (21.4%) | 0 (0.0%) |
| 35 to 44 Years | 34 (89.5%) | 13 (30.2%) |
| 45 to 54 Years | 32 (43.2%) | 38 (50.0%) |
| 55 to 64 Years | 33 (37.5%) | 16 (20.3%) |
| 65 to 74 Years | 6 (4.2%) | 16 (17.6%) |
| 75 Years and over | 3 (11.1%) | 0 (0.0%) |
| Total | 141 (29.2%) | 94 (21.0%) |
Income Above Poverty by Sex and Age in Au Gres
According to the poverty statistics in Au Gres, males aged 18 to 24 years and females aged 5 years are the age groups that are most secure financially, with 100.0% of males and 100.0% of females in these age groups living above the poverty line.
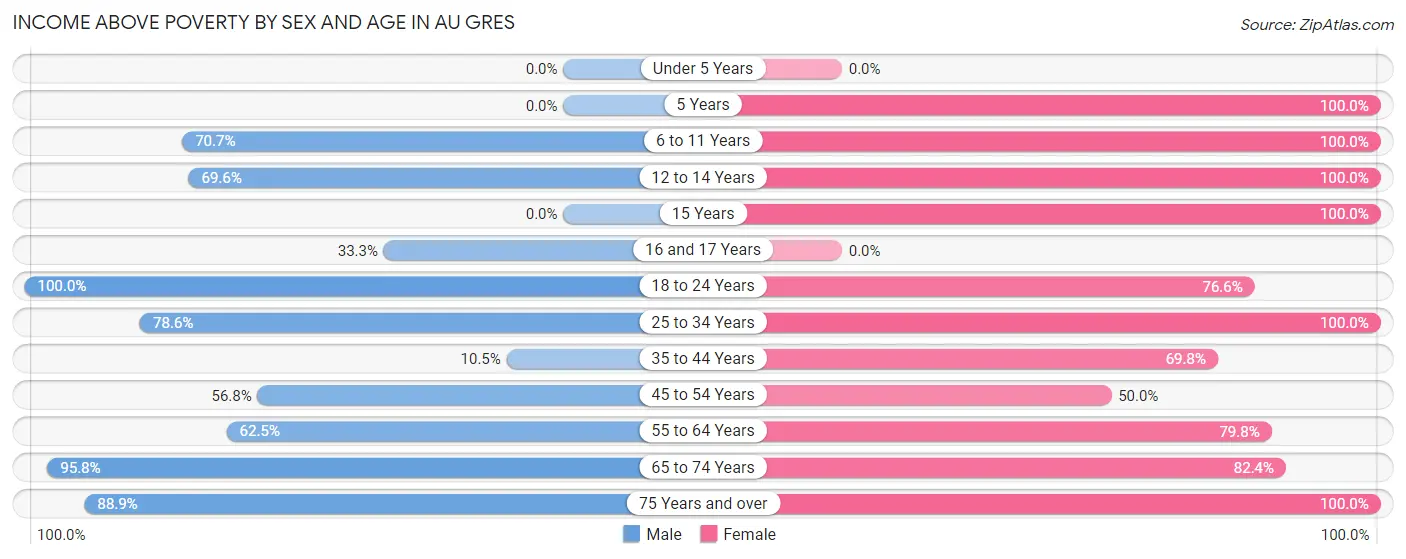
| Age Bracket | Male | Female |
| Under 5 Years | 0 (0.0%) | 0 (0.0%) |
| 5 Years | 0 (0.0%) | 3 (100.0%) |
| 6 to 11 Years | 29 (70.7%) | 8 (100.0%) |
| 12 to 14 Years | 16 (69.6%) | 32 (100.0%) |
| 15 Years | 0 (0.0%) | 5 (100.0%) |
| 16 and 17 Years | 4 (33.3%) | 0 (0.0%) |
| 18 to 24 Years | 10 (100.0%) | 36 (76.6%) |
| 25 to 34 Years | 22 (78.6%) | 17 (100.0%) |
| 35 to 44 Years | 4 (10.5%) | 30 (69.8%) |
| 45 to 54 Years | 42 (56.8%) | 38 (50.0%) |
| 55 to 64 Years | 55 (62.5%) | 63 (79.7%) |
| 65 to 74 Years | 136 (95.8%) | 75 (82.4%) |
| 75 Years and over | 24 (88.9%) | 46 (100.0%) |
| Total | 342 (70.8%) | 353 (79.0%) |
Income Below Poverty Among Married-Couple Families in Au Gres
The poverty statistics for married-couple families in Au Gres show that 7.2% or 11 of the total 152 families live below the poverty line. Families with 1 or 2 children have the highest poverty rate of 8.1%, comprising of 3 families. On the other hand, families with 3 or 4 children have the lowest poverty rate of 0.0%, which includes 0 families.
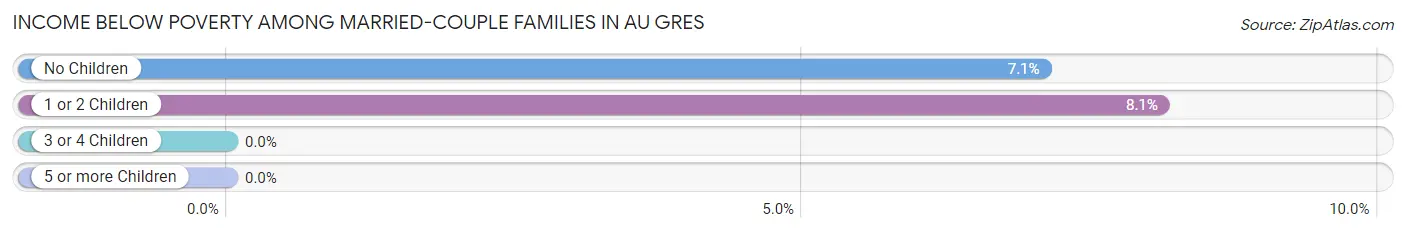
| Children | Above Poverty | Below Poverty |
| No Children | 105 (92.9%) | 8 (7.1%) |
| 1 or 2 Children | 34 (91.9%) | 3 (8.1%) |
| 3 or 4 Children | 2 (100.0%) | 0 (0.0%) |
| 5 or more Children | 0 (0.0%) | 0 (0.0%) |
| Total | 141 (92.8%) | 11 (7.2%) |
Income Below Poverty Among Single-Parent Households in Au Gres
According to the poverty data in Au Gres, 85.7% or 18 single-father households and 25.0% or 13 single-mother households are living below the poverty line. Among single-father households, those with 1 or 2 children have the highest poverty rate, with 18 households (100.0%) experiencing poverty. Likewise, among single-mother households, those with no children have the highest poverty rate, with 10 households (38.5%) falling below the poverty line.
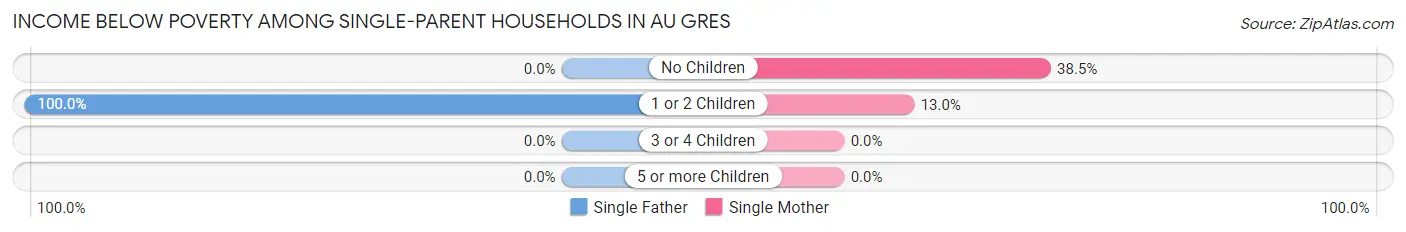
| Children | Single Father | Single Mother |
| No Children | 0 (0.0%) | 10 (38.5%) |
| 1 or 2 Children | 18 (100.0%) | 3 (13.0%) |
| 3 or 4 Children | 0 (0.0%) | 0 (0.0%) |
| 5 or more Children | 0 (0.0%) | 0 (0.0%) |
| Total | 18 (85.7%) | 13 (25.0%) |
Income Below Poverty Among Married-Couple vs Single-Parent Households in Au Gres
The poverty data for Au Gres shows that 11 of the married-couple family households (7.2%) and 31 of the single-parent households (42.5%) are living below the poverty level. Within the married-couple family households, those with 1 or 2 children have the highest poverty rate, with 3 households (8.1%) falling below the poverty line. Among the single-parent households, those with 1 or 2 children have the highest poverty rate, with 21 household (51.2%) living below poverty.
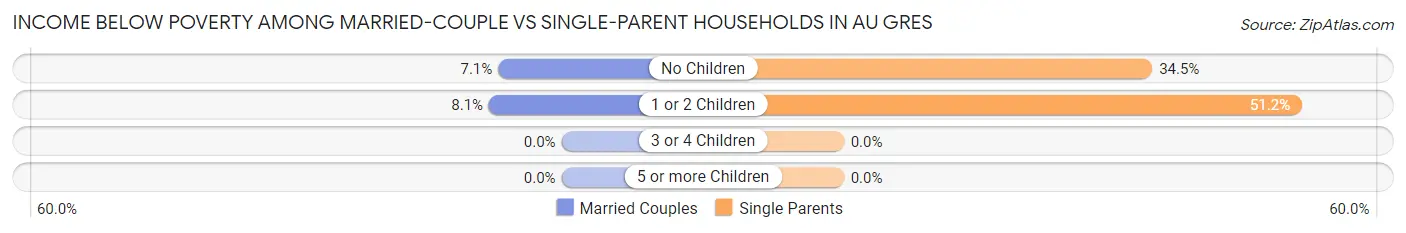
| Children | Married-Couple Families | Single-Parent Households |
| No Children | 8 (7.1%) | 10 (34.5%) |
| 1 or 2 Children | 3 (8.1%) | 21 (51.2%) |
| 3 or 4 Children | 0 (0.0%) | 0 (0.0%) |
| 5 or more Children | 0 (0.0%) | 0 (0.0%) |
| Total | 11 (7.2%) | 31 (42.5%) |
Employment Characteristics in Au Gres
Employment by Class of Employer in Au Gres
Among the 292 employed individuals in Au Gres, private company employees (167 | 57.2%), local government employees (53 | 18.1%), and not-for-profit organizations (33 | 11.3%) make up the most common classes of employment.
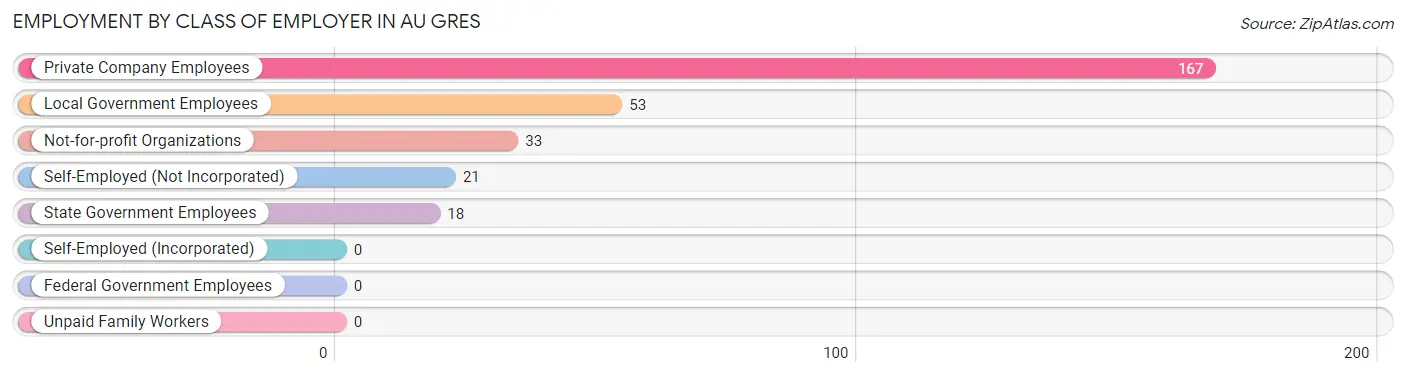
| Employer Class | # Employees | % Employees |
| Private Company Employees | 167 | 57.2% |
| Self-Employed (Incorporated) | 0 | 0.0% |
| Self-Employed (Not Incorporated) | 21 | 7.2% |
| Not-for-profit Organizations | 33 | 11.3% |
| Local Government Employees | 53 | 18.1% |
| State Government Employees | 18 | 6.2% |
| Federal Government Employees | 0 | 0.0% |
| Unpaid Family Workers | 0 | 0.0% |
| Total | 292 | 100.0% |
Employment Status by Age in Au Gres
According to the labor force statistics for Au Gres, out of the total population over 16 years of age (818), 45.6% or 373 individuals are in the labor force, with 21.7% or 81 of them unemployed. The age group with the highest labor force participation rate is 20 to 24 years, with 100.0% or 44 individuals in the labor force. Within the labor force, the 30 to 34 years age range has the highest percentage of unemployed individuals, with 56.3% or 9 of them being unemployed.
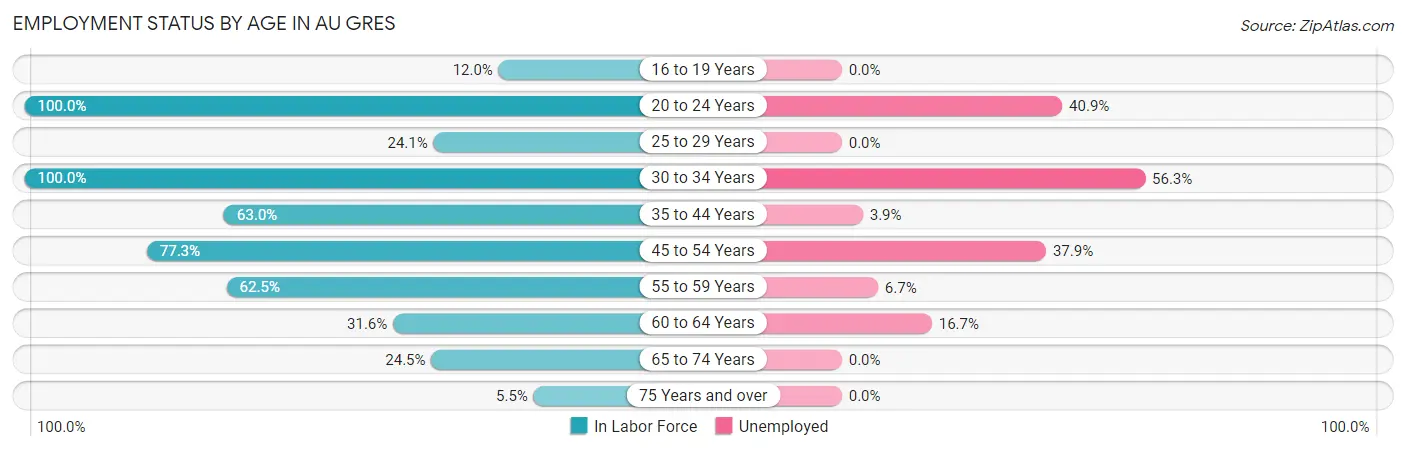
| Age Bracket | In Labor Force | Unemployed |
| 16 to 19 Years | 3 (12.0%) | 0 (0.0%) |
| 20 to 24 Years | 44 (100.0%) | 18 (40.9%) |
| 25 to 29 Years | 7 (24.1%) | 0 (0.0%) |
| 30 to 34 Years | 16 (100.0%) | 9 (56.3%) |
| 35 to 44 Years | 51 (63.0%) | 2 (3.9%) |
| 45 to 54 Years | 116 (77.3%) | 44 (37.9%) |
| 55 to 59 Years | 45 (62.5%) | 3 (6.7%) |
| 60 to 64 Years | 30 (31.6%) | 5 (16.7%) |
| 65 to 74 Years | 57 (24.5%) | 0 (0.0%) |
| 75 Years and over | 4 (5.5%) | 0 (0.0%) |
| Total | 373 (45.6%) | 81 (21.7%) |
Employment Status by Educational Attainment in Au Gres
According to labor force statistics for Au Gres, 59.8% of individuals (265) out of the total population between 25 and 64 years of age (443) are in the labor force, with 23.8% or 63 of them being unemployed. The group with the highest labor force participation rate are those with the educational attainment of high school diploma, with 63.8% or 104 individuals in the labor force. Within the labor force, individuals with high school diploma education have the highest percentage of unemployment, with 47.1% or 49 of them being unemployed.
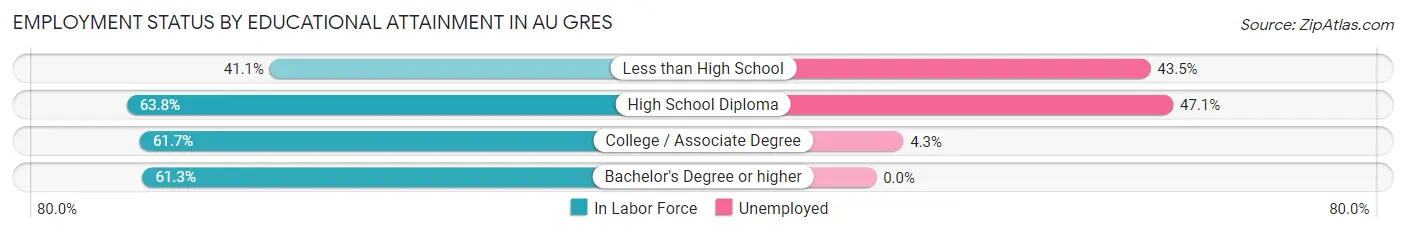
| Educational Attainment | In Labor Force | Unemployed |
| Less than High School | 23 (41.1%) | 24 (43.5%) |
| High School Diploma | 104 (63.8%) | 77 (47.1%) |
| College / Associate Degree | 92 (61.7%) | 6 (4.3%) |
| Bachelor's Degree or higher | 46 (61.3%) | 0 (0.0%) |
| Total | 265 (59.8%) | 105 (23.8%) |
Employment Occupations by Sex in Au Gres
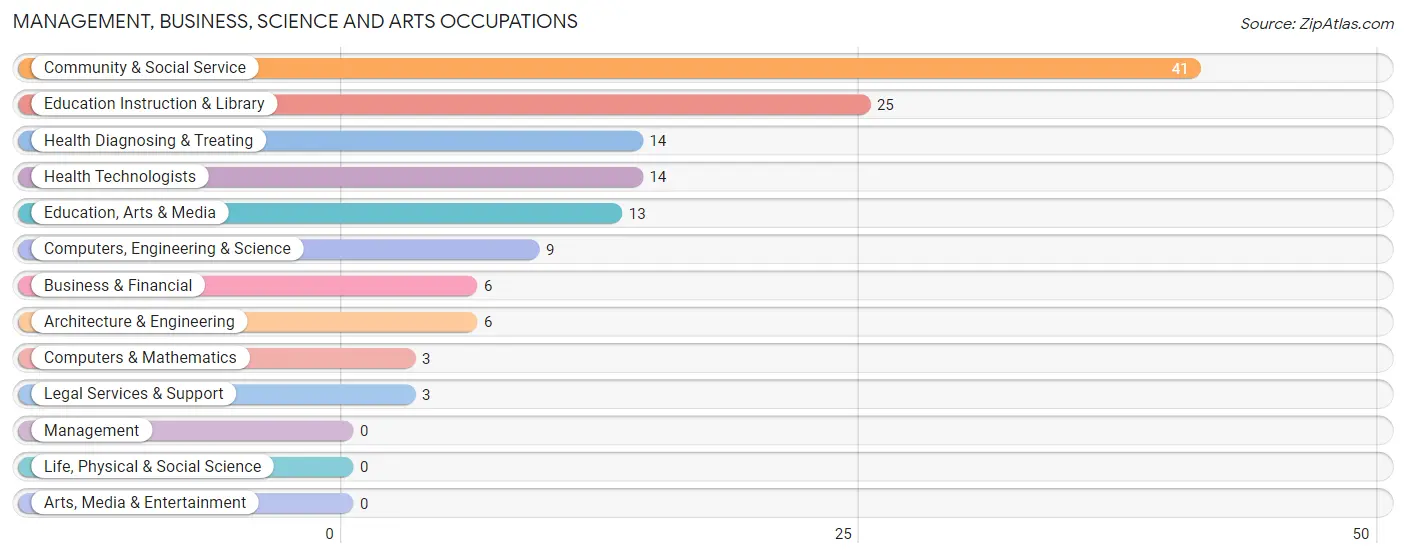
Management, Business, Science and Arts Occupations
The most common Management, Business, Science and Arts occupations in Au Gres are Community & Social Service (41 | 14.0%), Education Instruction & Library (25 | 8.6%), Health Diagnosing & Treating (14 | 4.8%), Health Technologists (14 | 4.8%), and Education, Arts & Media (13 | 4.4%).
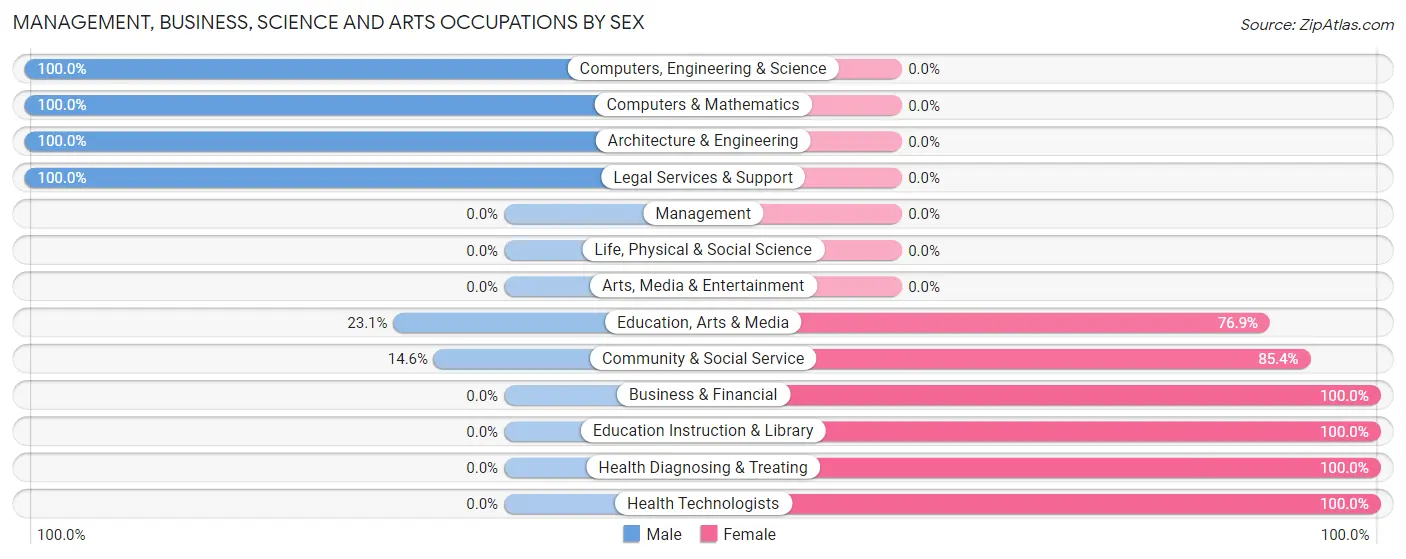
Management, Business, Science and Arts Occupations by Sex
Within the Management, Business, Science and Arts occupations in Au Gres, the most male-oriented occupations are Computers, Engineering & Science (100.0%), Computers & Mathematics (100.0%), and Architecture & Engineering (100.0%), while the most female-oriented occupations are Business & Financial (100.0%), Education Instruction & Library (100.0%), and Health Diagnosing & Treating (100.0%).
| Occupation | Male | Female |
| Management | 0 (0.0%) | 0 (0.0%) |
| Business & Financial | 0 (0.0%) | 6 (100.0%) |
| Computers, Engineering & Science | 9 (100.0%) | 0 (0.0%) |
| Computers & Mathematics | 3 (100.0%) | 0 (0.0%) |
| Architecture & Engineering | 6 (100.0%) | 0 (0.0%) |
| Life, Physical & Social Science | 0 (0.0%) | 0 (0.0%) |
| Community & Social Service | 6 (14.6%) | 35 (85.4%) |
| Education, Arts & Media | 3 (23.1%) | 10 (76.9%) |
| Legal Services & Support | 3 (100.0%) | 0 (0.0%) |
| Education Instruction & Library | 0 (0.0%) | 25 (100.0%) |
| Arts, Media & Entertainment | 0 (0.0%) | 0 (0.0%) |
| Health Diagnosing & Treating | 0 (0.0%) | 14 (100.0%) |
| Health Technologists | 0 (0.0%) | 14 (100.0%) |
| Total (Category) | 15 (21.4%) | 55 (78.6%) |
| Total (Overall) | 149 (51.0%) | 143 (49.0%) |
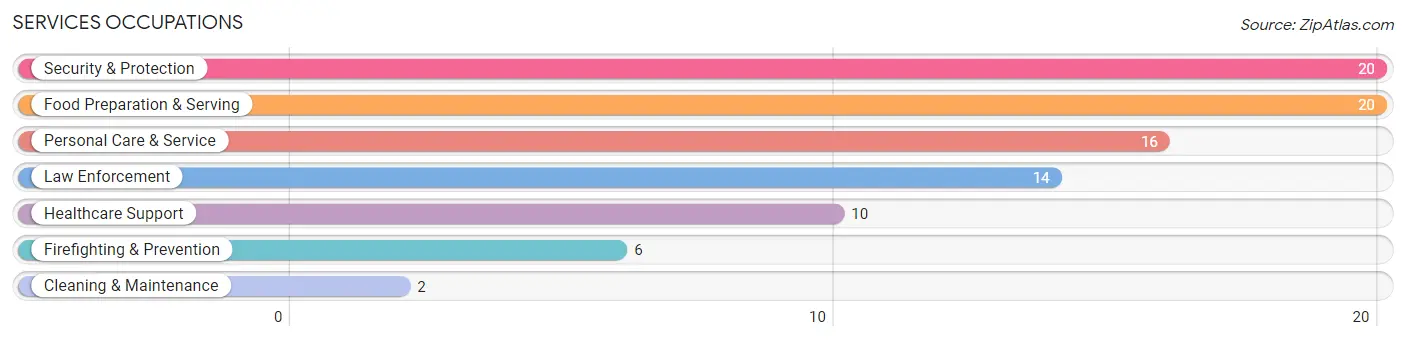
Services Occupations
The most common Services occupations in Au Gres are Security & Protection (20 | 6.9%), Food Preparation & Serving (20 | 6.9%), Personal Care & Service (16 | 5.5%), Law Enforcement (14 | 4.8%), and Healthcare Support (10 | 3.4%).
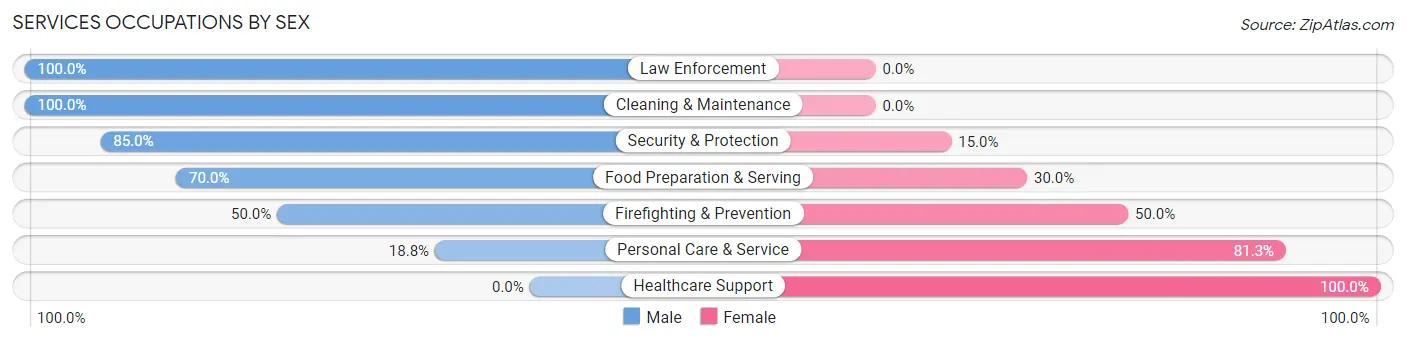
Services Occupations by Sex
Within the Services occupations in Au Gres, the most male-oriented occupations are Law Enforcement (100.0%), Cleaning & Maintenance (100.0%), and Security & Protection (85.0%), while the most female-oriented occupations are Healthcare Support (100.0%), Personal Care & Service (81.2%), and Firefighting & Prevention (50.0%).
| Occupation | Male | Female |
| Healthcare Support | 0 (0.0%) | 10 (100.0%) |
| Security & Protection | 17 (85.0%) | 3 (15.0%) |
| Firefighting & Prevention | 3 (50.0%) | 3 (50.0%) |
| Law Enforcement | 14 (100.0%) | 0 (0.0%) |
| Food Preparation & Serving | 14 (70.0%) | 6 (30.0%) |
| Cleaning & Maintenance | 2 (100.0%) | 0 (0.0%) |
| Personal Care & Service | 3 (18.8%) | 13 (81.2%) |
| Total (Category) | 36 (52.9%) | 32 (47.1%) |
| Total (Overall) | 149 (51.0%) | 143 (49.0%) |
Sales and Office Occupations
The most common Sales and Office occupations in Au Gres are Sales & Related (44 | 15.1%), and Office & Administration (24 | 8.2%).
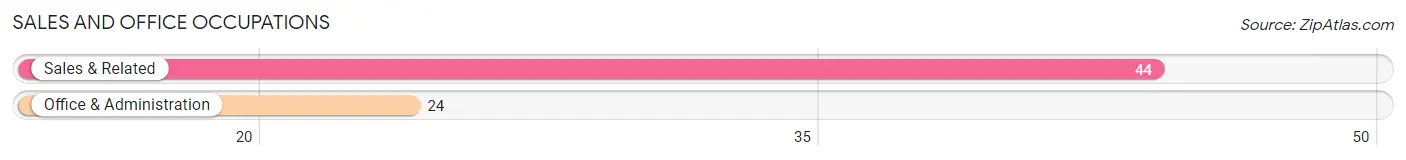
Sales and Office Occupations by Sex
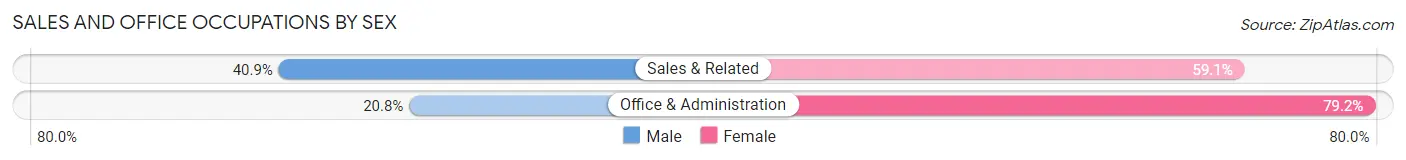
| Occupation | Male | Female |
| Sales & Related | 18 (40.9%) | 26 (59.1%) |
| Office & Administration | 5 (20.8%) | 19 (79.2%) |
| Total (Category) | 23 (33.8%) | 45 (66.2%) |
| Total (Overall) | 149 (51.0%) | 143 (49.0%) |
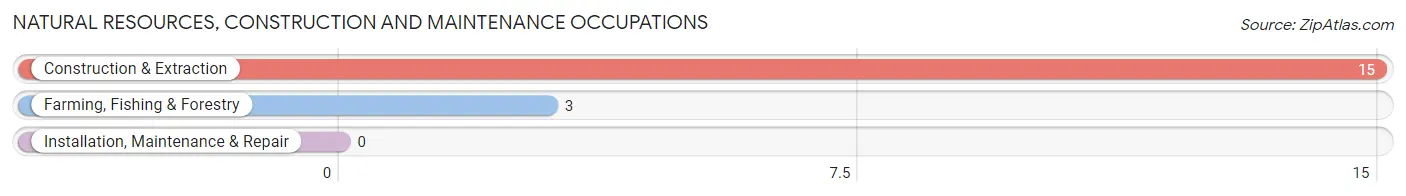
Natural Resources, Construction and Maintenance Occupations
The most common Natural Resources, Construction and Maintenance occupations in Au Gres are Construction & Extraction (15 | 5.1%), and Farming, Fishing & Forestry (3 | 1.0%).
Natural Resources, Construction and Maintenance Occupations by Sex
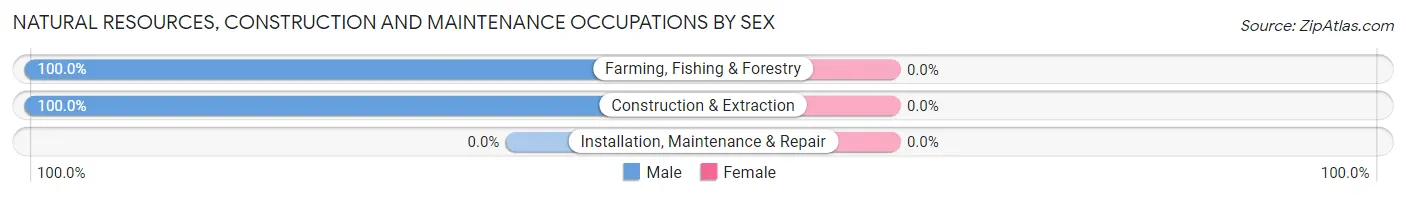
| Occupation | Male | Female |
| Farming, Fishing & Forestry | 3 (100.0%) | 0 (0.0%) |
| Construction & Extraction | 15 (100.0%) | 0 (0.0%) |
| Installation, Maintenance & Repair | 0 (0.0%) | 0 (0.0%) |
| Total (Category) | 18 (100.0%) | 0 (0.0%) |
| Total (Overall) | 149 (51.0%) | 143 (49.0%) |
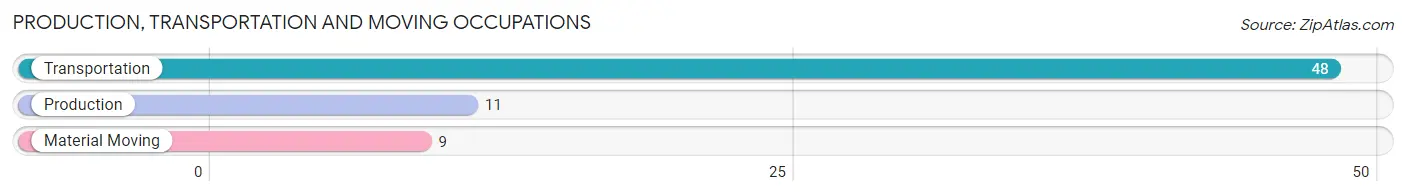
Production, Transportation and Moving Occupations
The most common Production, Transportation and Moving occupations in Au Gres are Transportation (48 | 16.4%), Production (11 | 3.8%), and Material Moving (9 | 3.1%).
Production, Transportation and Moving Occupations by Sex
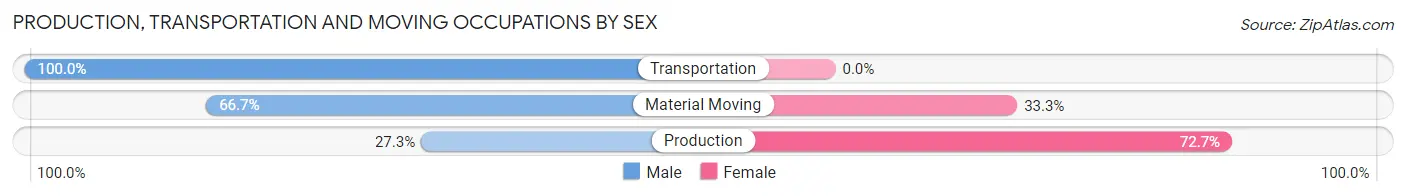
| Occupation | Male | Female |
| Production | 3 (27.3%) | 8 (72.7%) |
| Transportation | 48 (100.0%) | 0 (0.0%) |
| Material Moving | 6 (66.7%) | 3 (33.3%) |
| Total (Category) | 57 (83.8%) | 11 (16.2%) |
| Total (Overall) | 149 (51.0%) | 143 (49.0%) |
Employment Industries by Sex in Au Gres
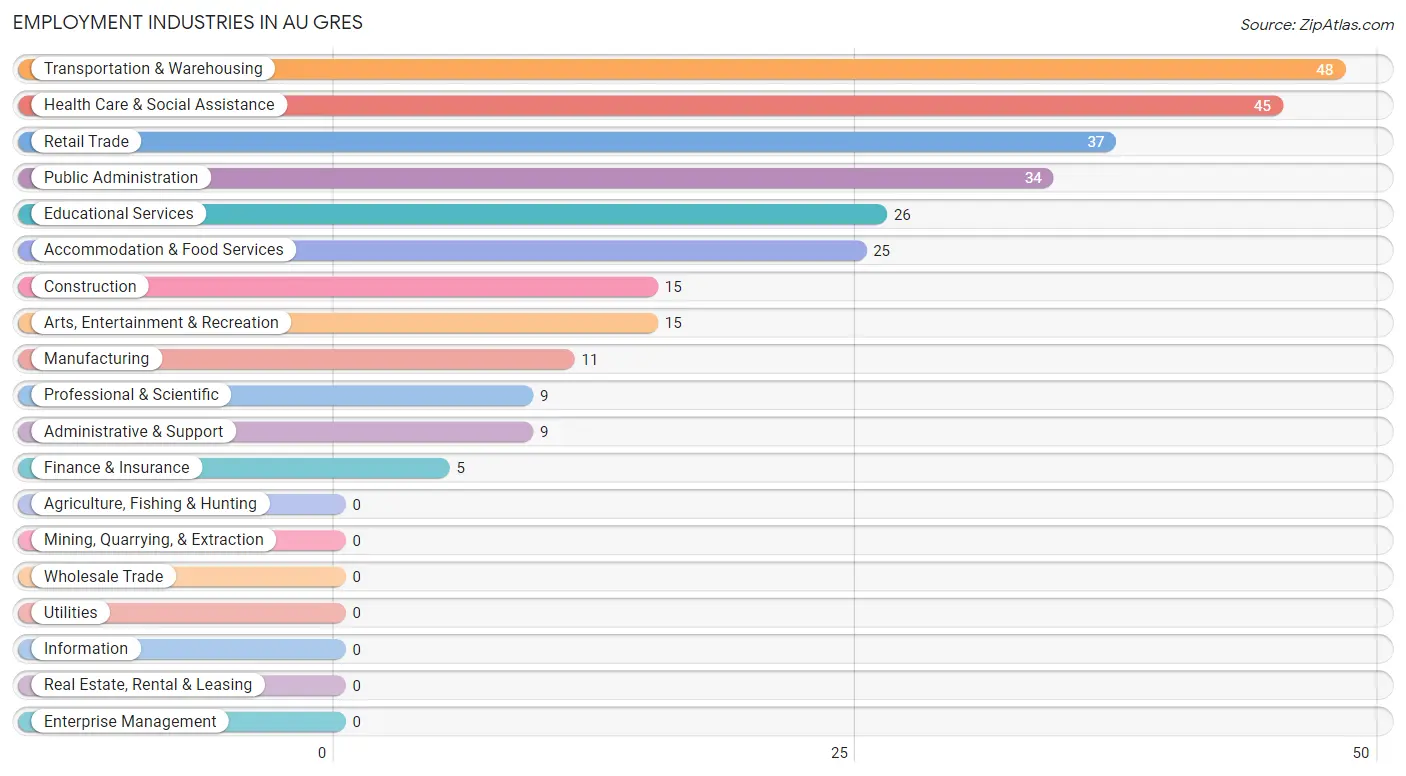
Employment Industries in Au Gres
The major employment industries in Au Gres include Transportation & Warehousing (48 | 16.4%), Health Care & Social Assistance (45 | 15.4%), Retail Trade (37 | 12.7%), Public Administration (34 | 11.6%), and Educational Services (26 | 8.9%).
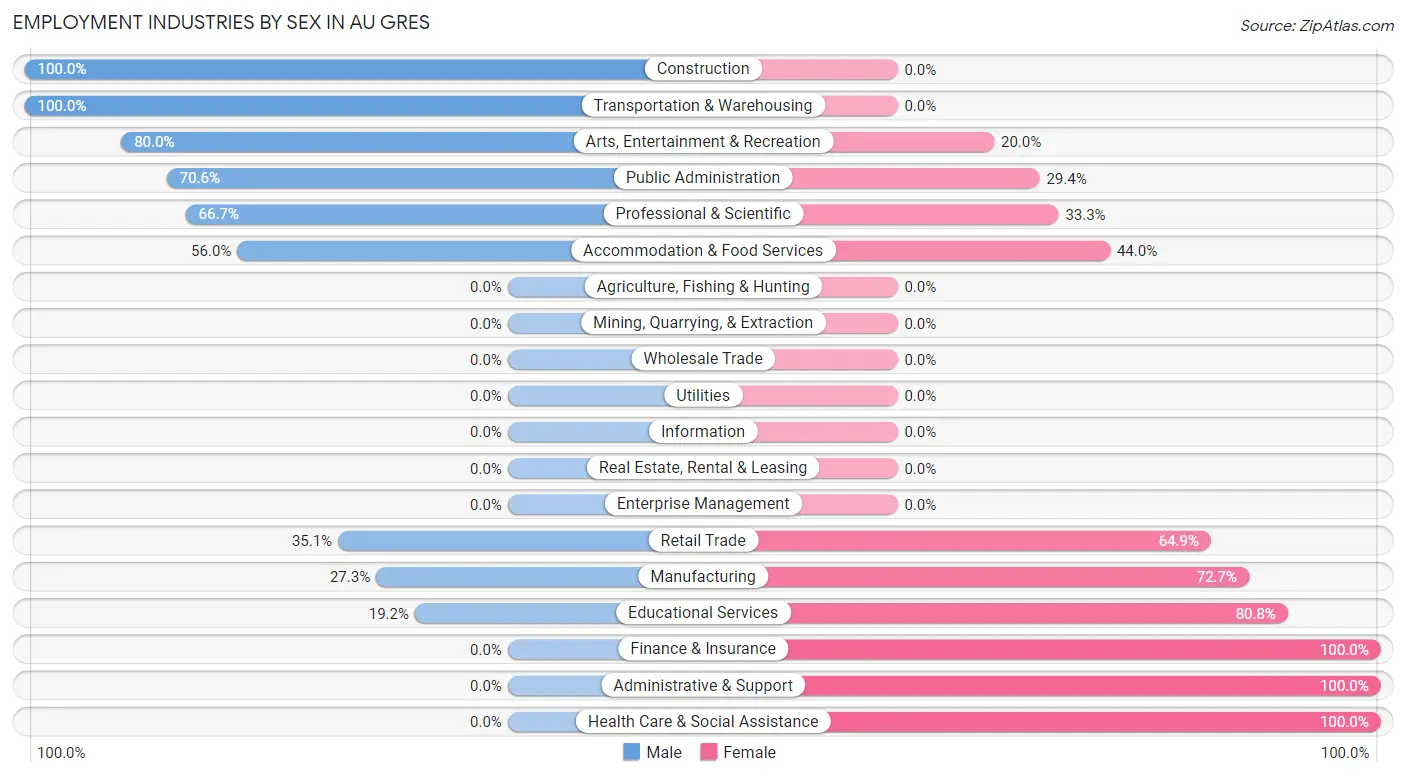
Employment Industries by Sex in Au Gres
The Au Gres industries that see more men than women are Construction (100.0%), Transportation & Warehousing (100.0%), and Arts, Entertainment & Recreation (80.0%), whereas the industries that tend to have a higher number of women are Finance & Insurance (100.0%), Administrative & Support (100.0%), and Health Care & Social Assistance (100.0%).
| Industry | Male | Female |
| Agriculture, Fishing & Hunting | 0 (0.0%) | 0 (0.0%) |
| Mining, Quarrying, & Extraction | 0 (0.0%) | 0 (0.0%) |
| Construction | 15 (100.0%) | 0 (0.0%) |
| Manufacturing | 3 (27.3%) | 8 (72.7%) |
| Wholesale Trade | 0 (0.0%) | 0 (0.0%) |
| Retail Trade | 13 (35.1%) | 24 (64.9%) |
| Transportation & Warehousing | 48 (100.0%) | 0 (0.0%) |
| Utilities | 0 (0.0%) | 0 (0.0%) |
| Information | 0 (0.0%) | 0 (0.0%) |
| Finance & Insurance | 0 (0.0%) | 5 (100.0%) |
| Real Estate, Rental & Leasing | 0 (0.0%) | 0 (0.0%) |
| Professional & Scientific | 6 (66.7%) | 3 (33.3%) |
| Enterprise Management | 0 (0.0%) | 0 (0.0%) |
| Administrative & Support | 0 (0.0%) | 9 (100.0%) |
| Educational Services | 5 (19.2%) | 21 (80.8%) |
| Health Care & Social Assistance | 0 (0.0%) | 45 (100.0%) |
| Arts, Entertainment & Recreation | 12 (80.0%) | 3 (20.0%) |
| Accommodation & Food Services | 14 (56.0%) | 11 (44.0%) |
| Public Administration | 24 (70.6%) | 10 (29.4%) |
| Total | 149 (51.0%) | 143 (49.0%) |
Education in Au Gres
School Enrollment in Au Gres
The most common levels of schooling among the 158 students in Au Gres are middle school (56 | 35.4%), high school (43 | 27.2%), and elementary school (24 | 15.2%).
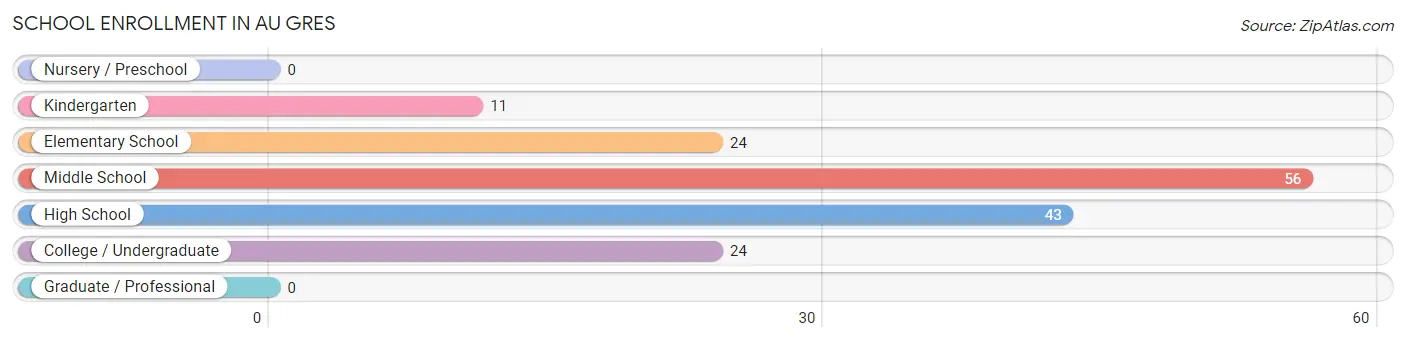
| School Level | # Students | % Students |
| Nursery / Preschool | 0 | 0.0% |
| Kindergarten | 11 | 7.0% |
| Elementary School | 24 | 15.2% |
| Middle School | 56 | 35.4% |
| High School | 43 | 27.2% |
| College / Undergraduate | 24 | 15.2% |
| Graduate / Professional | 0 | 0.0% |
| Total | 158 | 100.0% |
School Enrollment by Age by Funding Source in Au Gres
Out of a total of 158 students who are enrolled in schools in Au Gres, 21 (13.3%) attend a private institution, while the remaining 137 (86.7%) are enrolled in public schools. The age group of 5 to 9 year old has the highest likelihood of being enrolled in private schools, with 12 (34.3% in the age bracket) enrolled. Conversely, the age group of 15 to 17 year olds has the lowest likelihood of being enrolled in a private school, with 17 (100.0% in the age bracket) attending a public institution.
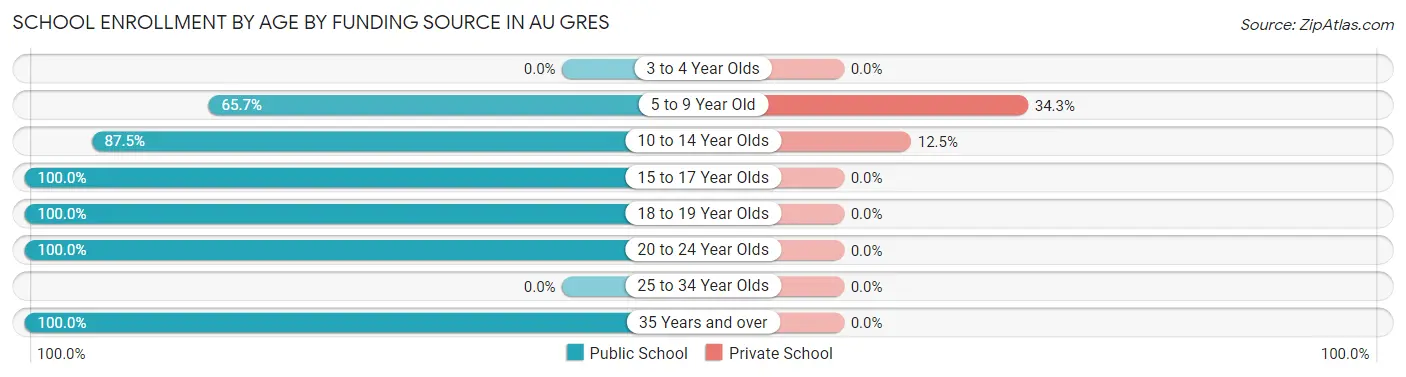
| Age Bracket | Public School | Private School |
| 3 to 4 Year Olds | 0 (0.0%) | 0 (0.0%) |
| 5 to 9 Year Old | 23 (65.7%) | 12 (34.3%) |
| 10 to 14 Year Olds | 63 (87.5%) | 9 (12.5%) |
| 15 to 17 Year Olds | 17 (100.0%) | 0 (0.0%) |
| 18 to 19 Year Olds | 10 (100.0%) | 0 (0.0%) |
| 20 to 24 Year Olds | 13 (100.0%) | 0 (0.0%) |
| 25 to 34 Year Olds | 0 (0.0%) | 0 (0.0%) |
| 35 Years and over | 11 (100.0%) | 0 (0.0%) |
| Total | 137 (86.7%) | 21 (13.3%) |
Educational Attainment by Field of Study in Au Gres
Business (27 | 23.1%), education (22 | 18.8%), science & technology (19 | 16.2%), arts & humanities (11 | 9.4%), and psychology (10 | 8.6%) are the most common fields of study among 117 individuals in Au Gres who have obtained a bachelor's degree or higher.
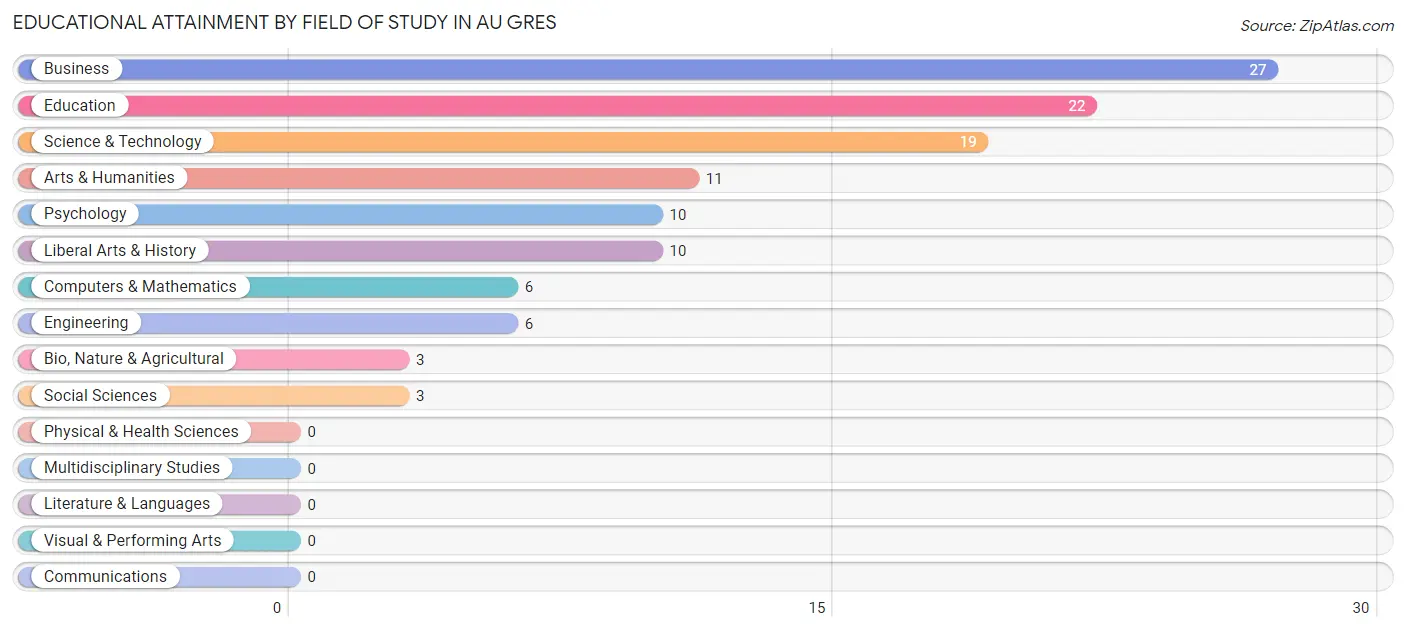
| Field of Study | # Graduates | % Graduates |
| Computers & Mathematics | 6 | 5.1% |
| Bio, Nature & Agricultural | 3 | 2.6% |
| Physical & Health Sciences | 0 | 0.0% |
| Psychology | 10 | 8.6% |
| Social Sciences | 3 | 2.6% |
| Engineering | 6 | 5.1% |
| Multidisciplinary Studies | 0 | 0.0% |
| Science & Technology | 19 | 16.2% |
| Business | 27 | 23.1% |
| Education | 22 | 18.8% |
| Literature & Languages | 0 | 0.0% |
| Liberal Arts & History | 10 | 8.6% |
| Visual & Performing Arts | 0 | 0.0% |
| Communications | 0 | 0.0% |
| Arts & Humanities | 11 | 9.4% |
| Total | 117 | 100.0% |
Transportation & Commute in Au Gres
Vehicle Availability by Sex in Au Gres
The most prevalent vehicle ownership categories in Au Gres are males with 2 vehicles (79, accounting for 55.2%) and females with 2 vehicles (56, making up 55.2%).
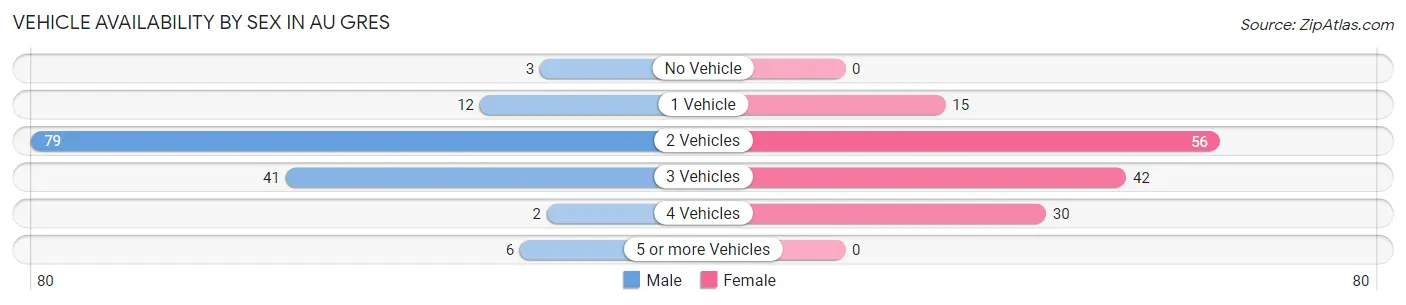
| Vehicles Available | Male | Female |
| No Vehicle | 3 (2.1%) | 0 (0.0%) |
| 1 Vehicle | 12 (8.4%) | 15 (10.5%) |
| 2 Vehicles | 79 (55.2%) | 56 (39.2%) |
| 3 Vehicles | 41 (28.7%) | 42 (29.4%) |
| 4 Vehicles | 2 (1.4%) | 30 (21.0%) |
| 5 or more Vehicles | 6 (4.2%) | 0 (0.0%) |
| Total | 143 (100.0%) | 143 (100.0%) |
Commute Time in Au Gres
The most frequently occuring commute durations in Au Gres are 30 to 34 minutes (70 commuters, 25.3%), 60 to 89 minutes (69 commuters, 24.9%), and less than 5 minutes (38 commuters, 13.7%).
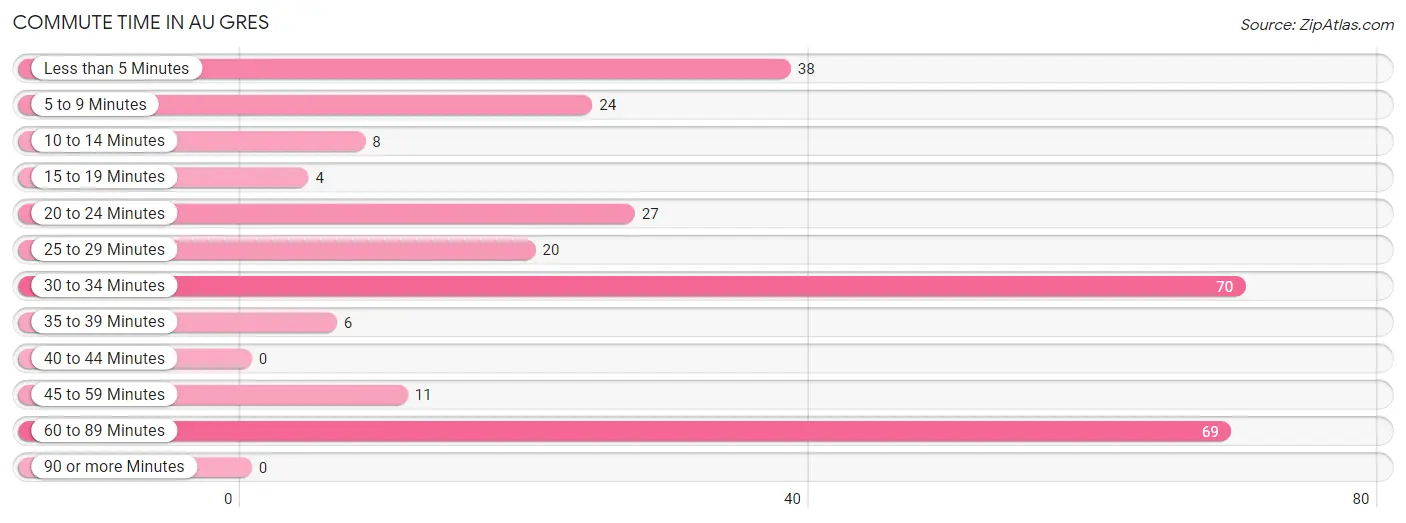
| Commute Time | # Commuters | % Commuters |
| Less than 5 Minutes | 38 | 13.7% |
| 5 to 9 Minutes | 24 | 8.7% |
| 10 to 14 Minutes | 8 | 2.9% |
| 15 to 19 Minutes | 4 | 1.4% |
| 20 to 24 Minutes | 27 | 9.8% |
| 25 to 29 Minutes | 20 | 7.2% |
| 30 to 34 Minutes | 70 | 25.3% |
| 35 to 39 Minutes | 6 | 2.2% |
| 40 to 44 Minutes | 0 | 0.0% |
| 45 to 59 Minutes | 11 | 4.0% |
| 60 to 89 Minutes | 69 | 24.9% |
| 90 or more Minutes | 0 | 0.0% |
Commute Time by Sex in Au Gres
The most common commute times in Au Gres are 60 to 89 minutes (55 commuters, 40.4%) for males and 30 to 34 minutes (48 commuters, 34.0%) for females.
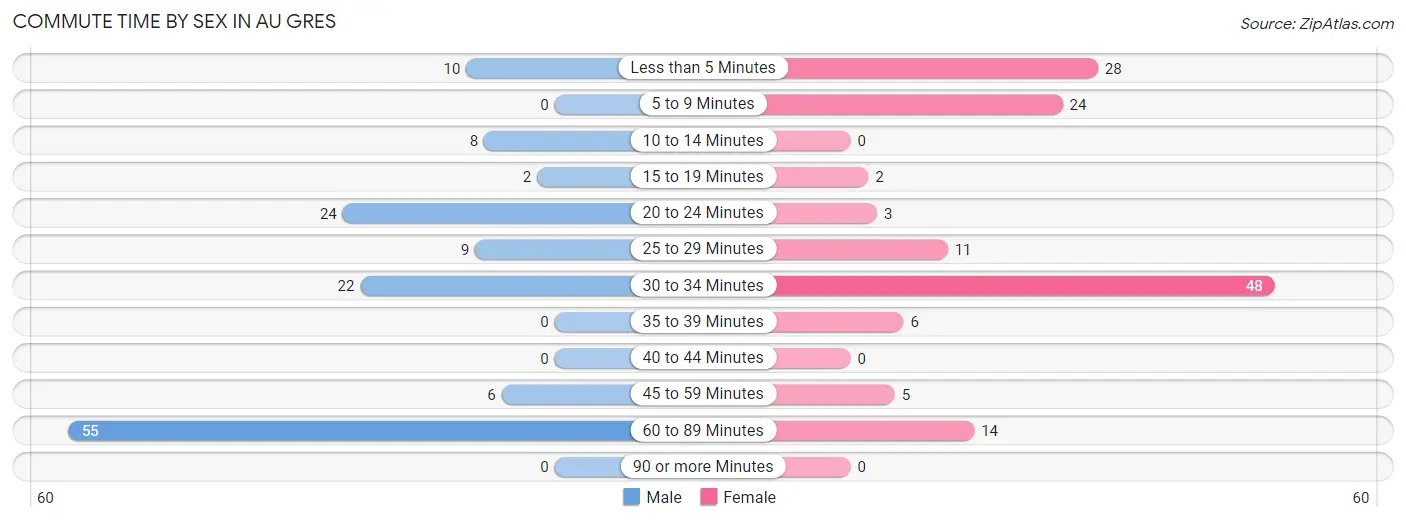
| Commute Time | Male | Female |
| Less than 5 Minutes | 10 (7.3%) | 28 (19.9%) |
| 5 to 9 Minutes | 0 (0.0%) | 24 (17.0%) |
| 10 to 14 Minutes | 8 (5.9%) | 0 (0.0%) |
| 15 to 19 Minutes | 2 (1.5%) | 2 (1.4%) |
| 20 to 24 Minutes | 24 (17.6%) | 3 (2.1%) |
| 25 to 29 Minutes | 9 (6.6%) | 11 (7.8%) |
| 30 to 34 Minutes | 22 (16.2%) | 48 (34.0%) |
| 35 to 39 Minutes | 0 (0.0%) | 6 (4.3%) |
| 40 to 44 Minutes | 0 (0.0%) | 0 (0.0%) |
| 45 to 59 Minutes | 6 (4.4%) | 5 (3.5%) |
| 60 to 89 Minutes | 55 (40.4%) | 14 (9.9%) |
| 90 or more Minutes | 0 (0.0%) | 0 (0.0%) |
Time of Departure to Work by Sex in Au Gres
The most frequent times of departure to work in Au Gres are 10:00 AM to 10:59 AM (48, 35.3%) for males and 7:30 AM to 7:59 AM (29, 20.6%) for females.
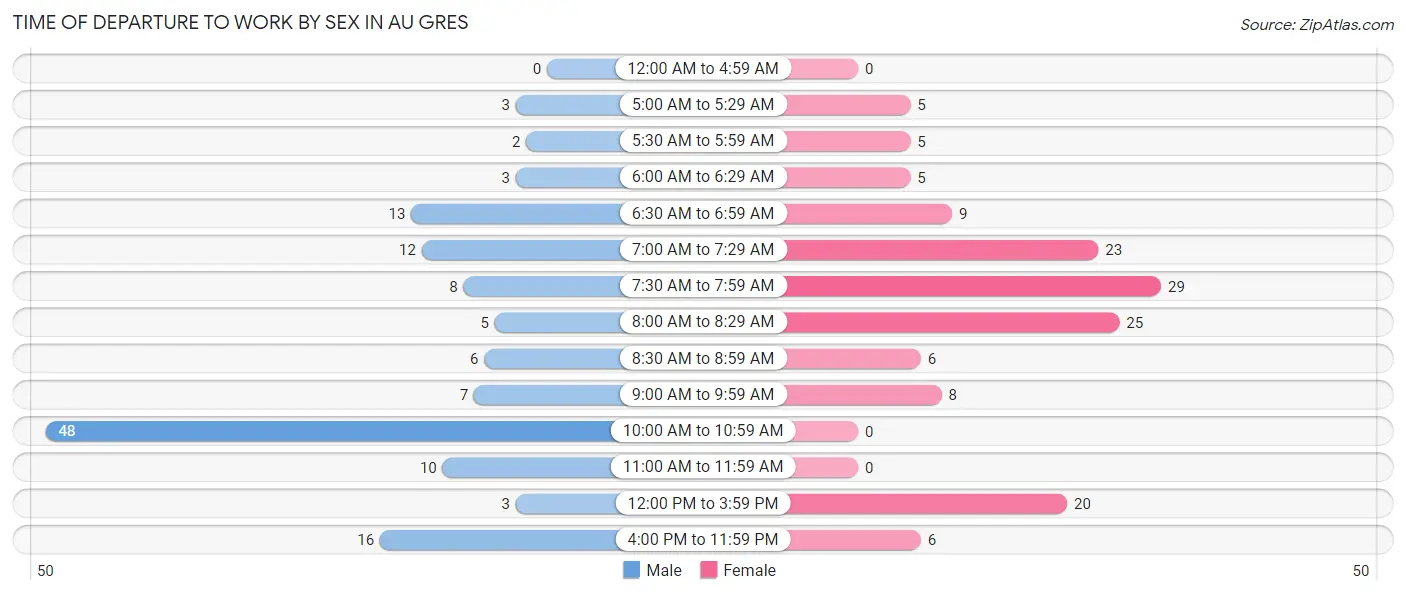
| Time of Departure | Male | Female |
| 12:00 AM to 4:59 AM | 0 (0.0%) | 0 (0.0%) |
| 5:00 AM to 5:29 AM | 3 (2.2%) | 5 (3.5%) |
| 5:30 AM to 5:59 AM | 2 (1.5%) | 5 (3.5%) |
| 6:00 AM to 6:29 AM | 3 (2.2%) | 5 (3.5%) |
| 6:30 AM to 6:59 AM | 13 (9.6%) | 9 (6.4%) |
| 7:00 AM to 7:29 AM | 12 (8.8%) | 23 (16.3%) |
| 7:30 AM to 7:59 AM | 8 (5.9%) | 29 (20.6%) |
| 8:00 AM to 8:29 AM | 5 (3.7%) | 25 (17.7%) |
| 8:30 AM to 8:59 AM | 6 (4.4%) | 6 (4.3%) |
| 9:00 AM to 9:59 AM | 7 (5.1%) | 8 (5.7%) |
| 10:00 AM to 10:59 AM | 48 (35.3%) | 0 (0.0%) |
| 11:00 AM to 11:59 AM | 10 (7.3%) | 0 (0.0%) |
| 12:00 PM to 3:59 PM | 3 (2.2%) | 20 (14.2%) |
| 4:00 PM to 11:59 PM | 16 (11.8%) | 6 (4.3%) |
| Total | 136 (100.0%) | 141 (100.0%) |
Housing Occupancy in Au Gres
Occupancy by Ownership in Au Gres
Of the total 453 dwellings in Au Gres, owner-occupied units account for 338 (74.6%), while renter-occupied units make up 115 (25.4%).
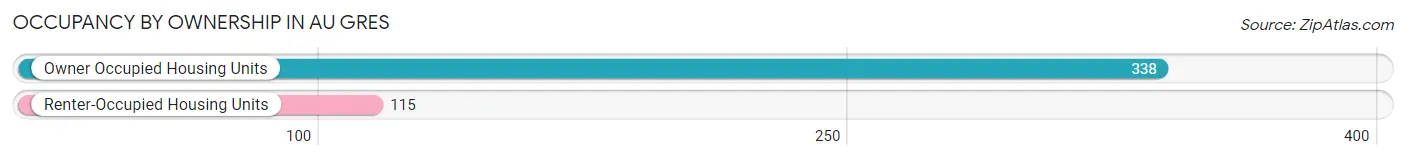
| Occupancy | # Housing Units | % Housing Units |
| Owner Occupied Housing Units | 338 | 74.6% |
| Renter-Occupied Housing Units | 115 | 25.4% |
| Total Occupied Housing Units | 453 | 100.0% |
Occupancy by Household Size in Au Gres
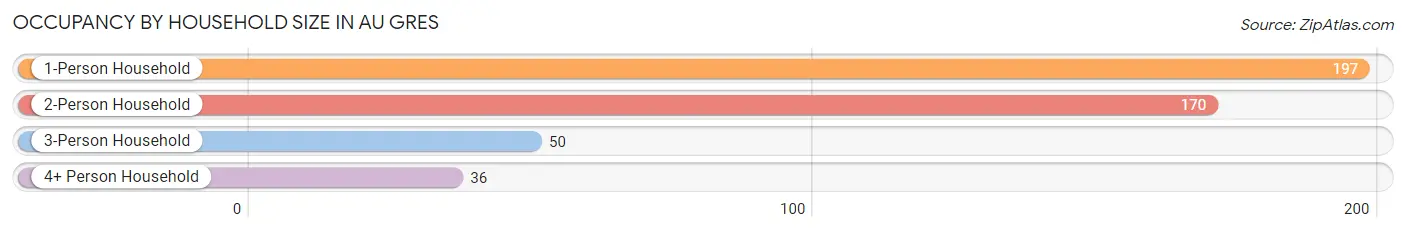
| Household Size | # Housing Units | % Housing Units |
| 1-Person Household | 197 | 43.5% |
| 2-Person Household | 170 | 37.5% |
| 3-Person Household | 50 | 11.0% |
| 4+ Person Household | 36 | 8.0% |
| Total Housing Units | 453 | 100.0% |
Occupancy by Ownership by Household Size in Au Gres
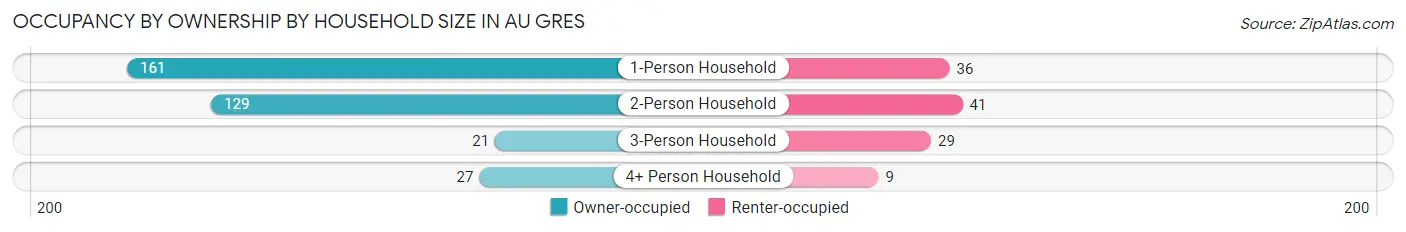
| Household Size | Owner-occupied | Renter-occupied |
| 1-Person Household | 161 (81.7%) | 36 (18.3%) |
| 2-Person Household | 129 (75.9%) | 41 (24.1%) |
| 3-Person Household | 21 (42.0%) | 29 (58.0%) |
| 4+ Person Household | 27 (75.0%) | 9 (25.0%) |
| Total Housing Units | 338 (74.6%) | 115 (25.4%) |
Occupancy by Educational Attainment in Au Gres
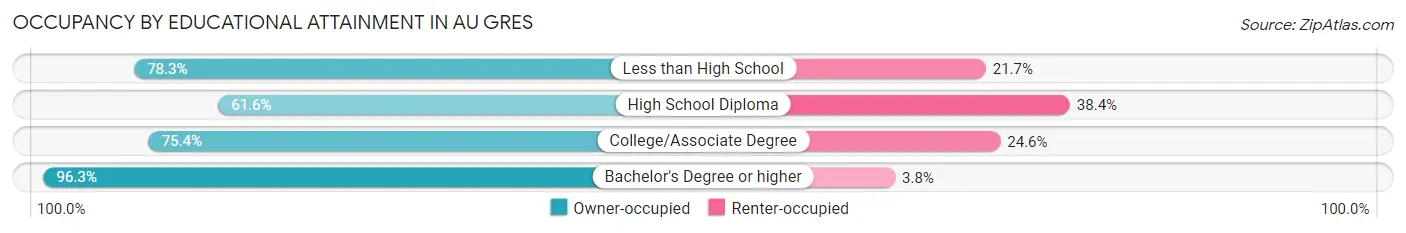
| Household Size | Owner-occupied | Renter-occupied |
| Less than High School | 18 (78.3%) | 5 (21.7%) |
| High School Diploma | 93 (61.6%) | 58 (38.4%) |
| College/Associate Degree | 150 (75.4%) | 49 (24.6%) |
| Bachelor's Degree or higher | 77 (96.3%) | 3 (3.7%) |
Occupancy by Age of Householder in Au Gres
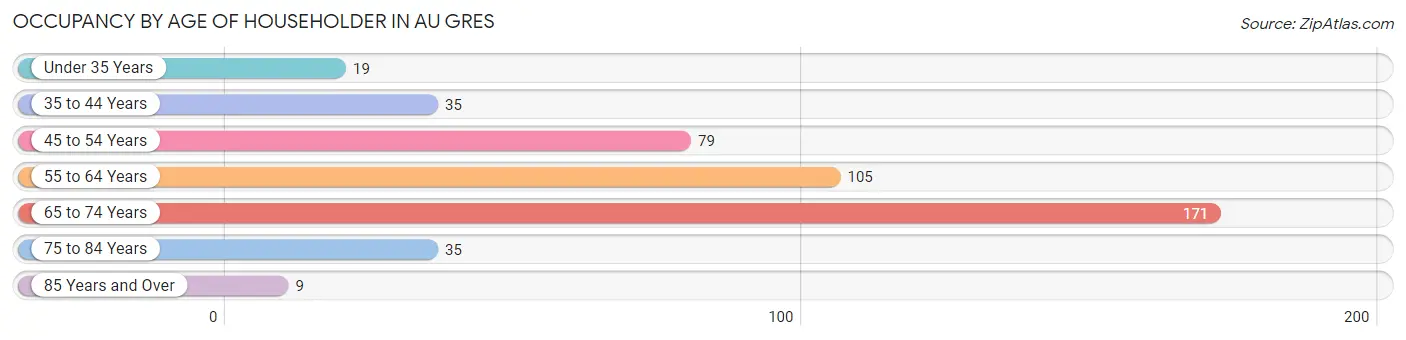
| Age Bracket | # Households | % Households |
| Under 35 Years | 19 | 4.2% |
| 35 to 44 Years | 35 | 7.7% |
| 45 to 54 Years | 79 | 17.4% |
| 55 to 64 Years | 105 | 23.2% |
| 65 to 74 Years | 171 | 37.8% |
| 75 to 84 Years | 35 | 7.7% |
| 85 Years and Over | 9 | 2.0% |
| Total | 453 | 100.0% |
Housing Finances in Au Gres
Median Income by Occupancy in Au Gres
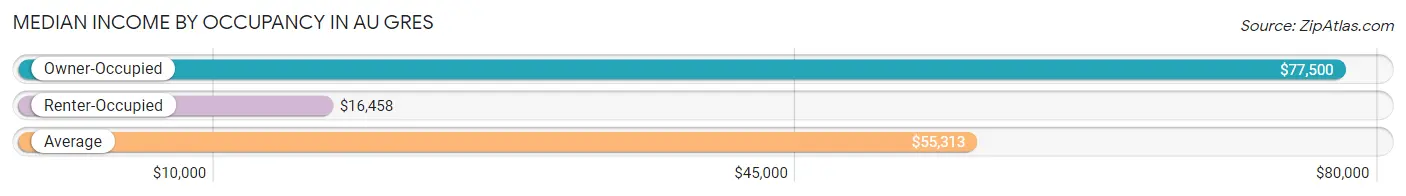
| Occupancy Type | # Households | Median Income |
| Owner-Occupied | 338 (74.6%) | $77,500 |
| Renter-Occupied | 115 (25.4%) | $16,458 |
| Average | 453 (100.0%) | $55,313 |
Occupancy by Householder Income Bracket in Au Gres
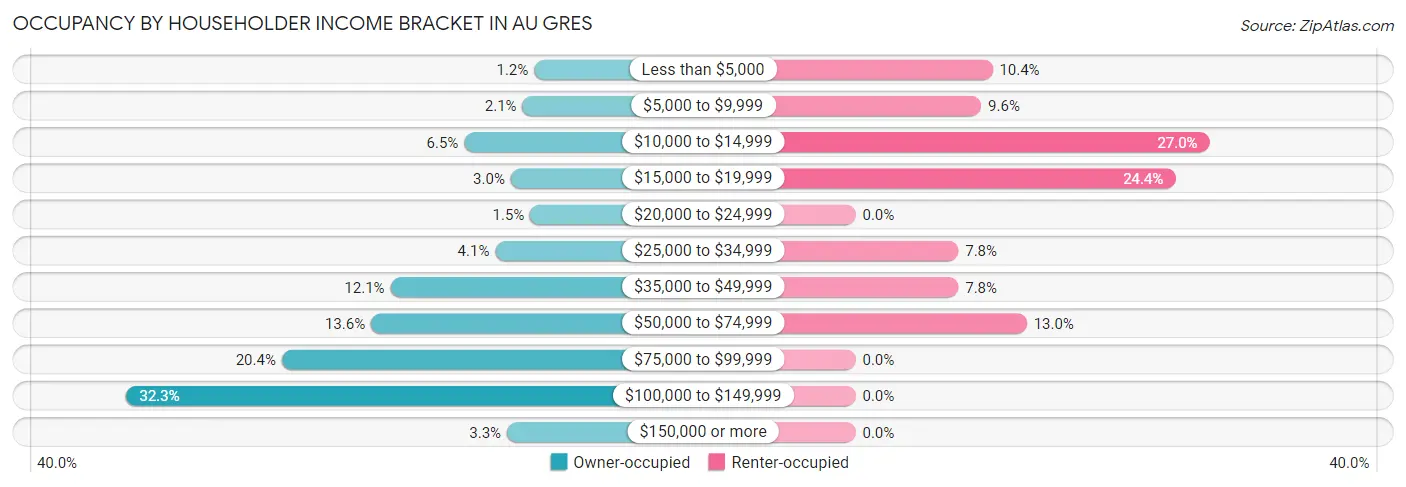
| Income Bracket | Owner-occupied | Renter-occupied |
| Less than $5,000 | 4 (1.2%) | 12 (10.4%) |
| $5,000 to $9,999 | 7 (2.1%) | 11 (9.6%) |
| $10,000 to $14,999 | 22 (6.5%) | 31 (27.0%) |
| $15,000 to $19,999 | 10 (3.0%) | 28 (24.3%) |
| $20,000 to $24,999 | 5 (1.5%) | 0 (0.0%) |
| $25,000 to $34,999 | 14 (4.1%) | 9 (7.8%) |
| $35,000 to $49,999 | 41 (12.1%) | 9 (7.8%) |
| $50,000 to $74,999 | 46 (13.6%) | 15 (13.0%) |
| $75,000 to $99,999 | 69 (20.4%) | 0 (0.0%) |
| $100,000 to $149,999 | 109 (32.3%) | 0 (0.0%) |
| $150,000 or more | 11 (3.3%) | 0 (0.0%) |
| Total | 338 (100.0%) | 115 (100.0%) |
Monthly Housing Cost Tiers in Au Gres
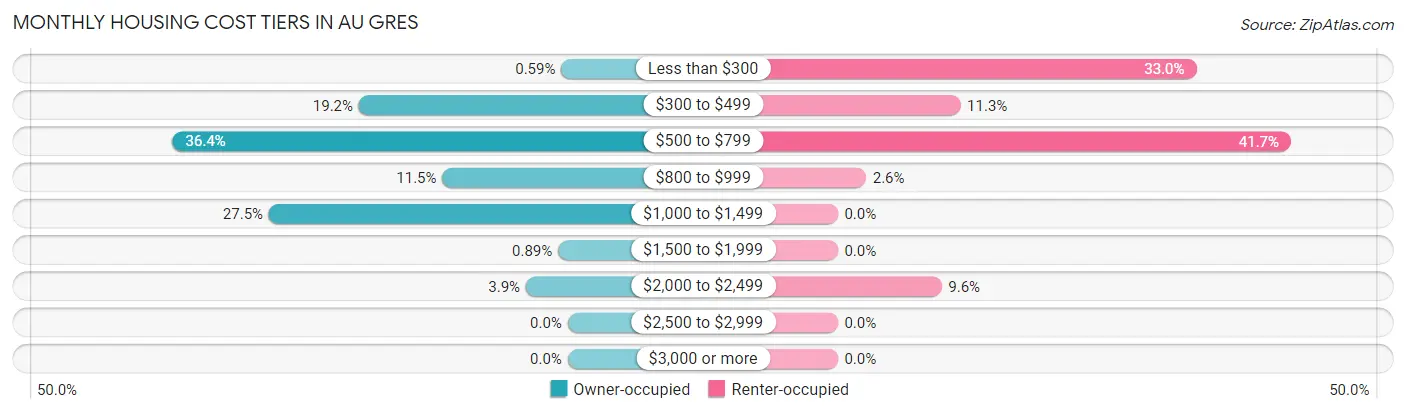
| Monthly Cost | Owner-occupied | Renter-occupied |
| Less than $300 | 2 (0.6%) | 38 (33.0%) |
| $300 to $499 | 65 (19.2%) | 13 (11.3%) |
| $500 to $799 | 123 (36.4%) | 48 (41.7%) |
| $800 to $999 | 39 (11.5%) | 3 (2.6%) |
| $1,000 to $1,499 | 93 (27.5%) | 0 (0.0%) |
| $1,500 to $1,999 | 3 (0.9%) | 0 (0.0%) |
| $2,000 to $2,499 | 13 (3.8%) | 11 (9.6%) |
| $2,500 to $2,999 | 0 (0.0%) | 0 (0.0%) |
| $3,000 or more | 0 (0.0%) | 0 (0.0%) |
| Total | 338 (100.0%) | 115 (100.0%) |
Physical Housing Characteristics in Au Gres
Housing Structures in Au Gres
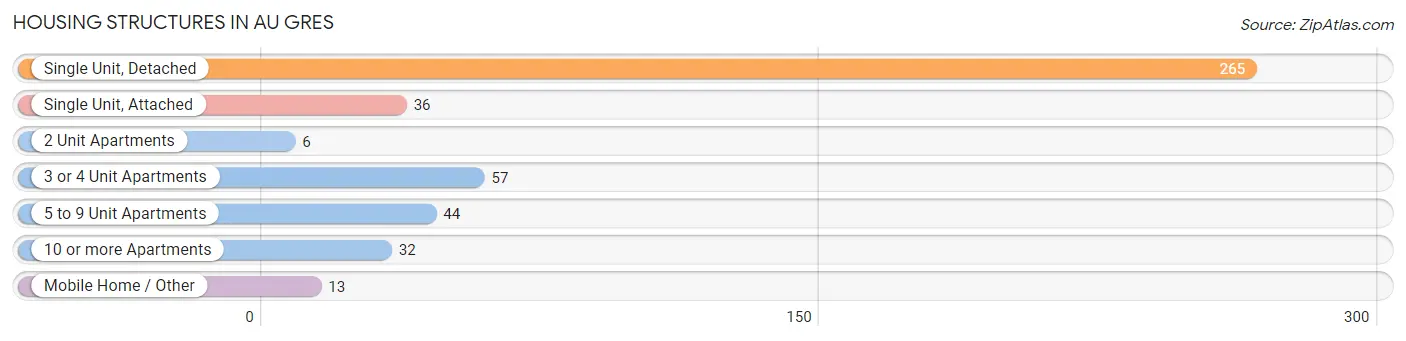
| Structure Type | # Housing Units | % Housing Units |
| Single Unit, Detached | 265 | 58.5% |
| Single Unit, Attached | 36 | 8.0% |
| 2 Unit Apartments | 6 | 1.3% |
| 3 or 4 Unit Apartments | 57 | 12.6% |
| 5 to 9 Unit Apartments | 44 | 9.7% |
| 10 or more Apartments | 32 | 7.1% |
| Mobile Home / Other | 13 | 2.9% |
| Total | 453 | 100.0% |
Housing Structures by Occupancy in Au Gres

| Structure Type | Owner-occupied | Renter-occupied |
| Single Unit, Detached | 260 (98.1%) | 5 (1.9%) |
| Single Unit, Attached | 22 (61.1%) | 14 (38.9%) |
| 2 Unit Apartments | 0 (0.0%) | 6 (100.0%) |
| 3 or 4 Unit Apartments | 43 (75.4%) | 14 (24.6%) |
| 5 to 9 Unit Apartments | 0 (0.0%) | 44 (100.0%) |
| 10 or more Apartments | 0 (0.0%) | 32 (100.0%) |
| Mobile Home / Other | 13 (100.0%) | 0 (0.0%) |
| Total | 338 (74.6%) | 115 (25.4%) |
Housing Structures by Number of Rooms in Au Gres
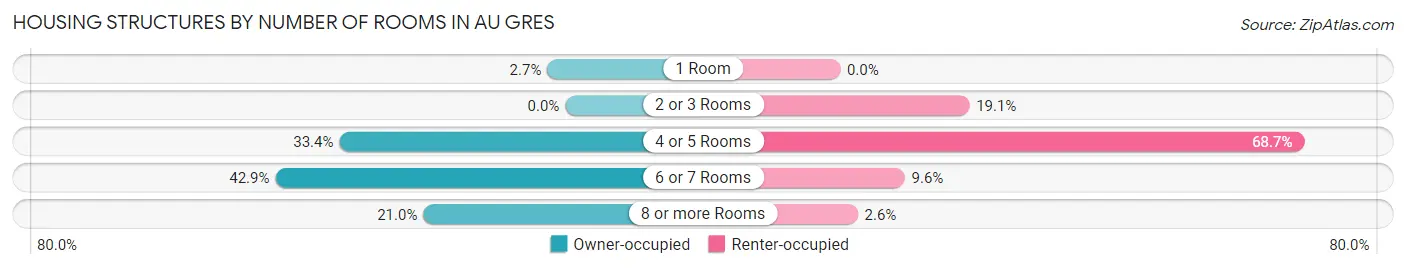
| Number of Rooms | Owner-occupied | Renter-occupied |
| 1 Room | 9 (2.7%) | 0 (0.0%) |
| 2 or 3 Rooms | 0 (0.0%) | 22 (19.1%) |
| 4 or 5 Rooms | 113 (33.4%) | 79 (68.7%) |
| 6 or 7 Rooms | 145 (42.9%) | 11 (9.6%) |
| 8 or more Rooms | 71 (21.0%) | 3 (2.6%) |
| Total | 338 (100.0%) | 115 (100.0%) |
Housing Structure by Heating Type in Au Gres
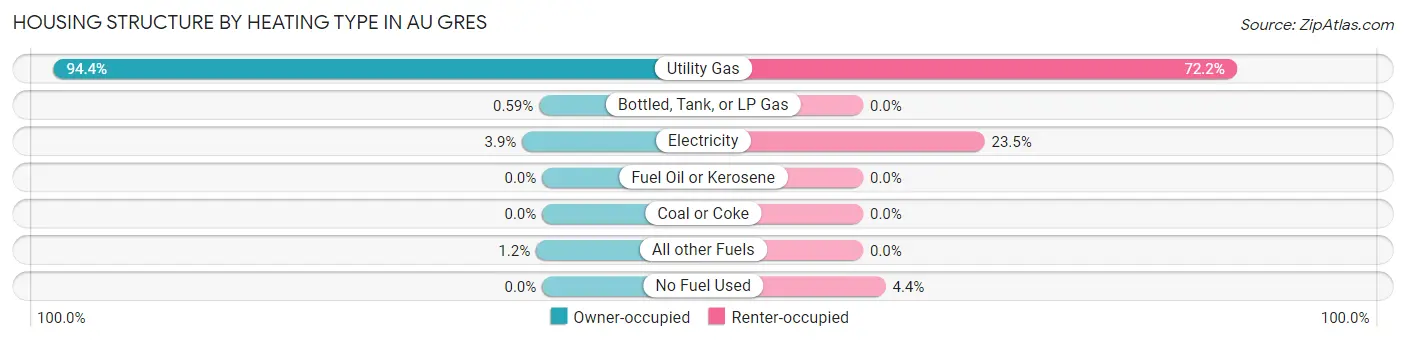
| Heating Type | Owner-occupied | Renter-occupied |
| Utility Gas | 319 (94.4%) | 83 (72.2%) |
| Bottled, Tank, or LP Gas | 2 (0.6%) | 0 (0.0%) |
| Electricity | 13 (3.8%) | 27 (23.5%) |
| Fuel Oil or Kerosene | 0 (0.0%) | 0 (0.0%) |
| Coal or Coke | 0 (0.0%) | 0 (0.0%) |
| All other Fuels | 4 (1.2%) | 0 (0.0%) |
| No Fuel Used | 0 (0.0%) | 5 (4.3%) |
| Total | 338 (100.0%) | 115 (100.0%) |
Household Vehicle Usage in Au Gres
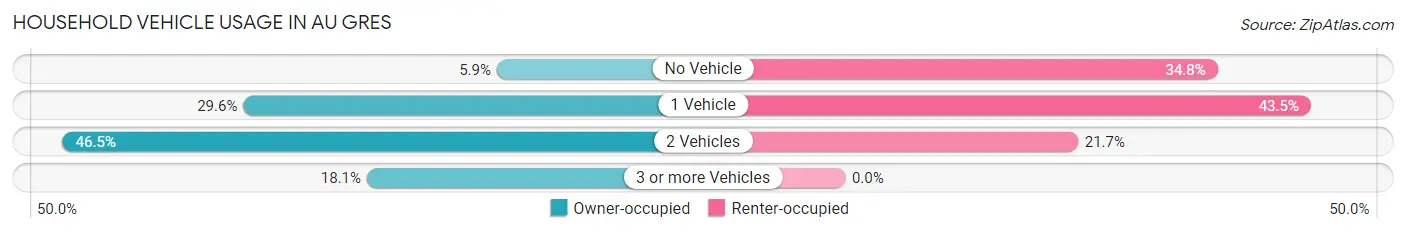
| Vehicles per Household | Owner-occupied | Renter-occupied |
| No Vehicle | 20 (5.9%) | 40 (34.8%) |
| 1 Vehicle | 100 (29.6%) | 50 (43.5%) |
| 2 Vehicles | 157 (46.5%) | 25 (21.7%) |
| 3 or more Vehicles | 61 (18.0%) | 0 (0.0%) |
| Total | 338 (100.0%) | 115 (100.0%) |
Real Estate & Mortgages in Au Gres
Real Estate and Mortgage Overview in Au Gres
| Characteristic | Without Mortgage | With Mortgage |
| Housing Units | 130 | 208 |
| Median Property Value | $133,800 | $135,800 |
| Median Household Income | $46,563 | $2 |
| Monthly Housing Costs | $494 | $0 |
| Real Estate Taxes | $1,974 | $10 |
Property Value by Mortgage Status in Au Gres
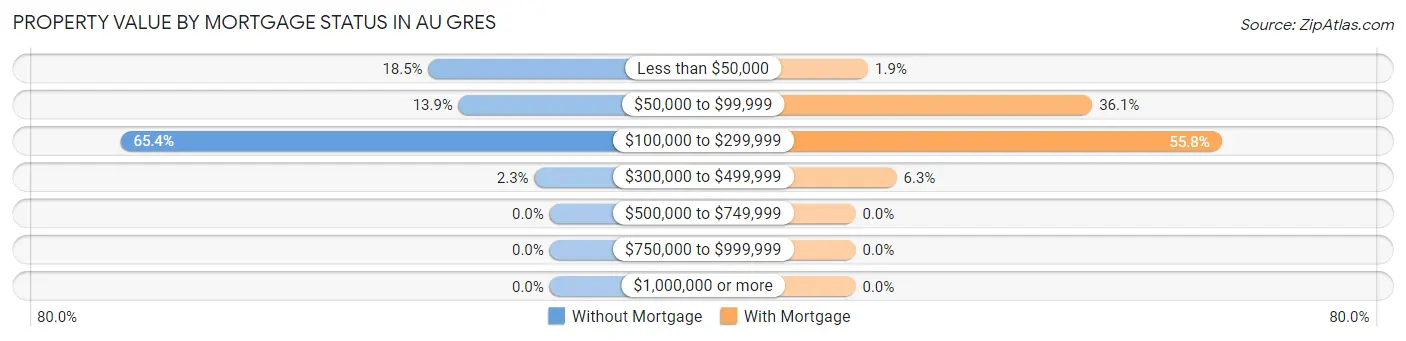
| Property Value | Without Mortgage | With Mortgage |
| Less than $50,000 | 24 (18.5%) | 4 (1.9%) |
| $50,000 to $99,999 | 18 (13.9%) | 75 (36.1%) |
| $100,000 to $299,999 | 85 (65.4%) | 116 (55.8%) |
| $300,000 to $499,999 | 3 (2.3%) | 13 (6.2%) |
| $500,000 to $749,999 | 0 (0.0%) | 0 (0.0%) |
| $750,000 to $999,999 | 0 (0.0%) | 0 (0.0%) |
| $1,000,000 or more | 0 (0.0%) | 0 (0.0%) |
| Total | 130 (100.0%) | 208 (100.0%) |
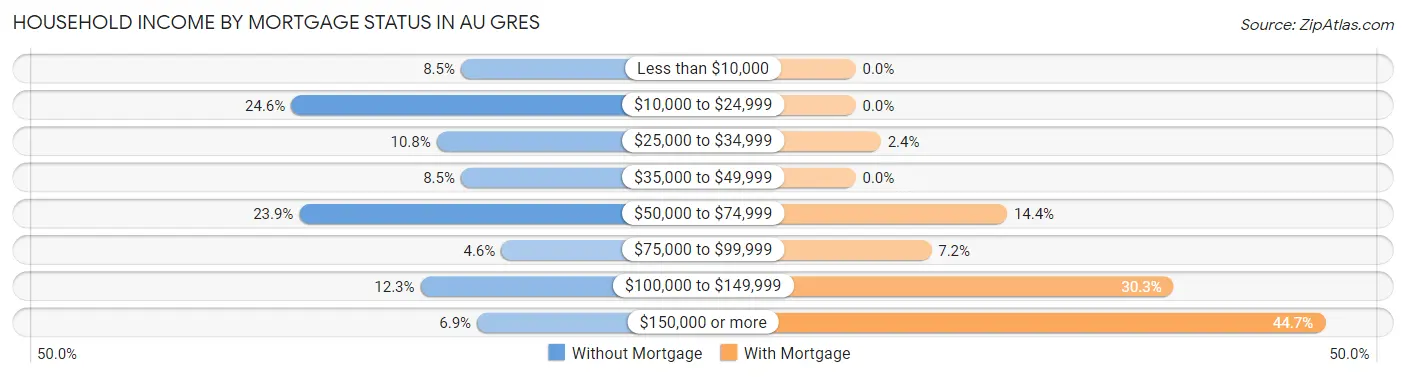
Household Income by Mortgage Status in Au Gres
| Household Income | Without Mortgage | With Mortgage |
| Less than $10,000 | 11 (8.5%) | 0 (0.0%) |
| $10,000 to $24,999 | 32 (24.6%) | 0 (0.0%) |
| $25,000 to $34,999 | 14 (10.8%) | 5 (2.4%) |
| $35,000 to $49,999 | 11 (8.5%) | 0 (0.0%) |
| $50,000 to $74,999 | 31 (23.8%) | 30 (14.4%) |
| $75,000 to $99,999 | 6 (4.6%) | 15 (7.2%) |
| $100,000 to $149,999 | 16 (12.3%) | 63 (30.3%) |
| $150,000 or more | 9 (6.9%) | 93 (44.7%) |
| Total | 130 (100.0%) | 208 (100.0%) |
Property Value to Household Income Ratio in Au Gres
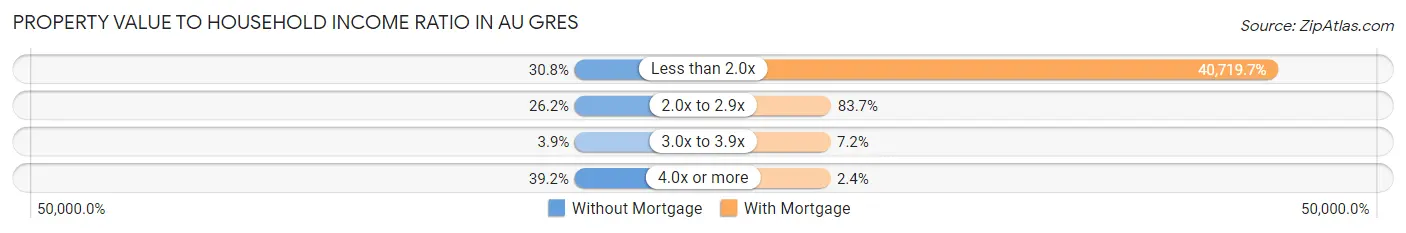
| Value-to-Income Ratio | Without Mortgage | With Mortgage |
| Less than 2.0x | 40 (30.8%) | 84,697 (40,719.7%) |
| 2.0x to 2.9x | 34 (26.2%) | 174 (83.7%) |
| 3.0x to 3.9x | 5 (3.8%) | 15 (7.2%) |
| 4.0x or more | 51 (39.2%) | 5 (2.4%) |
| Total | 130 (100.0%) | 208 (100.0%) |
Real Estate Taxes by Mortgage Status in Au Gres
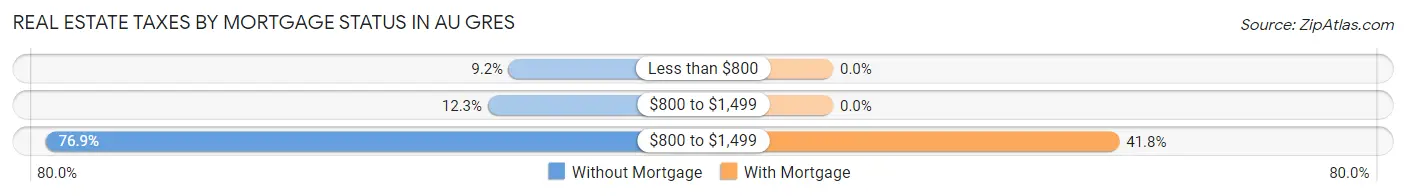
| Property Taxes | Without Mortgage | With Mortgage |
| Less than $800 | 12 (9.2%) | 0 (0.0%) |
| $800 to $1,499 | 16 (12.3%) | 0 (0.0%) |
| $800 to $1,499 | 100 (76.9%) | 87 (41.8%) |
| Total | 130 (100.0%) | 208 (100.0%) |
Health & Disability in Au Gres
Health Insurance Coverage by Age in Au Gres
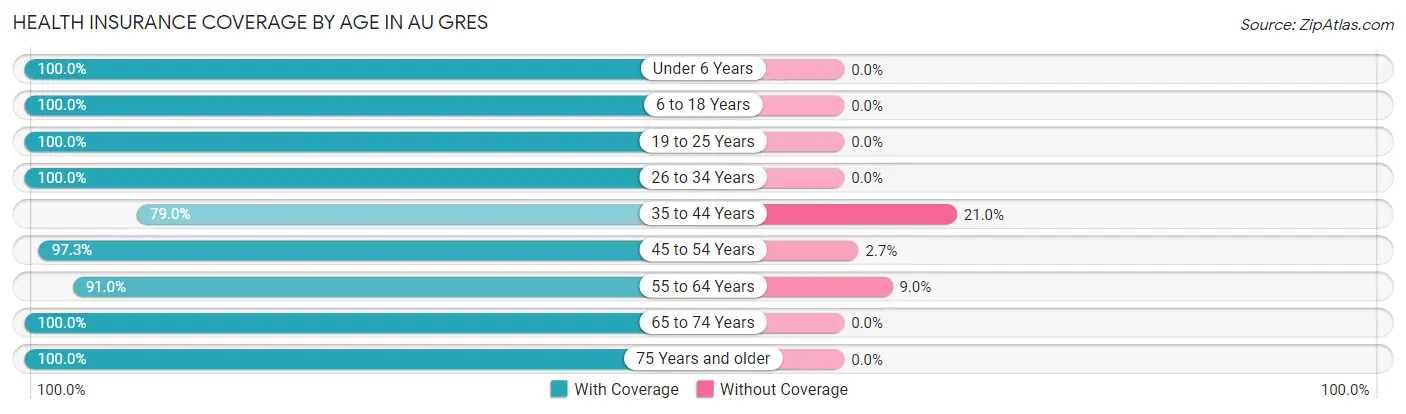
| Age Bracket | With Coverage | Without Coverage |
| Under 6 Years | 3 (100.0%) | 0 (0.0%) |
| 6 to 18 Years | 131 (100.0%) | 0 (0.0%) |
| 19 to 25 Years | 47 (100.0%) | 0 (0.0%) |
| 26 to 34 Years | 45 (100.0%) | 0 (0.0%) |
| 35 to 44 Years | 64 (79.0%) | 17 (21.0%) |
| 45 to 54 Years | 146 (97.3%) | 4 (2.7%) |
| 55 to 64 Years | 152 (91.0%) | 15 (9.0%) |
| 65 to 74 Years | 233 (100.0%) | 0 (0.0%) |
| 75 Years and older | 73 (100.0%) | 0 (0.0%) |
| Total | 894 (96.1%) | 36 (3.9%) |
Health Insurance Coverage by Citizenship Status in Au Gres
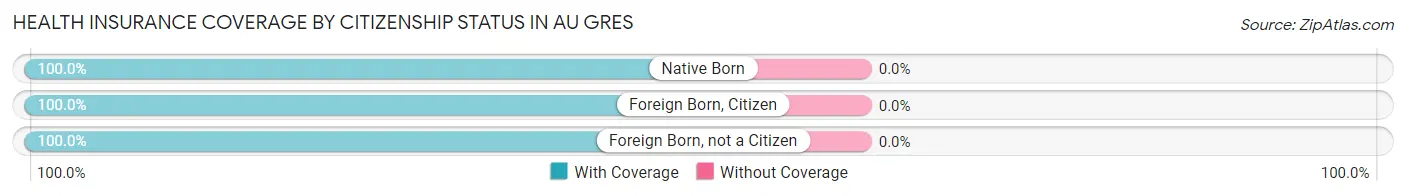
| Citizenship Status | With Coverage | Without Coverage |
| Native Born | 3 (100.0%) | 0 (0.0%) |
| Foreign Born, Citizen | 131 (100.0%) | 0 (0.0%) |
| Foreign Born, not a Citizen | 47 (100.0%) | 0 (0.0%) |
Health Insurance Coverage by Household Income in Au Gres
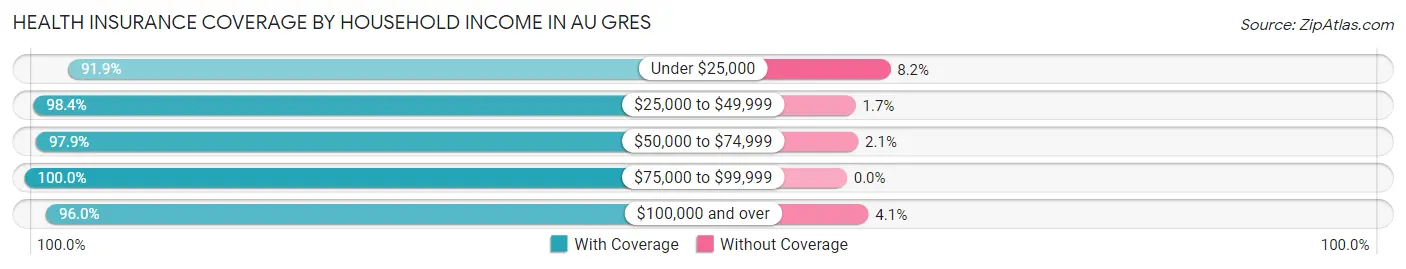
| Household Income | With Coverage | Without Coverage |
| Under $25,000 | 214 (91.8%) | 19 (8.2%) |
| $25,000 to $49,999 | 119 (98.4%) | 2 (1.7%) |
| $50,000 to $74,999 | 138 (97.9%) | 3 (2.1%) |
| $75,000 to $99,999 | 121 (100.0%) | 0 (0.0%) |
| $100,000 and over | 284 (96.0%) | 12 (4.1%) |
Public vs Private Health Insurance Coverage by Age in Au Gres
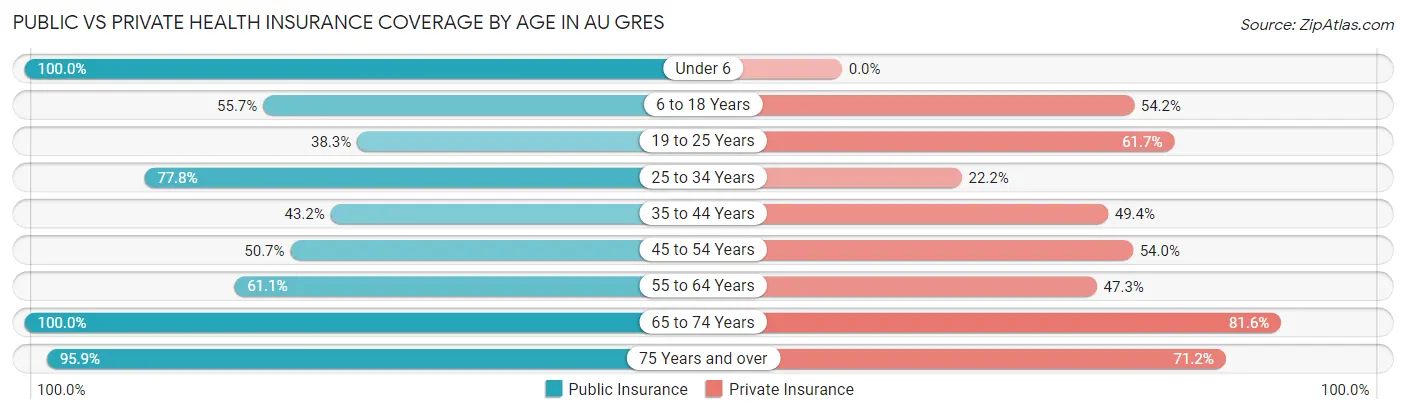
| Age Bracket | Public Insurance | Private Insurance |
| Under 6 | 3 (100.0%) | 0 (0.0%) |
| 6 to 18 Years | 73 (55.7%) | 71 (54.2%) |
| 19 to 25 Years | 18 (38.3%) | 29 (61.7%) |
| 25 to 34 Years | 35 (77.8%) | 10 (22.2%) |
| 35 to 44 Years | 35 (43.2%) | 40 (49.4%) |
| 45 to 54 Years | 76 (50.7%) | 81 (54.0%) |
| 55 to 64 Years | 102 (61.1%) | 79 (47.3%) |
| 65 to 74 Years | 233 (100.0%) | 190 (81.6%) |
| 75 Years and over | 70 (95.9%) | 52 (71.2%) |
| Total | 645 (69.4%) | 552 (59.4%) |
Disability Status by Sex by Age in Au Gres
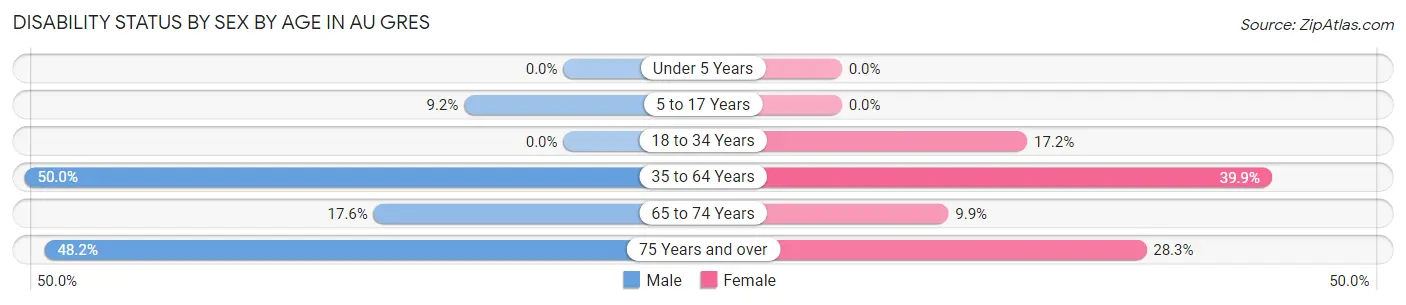
| Age Bracket | Male | Female |
| Under 5 Years | 0 (0.0%) | 0 (0.0%) |
| 5 to 17 Years | 7 (9.2%) | 0 (0.0%) |
| 18 to 34 Years | 0 (0.0%) | 11 (17.2%) |
| 35 to 64 Years | 100 (50.0%) | 79 (39.9%) |
| 65 to 74 Years | 25 (17.6%) | 9 (9.9%) |
| 75 Years and over | 13 (48.1%) | 13 (28.3%) |
Disability Class by Sex by Age in Au Gres
Disability Class: Hearing Difficulty
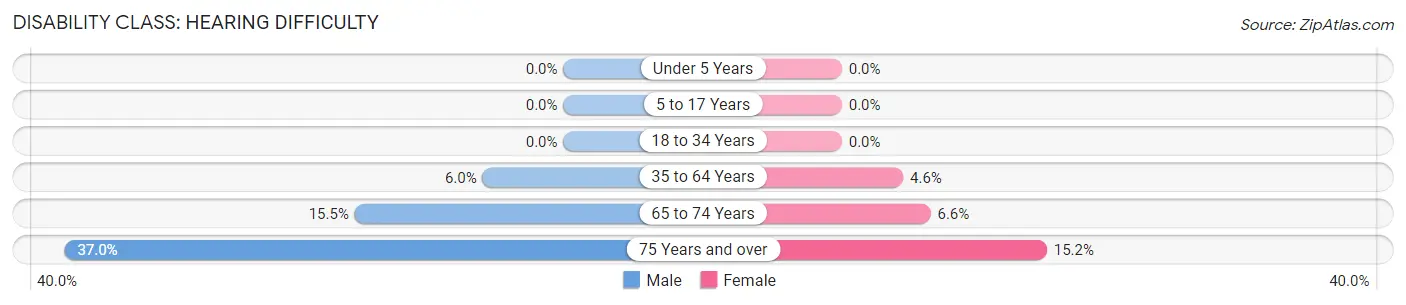
| Age Bracket | Male | Female |
| Under 5 Years | 0 (0.0%) | 0 (0.0%) |
| 5 to 17 Years | 0 (0.0%) | 0 (0.0%) |
| 18 to 34 Years | 0 (0.0%) | 0 (0.0%) |
| 35 to 64 Years | 12 (6.0%) | 9 (4.5%) |
| 65 to 74 Years | 22 (15.5%) | 6 (6.6%) |
| 75 Years and over | 10 (37.0%) | 7 (15.2%) |
Disability Class: Vision Difficulty
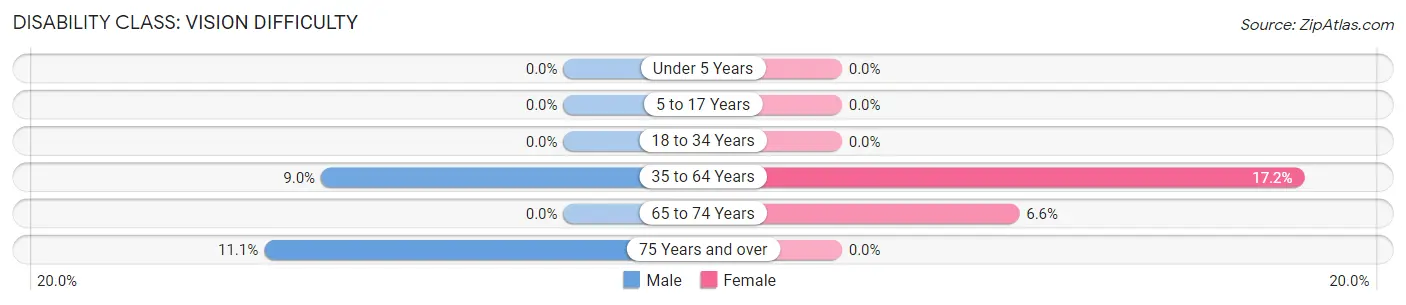
| Age Bracket | Male | Female |
| Under 5 Years | 0 (0.0%) | 0 (0.0%) |
| 5 to 17 Years | 0 (0.0%) | 0 (0.0%) |
| 18 to 34 Years | 0 (0.0%) | 0 (0.0%) |
| 35 to 64 Years | 18 (9.0%) | 34 (17.2%) |
| 65 to 74 Years | 0 (0.0%) | 6 (6.6%) |
| 75 Years and over | 3 (11.1%) | 0 (0.0%) |
Disability Class: Cognitive Difficulty
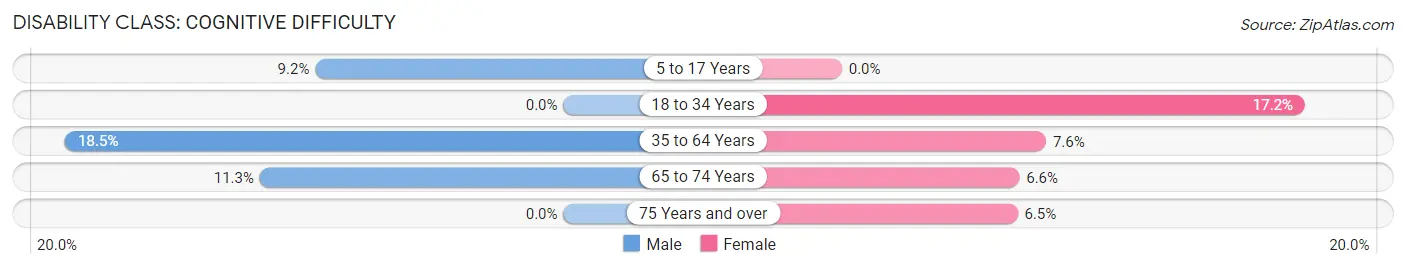
| Age Bracket | Male | Female |
| 5 to 17 Years | 7 (9.2%) | 0 (0.0%) |
| 18 to 34 Years | 0 (0.0%) | 11 (17.2%) |
| 35 to 64 Years | 37 (18.5%) | 15 (7.6%) |
| 65 to 74 Years | 16 (11.3%) | 6 (6.6%) |
| 75 Years and over | 0 (0.0%) | 3 (6.5%) |
Disability Class: Ambulatory Difficulty
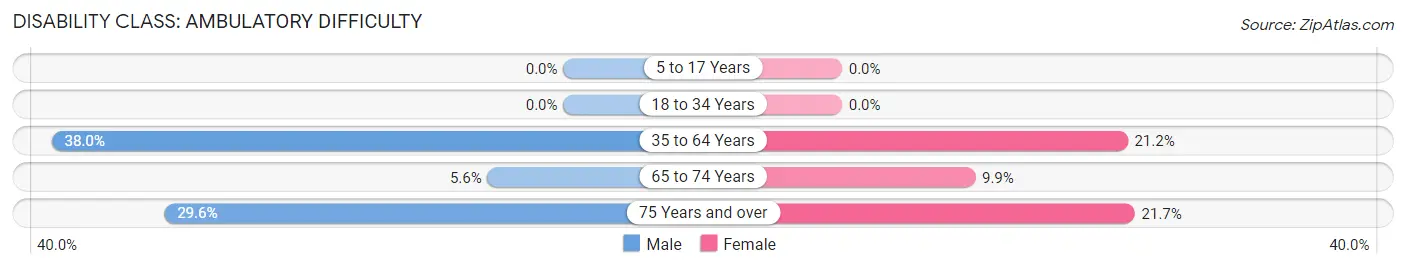
| Age Bracket | Male | Female |
| 5 to 17 Years | 0 (0.0%) | 0 (0.0%) |
| 18 to 34 Years | 0 (0.0%) | 0 (0.0%) |
| 35 to 64 Years | 76 (38.0%) | 42 (21.2%) |
| 65 to 74 Years | 8 (5.6%) | 9 (9.9%) |
| 75 Years and over | 8 (29.6%) | 10 (21.7%) |
Disability Class: Self-Care Difficulty
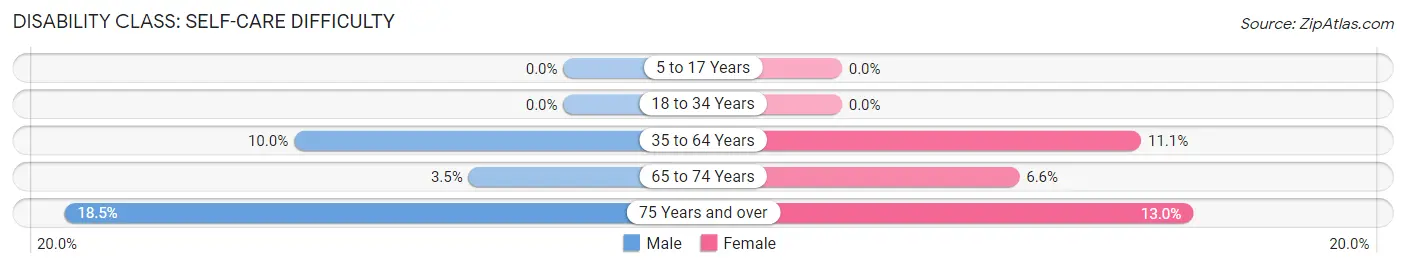
| Age Bracket | Male | Female |
| 5 to 17 Years | 0 (0.0%) | 0 (0.0%) |
| 18 to 34 Years | 0 (0.0%) | 0 (0.0%) |
| 35 to 64 Years | 20 (10.0%) | 22 (11.1%) |
| 65 to 74 Years | 5 (3.5%) | 6 (6.6%) |
| 75 Years and over | 5 (18.5%) | 6 (13.0%) |
Technology Access in Au Gres
Computing Device Access in Au Gres
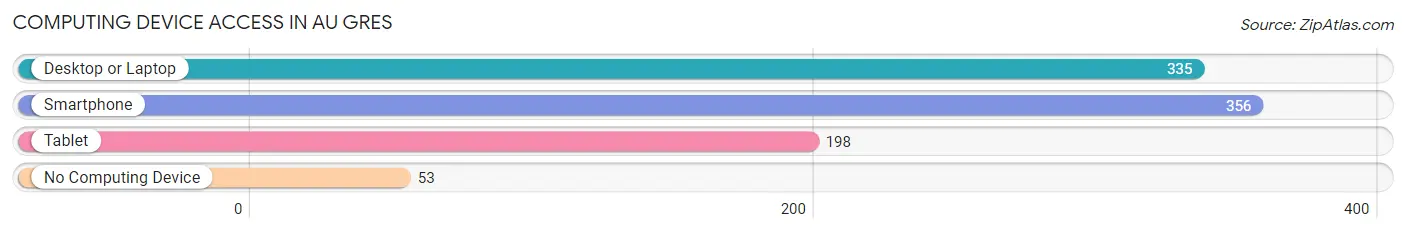
| Device Type | # Households | % Households |
| Desktop or Laptop | 335 | 74.0% |
| Smartphone | 356 | 78.6% |
| Tablet | 198 | 43.7% |
| No Computing Device | 53 | 11.7% |
| Total | 453 | 100.0% |
Internet Access in Au Gres
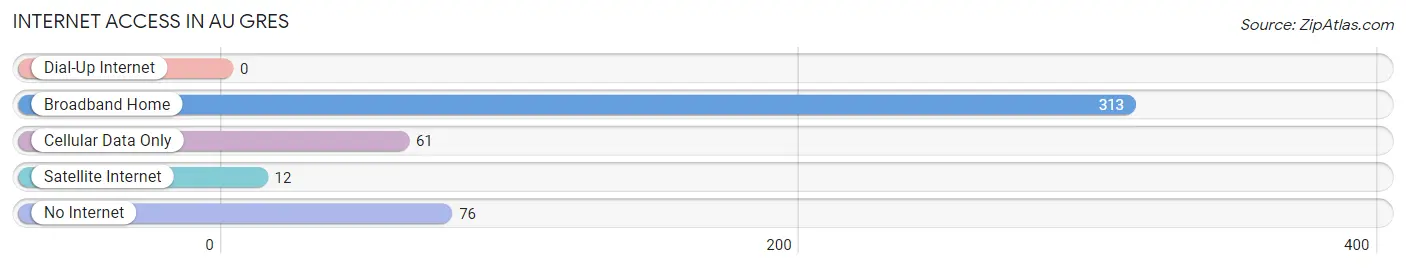
| Internet Type | # Households | % Households |
| Dial-Up Internet | 0 | 0.0% |
| Broadband Home | 313 | 69.1% |
| Cellular Data Only | 61 | 13.5% |
| Satellite Internet | 12 | 2.6% |
| No Internet | 76 | 16.8% |
| Total | 453 | 100.0% |
Au Gres Summary
Au Gres is a small city located in Arenac County, Michigan. It is situated on the Saginaw Bay of Lake Huron, approximately 90 miles north of Detroit. The city has a population of 1,845 people, according to the 2010 census.
Geography
Au Gres is located at the mouth of the Au Gres River, which empties into the Saginaw Bay of Lake Huron. The city is situated on the east side of the bay, and is bordered by the townships of Standish, Au Gres, and Sims. The city is located in the northern part of the Lower Peninsula of Michigan, and is part of the Thumb region. The city is approximately 90 miles north of Detroit, and is accessible by US-23.
History
The area that is now Au Gres was first settled in the early 1800s by French-Canadian fur traders. The city was originally known as "Au Gres Point," and was later shortened to "Au Gres." The city was officially incorporated in 1887.
In the late 1800s, Au Gres was a popular destination for tourists, who came to enjoy the area's natural beauty and recreational activities. The city was also known for its fishing industry, which was centered around the Au Gres River.
Economy
Au Gres is a small city, and its economy is largely based on tourism and fishing. The city is home to several marinas, which offer boat rentals and fishing charters. The city is also home to several restaurants, bars, and shops.
The city is also home to several manufacturing companies, including a plastics manufacturer and a metal fabrication company. The city is also home to a number of small businesses, including a grocery store, a hardware store, and a pharmacy.
Demographics
According to the 2010 census, Au Gres has a population of 1,845 people. The median age of the population is 44.7 years, and the median household income is $37,917. The city is predominantly white (94.3%), with small percentages of African American (2.2%), Native American (1.2%), and Asian (1.2%) populations.
Conclusion
Au Gres is a small city located in Arenac County, Michigan. It is situated on the Saginaw Bay of Lake Huron, and is home to 1,845 people. The city's economy is largely based on tourism and fishing, and it is home to several marinas, restaurants, bars, and shops. The city is predominantly white, with small percentages of African American, Native American, and Asian populations.
Common Questions
What is the Total Population of Au Gres?
Total Population of Au Gres is 930.
What is the Total Male Population of Au Gres?
Total Male Population of Au Gres is 483.
What is the Total Female Population of Au Gres?
Total Female Population of Au Gres is 447.
What is the Ratio of Males per 100 Females in Au Gres?
There are 108.05 Males per 100 Females in Au Gres.
What is the Ratio of Females per 100 Males in Au Gres?
There are 92.55 Females per 100 Males in Au Gres.
What is the Median Population Age in Au Gres?
Median Population Age in Au Gres is 55.7 Years.
What is the Average Family Size in Au Gres
Average Family Size in Au Gres is 2.8 People.
What is the Average Household Size in Au Gres
Average Household Size in Au Gres is 2.0 People.
What is Per Capita Income in Au Gres?
Per Capita income in Au Gres is $30,352.
What is the Median Family Income in Au Gres?
Median Family Income in Au Gres is $64,327.
What is the Median Household income in Au Gres?
Median Household Income in Au Gres is $55,313.
What is Income or Wage Gap in Au Gres?
Income or Wage Gap in Au Gres is 61.5%.
Women in Au Gres earn 38.5 cents for every dollar earned by a man.
What is Inequality or Gini Index in Au Gres?
Inequality or Gini Index in Au Gres is 0.40.
How Large is the Labor Force in Au Gres?
There are 373 People in the Labor Forcein in Au Gres.
What is the Percentage of People in the Labor Force in Au Gres?
45.6% of People are in the Labor Force in Au Gres.
What is the Unemployment Rate in Au Gres?
Unemployment Rate in Au Gres is 21.7%.