Cities with the Most Immigrants from France in New York
RELATED REPORTS & OPTIONS
France
New York
Compare Cities
Map of Cities with the Most Immigrants from France in New York
0
20,000
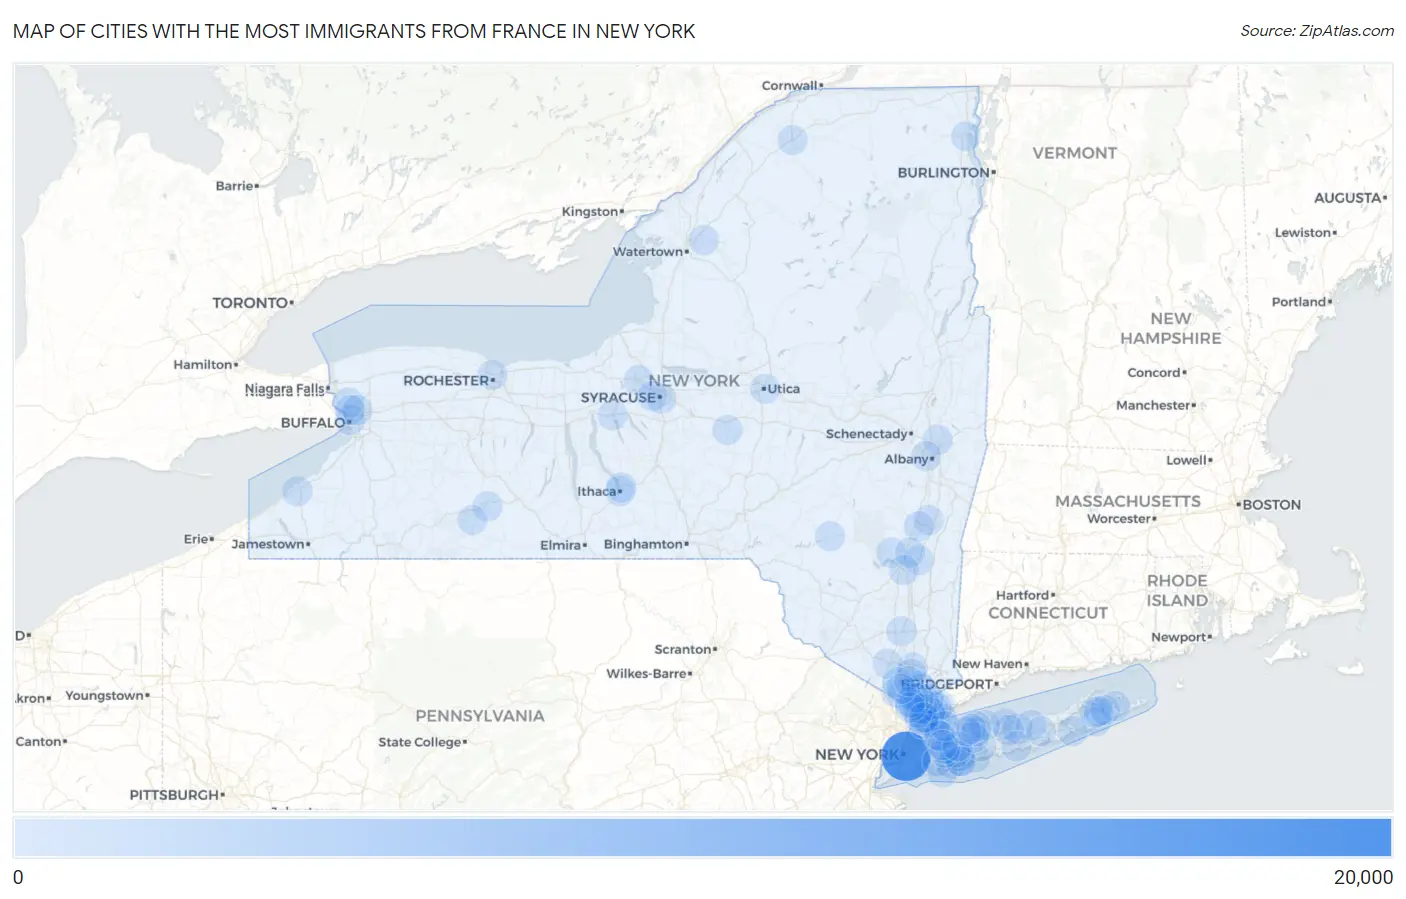
Cities with the Most Immigrants from France in New York
| City | France | vs State | vs National | |
| 1. | New York | 19,172 | 25,782(74.36%)#1 | 184,998(10.36%)#1 |
| 2. | Mamaroneck | 300 | 25,782(1.16%)#2 | 184,998(0.16%)#57 |
| 3. | New Rochelle | 227 | 25,782(0.88%)#3 | 184,998(0.12%)#87 |
| 4. | Yonkers | 203 | 25,782(0.79%)#4 | 184,998(0.11%)#104 |
| 5. | Coram | 190 | 25,782(0.74%)#5 | 184,998(0.10%)#120 |
| 6. | Harrison | 157 | 25,782(0.61%)#6 | 184,998(0.08%)#165 |
| 7. | Stony Brook University | 137 | 25,782(0.53%)#7 | 184,998(0.07%)#191 |
| 8. | Syracuse | 103 | 25,782(0.40%)#8 | 184,998(0.06%)#254 |
| 9. | Cohoes | 87 | 25,782(0.34%)#9 | 184,998(0.05%)#303 |
| 10. | Lindenhurst | 75 | 25,782(0.29%)#10 | 184,998(0.04%)#358 |
| 11. | Nanuet | 74 | 25,782(0.29%)#11 | 184,998(0.04%)#364 |
| 12. | Greenville Cdp Westchester County | 71 | 25,782(0.28%)#12 | 184,998(0.04%)#378 |
| 13. | Auburn | 60 | 25,782(0.23%)#13 | 184,998(0.03%)#455 |
| 14. | Bridgehampton | 59 | 25,782(0.23%)#14 | 184,998(0.03%)#468 |
| 15. | Centereach | 58 | 25,782(0.22%)#15 | 184,998(0.03%)#472 |
| 16. | Ossining | 58 | 25,782(0.22%)#16 | 184,998(0.03%)#473 |
| 17. | Potsdam | 58 | 25,782(0.22%)#17 | 184,998(0.03%)#476 |
| 18. | Buffalo | 57 | 25,782(0.22%)#18 | 184,998(0.03%)#477 |
| 19. | Fort Drum | 56 | 25,782(0.22%)#19 | 184,998(0.03%)#494 |
| 20. | Dobbs Ferry | 56 | 25,782(0.22%)#20 | 184,998(0.03%)#495 |
| 21. | Hornell | 55 | 25,782(0.21%)#21 | 184,998(0.03%)#510 |
| 22. | Eastchester | 52 | 25,782(0.20%)#22 | 184,998(0.03%)#527 |
| 23. | Rye | 52 | 25,782(0.20%)#23 | 184,998(0.03%)#529 |
| 24. | White Plains | 51 | 25,782(0.20%)#24 | 184,998(0.03%)#538 |
| 25. | Manorhaven | 48 | 25,782(0.19%)#25 | 184,998(0.03%)#573 |
| 26. | Westbury | 47 | 25,782(0.18%)#26 | 184,998(0.03%)#583 |
| 27. | Bronxville | 43 | 25,782(0.17%)#27 | 184,998(0.02%)#631 |
| 28. | Monsey | 42 | 25,782(0.16%)#28 | 184,998(0.02%)#642 |
| 29. | Briarcliff Manor | 42 | 25,782(0.16%)#29 | 184,998(0.02%)#649 |
| 30. | Tonawanda | 40 | 25,782(0.16%)#30 | 184,998(0.02%)#672 |
| 31. | Scarsdale | 38 | 25,782(0.15%)#31 | 184,998(0.02%)#702 |
| 32. | Hampton Bays | 38 | 25,782(0.15%)#32 | 184,998(0.02%)#703 |
| 33. | Freeport | 37 | 25,782(0.14%)#33 | 184,998(0.02%)#716 |
| 34. | Ardsley | 37 | 25,782(0.14%)#34 | 184,998(0.02%)#730 |
| 35. | Springs | 36 | 25,782(0.14%)#35 | 184,998(0.02%)#750 |
| 36. | Hastings On Hudson | 36 | 25,782(0.14%)#36 | 184,998(0.02%)#752 |
| 37. | Woodstock | 35 | 25,782(0.14%)#37 | 184,998(0.02%)#776 |
| 38. | Hudson | 34 | 25,782(0.13%)#38 | 184,998(0.02%)#792 |
| 39. | Noyack | 34 | 25,782(0.13%)#39 | 184,998(0.02%)#793 |
| 40. | Valhalla | 34 | 25,782(0.13%)#40 | 184,998(0.02%)#794 |
| 41. | Rye Brook | 33 | 25,782(0.13%)#41 | 184,998(0.02%)#808 |
| 42. | Baldwinsville | 33 | 25,782(0.13%)#42 | 184,998(0.02%)#809 |
| 43. | Peekskill | 32 | 25,782(0.12%)#43 | 184,998(0.02%)#818 |
| 44. | Utica | 31 | 25,782(0.12%)#44 | 184,998(0.02%)#834 |
| 45. | Wantagh | 31 | 25,782(0.12%)#45 | 184,998(0.02%)#842 |
| 46. | Ridge | 31 | 25,782(0.12%)#46 | 184,998(0.02%)#843 |
| 47. | Ithaca | 30 | 25,782(0.12%)#47 | 184,998(0.02%)#862 |
| 48. | Deer Park | 28 | 25,782(0.11%)#48 | 184,998(0.02%)#902 |
| 49. | Patchogue | 28 | 25,782(0.11%)#49 | 184,998(0.02%)#908 |
| 50. | Fort Salonga | 28 | 25,782(0.11%)#50 | 184,998(0.02%)#911 |
| 51. | Montrose | 28 | 25,782(0.11%)#51 | 184,998(0.02%)#915 |
| 52. | Albany | 27 | 25,782(0.10%)#52 | 184,998(0.01%)#921 |
| 53. | North Wantagh | 27 | 25,782(0.10%)#53 | 184,998(0.01%)#936 |
| 54. | Catskill | 27 | 25,782(0.10%)#54 | 184,998(0.01%)#943 |
| 55. | Rochester | 26 | 25,782(0.10%)#55 | 184,998(0.01%)#948 |
| 56. | Valley Stream | 26 | 25,782(0.10%)#56 | 184,998(0.01%)#954 |
| 57. | Carmel | 26 | 25,782(0.10%)#57 | 184,998(0.01%)#969 |
| 58. | Solvay | 25 | 25,782(0.10%)#58 | 184,998(0.01%)#998 |
| 59. | Harriman | 25 | 25,782(0.10%)#59 | 184,998(0.01%)#1,003 |
| 60. | Long Beach | 24 | 25,782(0.09%)#60 | 184,998(0.01%)#1,015 |
| 61. | Manorville | 24 | 25,782(0.09%)#61 | 184,998(0.01%)#1,036 |
| 62. | East Meadow | 22 | 25,782(0.09%)#62 | 184,998(0.01%)#1,094 |
| 63. | Pomona | 22 | 25,782(0.09%)#63 | 184,998(0.01%)#1,113 |
| 64. | Eggertsville | 21 | 25,782(0.08%)#64 | 184,998(0.01%)#1,140 |
| 65. | Piermont | 21 | 25,782(0.08%)#65 | 184,998(0.01%)#1,154 |
| 66. | Red Hook | 21 | 25,782(0.08%)#66 | 184,998(0.01%)#1,156 |
| 67. | Seaford | 20 | 25,782(0.08%)#67 | 184,998(0.01%)#1,179 |
| 68. | Sleepy Hollow | 20 | 25,782(0.08%)#68 | 184,998(0.01%)#1,183 |
| 69. | Centerport | 20 | 25,782(0.08%)#69 | 184,998(0.01%)#1,189 |
| 70. | Alfred | 20 | 25,782(0.08%)#70 | 184,998(0.01%)#1,190 |
| 71. | Cayuga Heights | 20 | 25,782(0.08%)#71 | 184,998(0.01%)#1,191 |
| 72. | Balmville | 20 | 25,782(0.08%)#72 | 184,998(0.01%)#1,193 |
| 73. | Port Washington North | 20 | 25,782(0.08%)#73 | 184,998(0.01%)#1,194 |
| 74. | Mount Vernon | 19 | 25,782(0.07%)#74 | 184,998(0.01%)#1,203 |
| 75. | South Huntington | 19 | 25,782(0.07%)#75 | 184,998(0.01%)#1,229 |
| 76. | Northwest Harbor | 19 | 25,782(0.07%)#76 | 184,998(0.01%)#1,238 |
| 77. | Nyack | 18 | 25,782(0.07%)#77 | 184,998(0.01%)#1,285 |
| 78. | Orangeburg | 18 | 25,782(0.07%)#78 | 184,998(0.01%)#1,288 |
| 79. | Glasco | 18 | 25,782(0.07%)#79 | 184,998(0.01%)#1,294 |
| 80. | Sleepy Hollow Lake | 18 | 25,782(0.07%)#80 | 184,998(0.01%)#1,296 |
| 81. | Margaretville | 18 | 25,782(0.07%)#81 | 184,998(0.01%)#1,297 |
| 82. | Kingston | 17 | 25,782(0.07%)#82 | 184,998(0.01%)#1,321 |
| 83. | Garden City | 17 | 25,782(0.07%)#83 | 184,998(0.01%)#1,322 |
| 84. | Mineola | 17 | 25,782(0.07%)#84 | 184,998(0.01%)#1,324 |
| 85. | Plattsburgh | 17 | 25,782(0.07%)#85 | 184,998(0.01%)#1,326 |
| 86. | Port Washington | 17 | 25,782(0.07%)#86 | 184,998(0.01%)#1,329 |
| 87. | Greenlawn | 17 | 25,782(0.07%)#87 | 184,998(0.01%)#1,331 |
| 88. | Tappan | 17 | 25,782(0.07%)#88 | 184,998(0.01%)#1,345 |
| 89. | Hicksville | 16 | 25,782(0.06%)#89 | 184,998(0.01%)#1,378 |
| 90. | Glen Cove | 16 | 25,782(0.06%)#90 | 184,998(0.01%)#1,391 |
| 91. | Fredonia | 16 | 25,782(0.06%)#91 | 184,998(0.01%)#1,414 |
| 92. | New Square | 16 | 25,782(0.06%)#92 | 184,998(0.01%)#1,415 |
| 93. | Searingtown | 16 | 25,782(0.06%)#93 | 184,998(0.01%)#1,424 |
| 94. | Hamilton | 16 | 25,782(0.06%)#94 | 184,998(0.01%)#1,428 |
| 95. | Kenmore | 15 | 25,782(0.06%)#95 | 184,998(0.01%)#1,466 |
| 96. | Haverstraw | 15 | 25,782(0.06%)#96 | 184,998(0.01%)#1,473 |
| 97. | Tuckahoe | 15 | 25,782(0.06%)#97 | 184,998(0.01%)#1,480 |
| 98. | Cold Spring Harbor | 15 | 25,782(0.06%)#98 | 184,998(0.01%)#1,488 |
| 99. | Sag Harbor | 15 | 25,782(0.06%)#99 | 184,998(0.01%)#1,490 |
| 100. | Huntington | 14 | 25,782(0.05%)#100 | 184,998(0.01%)#1,524 |
Common Questions
What are the Top 10 Cities with the Most Immigrants from France in New York?
Top 10 Cities with the Most Immigrants from France in New York are:
#1
19,172
#2
300
#3
227
#4
203
#5
190
#6
157
#7
137
#8
103
#9
87
#10
75
What city has the Most Immigrants from France in New York?
New York has the Most Immigrants from France in New York with 19,172.
What is the Total Immigrants from France in the State of New York?
Total Immigrants from France in New York is 25,782.
What is the Total Immigrants from France in the United States?
Total Immigrants from France in the United States is 184,998.