Cities with the Most Immigrants from Ecuador in New York
RELATED REPORTS & OPTIONS
Ecuador
New York
Compare Cities
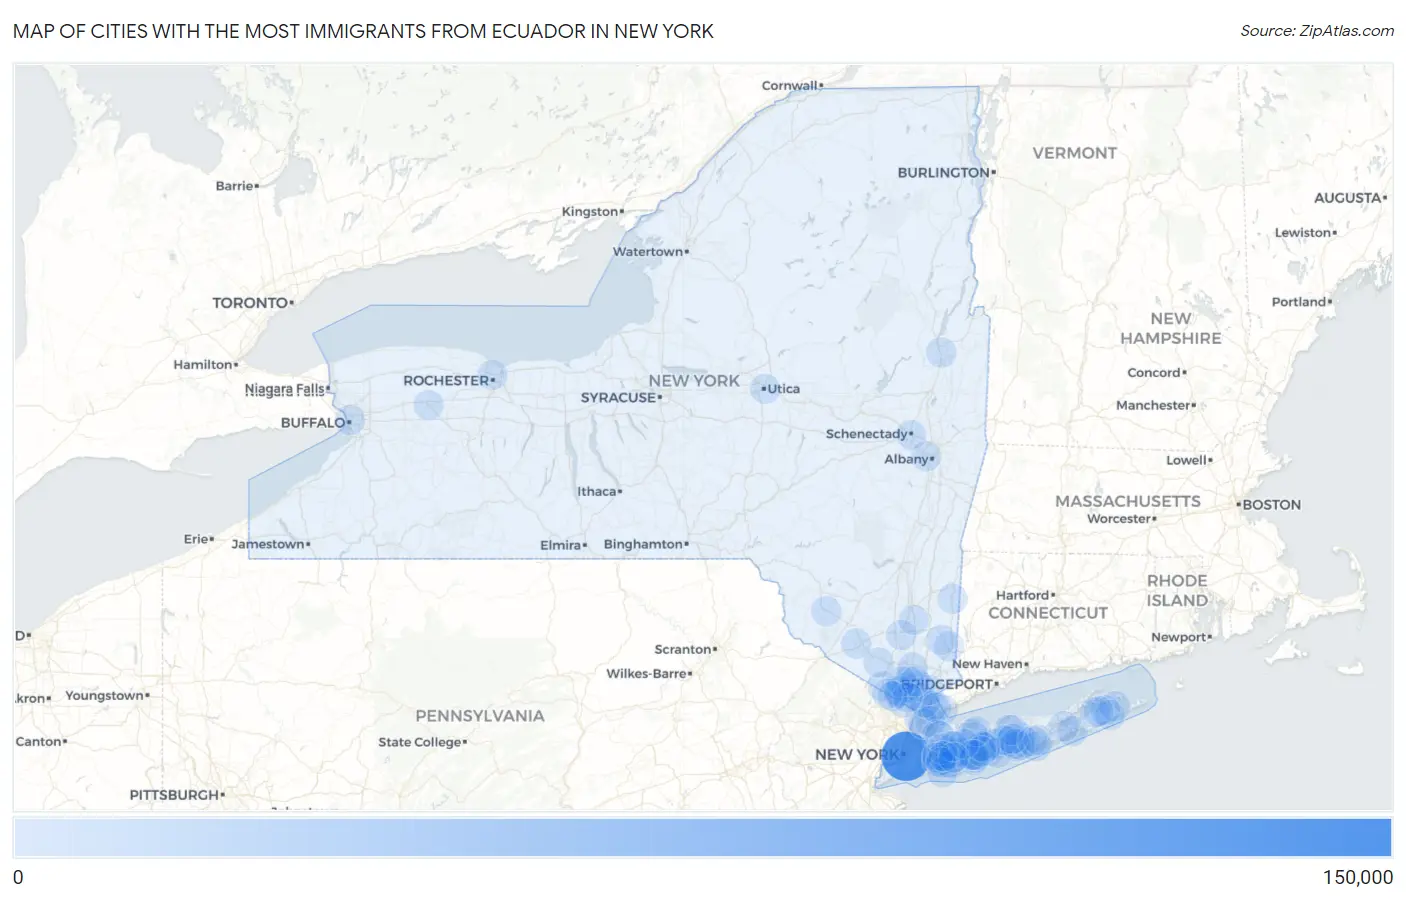
Map of Cities with the Most Immigrants from Ecuador in New York
0
150,000
Cities with the Most Immigrants from Ecuador in New York
| City | Ecuador | vs State | vs National | |
| 1. | New York | 125,959 | 177,448(70.98%)#1 | 480,873(26.19%)#1 |
| 2. | Yonkers | 3,386 | 177,448(1.91%)#2 | 480,873(0.70%)#10 |
| 3. | Ossining | 2,616 | 177,448(1.47%)#3 | 480,873(0.54%)#14 |
| 4. | Port Chester | 2,307 | 177,448(1.30%)#4 | 480,873(0.48%)#19 |
| 5. | Peekskill | 2,091 | 177,448(1.18%)#5 | 480,873(0.43%)#20 |
| 6. | Nanuet | 1,770 | 177,448(1.00%)#6 | 480,873(0.37%)#24 |
| 7. | Brentwood | 1,649 | 177,448(0.93%)#7 | 480,873(0.34%)#26 |
| 8. | Medford | 1,556 | 177,448(0.88%)#8 | 480,873(0.32%)#27 |
| 9. | Springs | 1,377 | 177,448(0.78%)#9 | 480,873(0.29%)#29 |
| 10. | Spring Valley | 1,137 | 177,448(0.64%)#10 | 480,873(0.24%)#35 |
| 11. | Sleepy Hollow | 1,069 | 177,448(0.60%)#11 | 480,873(0.22%)#37 |
| 12. | Hillcrest | 944 | 177,448(0.53%)#12 | 480,873(0.20%)#45 |
| 13. | East Hampton North | 922 | 177,448(0.52%)#13 | 480,873(0.19%)#52 |
| 14. | Pearl River | 771 | 177,448(0.43%)#14 | 480,873(0.16%)#64 |
| 15. | Hempstead | 743 | 177,448(0.42%)#15 | 480,873(0.15%)#69 |
| 16. | White Plains | 688 | 177,448(0.39%)#16 | 480,873(0.14%)#76 |
| 17. | Patchogue | 669 | 177,448(0.38%)#17 | 480,873(0.14%)#81 |
| 18. | Freeport | 614 | 177,448(0.35%)#18 | 480,873(0.13%)#89 |
| 19. | Valley Stream | 604 | 177,448(0.34%)#19 | 480,873(0.13%)#91 |
| 20. | Central Islip | 595 | 177,448(0.34%)#20 | 480,873(0.12%)#92 |
| 21. | North Bellport | 561 | 177,448(0.32%)#21 | 480,873(0.12%)#97 |
| 22. | East Patchogue | 502 | 177,448(0.28%)#22 | 480,873(0.10%)#105 |
| 23. | Hicksville | 494 | 177,448(0.28%)#23 | 480,873(0.10%)#107 |
| 24. | Mount Vernon | 491 | 177,448(0.28%)#24 | 480,873(0.10%)#108 |
| 25. | Bay Shore | 482 | 177,448(0.27%)#25 | 480,873(0.10%)#111 |
| 26. | Hampton Bays | 466 | 177,448(0.26%)#26 | 480,873(0.10%)#113 |
| 27. | New Rochelle | 424 | 177,448(0.24%)#27 | 480,873(0.09%)#123 |
| 28. | Albany | 416 | 177,448(0.23%)#28 | 480,873(0.09%)#127 |
| 29. | Middletown | 410 | 177,448(0.23%)#29 | 480,873(0.09%)#130 |
| 30. | Centereach | 374 | 177,448(0.21%)#30 | 480,873(0.08%)#142 |
| 31. | Newburgh | 368 | 177,448(0.21%)#31 | 480,873(0.08%)#145 |
| 32. | New City | 362 | 177,448(0.20%)#32 | 480,873(0.08%)#150 |
| 33. | Flanders | 354 | 177,448(0.20%)#33 | 480,873(0.07%)#154 |
| 34. | Uniondale | 347 | 177,448(0.20%)#34 | 480,873(0.07%)#156 |
| 35. | Haverstraw | 345 | 177,448(0.19%)#35 | 480,873(0.07%)#157 |
| 36. | Roosevelt | 321 | 177,448(0.18%)#36 | 480,873(0.07%)#167 |
| 37. | Mount Ivy | 313 | 177,448(0.18%)#37 | 480,873(0.07%)#171 |
| 38. | Elmsford | 306 | 177,448(0.17%)#38 | 480,873(0.06%)#175 |
| 39. | Levittown | 304 | 177,448(0.17%)#39 | 480,873(0.06%)#177 |
| 40. | Pleasantville | 304 | 177,448(0.17%)#40 | 480,873(0.06%)#178 |
| 41. | Buffalo | 299 | 177,448(0.17%)#41 | 480,873(0.06%)#179 |
| 42. | East Meadow | 299 | 177,448(0.17%)#42 | 480,873(0.06%)#180 |
| 43. | Northwest Harbor | 288 | 177,448(0.16%)#43 | 480,873(0.06%)#191 |
| 44. | North Bay Shore | 282 | 177,448(0.16%)#44 | 480,873(0.06%)#193 |
| 45. | Holbrook | 255 | 177,448(0.14%)#45 | 480,873(0.05%)#212 |
| 46. | East Islip | 255 | 177,448(0.14%)#46 | 480,873(0.05%)#213 |
| 47. | South Farmingdale | 237 | 177,448(0.13%)#47 | 480,873(0.05%)#231 |
| 48. | Copiague | 235 | 177,448(0.13%)#48 | 480,873(0.05%)#233 |
| 49. | Selden | 226 | 177,448(0.13%)#49 | 480,873(0.05%)#245 |
| 50. | Harrison | 221 | 177,448(0.12%)#50 | 480,873(0.05%)#250 |
| 51. | Utica | 213 | 177,448(0.12%)#51 | 480,873(0.04%)#263 |
| 52. | Elmont | 211 | 177,448(0.12%)#52 | 480,873(0.04%)#266 |
| 53. | West Babylon | 202 | 177,448(0.11%)#53 | 480,873(0.04%)#274 |
| 54. | Franklin Square | 193 | 177,448(0.11%)#54 | 480,873(0.04%)#287 |
| 55. | Noyack | 180 | 177,448(0.10%)#55 | 480,873(0.04%)#307 |
| 56. | Monticello | 178 | 177,448(0.10%)#56 | 480,873(0.04%)#310 |
| 57. | Huntington Station | 169 | 177,448(0.10%)#57 | 480,873(0.04%)#319 |
| 58. | Croton On Hudson | 168 | 177,448(0.09%)#58 | 480,873(0.03%)#320 |
| 59. | Long Beach | 167 | 177,448(0.09%)#59 | 480,873(0.03%)#321 |
| 60. | Lindenhurst | 165 | 177,448(0.09%)#60 | 480,873(0.03%)#325 |
| 61. | Mastic Beach | 163 | 177,448(0.09%)#61 | 480,873(0.03%)#331 |
| 62. | Baldwin | 162 | 177,448(0.09%)#62 | 480,873(0.03%)#333 |
| 63. | Fairview Cdp Westchester County | 160 | 177,448(0.09%)#63 | 480,873(0.03%)#338 |
| 64. | Ronkonkoma | 155 | 177,448(0.09%)#64 | 480,873(0.03%)#354 |
| 65. | Manorhaven | 148 | 177,448(0.08%)#65 | 480,873(0.03%)#370 |
| 66. | Malverne | 147 | 177,448(0.08%)#66 | 480,873(0.03%)#375 |
| 67. | Westbury | 144 | 177,448(0.08%)#67 | 480,873(0.03%)#382 |
| 68. | South Huntington | 144 | 177,448(0.08%)#68 | 480,873(0.03%)#383 |
| 69. | Sloatsburg | 144 | 177,448(0.08%)#69 | 480,873(0.03%)#384 |
| 70. | North Patchogue | 133 | 177,448(0.07%)#70 | 480,873(0.03%)#413 |
| 71. | Batavia | 131 | 177,448(0.07%)#71 | 480,873(0.03%)#417 |
| 72. | Holtsville | 129 | 177,448(0.07%)#72 | 480,873(0.03%)#421 |
| 73. | North Amityville | 128 | 177,448(0.07%)#73 | 480,873(0.03%)#425 |
| 74. | Baywood | 126 | 177,448(0.07%)#74 | 480,873(0.03%)#432 |
| 75. | Deer Park | 123 | 177,448(0.07%)#75 | 480,873(0.03%)#436 |
| 76. | Brewster Hill | 122 | 177,448(0.07%)#76 | 480,873(0.03%)#441 |
| 77. | Port Washington | 120 | 177,448(0.07%)#77 | 480,873(0.02%)#447 |
| 78. | Lake Carmel | 116 | 177,448(0.07%)#78 | 480,873(0.02%)#458 |
| 79. | Walton Park | 116 | 177,448(0.07%)#79 | 480,873(0.02%)#459 |
| 80. | Rochester | 113 | 177,448(0.06%)#80 | 480,873(0.02%)#466 |
| 81. | Dover Plains | 111 | 177,448(0.06%)#81 | 480,873(0.02%)#474 |
| 82. | Greenlawn | 108 | 177,448(0.06%)#82 | 480,873(0.02%)#481 |
| 83. | Garden City Park | 105 | 177,448(0.06%)#83 | 480,873(0.02%)#492 |
| 84. | Wappingers Falls | 104 | 177,448(0.06%)#84 | 480,873(0.02%)#498 |
| 85. | Glens Falls North | 92 | 177,448(0.05%)#85 | 480,873(0.02%)#542 |
| 86. | West Nyack | 92 | 177,448(0.05%)#86 | 480,873(0.02%)#543 |
| 87. | Suffern | 91 | 177,448(0.05%)#87 | 480,873(0.02%)#548 |
| 88. | North Babylon | 86 | 177,448(0.05%)#88 | 480,873(0.02%)#570 |
| 89. | Shirley | 84 | 177,448(0.05%)#89 | 480,873(0.02%)#581 |
| 90. | North Valley Stream | 82 | 177,448(0.05%)#90 | 480,873(0.02%)#588 |
| 91. | Moriches | 82 | 177,448(0.05%)#91 | 480,873(0.02%)#590 |
| 92. | Schenectady | 81 | 177,448(0.05%)#92 | 480,873(0.02%)#592 |
| 93. | New Cassel | 77 | 177,448(0.04%)#93 | 480,873(0.02%)#614 |
| 94. | Airmont | 74 | 177,448(0.04%)#94 | 480,873(0.02%)#640 |
| 95. | Sag Harbor | 73 | 177,448(0.04%)#95 | 480,873(0.02%)#647 |
| 96. | Plainview | 72 | 177,448(0.04%)#96 | 480,873(0.01%)#650 |
| 97. | Lynbrook | 72 | 177,448(0.04%)#97 | 480,873(0.01%)#651 |
| 98. | North Lindenhurst | 70 | 177,448(0.04%)#98 | 480,873(0.01%)#669 |
| 99. | West Hempstead | 69 | 177,448(0.04%)#99 | 480,873(0.01%)#676 |
| 100. | North Merrick | 69 | 177,448(0.04%)#100 | 480,873(0.01%)#677 |
Common Questions
What are the Top 10 Cities with the Most Immigrants from Ecuador in New York?
Top 10 Cities with the Most Immigrants from Ecuador in New York are:
#1
125,959
#2
3,386
#3
2,616
#4
2,307
#5
2,091
#6
1,770
#7
1,649
#8
1,556
#9
1,377
#10
1,137
What city has the Most Immigrants from Ecuador in New York?
New York has the Most Immigrants from Ecuador in New York with 125,959.
What is the Total Immigrants from Ecuador in the State of New York?
Total Immigrants from Ecuador in New York is 177,448.
What is the Total Immigrants from Ecuador in the United States?
Total Immigrants from Ecuador in the United States is 480,873.