Cities with the Highest Percentage of Sri Lankan Population in Oklahoma
RELATED REPORTS & OPTIONS
Sri Lankan
Oklahoma
Compare Cities
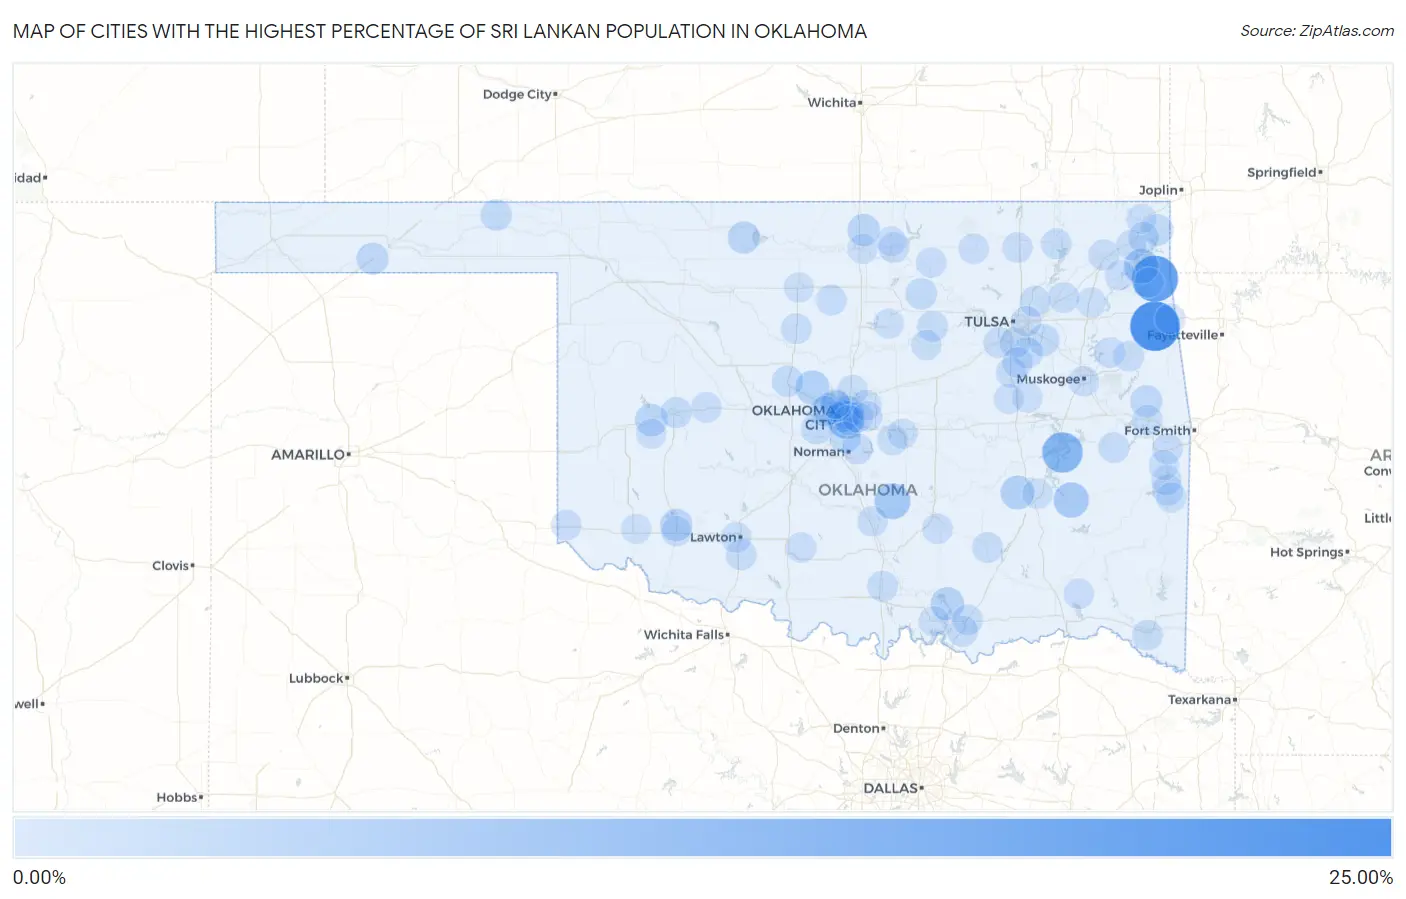
Map of Cities with the Highest Percentage of Sri Lankan Population in Oklahoma
0.00%
25.00%
Cities with the Highest Percentage of Sri Lankan Population in Oklahoma
| City | Sri Lankan | vs State | vs National | |
| 1. | Chewey | 22.54% | 0.63%(+21.9)#1 | 0.68%(+21.9)#16 |
| 2. | Deer Lick | 18.48% | 0.63%(+17.9)#2 | 0.68%(+17.8)#20 |
| 3. | Carlton Landing | 11.63% | 0.63%(+11.0)#3 | 0.68%(+10.9)#39 |
| 4. | Smith Village | 8.33% | 0.63%(+7.71)#4 | 0.68%(+7.65)#71 |
| 5. | Byars | 6.31% | 0.63%(+5.68)#5 | 0.68%(+5.63)#99 |
| 6. | Gowen | 5.73% | 0.63%(+5.11)#6 | 0.68%(+5.05)#129 |
| 7. | Dennis | 5.14% | 0.63%(+4.51)#7 | 0.68%(+4.46)#153 |
| 8. | Piedmont | 4.25% | 0.63%(+3.62)#8 | 0.68%(+3.57)#214 |
| 9. | Arpelar | 4.13% | 0.63%(+3.50)#9 | 0.68%(+3.45)#223 |
| 10. | Bee | 3.45% | 0.63%(+2.82)#10 | 0.68%(+2.77)#304 |
| 11. | Forest Park | 3.29% | 0.63%(+2.67)#11 | 0.68%(+2.61)#335 |
| 12. | Foss | 2.55% | 0.63%(+1.92)#12 | 0.68%(+1.87)#489 |
| 13. | Mountain Park | 2.48% | 0.63%(+1.85)#13 | 0.68%(+1.80)#504 |
| 14. | Blackwell | 2.32% | 0.63%(+1.69)#14 | 0.68%(+1.64)#566 |
| 15. | Cherokee | 2.25% | 0.63%(+1.62)#15 | 0.68%(+1.57)#587 |
| 16. | Marble City | 1.96% | 0.63%(+1.33)#16 | 0.68%(+1.28)#694 |
| 17. | Oklahoma City | 1.95% | 0.63%(+1.33)#17 | 0.68%(+1.28)#700 |
| 18. | Goodwell | 1.79% | 0.63%(+1.17)#18 | 0.68%(+1.12)#790 |
| 19. | Warr Acres | 1.67% | 0.63%(+1.04)#19 | 0.68%(+0.991)#868 |
| 20. | Pawnee | 1.66% | 0.63%(+1.03)#20 | 0.68%(+0.980)#876 |
| 21. | Broken Arrow | 1.63% | 0.63%(+1.00)#21 | 0.68%(+0.951)#899 |
| 22. | Wyandotte | 1.58% | 0.63%(+0.955)#22 | 0.68%(+0.903)#938 |
| 23. | Moore | 1.53% | 0.63%(+0.905)#23 | 0.68%(+0.853)#980 |
| 24. | Forgan | 1.40% | 0.63%(+0.773)#24 | 0.68%(+0.720)#1,101 |
| 25. | Okarche | 1.37% | 0.63%(+0.748)#25 | 0.68%(+0.695)#1,119 |
| 26. | Norwood | 1.36% | 0.63%(+0.729)#26 | 0.68%(+0.677)#1,137 |
| 27. | Nichols Hills | 1.22% | 0.63%(+0.593)#27 | 0.68%(+0.541)#1,293 |
| 28. | Mustang | 1.10% | 0.63%(+0.471)#28 | 0.68%(+0.418)#1,429 |
| 29. | Bixby | 1.02% | 0.63%(+0.394)#29 | 0.68%(+0.341)#1,542 |
| 30. | Clinton | 0.96% | 0.63%(+0.339)#30 | 0.68%(+0.286)#1,617 |
| 31. | Vinita | 0.94% | 0.63%(+0.315)#31 | 0.68%(+0.263)#1,658 |
| 32. | Sapulpa | 0.92% | 0.63%(+0.295)#32 | 0.68%(+0.243)#1,703 |
| 33. | Tonkawa Tribal Housing | 0.87% | 0.63%(+0.246)#33 | 0.68%(+0.194)#1,782 |
| 34. | Owasso | 0.82% | 0.63%(+0.192)#34 | 0.68%(+0.140)#1,887 |
| 35. | Calera | 0.79% | 0.63%(+0.168)#35 | 0.68%(+0.116)#1,939 |
| 36. | Covington | 0.77% | 0.63%(+0.139)#36 | 0.68%(+0.087)#2,005 |
| 37. | Ardmore | 0.75% | 0.63%(+0.120)#37 | 0.68%(+0.068)#2,041 |
| 38. | Fairland | 0.73% | 0.63%(+0.103)#38 | 0.68%(+0.051)#2,084 |
| 39. | Jenks | 0.71% | 0.63%(+0.085)#39 | 0.68%(+0.033)#2,116 |
| 40. | Beggs | 0.71% | 0.63%(+0.084)#40 | 0.68%(+0.032)#2,120 |
| 41. | Coalgate | 0.69% | 0.63%(+0.063)#41 | 0.68%(+0.011)#2,192 |
| 42. | Yale | 0.68% | 0.63%(+0.052)#42 | 0.68%(+0.000)#2,223 |
| 43. | Spiro | 0.67% | 0.63%(+0.042)#43 | 0.68%(-0.010)#2,254 |
| 44. | Howe | 0.66% | 0.63%(+0.039)#44 | 0.68%(-0.014)#2,262 |
| 45. | Stigler | 0.63% | 0.63%(+0.007)#45 | 0.68%(-0.046)#2,351 |
| 46. | Claremore | 0.62% | 0.63%(-0.002)#46 | 0.68%(-0.055)#2,373 |
| 47. | Norman | 0.61% | 0.63%(-0.013)#47 | 0.68%(-0.065)#2,401 |
| 48. | Durant | 0.61% | 0.63%(-0.018)#48 | 0.68%(-0.071)#2,411 |
| 49. | Idabel | 0.60% | 0.63%(-0.026)#49 | 0.68%(-0.078)#2,432 |
| 50. | Hennessey | 0.60% | 0.63%(-0.027)#50 | 0.68%(-0.079)#2,437 |
| 51. | Nowata | 0.59% | 0.63%(-0.033)#51 | 0.68%(-0.086)#2,455 |
| 52. | Geronimo | 0.59% | 0.63%(-0.038)#52 | 0.68%(-0.091)#2,463 |
| 53. | Lawton | 0.54% | 0.63%(-0.087)#53 | 0.68%(-0.139)#2,613 |
| 54. | West Siloam Springs | 0.51% | 0.63%(-0.114)#54 | 0.68%(-0.167)#2,710 |
| 55. | Tulsa | 0.51% | 0.63%(-0.118)#55 | 0.68%(-0.170)#2,723 |
| 56. | Liberty | 0.51% | 0.63%(-0.121)#56 | 0.68%(-0.173)#2,733 |
| 57. | Bethany | 0.50% | 0.63%(-0.127)#57 | 0.68%(-0.179)#2,753 |
| 58. | Weatherford | 0.49% | 0.63%(-0.134)#58 | 0.68%(-0.187)#2,783 |
| 59. | Ada | 0.46% | 0.63%(-0.167)#59 | 0.68%(-0.219)#2,897 |
| 60. | Tahlequah | 0.44% | 0.63%(-0.187)#60 | 0.68%(-0.239)#2,975 |
| 61. | Pawhuska | 0.43% | 0.63%(-0.194)#61 | 0.68%(-0.246)#3,003 |
| 62. | Edmond | 0.43% | 0.63%(-0.194)#62 | 0.68%(-0.247)#3,004 |
| 63. | Fairfax | 0.43% | 0.63%(-0.199)#63 | 0.68%(-0.252)#3,026 |
| 64. | Pauls Valley | 0.41% | 0.63%(-0.212)#64 | 0.68%(-0.264)#3,080 |
| 65. | Hulbert | 0.41% | 0.63%(-0.214)#65 | 0.68%(-0.266)#3,091 |
| 66. | Bethel Acres | 0.39% | 0.63%(-0.235)#66 | 0.68%(-0.287)#3,199 |
| 67. | Hollis | 0.39% | 0.63%(-0.239)#67 | 0.68%(-0.292)#3,223 |
| 68. | Midwest City | 0.33% | 0.63%(-0.299)#68 | 0.68%(-0.352)#3,522 |
| 69. | Rattan | 0.31% | 0.63%(-0.316)#69 | 0.68%(-0.369)#3,609 |
| 70. | Bartlesville | 0.31% | 0.63%(-0.321)#70 | 0.68%(-0.373)#3,622 |
| 71. | Muskogee | 0.30% | 0.63%(-0.323)#71 | 0.68%(-0.375)#3,636 |
| 72. | Duncan | 0.28% | 0.63%(-0.349)#72 | 0.68%(-0.402)#3,768 |
| 73. | Cushing | 0.28% | 0.63%(-0.350)#73 | 0.68%(-0.403)#3,774 |
| 74. | Sallisaw | 0.27% | 0.63%(-0.356)#74 | 0.68%(-0.409)#3,809 |
| 75. | Afton | 0.26% | 0.63%(-0.369)#75 | 0.68%(-0.422)#3,883 |
| 76. | Mccord | 0.25% | 0.63%(-0.380)#76 | 0.68%(-0.432)#3,950 |
| 77. | Jones | 0.24% | 0.63%(-0.387)#77 | 0.68%(-0.439)#3,992 |
| 78. | Snyder | 0.23% | 0.63%(-0.399)#78 | 0.68%(-0.452)#4,066 |
| 79. | Poteau | 0.20% | 0.63%(-0.423)#79 | 0.68%(-0.475)#4,231 |
| 80. | Morris | 0.19% | 0.63%(-0.440)#80 | 0.68%(-0.493)#4,343 |
| 81. | Del City | 0.18% | 0.63%(-0.442)#81 | 0.68%(-0.494)#4,349 |
| 82. | Langley | 0.18% | 0.63%(-0.451)#82 | 0.68%(-0.503)#4,425 |
| 83. | Kingston | 0.17% | 0.63%(-0.452)#83 | 0.68%(-0.505)#4,436 |
| 84. | Jay | 0.17% | 0.63%(-0.454)#84 | 0.68%(-0.506)#4,446 |
| 85. | Heavener | 0.17% | 0.63%(-0.460)#85 | 0.68%(-0.512)#4,507 |
| 86. | Mcalester | 0.15% | 0.63%(-0.471)#86 | 0.68%(-0.524)#4,590 |
| 87. | Stillwater | 0.15% | 0.63%(-0.476)#87 | 0.68%(-0.528)#4,627 |
| 88. | Miami | 0.13% | 0.63%(-0.495)#88 | 0.68%(-0.548)#4,756 |
| 89. | Okmulgee | 0.12% | 0.63%(-0.503)#89 | 0.68%(-0.555)#4,823 |
| 90. | Altus | 0.10% | 0.63%(-0.525)#90 | 0.68%(-0.577)#4,977 |
| 91. | Tonkawa | 0.099% | 0.63%(-0.527)#91 | 0.68%(-0.579)#5,003 |
| 92. | Choctaw | 0.099% | 0.63%(-0.527)#92 | 0.68%(-0.580)#5,007 |
| 93. | Burns Flat | 0.098% | 0.63%(-0.528)#93 | 0.68%(-0.581)#5,012 |
| 94. | The Village | 0.095% | 0.63%(-0.531)#94 | 0.68%(-0.584)#5,036 |
| 95. | Shady Point | 0.093% | 0.63%(-0.533)#95 | 0.68%(-0.585)#5,053 |
| 96. | Shawnee | 0.073% | 0.63%(-0.553)#96 | 0.68%(-0.605)#5,203 |
| 97. | Enid | 0.069% | 0.63%(-0.557)#97 | 0.68%(-0.610)#5,235 |
| 98. | Pryor Creek | 0.063% | 0.63%(-0.563)#98 | 0.68%(-0.615)#5,288 |
| 99. | Ponca City | 0.0041% | 0.63%(-0.622)#99 | 0.68%(-0.674)#5,654 |
Common Questions
What are the Top 10 Cities with the Highest Percentage of Sri Lankan Population in Oklahoma?
Top 10 Cities with the Highest Percentage of Sri Lankan Population in Oklahoma are:
#1
22.54%
#2
18.48%
#3
11.63%
#4
8.33%
#5
6.31%
#6
5.73%
#7
5.14%
#8
4.25%
#9
4.13%
#10
3.45%
What city has the Highest Percentage of Sri Lankan Population in Oklahoma?
Chewey has the Highest Percentage of Sri Lankan Population in Oklahoma with 22.54%.
What is the Percentage of Sri Lankan Population in the State of Oklahoma?
Percentage of Sri Lankan Population in Oklahoma is 0.63%.
What is the Percentage of Sri Lankan Population in the United States?
Percentage of Sri Lankan Population in the United States is 0.68%.