Cities with the Highest Percentage of Immigrants from Western Africa in Georgia
RELATED REPORTS & OPTIONS
Western Africa
Georgia
Compare Cities
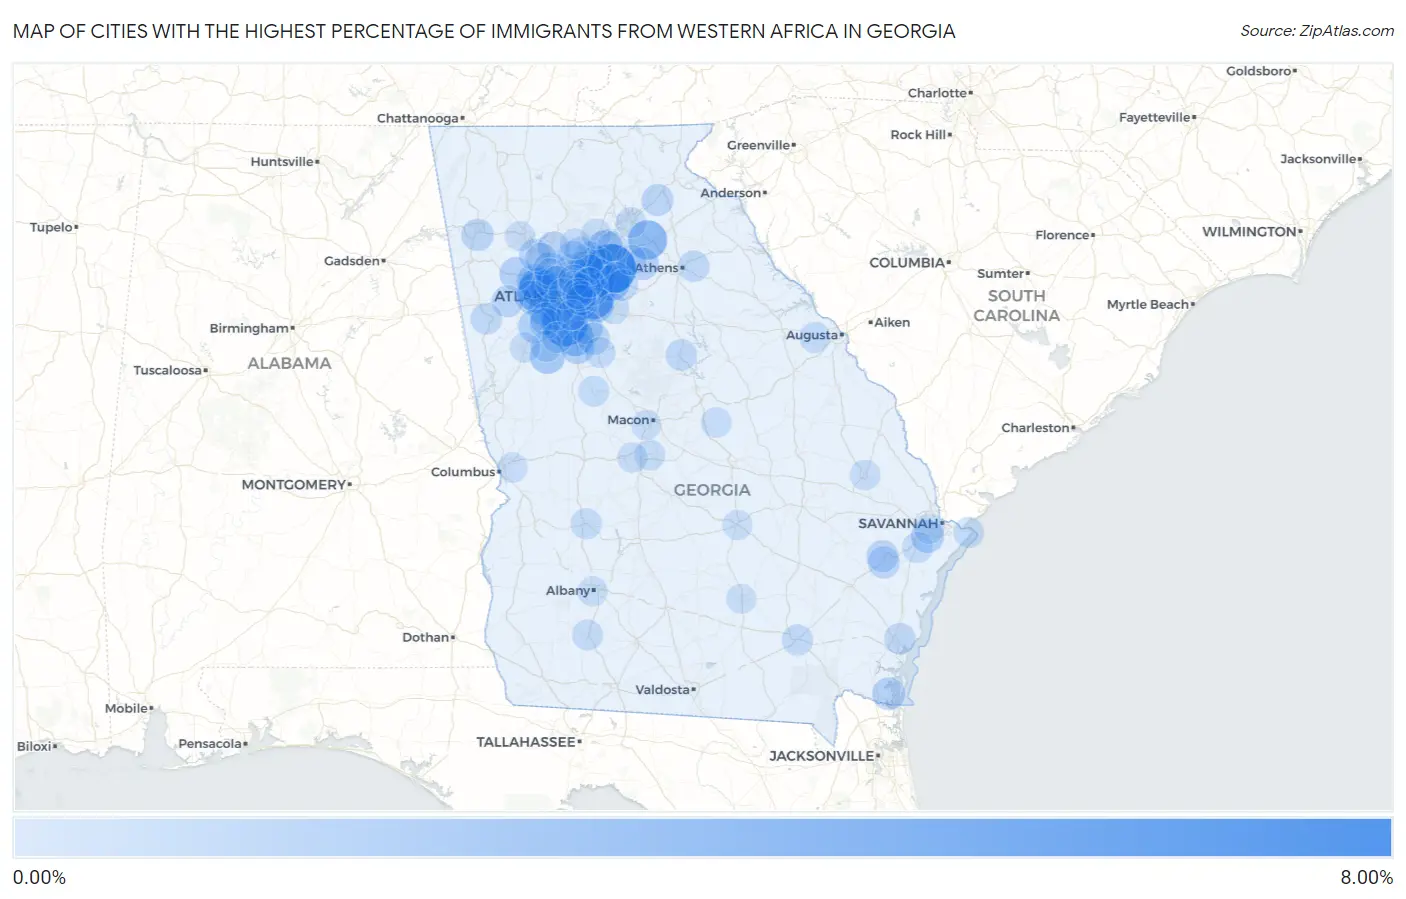
Map of Cities with the Highest Percentage of Immigrants from Western Africa in Georgia
0.00%
8.00%
Cities with the Highest Percentage of Immigrants from Western Africa in Georgia
| City | Western Africa | vs State | vs National | |
| 1. | Lawrenceville | 7.35% | 0.52%(+6.83)#14 | 0.30%(+7.06)#694 |
| 2. | Riverdale | 5.63% | 0.52%(+5.11)#15 | 0.30%(+5.33)#695 |
| 3. | Redan | 4.97% | 0.52%(+4.45)#16 | 0.30%(+4.67)#696 |
| 4. | Lithia Springs | 3.81% | 0.52%(+3.29)#17 | 0.30%(+3.51)#697 |
| 5. | Pendergrass | 3.46% | 0.52%(+2.94)#18 | 0.30%(+3.16)#698 |
| 6. | Austell | 3.37% | 0.52%(+2.85)#19 | 0.30%(+3.07)#699 |
| 7. | Lilburn | 3.29% | 0.52%(+2.77)#20 | 0.30%(+2.99)#700 |
| 8. | Lovejoy | 2.68% | 0.52%(+2.16)#21 | 0.30%(+2.38)#701 |
| 9. | Snellville | 2.52% | 0.52%(+2.00)#22 | 0.30%(+2.22)#702 |
| 10. | Chamblee | 2.50% | 0.52%(+1.98)#23 | 0.30%(+2.20)#703 |
| 11. | Panthersville | 2.16% | 0.52%(+1.65)#24 | 0.30%(+1.87)#704 |
| 12. | College Park | 2.04% | 0.52%(+1.52)#25 | 0.30%(+1.74)#705 |
| 13. | Senoia | 1.88% | 0.52%(+1.36)#26 | 0.30%(+1.58)#706 |
| 14. | Sugar Hill | 1.81% | 0.52%(+1.29)#27 | 0.30%(+1.51)#707 |
| 15. | Stonecrest | 1.79% | 0.52%(+1.27)#28 | 0.30%(+1.49)#708 |
| 16. | Mableton | 1.74% | 0.52%(+1.22)#29 | 0.30%(+1.44)#709 |
| 17. | Stone Mountain | 1.63% | 0.52%(+1.11)#30 | 0.30%(+1.33)#710 |
| 18. | South Fulton | 1.51% | 0.52%(+0.993)#31 | 0.30%(+1.21)#874 |
| 19. | Powder Springs | 1.48% | 0.52%(+0.964)#32 | 0.30%(+1.18)#875 |
| 20. | Douglasville | 1.46% | 0.52%(+0.945)#33 | 0.30%(+1.17)#876 |
| 21. | East Point | 1.38% | 0.52%(+0.864)#34 | 0.30%(+1.09)#877 |
| 22. | Palmetto | 1.35% | 0.52%(+0.836)#35 | 0.30%(+1.06)#878 |
| 23. | Duluth | 1.35% | 0.52%(+0.833)#36 | 0.30%(+1.05)#879 |
| 24. | Smyrna | 1.31% | 0.52%(+0.794)#37 | 0.30%(+1.01)#880 |
| 25. | Dallas | 1.27% | 0.52%(+0.756)#38 | 0.30%(+0.977)#881 |
| 26. | Hampton | 1.27% | 0.52%(+0.755)#39 | 0.30%(+0.976)#882 |
| 27. | Stockbridge | 1.20% | 0.52%(+0.684)#40 | 0.30%(+0.905)#883 |
| 28. | Clarkston | 1.19% | 0.52%(+0.670)#41 | 0.30%(+0.891)#884 |
| 29. | Georgetown | 1.18% | 0.52%(+0.658)#42 | 0.30%(+0.879)#885 |
| 30. | Marietta | 1.10% | 0.52%(+0.578)#43 | 0.30%(+0.799)#886 |
| 31. | Kings Bay Base | 1.06% | 0.52%(+0.543)#44 | 0.30%(+0.764)#887 |
| 32. | Winder | 1.04% | 0.52%(+0.519)#45 | 0.30%(+0.740)#888 |
| 33. | Peachtree Corners | 1.03% | 0.52%(+0.516)#46 | 0.30%(+0.737)#889 |
| 34. | Union City | 0.98% | 0.52%(+0.460)#47 | 0.30%(+0.681)#890 |
| 35. | Mcdonough | 0.87% | 0.52%(+0.350)#48 | 0.30%(+0.571)#891 |
| 36. | Johns Creek | 0.86% | 0.52%(+0.341)#49 | 0.30%(+0.562)#892 |
| 37. | Lindale | 0.85% | 0.52%(+0.335)#50 | 0.30%(+0.556)#893 |
| 38. | Raoul | 0.79% | 0.52%(+0.272)#51 | 0.30%(+0.493)#894 |
| 39. | Woodstock | 0.78% | 0.52%(+0.263)#52 | 0.30%(+0.484)#895 |
| 40. | Allenhurst | 0.78% | 0.52%(+0.258)#53 | 0.30%(+0.479)#896 |
| 41. | Hinesville | 0.77% | 0.52%(+0.250)#54 | 0.30%(+0.471)#897 |
| 42. | Scottdale | 0.77% | 0.52%(+0.248)#55 | 0.30%(+0.469)#898 |
| 43. | Acworth | 0.73% | 0.52%(+0.216)#56 | 0.30%(+0.437)#899 |
| 44. | Kennesaw | 0.73% | 0.52%(+0.216)#57 | 0.30%(+0.437)#900 |
| 45. | Villa Rica | 0.72% | 0.52%(+0.202)#58 | 0.30%(+0.423)#901 |
| 46. | Sandy Springs | 0.69% | 0.52%(+0.172)#59 | 0.30%(+0.392)#1,092 |
| 47. | Eatonton | 0.61% | 0.52%(+0.094)#60 | 0.30%(+0.315)#1,093 |
| 48. | Winterville | 0.60% | 0.52%(+0.082)#61 | 0.30%(+0.303)#1,094 |
| 49. | Alpharetta | 0.59% | 0.52%(+0.067)#62 | 0.30%(+0.288)#1,095 |
| 50. | Carrollton | 0.58% | 0.52%(+0.064)#63 | 0.30%(+0.285)#1,096 |
| 51. | North Decatur | 0.56% | 0.52%(+0.040)#64 | 0.30%(+0.261)#1,097 |
| 52. | Country Club Estates | 0.55% | 0.52%(+0.033)#65 | 0.30%(+0.254)#1,098 |
| 53. | Fairburn | 0.53% | 0.52%(+0.010)#66 | 0.30%(+0.231)#1,099 |
| 54. | Peachtree City | 0.52% | 0.52%(+0.002)#67 | 0.30%(+0.223)#1,100 |
| 55. | Norcross | 0.52% | 0.52%(+0.001)#68 | 0.30%(+0.221)#1,101 |
| 56. | Cusseta Chattahoochee County Unified Government | 0.51% | 0.52%(-0.008)#69 | 0.30%(+0.213)#1,102 |
| 57. | Kennesaw State University | 0.49% | 0.52%(-0.027)#70 | 0.30%(+0.194)#1,103 |
| 58. | Waycross | 0.49% | 0.52%(-0.028)#71 | 0.30%(+0.193)#1,104 |
| 59. | Fayetteville | 0.48% | 0.52%(-0.035)#72 | 0.30%(+0.186)#1,105 |
| 60. | Grayson | 0.48% | 0.52%(-0.037)#73 | 0.30%(+0.184)#1,106 |
| 61. | Roswell | 0.44% | 0.52%(-0.076)#74 | 0.30%(+0.145)#1,107 |
| 62. | Fair Oaks | 0.44% | 0.52%(-0.082)#75 | 0.30%(+0.139)#1,108 |
| 63. | Loganville | 0.43% | 0.52%(-0.085)#76 | 0.30%(+0.136)#1,109 |
| 64. | Americus | 0.42% | 0.52%(-0.100)#77 | 0.30%(+0.121)#1,110 |
| 65. | Vinings | 0.42% | 0.52%(-0.101)#78 | 0.30%(+0.119)#1,111 |
| 66. | Grovetown | 0.41% | 0.52%(-0.107)#79 | 0.30%(+0.114)#1,112 |
| 67. | North Druid Hills | 0.41% | 0.52%(-0.113)#80 | 0.30%(+0.108)#1,113 |
| 68. | Richmond Hill | 0.40% | 0.52%(-0.123)#81 | 0.30%(+0.097)#1,114 |
| 69. | Atlanta | 0.39% | 0.52%(-0.132)#82 | 0.30%(+0.089)#1,115 |
| 70. | Athens-Clarke County Unified Government (Balance) | 0.38% | 0.52%(-0.138)#83 | 0.30%(+0.083)#1,116 |
| 71. | Barnesville | 0.37% | 0.52%(-0.148)#84 | 0.30%(+0.073)#1,117 |
| 72. | Camilla | 0.35% | 0.52%(-0.170)#85 | 0.30%(+0.051)#1,118 |
| 73. | Locust Grove | 0.34% | 0.52%(-0.177)#86 | 0.30%(+0.044)#1,119 |
| 74. | Tybee Island | 0.32% | 0.52%(-0.199)#87 | 0.30%(+0.022)#1,120 |
| 75. | Brookhaven | 0.31% | 0.52%(-0.205)#88 | 0.30%(+0.015)#1,121 |
| 76. | Toomsboro | 0.30% | 0.52%(-0.214)#89 | 0.30%(+0.007)#1,122 |
| 77. | Candler Mcafee | 0.30% | 0.52%(-0.219)#90 | 0.30%(+0.002)#1,123 |
| 78. | Warner Robins | 0.28% | 0.52%(-0.241)#91 | 0.30%(-0.020)#1,124 |
| 79. | Gainesville | 0.27% | 0.52%(-0.245)#92 | 0.30%(-0.024)#1,125 |
| 80. | Conyers | 0.27% | 0.52%(-0.249)#93 | 0.30%(-0.028)#1,126 |
| 81. | Auburn | 0.26% | 0.52%(-0.262)#94 | 0.30%(-0.041)#1,127 |
| 82. | Milton | 0.26% | 0.52%(-0.263)#95 | 0.30%(-0.042)#1,128 |
| 83. | Belvedere Park | 0.23% | 0.52%(-0.285)#96 | 0.30%(-0.064)#1,129 |
| 84. | Forest Park | 0.23% | 0.52%(-0.289)#97 | 0.30%(-0.068)#1,130 |
| 85. | Decatur | 0.23% | 0.52%(-0.293)#98 | 0.30%(-0.072)#1,131 |
| 86. | Statesboro | 0.22% | 0.52%(-0.302)#99 | 0.30%(-0.081)#1,132 |
| 87. | Tucker | 0.21% | 0.52%(-0.308)#100 | 0.30%(-0.087)#1,133 |
| 88. | Newnan | 0.21% | 0.52%(-0.312)#101 | 0.30%(-0.092)#1,134 |
| 89. | Fort Valley | 0.20% | 0.52%(-0.315)#102 | 0.30%(-0.094)#1,135 |
| 90. | Georgetown Quitman County Unified Government | 0.18% | 0.52%(-0.335)#103 | 0.30%(-0.114)#1,136 |
| 91. | Albany | 0.16% | 0.52%(-0.356)#104 | 0.30%(-0.135)#1,137 |
| 92. | Macon Bibb County | 0.15% | 0.52%(-0.369)#105 | 0.30%(-0.148)#1,138 |
| 93. | Columbus | 0.14% | 0.52%(-0.376)#106 | 0.30%(-0.155)#1,139 |
| 94. | Mcrae Helena | 0.14% | 0.52%(-0.377)#107 | 0.30%(-0.156)#1,140 |
| 95. | Cumming | 0.14% | 0.52%(-0.383)#108 | 0.30%(-0.162)#1,141 |
| 96. | Douglas | 0.12% | 0.52%(-0.399)#109 | 0.30%(-0.178)#1,142 |
| 97. | Buford | 0.099% | 0.52%(-0.420)#110 | 0.30%(-0.199)#1,143 |
| 98. | Savannah | 0.098% | 0.52%(-0.421)#111 | 0.30%(-0.200)#1,144 |
| 99. | Augusta-Richmond County Consolidated Government (Balance) | 0.095% | 0.52%(-0.423)#112 | 0.30%(-0.202)#1,145 |
| 100. | Cartersville | 0.095% | 0.52%(-0.423)#113 | 0.30%(-0.202)#1,146 |
Common Questions
What are the Top 10 Cities with the Highest Percentage of Immigrants from Western Africa in Georgia?
Top 10 Cities with the Highest Percentage of Immigrants from Western Africa in Georgia are:
#1
7.35%
#2
5.63%
#3
4.97%
#4
3.81%
#5
3.46%
#6
3.37%
#7
3.29%
#8
2.68%
#9
2.52%
#10
2.50%
What city has the Highest Percentage of Immigrants from Western Africa in Georgia?
Lawrenceville has the Highest Percentage of Immigrants from Western Africa in Georgia with 7.35%.
What is the Percentage of Immigrants from Western Africa in the State of Georgia?
Percentage of Immigrants from Western Africa in Georgia is 0.52%.
What is the Percentage of Immigrants from Western Africa in the United States?
Percentage of Immigrants from Western Africa in the United States is 0.30%.