Cities with the Most Immigrants from Thailand in Oregon
RELATED REPORTS & OPTIONS
Thailand
Oregon
Compare Cities
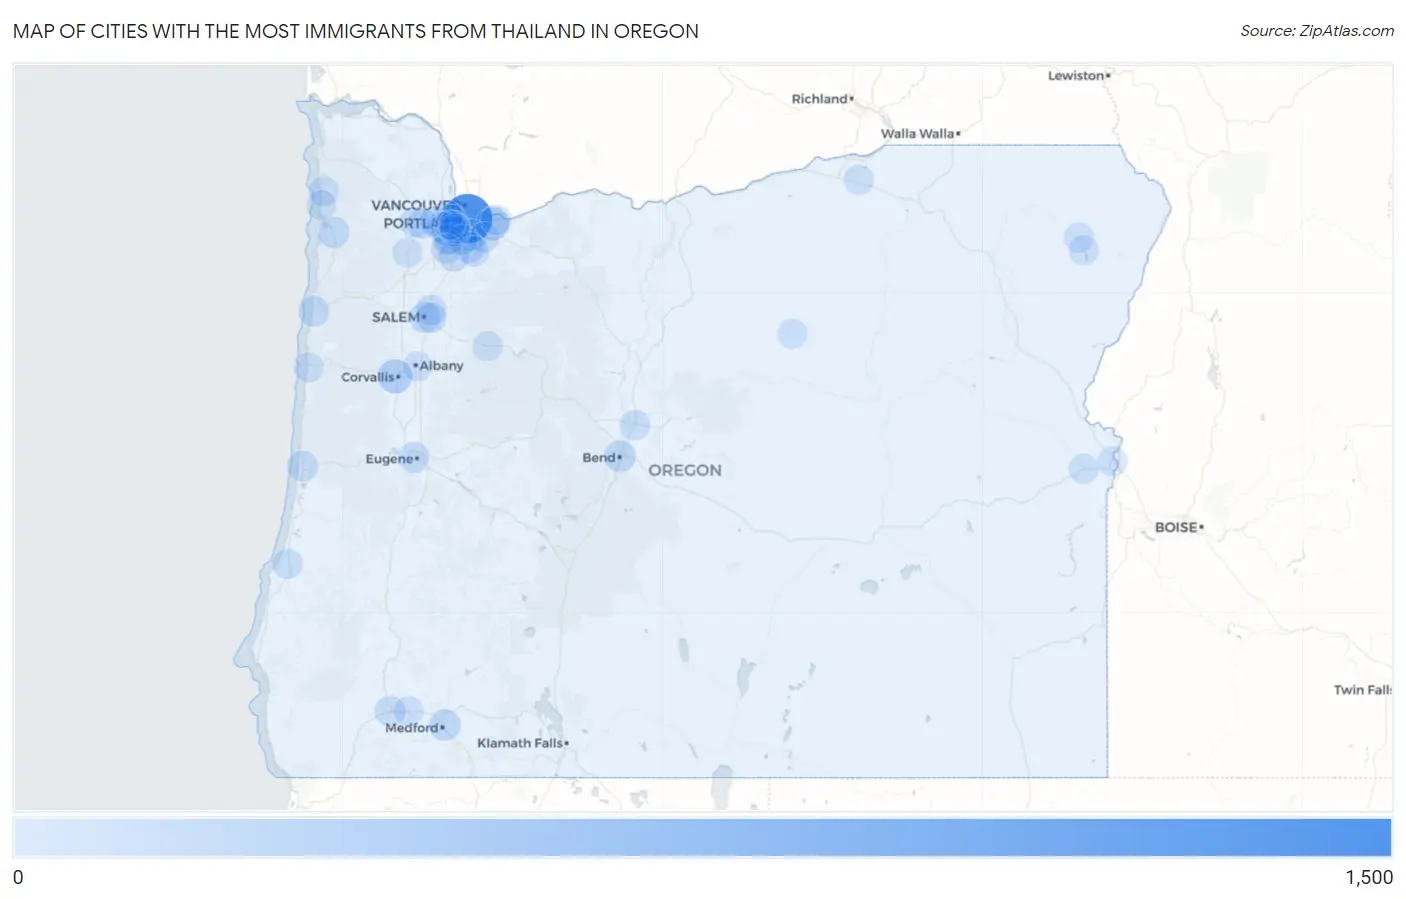
Map of Cities with the Most Immigrants from Thailand in Oregon
0
1,500
Cities with the Most Immigrants from Thailand in Oregon
| City | Thailand | vs State | vs National | |
| 1. | Portland | 1,062 | 3,190(33.29%)#1 | 256,546(0.41%)#29 |
| 2. | Beaverton | 270 | 3,190(8.46%)#2 | 256,546(0.11%)#124 |
| 3. | Corvallis | 220 | 3,190(6.90%)#3 | 256,546(0.09%)#160 |
| 4. | Gresham | 164 | 3,190(5.14%)#4 | 256,546(0.06%)#236 |
| 5. | Medford | 82 | 3,190(2.57%)#5 | 256,546(0.03%)#530 |
| 6. | Bend | 81 | 3,190(2.54%)#6 | 256,546(0.03%)#535 |
| 7. | Milwaukie | 78 | 3,190(2.45%)#7 | 256,546(0.03%)#557 |
| 8. | Tillamook | 63 | 3,190(1.97%)#8 | 256,546(0.02%)#671 |
| 9. | Salem | 60 | 3,190(1.88%)#9 | 256,546(0.02%)#694 |
| 10. | Bethany | 60 | 3,190(1.88%)#10 | 256,546(0.02%)#702 |
| 11. | Eugene | 59 | 3,190(1.85%)#11 | 256,546(0.02%)#717 |
| 12. | West Linn | 55 | 3,190(1.72%)#12 | 256,546(0.02%)#765 |
| 13. | Lincoln City | 46 | 3,190(1.44%)#13 | 256,546(0.02%)#893 |
| 14. | Aloha | 43 | 3,190(1.35%)#14 | 256,546(0.02%)#931 |
| 15. | Grants Pass | 42 | 3,190(1.32%)#15 | 256,546(0.02%)#949 |
| 16. | Forest Grove | 40 | 3,190(1.25%)#16 | 256,546(0.02%)#985 |
| 17. | Florence | 40 | 3,190(1.25%)#17 | 256,546(0.02%)#994 |
| 18. | Tigard | 38 | 3,190(1.19%)#18 | 256,546(0.01%)#1,022 |
| 19. | Happy Valley | 38 | 3,190(1.19%)#19 | 256,546(0.01%)#1,027 |
| 20. | Hayesville | 33 | 3,190(1.03%)#20 | 256,546(0.01%)#1,136 |
| 21. | Wilsonville | 30 | 3,190(0.94%)#21 | 256,546(0.01%)#1,194 |
| 22. | Oregon City | 29 | 3,190(0.91%)#22 | 256,546(0.01%)#1,225 |
| 23. | Troutdale | 28 | 3,190(0.88%)#23 | 256,546(0.01%)#1,261 |
| 24. | Redmond | 26 | 3,190(0.82%)#24 | 256,546(0.01%)#1,320 |
| 25. | Bull Mountain | 26 | 3,190(0.82%)#25 | 256,546(0.01%)#1,335 |
| 26. | Garden Home Whitford | 26 | 3,190(0.82%)#26 | 256,546(0.01%)#1,339 |
| 27. | Hillsboro | 25 | 3,190(0.78%)#27 | 256,546(0.01%)#1,350 |
| 28. | Cedar Mill | 21 | 3,190(0.66%)#28 | 256,546(0.01%)#1,518 |
| 29. | Bayside Gardens | 19 | 3,190(0.60%)#29 | 256,546(0.01%)#1,623 |
| 30. | Four Corners | 18 | 3,190(0.56%)#30 | 256,546(0.01%)#1,647 |
| 31. | Cornelius | 15 | 3,190(0.47%)#31 | 256,546(0.01%)#1,802 |
| 32. | Coos Bay | 13 | 3,190(0.41%)#32 | 256,546(0.01%)#1,918 |
| 33. | West Slope | 13 | 3,190(0.41%)#33 | 256,546(0.01%)#1,941 |
| 34. | Lake Oswego | 11 | 3,190(0.34%)#34 | 256,546(0.00%)#2,043 |
| 35. | Sherwood | 11 | 3,190(0.34%)#35 | 256,546(0.00%)#2,061 |
| 36. | Raleigh Hills | 10 | 3,190(0.31%)#36 | 256,546(0.00%)#2,163 |
| 37. | Ontario | 8 | 3,190(0.25%)#37 | 256,546(0.00%)#2,317 |
| 38. | Vale | 8 | 3,190(0.25%)#38 | 256,546(0.00%)#2,350 |
| 39. | Marlene | 7 | 3,190(0.22%)#39 | 256,546(0.00%)#2,412 |
| 40. | Newport | 6 | 3,190(0.19%)#40 | 256,546(0.00%)#2,496 |
| 41. | Rogue River | 6 | 3,190(0.19%)#41 | 256,546(0.00%)#2,530 |
| 42. | Mill City | 5 | 3,190(0.16%)#42 | 256,546(0.00%)#2,621 |
| 43. | Enterprise | 3 | 3,190(0.09%)#43 | 256,546(0.00%)#2,751 |
| 44. | Rockaway Beach | 3 | 3,190(0.09%)#44 | 256,546(0.00%)#2,764 |
| 45. | Stanfield | 2 | 3,190(0.06%)#45 | 256,546(0.00%)#2,830 |
| 46. | Yamhill | 2 | 3,190(0.06%)#46 | 256,546(0.00%)#2,848 |
| 47. | Spray | 2 | 3,190(0.06%)#47 | 256,546(0.00%)#2,891 |
| 48. | Albany | 1 | 3,190(0.03%)#48 | 256,546(0.00%)#2,899 |
| 49. | Cedar Hills | 1 | 3,190(0.03%)#49 | 256,546(0.00%)#2,921 |
| 50. | Joseph | 1 | 3,190(0.03%)#50 | 256,546(0.00%)#2,944 |
Common Questions
What are the Top 10 Cities with the Most Immigrants from Thailand in Oregon?
Top 10 Cities with the Most Immigrants from Thailand in Oregon are:
What city has the Most Immigrants from Thailand in Oregon?
Portland has the Most Immigrants from Thailand in Oregon with 1,062.
What is the Total Immigrants from Thailand in the State of Oregon?
Total Immigrants from Thailand in Oregon is 3,190.
What is the Total Immigrants from Thailand in the United States?
Total Immigrants from Thailand in the United States is 256,546.