Mount Olive, IL
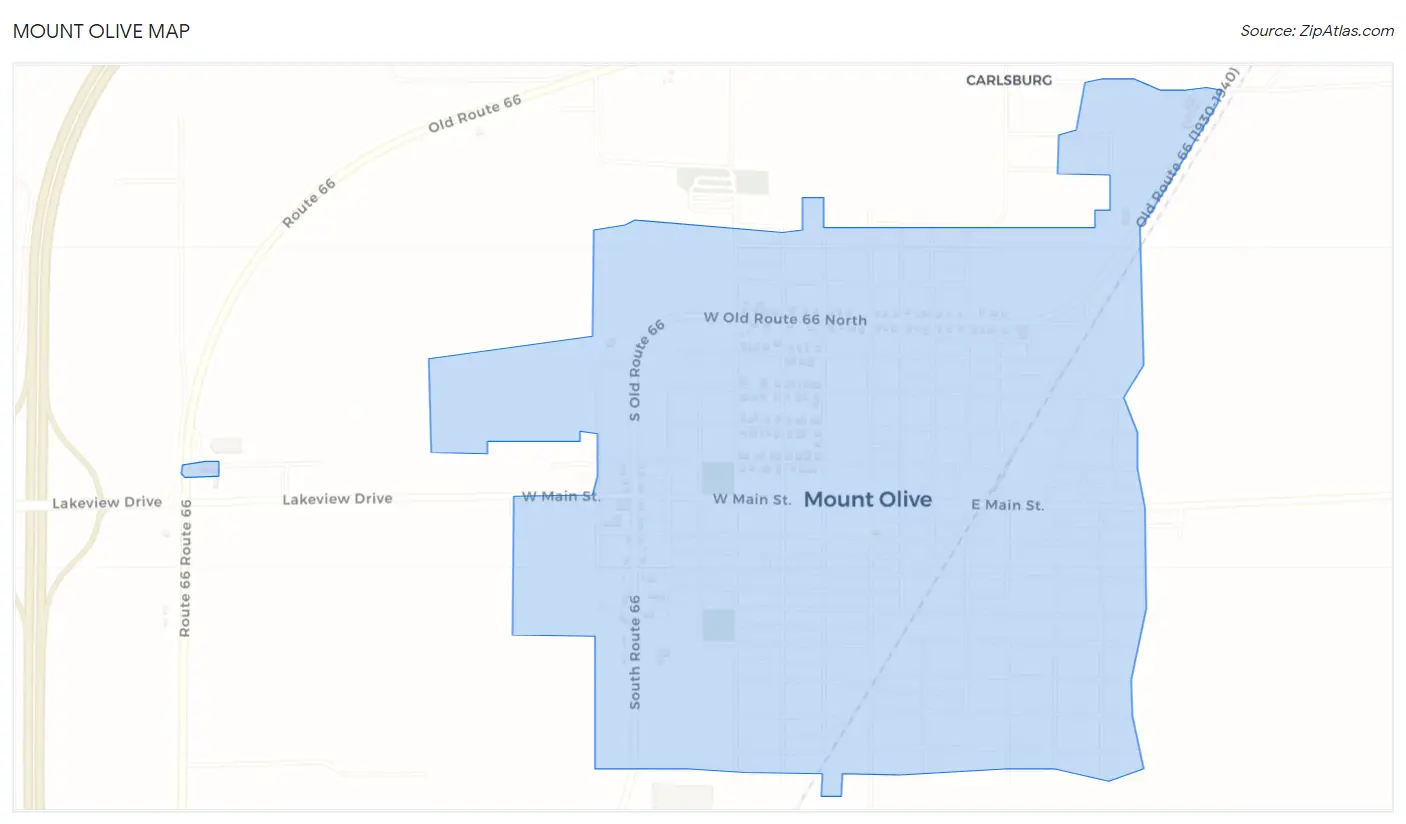
Mount Olive Map
Mount Olive Overview
2,144
TOTAL POPULATION
1,068
MALE POPULATION
1,076
FEMALE POPULATION
99.26
MALES / 100 FEMALES
100.75
FEMALES / 100 MALES
48.6
MEDIAN AGE
2.8
AVG FAMILY SIZE
2.3
AVG HOUSEHOLD SIZE
$29,393
PER CAPITA INCOME
$56,800
AVG FAMILY INCOME
$46,824
AVG HOUSEHOLD INCOME
26.5%
WAGE / INCOME GAP [ % ]
73.5¢/ $1
WAGE / INCOME GAP [ $ ]
0.44
INEQUALITY / GINI INDEX
884
LABOR FORCE [ PEOPLE ]
49.7%
PERCENT IN LABOR FORCE
8.1%
UNEMPLOYMENT RATE
Mount Olive Zip Codes
Mount Olive Area Codes
Race in Mount Olive
The most populous races in Mount Olive are White / Caucasian (2,059 | 96.0%), Asian (59 | 2.8%), and Two or more Races (17 | 0.8%).
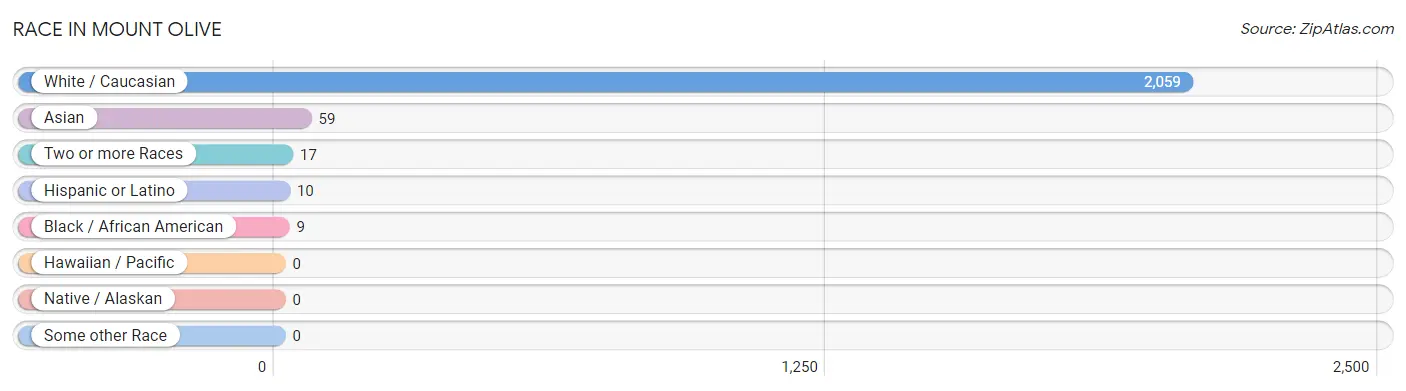
| Race | # Population | % Population |
| Asian | 59 | 2.8% |
| Black / African American | 9 | 0.4% |
| Hawaiian / Pacific | 0 | 0.0% |
| Hispanic or Latino | 10 | 0.5% |
| Native / Alaskan | 0 | 0.0% |
| White / Caucasian | 2,059 | 96.0% |
| Two or more Races | 17 | 0.8% |
| Some other Race | 0 | 0.0% |
| Total | 2,144 | 100.0% |
Ancestry in Mount Olive
The most populous ancestries reported in Mount Olive are German (789 | 36.8%), Irish (223 | 10.4%), English (145 | 6.8%), Italian (85 | 4.0%), and American (78 | 3.6%), together accounting for 61.6% of all Mount Olive residents.
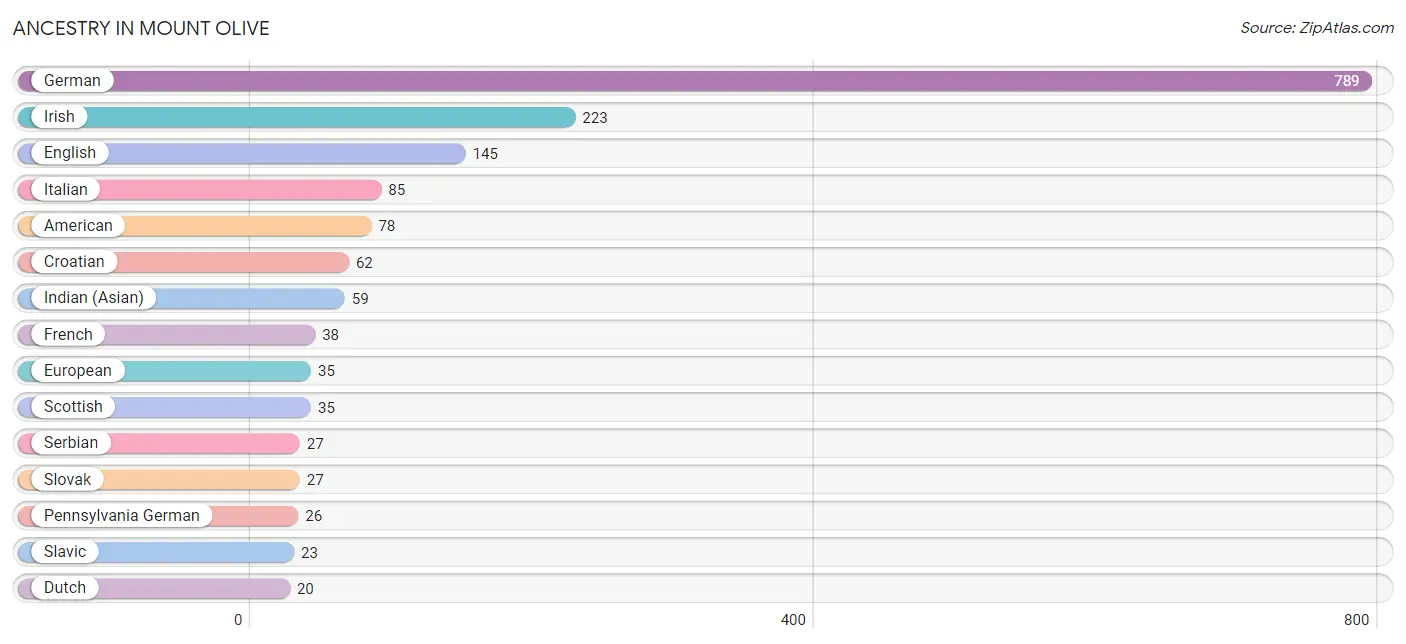
| Ancestry | # Population | % Population |
| American | 78 | 3.6% |
| Canadian | 8 | 0.4% |
| Croatian | 62 | 2.9% |
| Czech | 15 | 0.7% |
| Czechoslovakian | 18 | 0.8% |
| Danish | 2 | 0.1% |
| Dutch | 20 | 0.9% |
| English | 145 | 6.8% |
| European | 35 | 1.6% |
| French | 38 | 1.8% |
| German | 789 | 36.8% |
| Hungarian | 5 | 0.2% |
| Indian (Asian) | 59 | 2.8% |
| Irish | 223 | 10.4% |
| Italian | 85 | 4.0% |
| Mexican | 7 | 0.3% |
| Pennsylvania German | 26 | 1.2% |
| Polish | 19 | 0.9% |
| Puerto Rican | 3 | 0.1% |
| Romanian | 6 | 0.3% |
| Russian | 20 | 0.9% |
| Scotch-Irish | 6 | 0.3% |
| Scottish | 35 | 1.6% |
| Serbian | 27 | 1.3% |
| Slavic | 23 | 1.1% |
| Slovak | 27 | 1.3% |
| Swedish | 12 | 0.6% |
| Swiss | 4 | 0.2% |
| Turkish | 8 | 0.4% |
| Ukrainian | 4 | 0.2% |
| Welsh | 14 | 0.6% | View All 31 Rows |
Immigrants in Mount Olive
The most numerous immigrant groups reported in Mount Olive came from Asia (14 | 0.6%), Philippines (9 | 0.4%), South Eastern Asia (9 | 0.4%), India (5 | 0.2%), and South Central Asia (5 | 0.2%), together accounting for 1.9% of all Mount Olive residents.
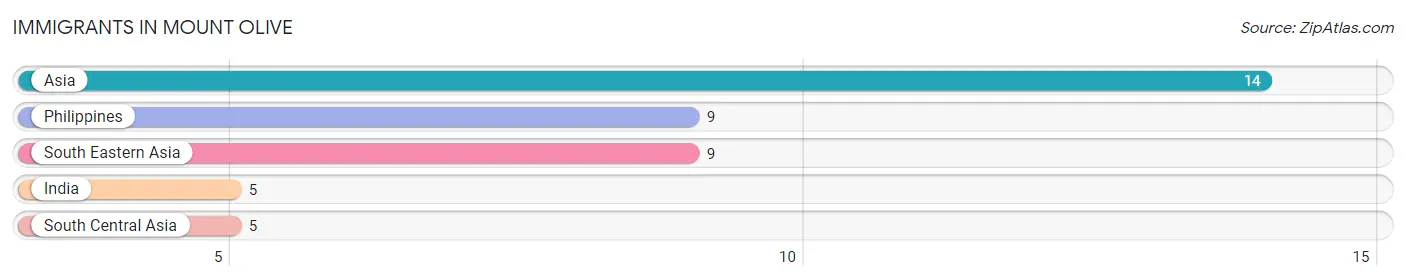
| Immigration Origin | # Population | % Population |
| Asia | 14 | 0.6% |
| India | 5 | 0.2% |
| Philippines | 9 | 0.4% |
| South Central Asia | 5 | 0.2% |
| South Eastern Asia | 9 | 0.4% | View All 5 Rows |
Sex and Age in Mount Olive
Sex and Age in Mount Olive
The most populous age groups in Mount Olive are 65 to 69 Years (123 | 11.5%) for men and 60 to 64 Years (108 | 10.0%) for women.
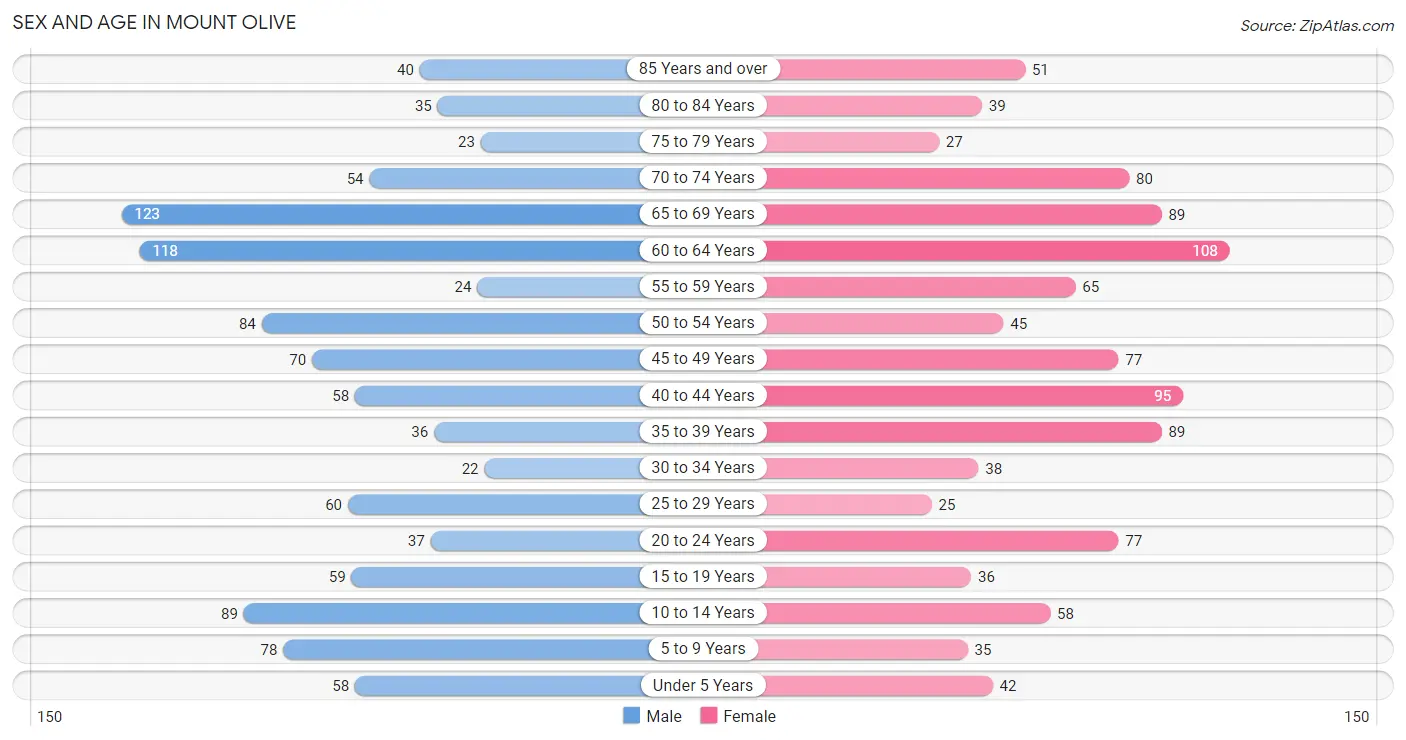
| Age Bracket | Male | Female |
| Under 5 Years | 58 (5.4%) | 42 (3.9%) |
| 5 to 9 Years | 78 (7.3%) | 35 (3.3%) |
| 10 to 14 Years | 89 (8.3%) | 58 (5.4%) |
| 15 to 19 Years | 59 (5.5%) | 36 (3.4%) |
| 20 to 24 Years | 37 (3.5%) | 77 (7.2%) |
| 25 to 29 Years | 60 (5.6%) | 25 (2.3%) |
| 30 to 34 Years | 22 (2.1%) | 38 (3.5%) |
| 35 to 39 Years | 36 (3.4%) | 89 (8.3%) |
| 40 to 44 Years | 58 (5.4%) | 95 (8.8%) |
| 45 to 49 Years | 70 (6.6%) | 77 (7.2%) |
| 50 to 54 Years | 84 (7.9%) | 45 (4.2%) |
| 55 to 59 Years | 24 (2.2%) | 65 (6.0%) |
| 60 to 64 Years | 118 (11.1%) | 108 (10.0%) |
| 65 to 69 Years | 123 (11.5%) | 89 (8.3%) |
| 70 to 74 Years | 54 (5.1%) | 80 (7.4%) |
| 75 to 79 Years | 23 (2.1%) | 27 (2.5%) |
| 80 to 84 Years | 35 (3.3%) | 39 (3.6%) |
| 85 Years and over | 40 (3.7%) | 51 (4.7%) |
| Total | 1,068 (100.0%) | 1,076 (100.0%) |
Families and Households in Mount Olive
Median Family Size in Mount Olive
The median family size in Mount Olive is 2.76 persons per family, with single male/father families (59 | 9.5%) accounting for the largest median family size of 3.03 persons per family. On the other hand, single female/mother families (135 | 21.6%) represent the smallest median family size with 2.64 persons per family.
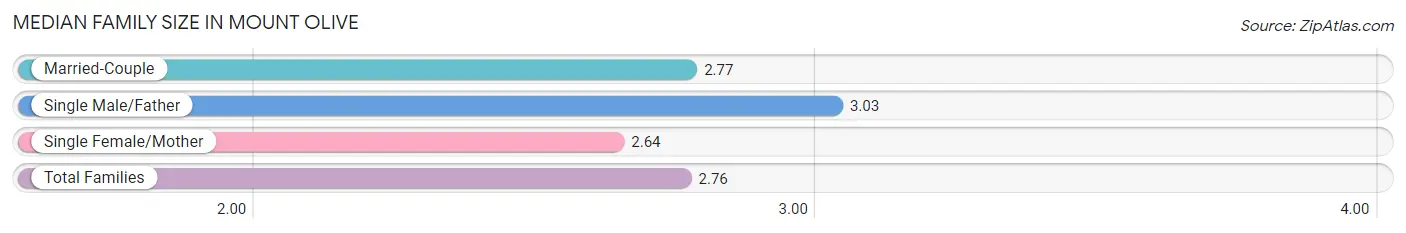
| Family Type | # Families | Family Size |
| Married-Couple | 430 (68.9%) | 2.77 |
| Single Male/Father | 59 (9.5%) | 3.03 |
| Single Female/Mother | 135 (21.6%) | 2.64 |
| Total Families | 624 (100.0%) | 2.76 |
Median Household Size in Mount Olive
The median household size in Mount Olive is 2.34 persons per household, with single male/father households (59 | 6.4%) accounting for the largest median household size of 3.56 persons per household. non-family households (294 | 32.0%) represent the smallest median household size with 1.18 persons per household.
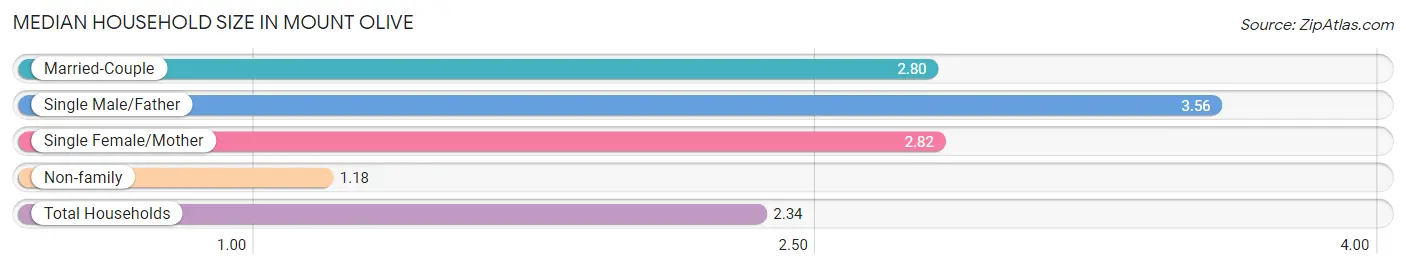
| Household Type | # Households | Household Size |
| Married-Couple | 430 (46.8%) | 2.80 |
| Single Male/Father | 59 (6.4%) | 3.56 |
| Single Female/Mother | 135 (14.7%) | 2.82 |
| Non-family | 294 (32.0%) | 1.18 |
| Total Households | 918 (100.0%) | 2.34 |
Household Size by Marriage Status in Mount Olive
Out of a total of 918 households in Mount Olive, 624 (68.0%) are family households, while 294 (32.0%) are nonfamily households. The most numerous type of family households are 2-person households, comprising 410, and the most common type of nonfamily households are 1-person households, comprising 254.
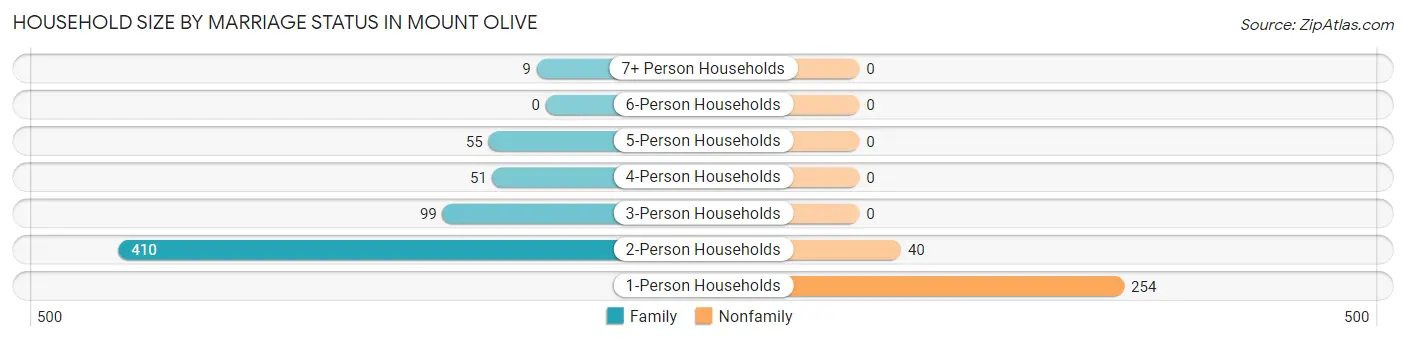
| Household Size | Family Households | Nonfamily Households |
| 1-Person Households | - | 254 (27.7%) |
| 2-Person Households | 410 (44.7%) | 40 (4.4%) |
| 3-Person Households | 99 (10.8%) | 0 (0.0%) |
| 4-Person Households | 51 (5.6%) | 0 (0.0%) |
| 5-Person Households | 55 (6.0%) | 0 (0.0%) |
| 6-Person Households | 0 (0.0%) | 0 (0.0%) |
| 7+ Person Households | 9 (1.0%) | 0 (0.0%) |
| Total | 624 (68.0%) | 294 (32.0%) |
Female Fertility in Mount Olive
Fertility by Age in Mount Olive
Average fertility rate in Mount Olive is 56.0 births per 1,000 women. Women in the age bracket of 20 to 34 years have the highest fertility rate with 129.0 births per 1,000 women. Women in the age bracket of 20 to 34 years acount for 72.0% of all women with births.

| Age Bracket | Women with Births | Births / 1,000 Women |
| 15 to 19 years | 0 (0.0%) | 0.0 |
| 20 to 34 years | 18 (72.0%) | 129.0 |
| 35 to 50 years | 7 (28.0%) | 26.0 |
| Total | 25 (100.0%) | 56.0 |
Fertility by Age by Marriage Status in Mount Olive
68.0% of women with births (25) in Mount Olive are married. The highest percentage of unmarried women with births falls into 20 to 34 years age bracket with 44.4% of them unmarried at the time of birth, while the lowest percentage of unmarried women with births belong to 35 to 50 years age bracket with 0.0% of them unmarried.
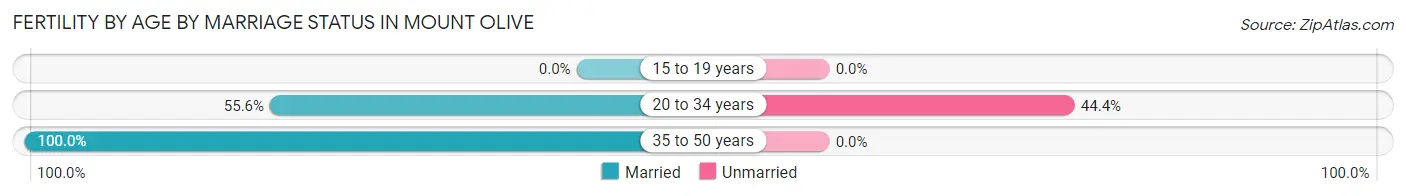
| Age Bracket | Married | Unmarried |
| 15 to 19 years | 0 (0.0%) | 0 (0.0%) |
| 20 to 34 years | 10 (55.6%) | 8 (44.4%) |
| 35 to 50 years | 7 (100.0%) | 0 (0.0%) |
| Total | 17 (68.0%) | 8 (32.0%) |
Fertility by Education in Mount Olive
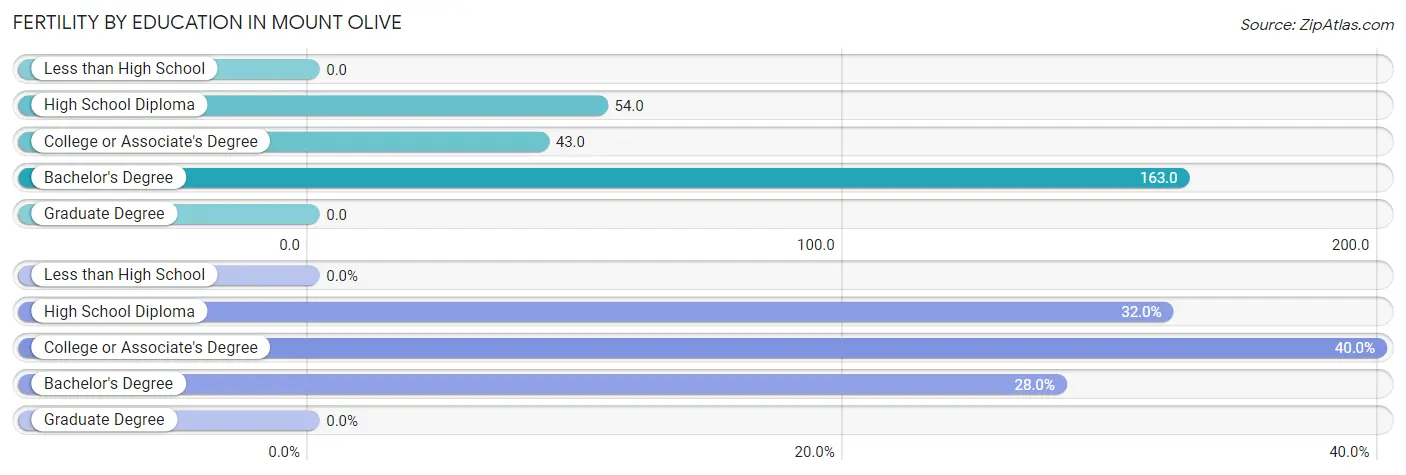
| Educational Attainment | Women with Births | Births / 1,000 Women |
| Less than High School | 0 (0.0%) | 0.0 |
| High School Diploma | 8 (32.0%) | 54.0 |
| College or Associate's Degree | 10 (40.0%) | 43.0 |
| Bachelor's Degree | 7 (28.0%) | 163.0 |
| Graduate Degree | 0 (0.0%) | 0.0 |
| Total | 25 (100.0%) | 56.0 |
Fertility by Education by Marriage Status in Mount Olive
32.0% of women with births in Mount Olive are unmarried. Women with the educational attainment of college or associate's degree are most likely to be married with 100.0% of them married at childbirth, while women with the educational attainment of high school diploma are least likely to be married with 100.0% of them unmarried at childbirth.
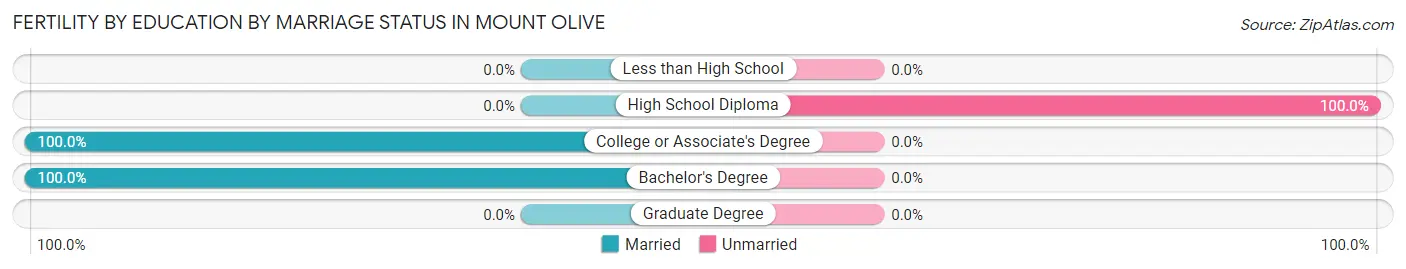
| Educational Attainment | Married | Unmarried |
| Less than High School | 0 (0.0%) | 0 (0.0%) |
| High School Diploma | 0 (0.0%) | 8 (100.0%) |
| College or Associate's Degree | 10 (100.0%) | 0 (0.0%) |
| Bachelor's Degree | 7 (100.0%) | 0 (0.0%) |
| Graduate Degree | 0 (0.0%) | 0 (0.0%) |
| Total | 17 (68.0%) | 8 (32.0%) |
Income in Mount Olive
Income Overview in Mount Olive
Per Capita Income in Mount Olive is $29,393, while median incomes of families and households are $56,800 and $46,824 respectively.
| Characteristic | Number | Measure |
| Per Capita Income | 2,144 | $29,393 |
| Median Family Income | 624 | $56,800 |
| Mean Family Income | 624 | $77,294 |
| Median Household Income | 918 | $46,824 |
| Mean Household Income | 918 | $66,115 |
| Income Deficit | 624 | $0 |
| Wage / Income Gap (%) | 2,144 | 26.51% |
| Wage / Income Gap ($) | 2,144 | 73.49¢ per $1 |
| Gini / Inequality Index | 2,144 | 0.44 |
Earnings by Sex in Mount Olive
Average Earnings in Mount Olive are $34,951, $41,250 for men and $30,313 for women, a difference of 26.5%.
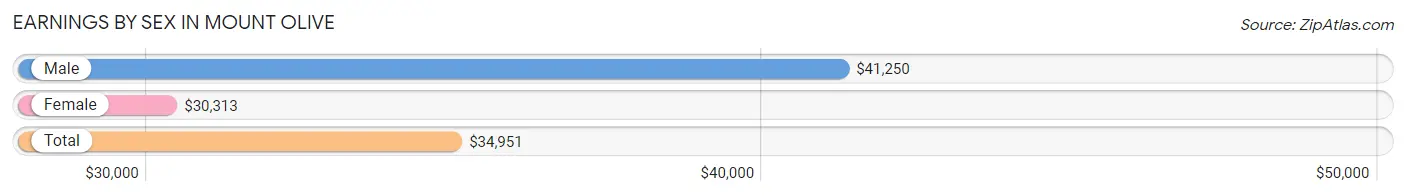
| Sex | Number | Average Earnings |
| Male | 473 (53.0%) | $41,250 |
| Female | 419 (47.0%) | $30,313 |
| Total | 892 (100.0%) | $34,951 |
Earnings by Sex by Income Bracket in Mount Olive
The most common earnings brackets in Mount Olive are $30,000 to $34,999 for men (54 | 11.4%) and $35,000 to $39,999 for women (48 | 11.5%).
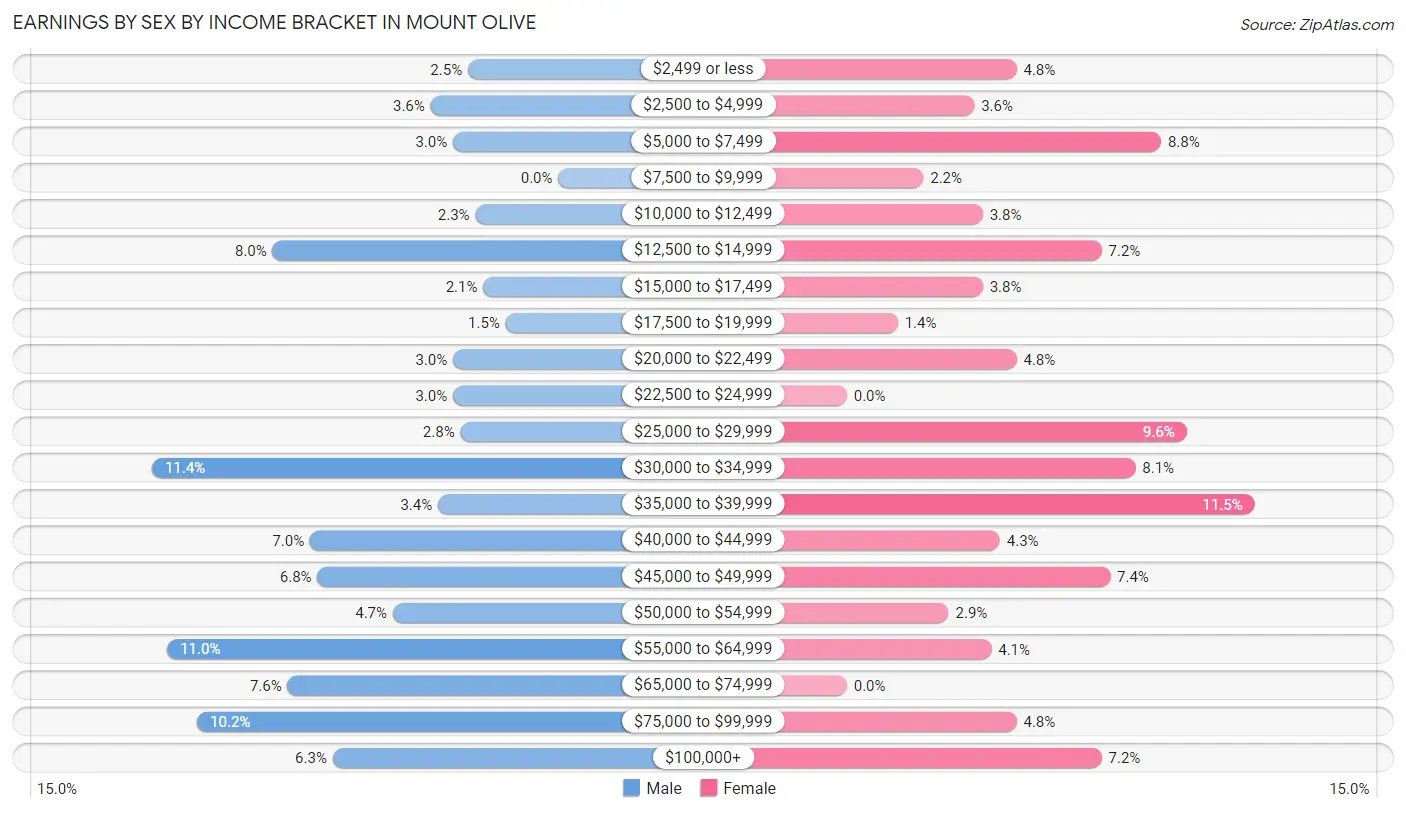
| Income | Male | Female |
| $2,499 or less | 12 (2.5%) | 20 (4.8%) |
| $2,500 to $4,999 | 17 (3.6%) | 15 (3.6%) |
| $5,000 to $7,499 | 14 (3.0%) | 37 (8.8%) |
| $7,500 to $9,999 | 0 (0.0%) | 9 (2.1%) |
| $10,000 to $12,499 | 11 (2.3%) | 16 (3.8%) |
| $12,500 to $14,999 | 38 (8.0%) | 30 (7.2%) |
| $15,000 to $17,499 | 10 (2.1%) | 16 (3.8%) |
| $17,500 to $19,999 | 7 (1.5%) | 6 (1.4%) |
| $20,000 to $22,499 | 14 (3.0%) | 20 (4.8%) |
| $22,500 to $24,999 | 14 (3.0%) | 0 (0.0%) |
| $25,000 to $29,999 | 13 (2.8%) | 40 (9.6%) |
| $30,000 to $34,999 | 54 (11.4%) | 34 (8.1%) |
| $35,000 to $39,999 | 16 (3.4%) | 48 (11.5%) |
| $40,000 to $44,999 | 33 (7.0%) | 18 (4.3%) |
| $45,000 to $49,999 | 32 (6.8%) | 31 (7.4%) |
| $50,000 to $54,999 | 22 (4.6%) | 12 (2.9%) |
| $55,000 to $64,999 | 52 (11.0%) | 17 (4.1%) |
| $65,000 to $74,999 | 36 (7.6%) | 0 (0.0%) |
| $75,000 to $99,999 | 48 (10.2%) | 20 (4.8%) |
| $100,000+ | 30 (6.3%) | 30 (7.2%) |
| Total | 473 (100.0%) | 419 (100.0%) |
Earnings by Sex by Educational Attainment in Mount Olive
Average earnings in Mount Olive are $42,386 for men and $35,042 for women, a difference of 17.3%. Men with an educational attainment of bachelor's degree enjoy the highest average annual earnings of $66,875, while those with high school diploma education earn the least with $38,611. Women with an educational attainment of bachelor's degree earn the most with the average annual earnings of $49,063, while those with high school diploma education have the smallest earnings of $33,021.
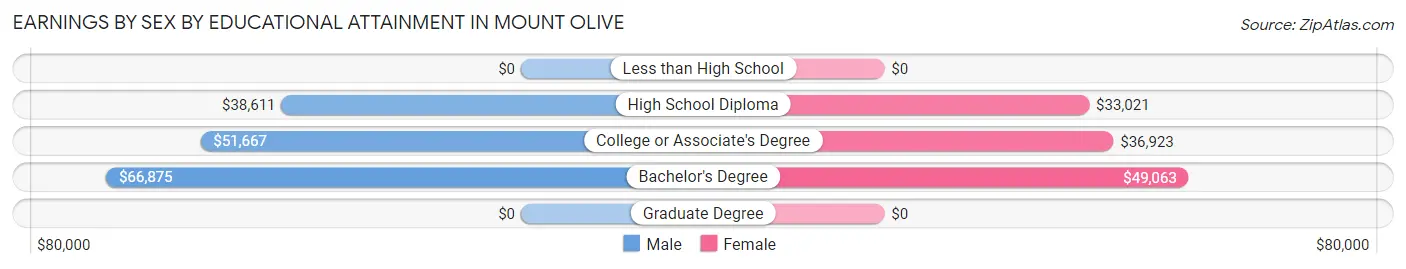
| Educational Attainment | Male Income | Female Income |
| Less than High School | - | - |
| High School Diploma | $38,611 | $33,021 |
| College or Associate's Degree | $51,667 | $36,923 |
| Bachelor's Degree | $66,875 | $49,063 |
| Graduate Degree | - | - |
| Total | $42,386 | $35,042 |
Family Income in Mount Olive
Family Income Brackets in Mount Olive
According to the Mount Olive family income data, there are 149 families falling into the $35,000 to $49,999 income range, which is the most common income bracket and makes up 23.9% of all families. Conversely, the $200,000+ income bracket is the least frequent group with only 11 families (1.8%) belonging to this category.
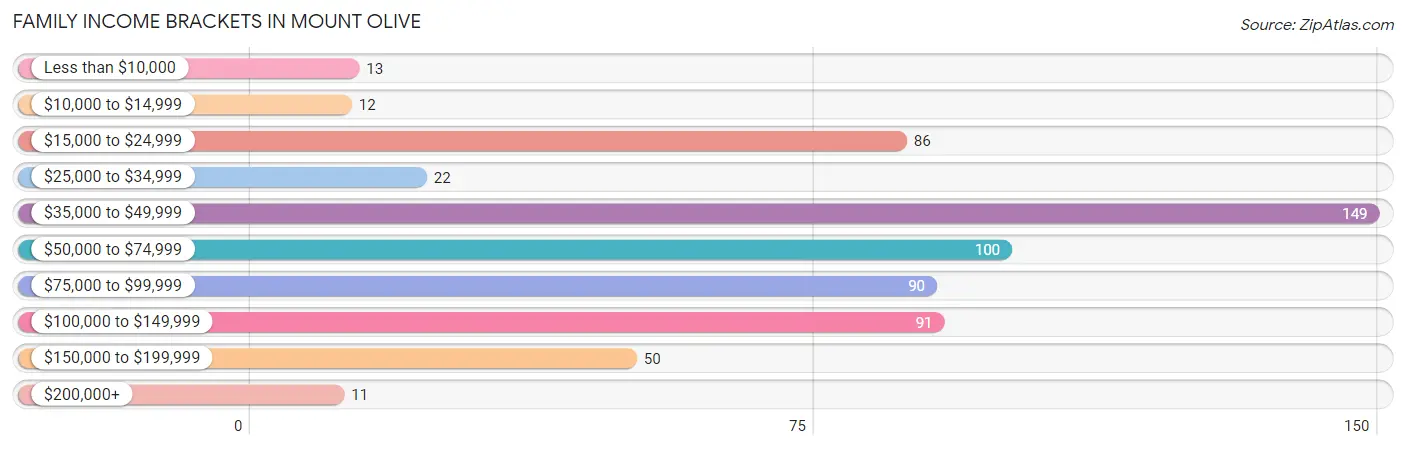
| Income Bracket | # Families | % Families |
| Less than $10,000 | 13 | 2.1% |
| $10,000 to $14,999 | 12 | 1.9% |
| $15,000 to $24,999 | 86 | 13.8% |
| $25,000 to $34,999 | 22 | 3.5% |
| $35,000 to $49,999 | 149 | 23.9% |
| $50,000 to $74,999 | 100 | 16.0% |
| $75,000 to $99,999 | 90 | 14.4% |
| $100,000 to $149,999 | 91 | 14.6% |
| $150,000 to $199,999 | 50 | 8.0% |
| $200,000+ | 11 | 1.8% |
Family Income by Famaliy Size in Mount Olive
5-person families (25 | 4.0%) account for the highest median family income in Mount Olive with $79,792 per family, while 2-person families (425 | 68.1%) have the highest median income of $27,725 per family member.
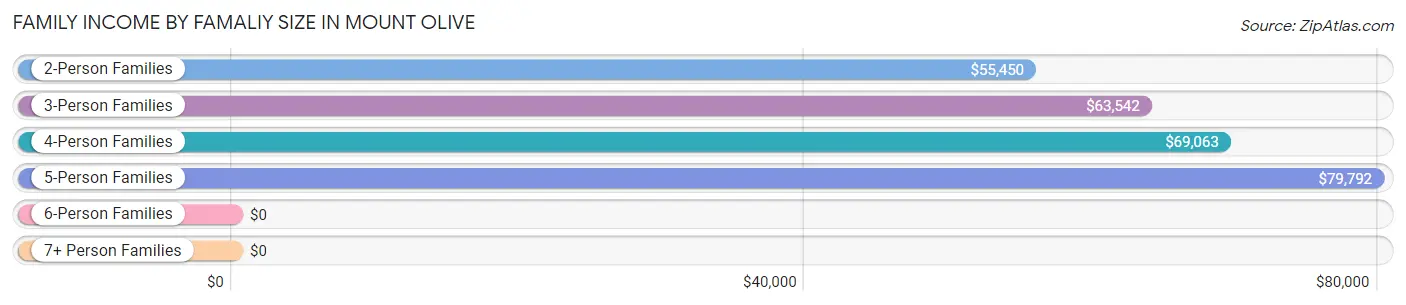
| Income Bracket | # Families | Median Income |
| 2-Person Families | 425 (68.1%) | $55,450 |
| 3-Person Families | 91 (14.6%) | $63,542 |
| 4-Person Families | 77 (12.3%) | $69,063 |
| 5-Person Families | 25 (4.0%) | $79,792 |
| 6-Person Families | 0 (0.0%) | $0 |
| 7+ Person Families | 6 (1.0%) | $0 |
| Total | 624 (100.0%) | $56,800 |
Family Income by Number of Earners in Mount Olive
The median family income in Mount Olive is $56,800, with families comprising 3+ earners (45) having the highest median family income of $125,750, while families with no earners (253) have the lowest median family income of $46,268, accounting for 7.2% and 40.5% of families, respectively.
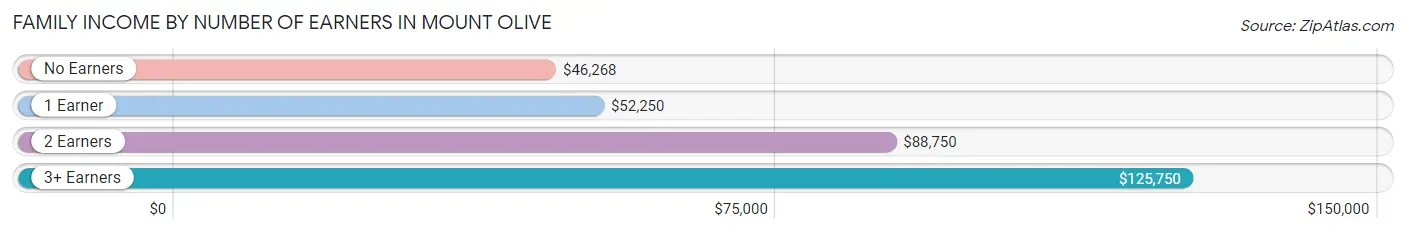
| Number of Earners | # Families | Median Income |
| No Earners | 253 (40.5%) | $46,268 |
| 1 Earner | 217 (34.8%) | $52,250 |
| 2 Earners | 109 (17.5%) | $88,750 |
| 3+ Earners | 45 (7.2%) | $125,750 |
| Total | 624 (100.0%) | $56,800 |
Household Income in Mount Olive
Household Income Brackets in Mount Olive
With 195 households falling in the category, the $35,000 to $49,999 income range is the most frequent in Mount Olive, accounting for 21.2% of all households. In contrast, only 25 households (2.7%) fall into the $200,000+ income bracket, making it the least populous group.
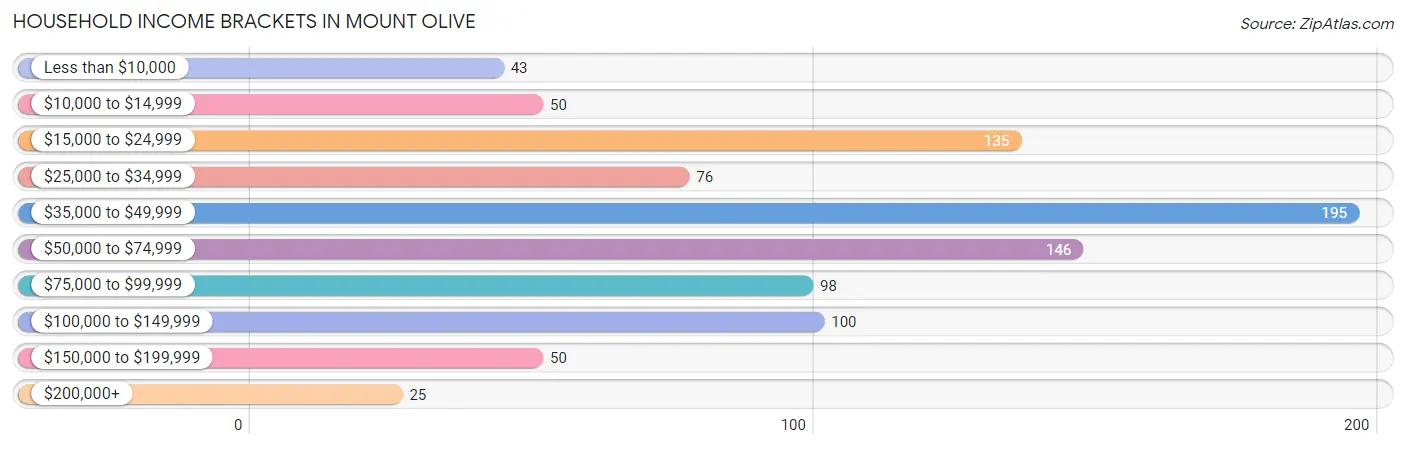
| Income Bracket | # Households | % Households |
| Less than $10,000 | 43 | 4.7% |
| $10,000 to $14,999 | 50 | 5.4% |
| $15,000 to $24,999 | 135 | 14.7% |
| $25,000 to $34,999 | 76 | 8.3% |
| $35,000 to $49,999 | 195 | 21.2% |
| $50,000 to $74,999 | 146 | 15.9% |
| $75,000 to $99,999 | 98 | 10.7% |
| $100,000 to $149,999 | 100 | 10.9% |
| $150,000 to $199,999 | 50 | 5.4% |
| $200,000+ | 25 | 2.7% |
Household Income by Householder Age in Mount Olive
The median household income in Mount Olive is $46,824, with the highest median household income of $60,682 found in the 45 to 64 years age bracket for the primary householder. A total of 370 households (40.3%) fall into this category. Meanwhile, the 25 to 44 years age bracket for the primary householder has the lowest median household income of $35,536, with 187 households (20.4%) in this group.

| Income Bracket | # Households | Median Income |
| 15 to 24 Years | 33 (3.6%) | $37,083 |
| 25 to 44 Years | 187 (20.4%) | $35,536 |
| 45 to 64 Years | 370 (40.3%) | $60,682 |
| 65+ Years | 328 (35.7%) | $47,357 |
| Total | 918 (100.0%) | $46,824 |
Poverty in Mount Olive
Income Below Poverty by Sex and Age in Mount Olive
With 11.8% poverty level for males and 16.6% for females among the residents of Mount Olive, 15 year old males and 12 to 14 year old females are the most vulnerable to poverty, with 6 males (100.0%) and 35 females (64.8%) in their respective age groups living below the poverty level.
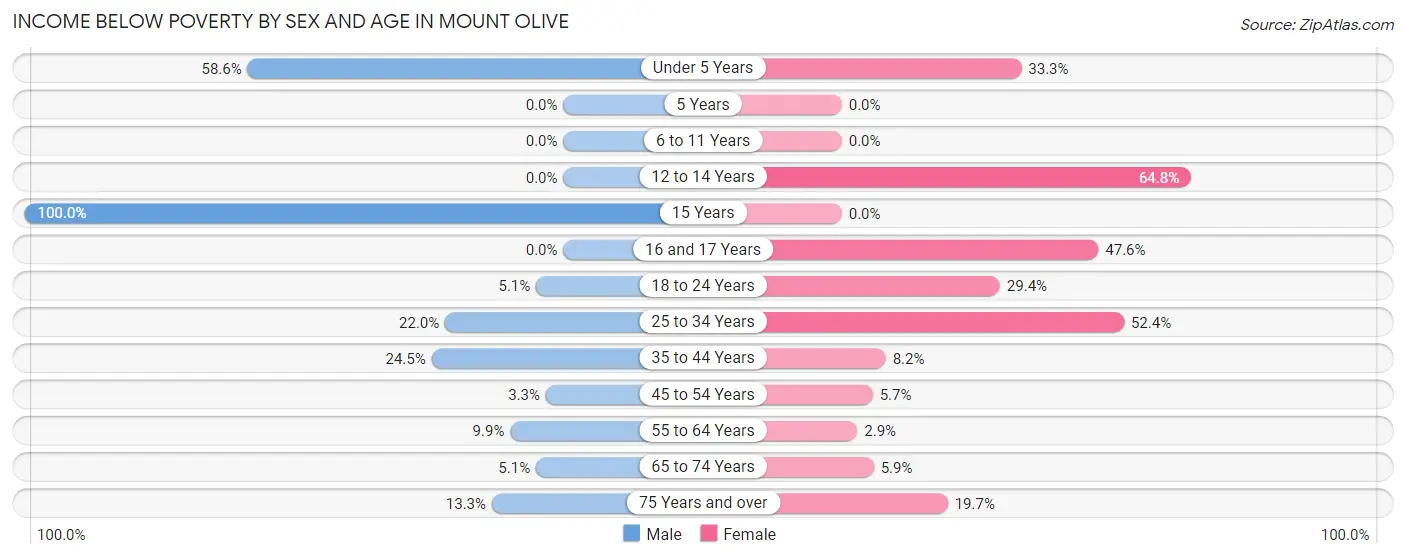
| Age Bracket | Male | Female |
| Under 5 Years | 34 (58.6%) | 14 (33.3%) |
| 5 Years | 0 (0.0%) | 0 (0.0%) |
| 6 to 11 Years | 0 (0.0%) | 0 (0.0%) |
| 12 to 14 Years | 0 (0.0%) | 35 (64.8%) |
| 15 Years | 6 (100.0%) | 0 (0.0%) |
| 16 and 17 Years | 0 (0.0%) | 10 (47.6%) |
| 18 to 24 Years | 4 (5.1%) | 27 (29.3%) |
| 25 to 34 Years | 18 (22.0%) | 33 (52.4%) |
| 35 to 44 Years | 23 (24.5%) | 15 (8.2%) |
| 45 to 54 Years | 5 (3.3%) | 7 (5.7%) |
| 55 to 64 Years | 14 (9.9%) | 5 (2.9%) |
| 65 to 74 Years | 9 (5.1%) | 10 (5.9%) |
| 75 Years and over | 13 (13.3%) | 23 (19.7%) |
| Total | 126 (11.8%) | 179 (16.6%) |
Income Above Poverty by Sex and Age in Mount Olive
According to the poverty statistics in Mount Olive, males aged 5 years and females aged 5 years are the age groups that are most secure financially, with 100.0% of males and 100.0% of females in these age groups living above the poverty line.
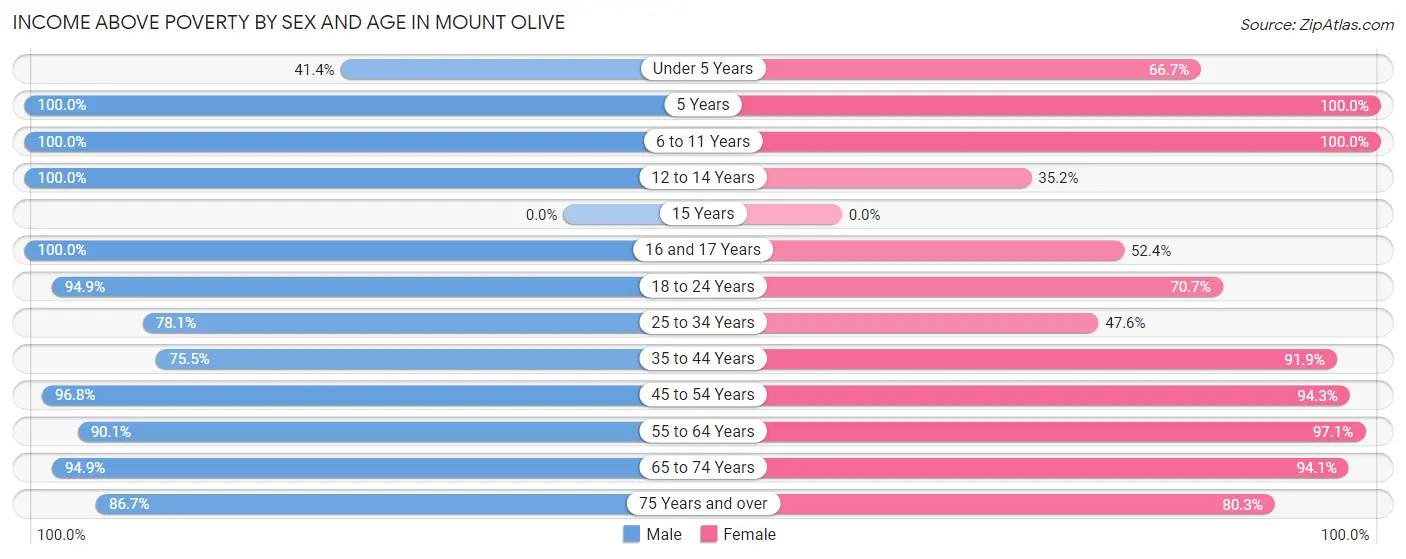
| Age Bracket | Male | Female |
| Under 5 Years | 24 (41.4%) | 28 (66.7%) |
| 5 Years | 18 (100.0%) | 6 (100.0%) |
| 6 to 11 Years | 72 (100.0%) | 33 (100.0%) |
| 12 to 14 Years | 77 (100.0%) | 19 (35.2%) |
| 15 Years | 0 (0.0%) | 0 (0.0%) |
| 16 and 17 Years | 11 (100.0%) | 11 (52.4%) |
| 18 to 24 Years | 75 (94.9%) | 65 (70.7%) |
| 25 to 34 Years | 64 (78.0%) | 30 (47.6%) |
| 35 to 44 Years | 71 (75.5%) | 169 (91.8%) |
| 45 to 54 Years | 149 (96.8%) | 115 (94.3%) |
| 55 to 64 Years | 128 (90.1%) | 168 (97.1%) |
| 65 to 74 Years | 168 (94.9%) | 159 (94.1%) |
| 75 Years and over | 85 (86.7%) | 94 (80.3%) |
| Total | 942 (88.2%) | 897 (83.4%) |
Income Below Poverty Among Married-Couple Families in Mount Olive
The poverty statistics for married-couple families in Mount Olive show that 4.0% or 17 of the total 430 families live below the poverty line. Families with 1 or 2 children have the highest poverty rate of 8.6%, comprising of 6 families. On the other hand, families with 3 or 4 children have the lowest poverty rate of 0.0%, which includes 0 families.
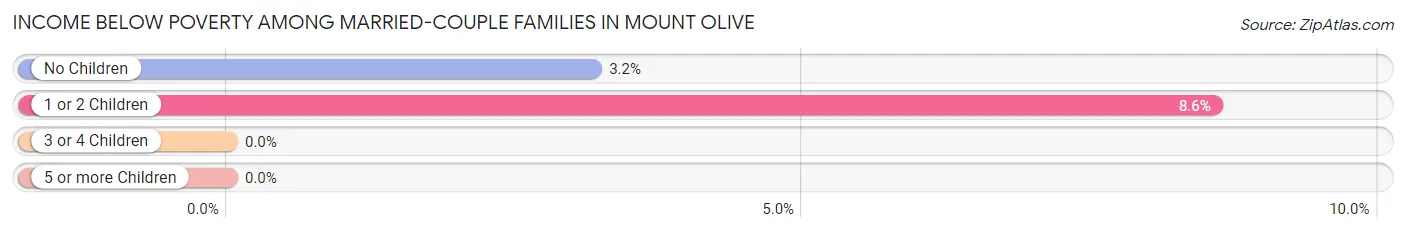
| Children | Above Poverty | Below Poverty |
| No Children | 336 (96.8%) | 11 (3.2%) |
| 1 or 2 Children | 64 (91.4%) | 6 (8.6%) |
| 3 or 4 Children | 7 (100.0%) | 0 (0.0%) |
| 5 or more Children | 6 (100.0%) | 0 (0.0%) |
| Total | 413 (96.1%) | 17 (4.0%) |
Income Below Poverty Among Single-Parent Households in Mount Olive
According to the poverty data in Mount Olive, 6.8% or 4 single-father households and 26.7% or 36 single-mother households are living below the poverty line. Among single-father households, those with no children have the highest poverty rate, with 4 households (11.1%) experiencing poverty. Likewise, among single-mother households, those with 3 or 4 children have the highest poverty rate, with 14 households (100.0%) falling below the poverty line.
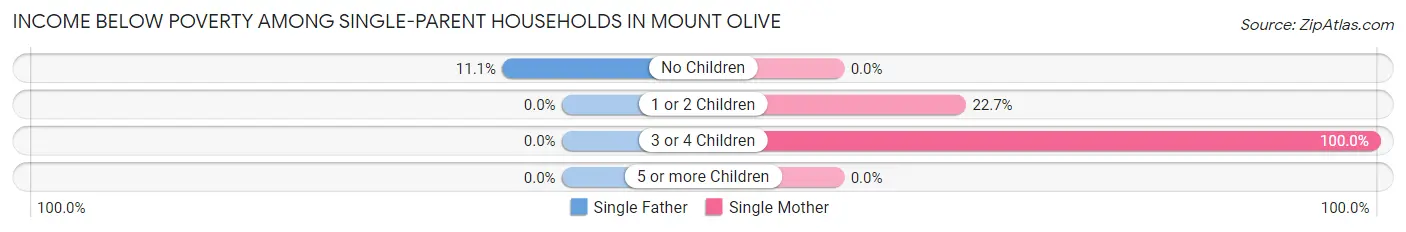
| Children | Single Father | Single Mother |
| No Children | 4 (11.1%) | 0 (0.0%) |
| 1 or 2 Children | 0 (0.0%) | 22 (22.7%) |
| 3 or 4 Children | 0 (0.0%) | 14 (100.0%) |
| 5 or more Children | 0 (0.0%) | 0 (0.0%) |
| Total | 4 (6.8%) | 36 (26.7%) |
Income Below Poverty Among Married-Couple vs Single-Parent Households in Mount Olive
The poverty data for Mount Olive shows that 17 of the married-couple family households (4.0%) and 40 of the single-parent households (20.6%) are living below the poverty level. Within the married-couple family households, those with 1 or 2 children have the highest poverty rate, with 6 households (8.6%) falling below the poverty line. Among the single-parent households, those with 3 or 4 children have the highest poverty rate, with 14 household (46.7%) living below poverty.
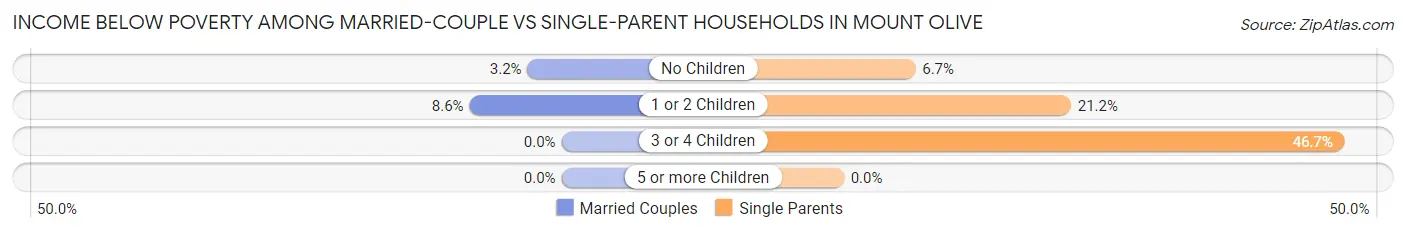
| Children | Married-Couple Families | Single-Parent Households |
| No Children | 11 (3.2%) | 4 (6.7%) |
| 1 or 2 Children | 6 (8.6%) | 22 (21.1%) |
| 3 or 4 Children | 0 (0.0%) | 14 (46.7%) |
| 5 or more Children | 0 (0.0%) | 0 (0.0%) |
| Total | 17 (4.0%) | 40 (20.6%) |
Employment Characteristics in Mount Olive
Employment by Class of Employer in Mount Olive
Among the 796 employed individuals in Mount Olive, private company employees (605 | 76.0%), not-for-profit organizations (47 | 5.9%), and state government employees (45 | 5.7%) make up the most common classes of employment.
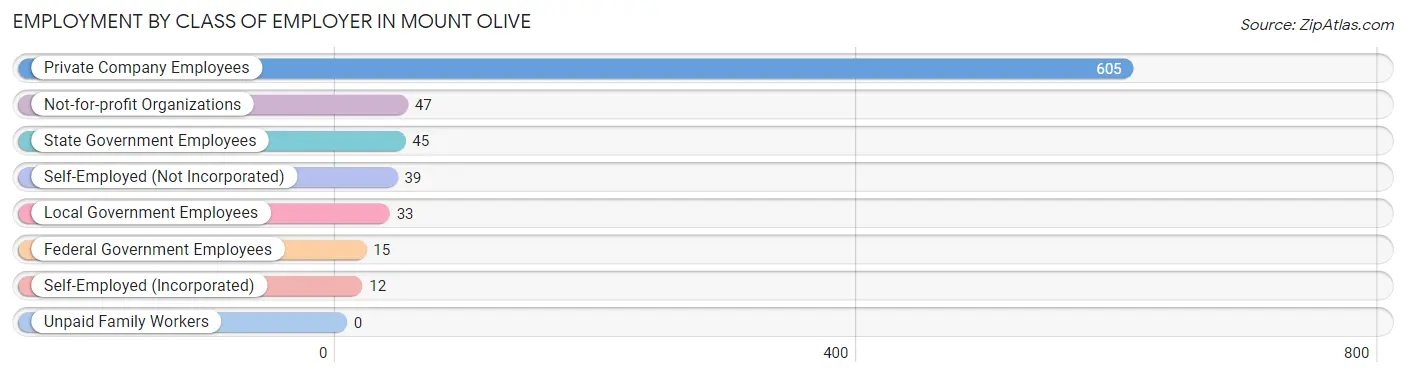
| Employer Class | # Employees | % Employees |
| Private Company Employees | 605 | 76.0% |
| Self-Employed (Incorporated) | 12 | 1.5% |
| Self-Employed (Not Incorporated) | 39 | 4.9% |
| Not-for-profit Organizations | 47 | 5.9% |
| Local Government Employees | 33 | 4.2% |
| State Government Employees | 45 | 5.7% |
| Federal Government Employees | 15 | 1.9% |
| Unpaid Family Workers | 0 | 0.0% |
| Total | 796 | 100.0% |
Employment Status by Age in Mount Olive
According to the labor force statistics for Mount Olive, out of the total population over 16 years of age (1,778), 49.7% or 884 individuals are in the labor force, with 8.1% or 72 of them unemployed. The age group with the highest labor force participation rate is 45 to 54 years, with 89.5% or 247 individuals in the labor force. Within the labor force, the 16 to 19 years age range has the highest percentage of unemployed individuals, with 26.8% or 15 of them being unemployed.
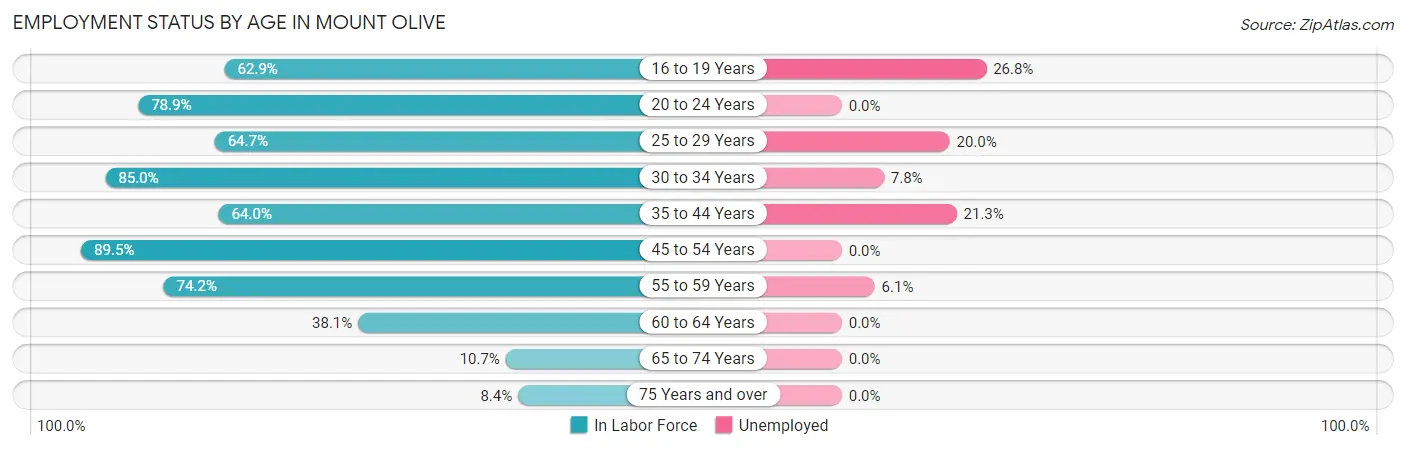
| Age Bracket | In Labor Force | Unemployed |
| 16 to 19 Years | 56 (62.9%) | 15 (26.8%) |
| 20 to 24 Years | 90 (78.9%) | 0 (0.0%) |
| 25 to 29 Years | 55 (64.7%) | 11 (20.0%) |
| 30 to 34 Years | 51 (85.0%) | 4 (7.8%) |
| 35 to 44 Years | 178 (64.0%) | 38 (21.3%) |
| 45 to 54 Years | 247 (89.5%) | 0 (0.0%) |
| 55 to 59 Years | 66 (74.2%) | 4 (6.1%) |
| 60 to 64 Years | 86 (38.1%) | 0 (0.0%) |
| 65 to 74 Years | 37 (10.7%) | 0 (0.0%) |
| 75 Years and over | 18 (8.4%) | 0 (0.0%) |
| Total | 884 (49.7%) | 72 (8.1%) |
Employment Status by Educational Attainment in Mount Olive
According to labor force statistics for Mount Olive, 67.4% of individuals (683) out of the total population between 25 and 64 years of age (1,014) are in the labor force, with 8.3% or 57 of them being unemployed. The group with the highest labor force participation rate are those with the educational attainment of bachelor's degree or higher, with 71.7% or 81 individuals in the labor force. Within the labor force, individuals with less than high school education have the highest percentage of unemployment, with 23.8% or 5 of them being unemployed.
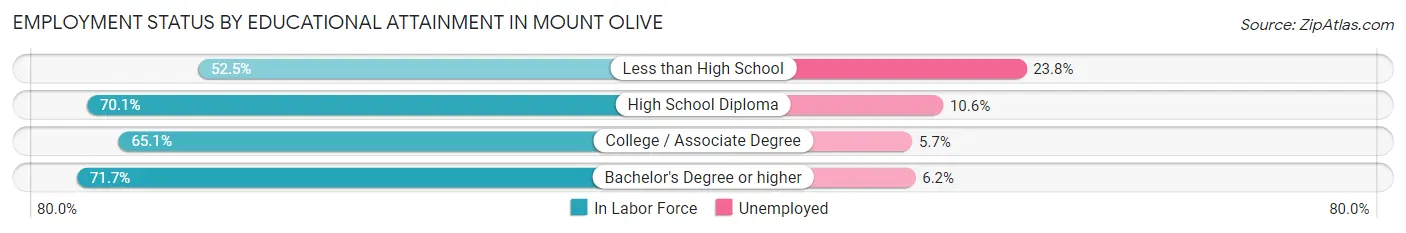
| Educational Attainment | In Labor Force | Unemployed |
| Less than High School | 21 (52.5%) | 10 (23.8%) |
| High School Diploma | 284 (70.1%) | 43 (10.6%) |
| College / Associate Degree | 297 (65.1%) | 26 (5.7%) |
| Bachelor's Degree or higher | 81 (71.7%) | 7 (6.2%) |
| Total | 683 (67.4%) | 84 (8.3%) |
Employment Occupations by Sex in Mount Olive
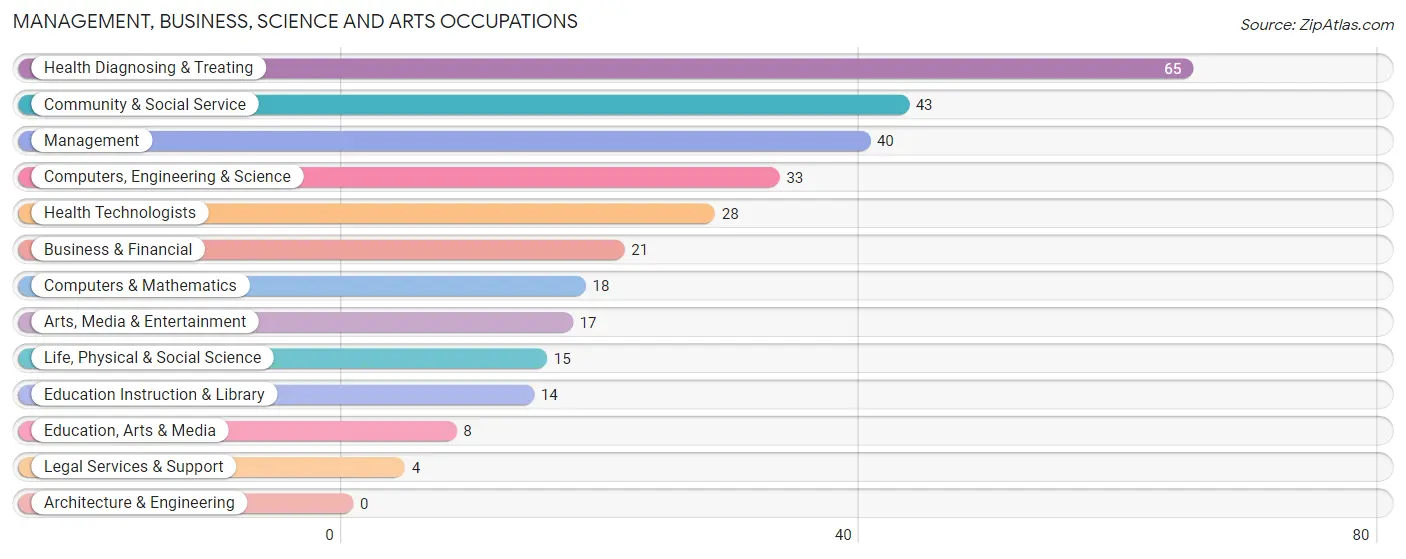
Management, Business, Science and Arts Occupations
The most common Management, Business, Science and Arts occupations in Mount Olive are Health Diagnosing & Treating (65 | 8.0%), Community & Social Service (43 | 5.3%), Management (40 | 4.9%), Computers, Engineering & Science (33 | 4.1%), and Health Technologists (28 | 3.5%).
Management, Business, Science and Arts Occupations by Sex
Within the Management, Business, Science and Arts occupations in Mount Olive, the most male-oriented occupations are Computers & Mathematics (100.0%), Computers, Engineering & Science (75.8%), and Arts, Media & Entertainment (64.7%), while the most female-oriented occupations are Education, Arts & Media (100.0%), Legal Services & Support (100.0%), and Management (85.0%).
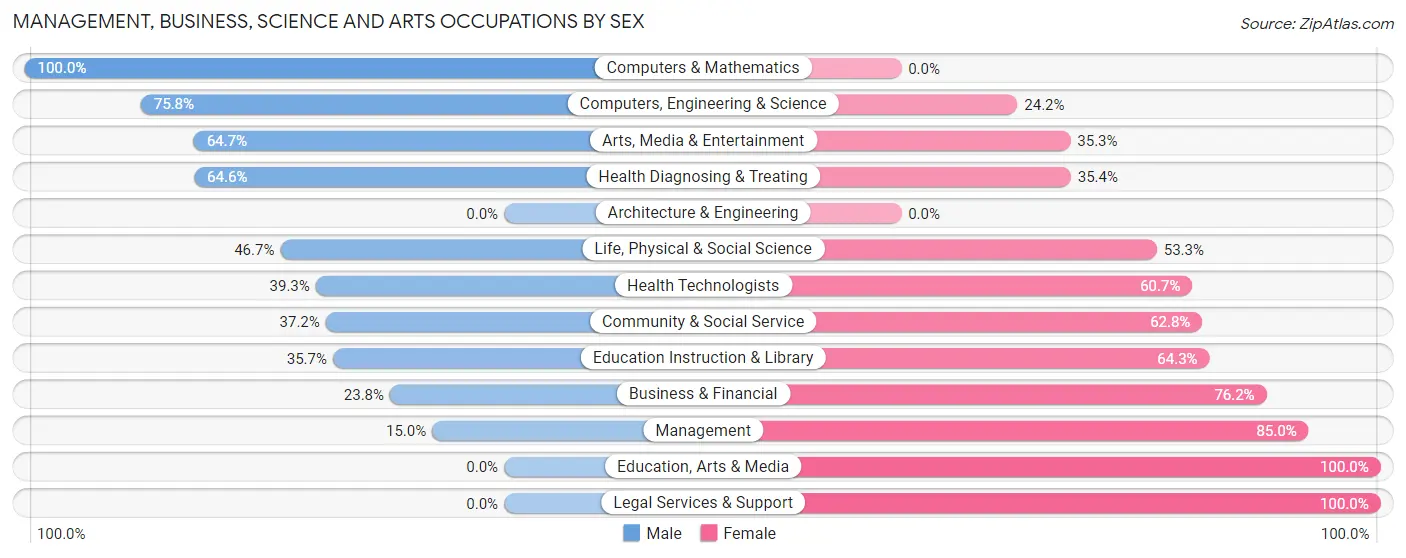
| Occupation | Male | Female |
| Management | 6 (15.0%) | 34 (85.0%) |
| Business & Financial | 5 (23.8%) | 16 (76.2%) |
| Computers, Engineering & Science | 25 (75.8%) | 8 (24.2%) |
| Computers & Mathematics | 18 (100.0%) | 0 (0.0%) |
| Architecture & Engineering | 0 (0.0%) | 0 (0.0%) |
| Life, Physical & Social Science | 7 (46.7%) | 8 (53.3%) |
| Community & Social Service | 16 (37.2%) | 27 (62.8%) |
| Education, Arts & Media | 0 (0.0%) | 8 (100.0%) |
| Legal Services & Support | 0 (0.0%) | 4 (100.0%) |
| Education Instruction & Library | 5 (35.7%) | 9 (64.3%) |
| Arts, Media & Entertainment | 11 (64.7%) | 6 (35.3%) |
| Health Diagnosing & Treating | 42 (64.6%) | 23 (35.4%) |
| Health Technologists | 11 (39.3%) | 17 (60.7%) |
| Total (Category) | 94 (46.5%) | 108 (53.5%) |
| Total (Overall) | 423 (52.1%) | 389 (47.9%) |
Services Occupations
The most common Services occupations in Mount Olive are Healthcare Support (52 | 6.4%), Cleaning & Maintenance (51 | 6.3%), Food Preparation & Serving (27 | 3.3%), Personal Care & Service (22 | 2.7%), and Security & Protection (4 | 0.5%).

Services Occupations by Sex
Within the Services occupations in Mount Olive, the most male-oriented occupations are Security & Protection (100.0%), Law Enforcement (100.0%), and Food Preparation & Serving (70.4%), while the most female-oriented occupations are Personal Care & Service (100.0%), Healthcare Support (82.7%), and Cleaning & Maintenance (41.2%).
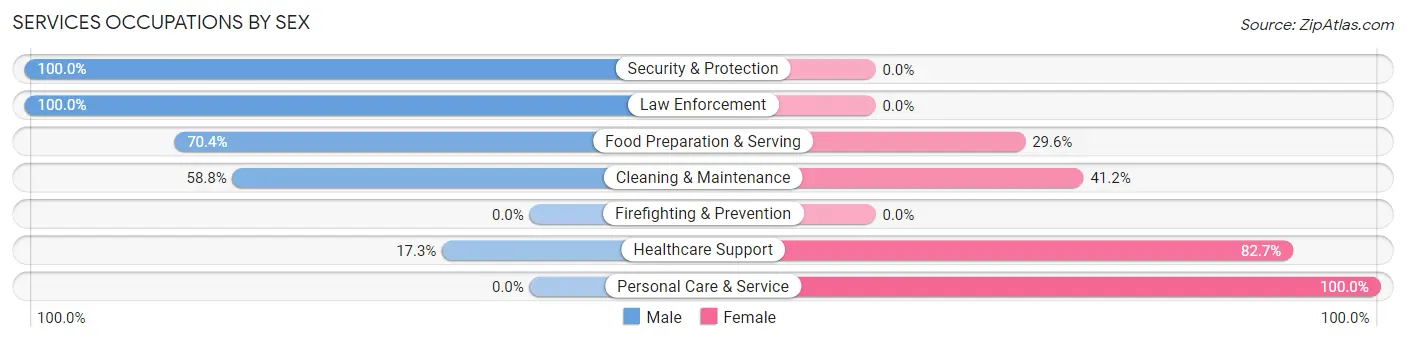
| Occupation | Male | Female |
| Healthcare Support | 9 (17.3%) | 43 (82.7%) |
| Security & Protection | 4 (100.0%) | 0 (0.0%) |
| Firefighting & Prevention | 0 (0.0%) | 0 (0.0%) |
| Law Enforcement | 4 (100.0%) | 0 (0.0%) |
| Food Preparation & Serving | 19 (70.4%) | 8 (29.6%) |
| Cleaning & Maintenance | 30 (58.8%) | 21 (41.2%) |
| Personal Care & Service | 0 (0.0%) | 22 (100.0%) |
| Total (Category) | 62 (39.7%) | 94 (60.3%) |
| Total (Overall) | 423 (52.1%) | 389 (47.9%) |
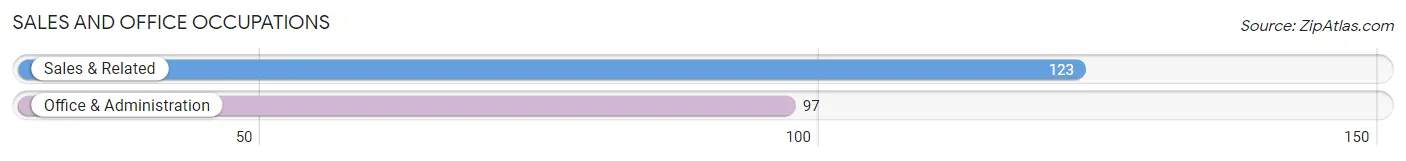
Sales and Office Occupations
The most common Sales and Office occupations in Mount Olive are Sales & Related (123 | 15.1%), and Office & Administration (97 | 11.9%).
Sales and Office Occupations by Sex
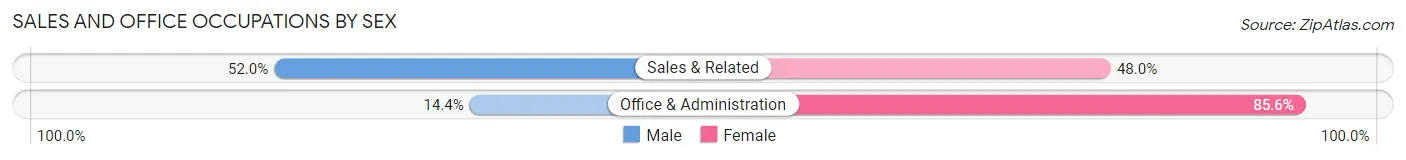
| Occupation | Male | Female |
| Sales & Related | 64 (52.0%) | 59 (48.0%) |
| Office & Administration | 14 (14.4%) | 83 (85.6%) |
| Total (Category) | 78 (35.4%) | 142 (64.5%) |
| Total (Overall) | 423 (52.1%) | 389 (47.9%) |
Natural Resources, Construction and Maintenance Occupations
The most common Natural Resources, Construction and Maintenance occupations in Mount Olive are Construction & Extraction (38 | 4.7%), and Installation, Maintenance & Repair (27 | 3.3%).
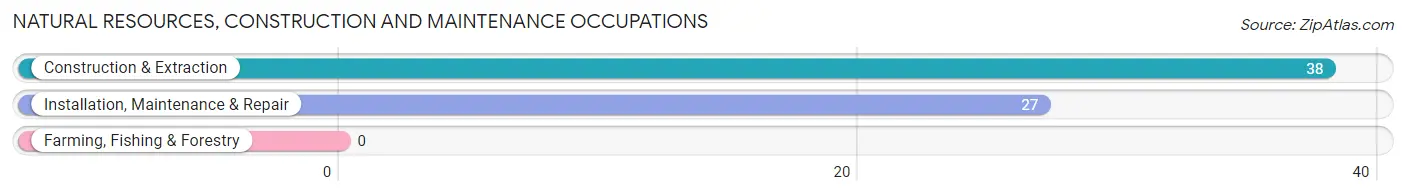
Natural Resources, Construction and Maintenance Occupations by Sex

| Occupation | Male | Female |
| Farming, Fishing & Forestry | 0 (0.0%) | 0 (0.0%) |
| Construction & Extraction | 38 (100.0%) | 0 (0.0%) |
| Installation, Maintenance & Repair | 27 (100.0%) | 0 (0.0%) |
| Total (Category) | 65 (100.0%) | 0 (0.0%) |
| Total (Overall) | 423 (52.1%) | 389 (47.9%) |
Production, Transportation and Moving Occupations
The most common Production, Transportation and Moving occupations in Mount Olive are Production (69 | 8.5%), Material Moving (62 | 7.6%), and Transportation (38 | 4.7%).
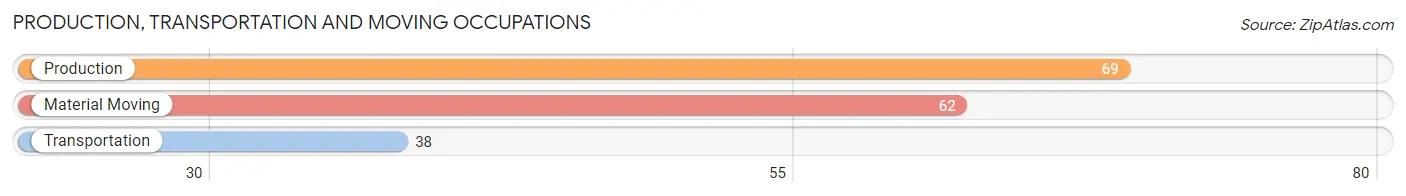
Production, Transportation and Moving Occupations by Sex
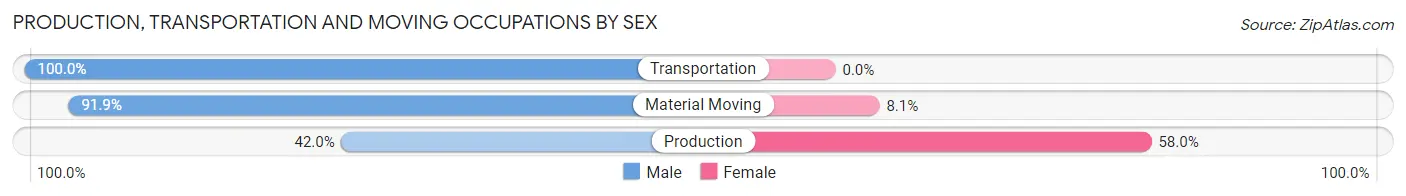
| Occupation | Male | Female |
| Production | 29 (42.0%) | 40 (58.0%) |
| Transportation | 38 (100.0%) | 0 (0.0%) |
| Material Moving | 57 (91.9%) | 5 (8.1%) |
| Total (Category) | 124 (73.4%) | 45 (26.6%) |
| Total (Overall) | 423 (52.1%) | 389 (47.9%) |
Employment Industries by Sex in Mount Olive
Employment Industries in Mount Olive
The major employment industries in Mount Olive include Health Care & Social Assistance (136 | 16.8%), Manufacturing (135 | 16.6%), Retail Trade (124 | 15.3%), Accommodation & Food Services (57 | 7.0%), and Educational Services (50 | 6.2%).
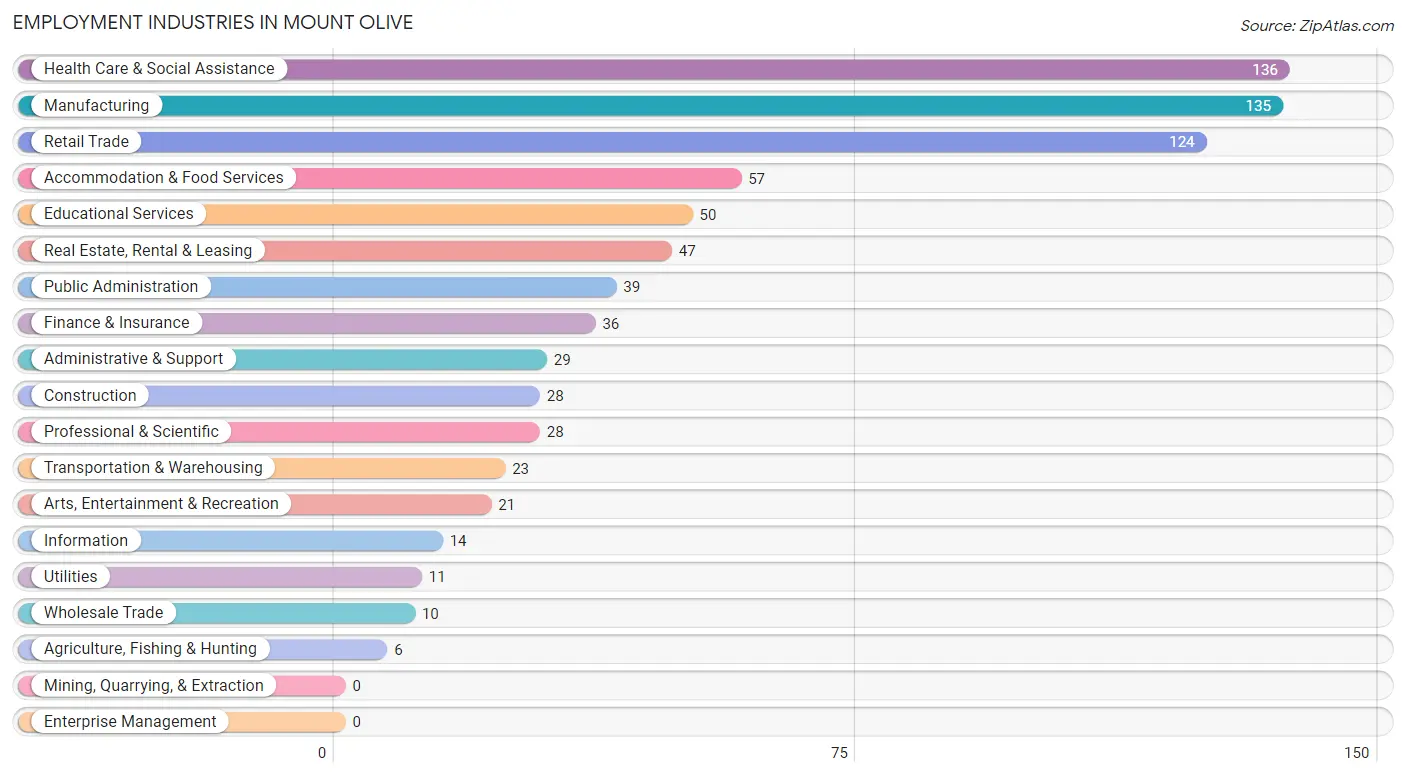
Employment Industries by Sex in Mount Olive
The Mount Olive industries that see more men than women are Agriculture, Fishing & Hunting (100.0%), Construction (100.0%), and Wholesale Trade (100.0%), whereas the industries that tend to have a higher number of women are Information (100.0%), Professional & Scientific (100.0%), and Educational Services (94.0%).
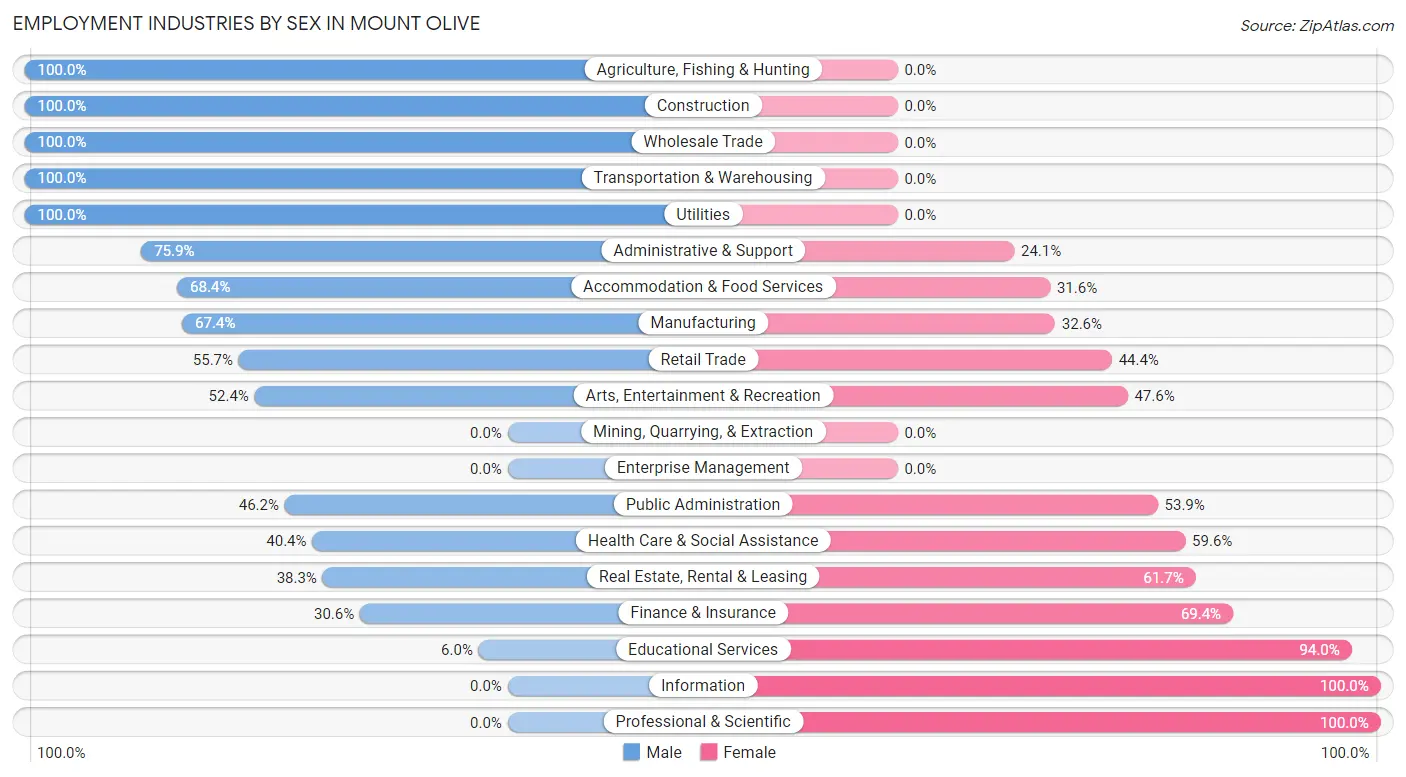
| Industry | Male | Female |
| Agriculture, Fishing & Hunting | 6 (100.0%) | 0 (0.0%) |
| Mining, Quarrying, & Extraction | 0 (0.0%) | 0 (0.0%) |
| Construction | 28 (100.0%) | 0 (0.0%) |
| Manufacturing | 91 (67.4%) | 44 (32.6%) |
| Wholesale Trade | 10 (100.0%) | 0 (0.0%) |
| Retail Trade | 69 (55.6%) | 55 (44.4%) |
| Transportation & Warehousing | 23 (100.0%) | 0 (0.0%) |
| Utilities | 11 (100.0%) | 0 (0.0%) |
| Information | 0 (0.0%) | 14 (100.0%) |
| Finance & Insurance | 11 (30.6%) | 25 (69.4%) |
| Real Estate, Rental & Leasing | 18 (38.3%) | 29 (61.7%) |
| Professional & Scientific | 0 (0.0%) | 28 (100.0%) |
| Enterprise Management | 0 (0.0%) | 0 (0.0%) |
| Administrative & Support | 22 (75.9%) | 7 (24.1%) |
| Educational Services | 3 (6.0%) | 47 (94.0%) |
| Health Care & Social Assistance | 55 (40.4%) | 81 (59.6%) |
| Arts, Entertainment & Recreation | 11 (52.4%) | 10 (47.6%) |
| Accommodation & Food Services | 39 (68.4%) | 18 (31.6%) |
| Public Administration | 18 (46.2%) | 21 (53.8%) |
| Total | 423 (52.1%) | 389 (47.9%) |
Education in Mount Olive
School Enrollment in Mount Olive
The most common levels of schooling among the 434 students in Mount Olive are high school (147 | 33.9%), elementary school (89 | 20.5%), and college / undergraduate (88 | 20.3%).
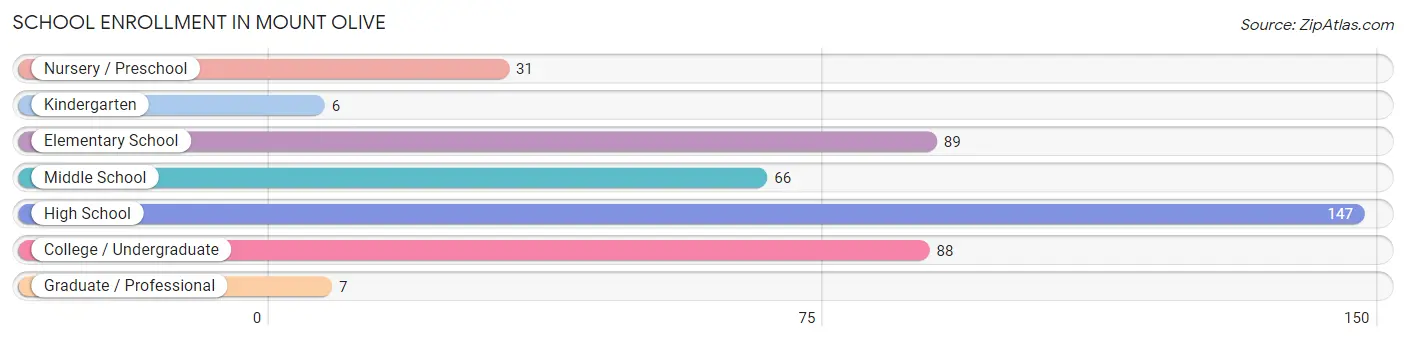
| School Level | # Students | % Students |
| Nursery / Preschool | 31 | 7.1% |
| Kindergarten | 6 | 1.4% |
| Elementary School | 89 | 20.5% |
| Middle School | 66 | 15.2% |
| High School | 147 | 33.9% |
| College / Undergraduate | 88 | 20.3% |
| Graduate / Professional | 7 | 1.6% |
| Total | 434 | 100.0% |
School Enrollment by Age by Funding Source in Mount Olive
Out of a total of 434 students who are enrolled in schools in Mount Olive, 65 (15.0%) attend a private institution, while the remaining 369 (85.0%) are enrolled in public schools. The age group of 10 to 14 year olds has the highest likelihood of being enrolled in private schools, with 58 (39.5% in the age bracket) enrolled. Conversely, the age group of 3 to 4 year olds has the lowest likelihood of being enrolled in a private school, with 13 (100.0% in the age bracket) attending a public institution.

| Age Bracket | Public School | Private School |
| 3 to 4 Year Olds | 13 (100.0%) | 0 (0.0%) |
| 5 to 9 Year Old | 106 (93.8%) | 7 (6.2%) |
| 10 to 14 Year Olds | 89 (60.5%) | 58 (39.5%) |
| 15 to 17 Year Olds | 38 (100.0%) | 0 (0.0%) |
| 18 to 19 Year Olds | 34 (100.0%) | 0 (0.0%) |
| 20 to 24 Year Olds | 43 (100.0%) | 0 (0.0%) |
| 25 to 34 Year Olds | 27 (100.0%) | 0 (0.0%) |
| 35 Years and over | 19 (100.0%) | 0 (0.0%) |
| Total | 369 (85.0%) | 65 (15.0%) |
Educational Attainment by Field of Study in Mount Olive
Education (61 | 29.5%), business (55 | 26.6%), science & technology (30 | 14.5%), bio, nature & agricultural (22 | 10.6%), and computers & mathematics (9 | 4.3%) are the most common fields of study among 207 individuals in Mount Olive who have obtained a bachelor's degree or higher.
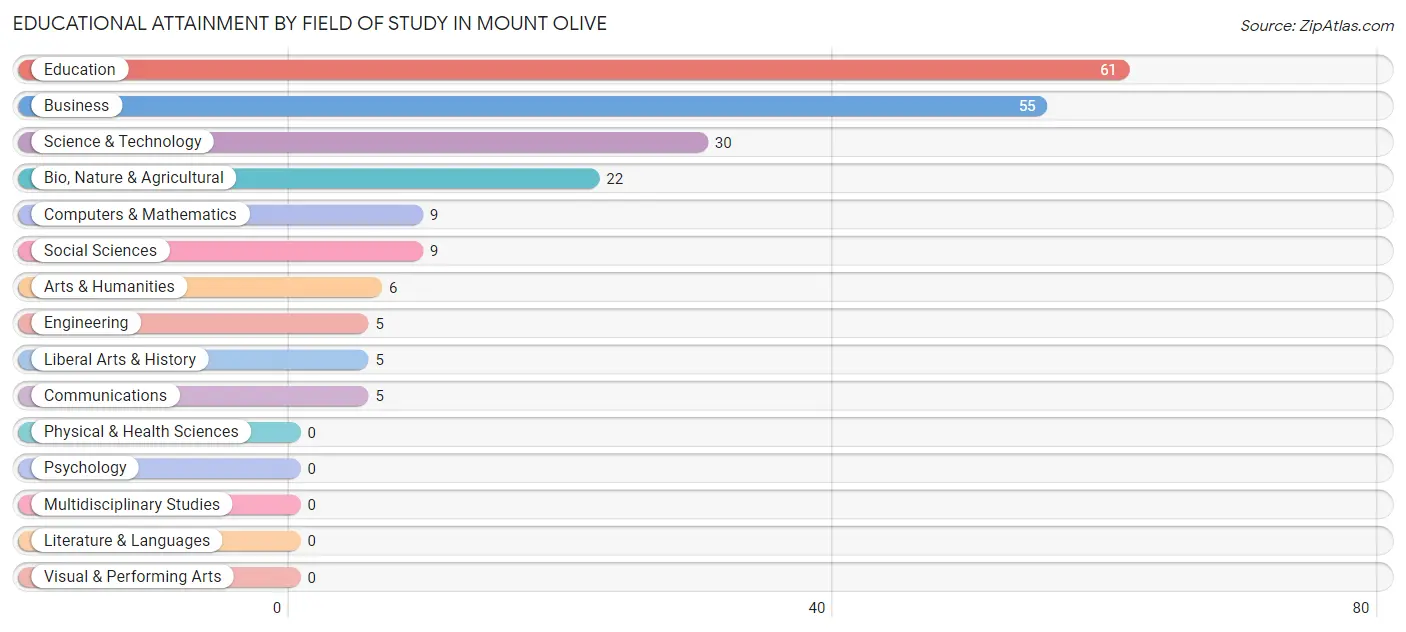
| Field of Study | # Graduates | % Graduates |
| Computers & Mathematics | 9 | 4.3% |
| Bio, Nature & Agricultural | 22 | 10.6% |
| Physical & Health Sciences | 0 | 0.0% |
| Psychology | 0 | 0.0% |
| Social Sciences | 9 | 4.3% |
| Engineering | 5 | 2.4% |
| Multidisciplinary Studies | 0 | 0.0% |
| Science & Technology | 30 | 14.5% |
| Business | 55 | 26.6% |
| Education | 61 | 29.5% |
| Literature & Languages | 0 | 0.0% |
| Liberal Arts & History | 5 | 2.4% |
| Visual & Performing Arts | 0 | 0.0% |
| Communications | 5 | 2.4% |
| Arts & Humanities | 6 | 2.9% |
| Total | 207 | 100.0% |
Transportation & Commute in Mount Olive
Vehicle Availability by Sex in Mount Olive
The most prevalent vehicle ownership categories in Mount Olive are males with 3 vehicles (154, accounting for 36.4%) and females with 3 vehicles (93, making up 41.3%).
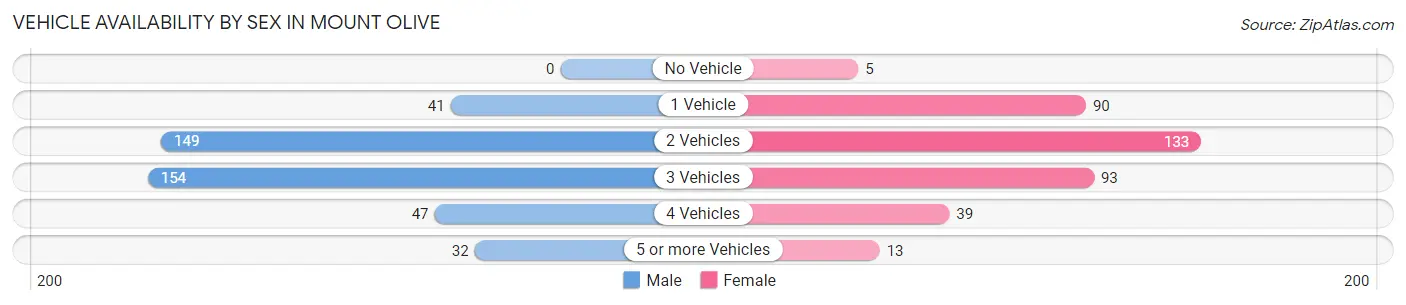
| Vehicles Available | Male | Female |
| No Vehicle | 0 (0.0%) | 5 (1.3%) |
| 1 Vehicle | 41 (9.7%) | 90 (24.1%) |
| 2 Vehicles | 149 (35.2%) | 133 (35.7%) |
| 3 Vehicles | 154 (36.4%) | 93 (24.9%) |
| 4 Vehicles | 47 (11.1%) | 39 (10.5%) |
| 5 or more Vehicles | 32 (7.6%) | 13 (3.5%) |
| Total | 423 (100.0%) | 373 (100.0%) |
Commute Time in Mount Olive
The most frequently occuring commute durations in Mount Olive are 15 to 19 minutes (190 commuters, 24.1%), 10 to 14 minutes (104 commuters, 13.2%), and 45 to 59 minutes (104 commuters, 13.2%).
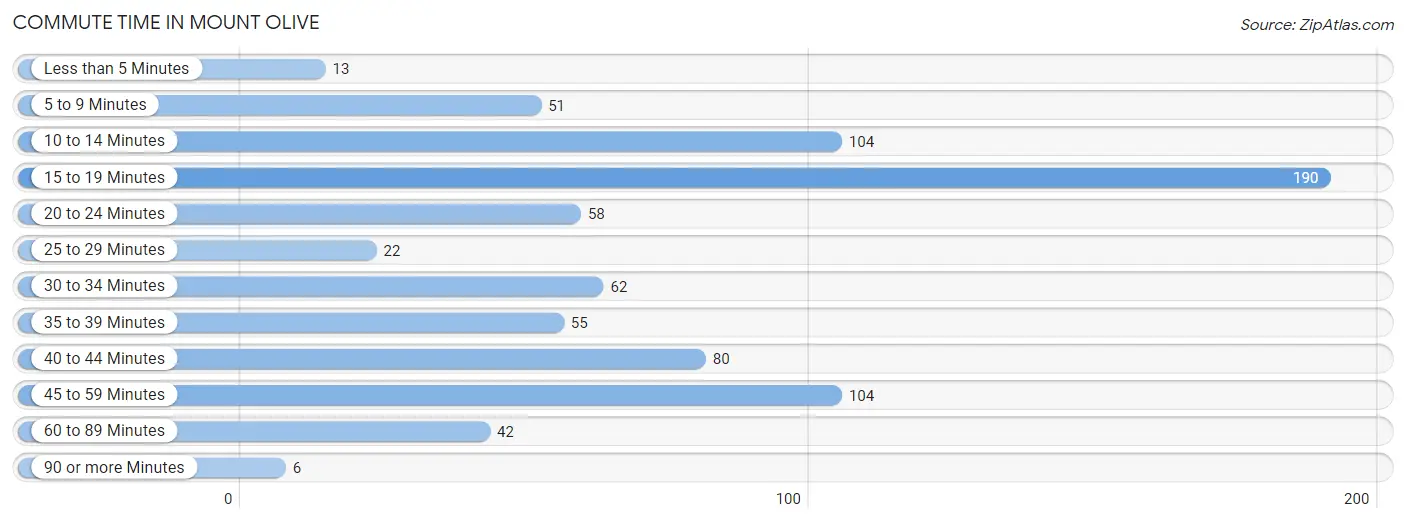
| Commute Time | # Commuters | % Commuters |
| Less than 5 Minutes | 13 | 1.7% |
| 5 to 9 Minutes | 51 | 6.5% |
| 10 to 14 Minutes | 104 | 13.2% |
| 15 to 19 Minutes | 190 | 24.1% |
| 20 to 24 Minutes | 58 | 7.4% |
| 25 to 29 Minutes | 22 | 2.8% |
| 30 to 34 Minutes | 62 | 7.9% |
| 35 to 39 Minutes | 55 | 7.0% |
| 40 to 44 Minutes | 80 | 10.2% |
| 45 to 59 Minutes | 104 | 13.2% |
| 60 to 89 Minutes | 42 | 5.3% |
| 90 or more Minutes | 6 | 0.8% |
Commute Time by Sex in Mount Olive
The most common commute times in Mount Olive are 45 to 59 minutes (84 commuters, 19.9%) for males and 15 to 19 minutes (115 commuters, 31.6%) for females.
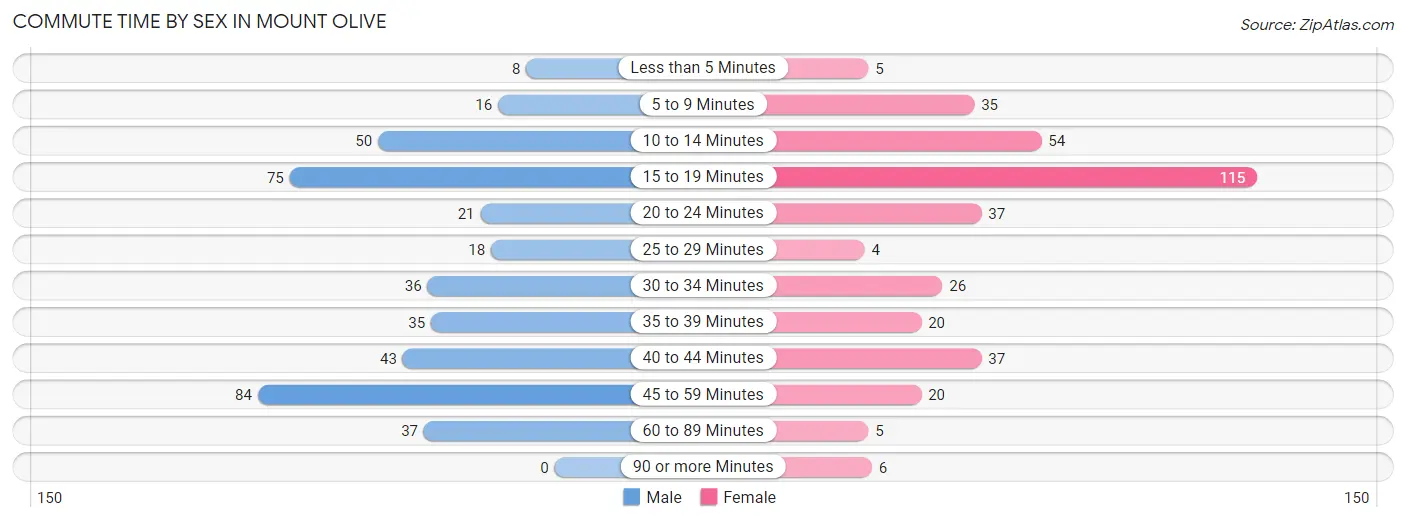
| Commute Time | Male | Female |
| Less than 5 Minutes | 8 (1.9%) | 5 (1.4%) |
| 5 to 9 Minutes | 16 (3.8%) | 35 (9.6%) |
| 10 to 14 Minutes | 50 (11.8%) | 54 (14.8%) |
| 15 to 19 Minutes | 75 (17.7%) | 115 (31.6%) |
| 20 to 24 Minutes | 21 (5.0%) | 37 (10.2%) |
| 25 to 29 Minutes | 18 (4.3%) | 4 (1.1%) |
| 30 to 34 Minutes | 36 (8.5%) | 26 (7.1%) |
| 35 to 39 Minutes | 35 (8.3%) | 20 (5.5%) |
| 40 to 44 Minutes | 43 (10.2%) | 37 (10.2%) |
| 45 to 59 Minutes | 84 (19.9%) | 20 (5.5%) |
| 60 to 89 Minutes | 37 (8.7%) | 5 (1.4%) |
| 90 or more Minutes | 0 (0.0%) | 6 (1.7%) |
Time of Departure to Work by Sex in Mount Olive
The most frequent times of departure to work in Mount Olive are 12:00 PM to 3:59 PM (88, 20.8%) for males and 6:30 AM to 6:59 AM (75, 20.6%) for females.
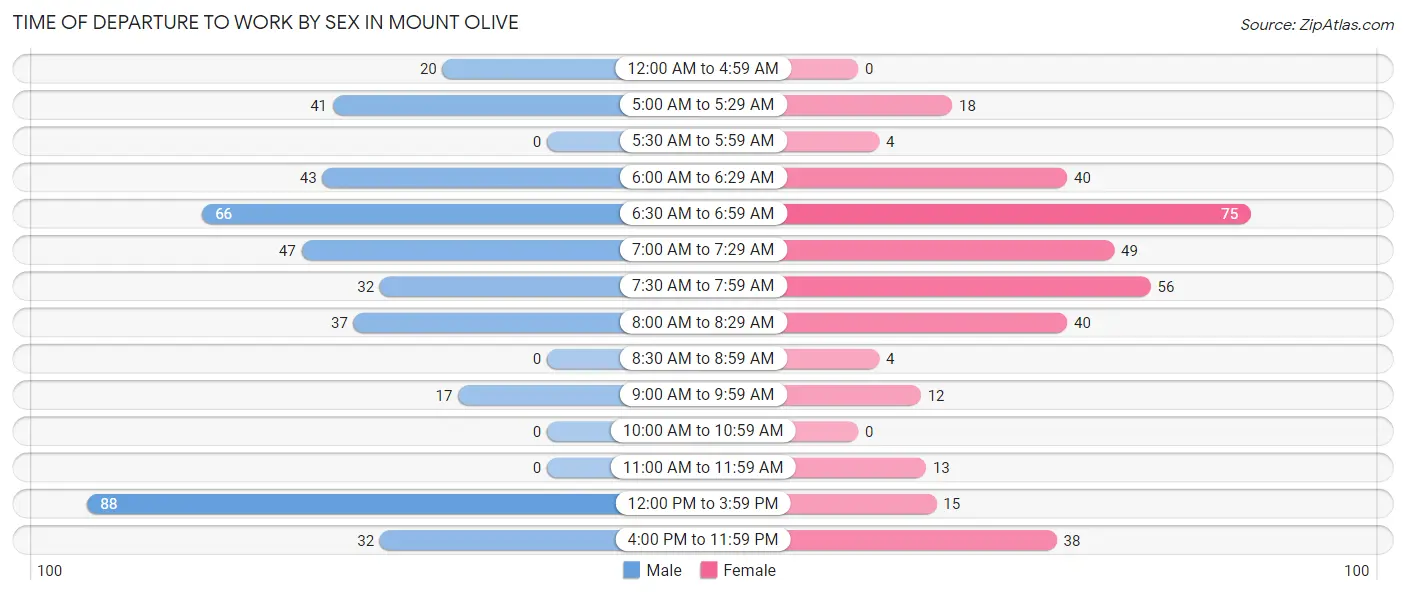
| Time of Departure | Male | Female |
| 12:00 AM to 4:59 AM | 20 (4.7%) | 0 (0.0%) |
| 5:00 AM to 5:29 AM | 41 (9.7%) | 18 (5.0%) |
| 5:30 AM to 5:59 AM | 0 (0.0%) | 4 (1.1%) |
| 6:00 AM to 6:29 AM | 43 (10.2%) | 40 (11.0%) |
| 6:30 AM to 6:59 AM | 66 (15.6%) | 75 (20.6%) |
| 7:00 AM to 7:29 AM | 47 (11.1%) | 49 (13.5%) |
| 7:30 AM to 7:59 AM | 32 (7.6%) | 56 (15.4%) |
| 8:00 AM to 8:29 AM | 37 (8.7%) | 40 (11.0%) |
| 8:30 AM to 8:59 AM | 0 (0.0%) | 4 (1.1%) |
| 9:00 AM to 9:59 AM | 17 (4.0%) | 12 (3.3%) |
| 10:00 AM to 10:59 AM | 0 (0.0%) | 0 (0.0%) |
| 11:00 AM to 11:59 AM | 0 (0.0%) | 13 (3.6%) |
| 12:00 PM to 3:59 PM | 88 (20.8%) | 15 (4.1%) |
| 4:00 PM to 11:59 PM | 32 (7.6%) | 38 (10.4%) |
| Total | 423 (100.0%) | 364 (100.0%) |
Housing Occupancy in Mount Olive
Occupancy by Ownership in Mount Olive
Of the total 918 dwellings in Mount Olive, owner-occupied units account for 667 (72.7%), while renter-occupied units make up 251 (27.3%).

| Occupancy | # Housing Units | % Housing Units |
| Owner Occupied Housing Units | 667 | 72.7% |
| Renter-Occupied Housing Units | 251 | 27.3% |
| Total Occupied Housing Units | 918 | 100.0% |
Occupancy by Household Size in Mount Olive
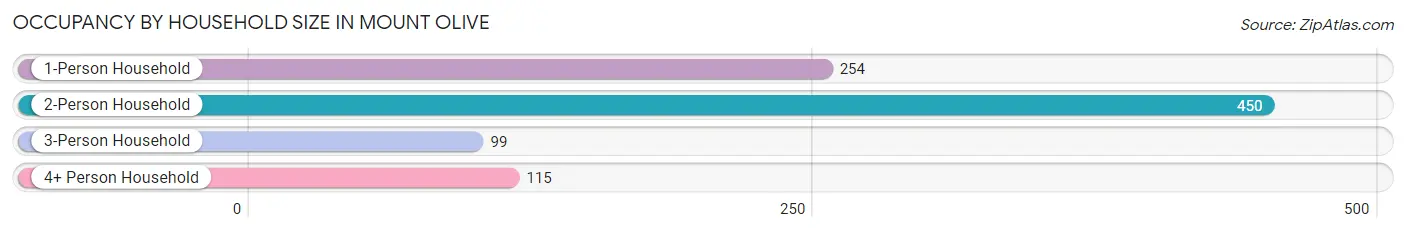
| Household Size | # Housing Units | % Housing Units |
| 1-Person Household | 254 | 27.7% |
| 2-Person Household | 450 | 49.0% |
| 3-Person Household | 99 | 10.8% |
| 4+ Person Household | 115 | 12.5% |
| Total Housing Units | 918 | 100.0% |
Occupancy by Ownership by Household Size in Mount Olive
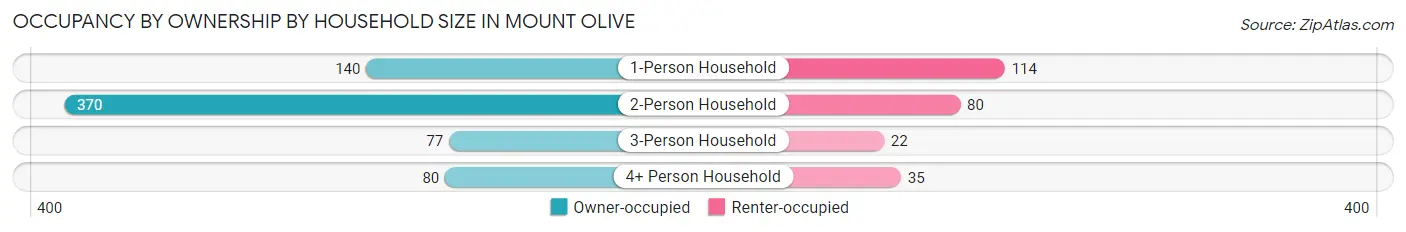
| Household Size | Owner-occupied | Renter-occupied |
| 1-Person Household | 140 (55.1%) | 114 (44.9%) |
| 2-Person Household | 370 (82.2%) | 80 (17.8%) |
| 3-Person Household | 77 (77.8%) | 22 (22.2%) |
| 4+ Person Household | 80 (69.6%) | 35 (30.4%) |
| Total Housing Units | 667 (72.7%) | 251 (27.3%) |
Occupancy by Educational Attainment in Mount Olive
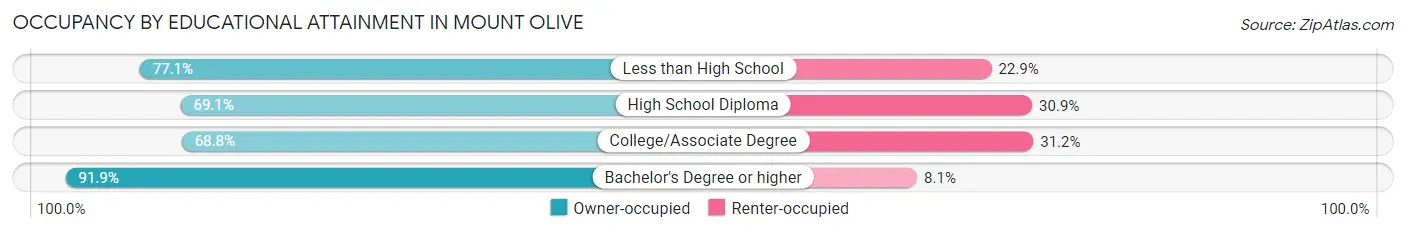
| Household Size | Owner-occupied | Renter-occupied |
| Less than High School | 54 (77.1%) | 16 (22.9%) |
| High School Diploma | 268 (69.1%) | 120 (30.9%) |
| College/Associate Degree | 232 (68.8%) | 105 (31.2%) |
| Bachelor's Degree or higher | 113 (91.9%) | 10 (8.1%) |
Occupancy by Age of Householder in Mount Olive

| Age Bracket | # Households | % Households |
| Under 35 Years | 98 | 10.7% |
| 35 to 44 Years | 122 | 13.3% |
| 45 to 54 Years | 194 | 21.1% |
| 55 to 64 Years | 176 | 19.2% |
| 65 to 74 Years | 193 | 21.0% |
| 75 to 84 Years | 76 | 8.3% |
| 85 Years and Over | 59 | 6.4% |
| Total | 918 | 100.0% |
Housing Finances in Mount Olive
Median Income by Occupancy in Mount Olive
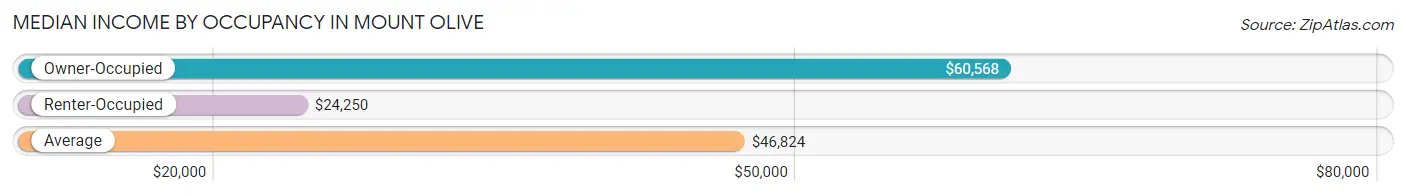
| Occupancy Type | # Households | Median Income |
| Owner-Occupied | 667 (72.7%) | $60,568 |
| Renter-Occupied | 251 (27.3%) | $24,250 |
| Average | 918 (100.0%) | $46,824 |
Occupancy by Householder Income Bracket in Mount Olive
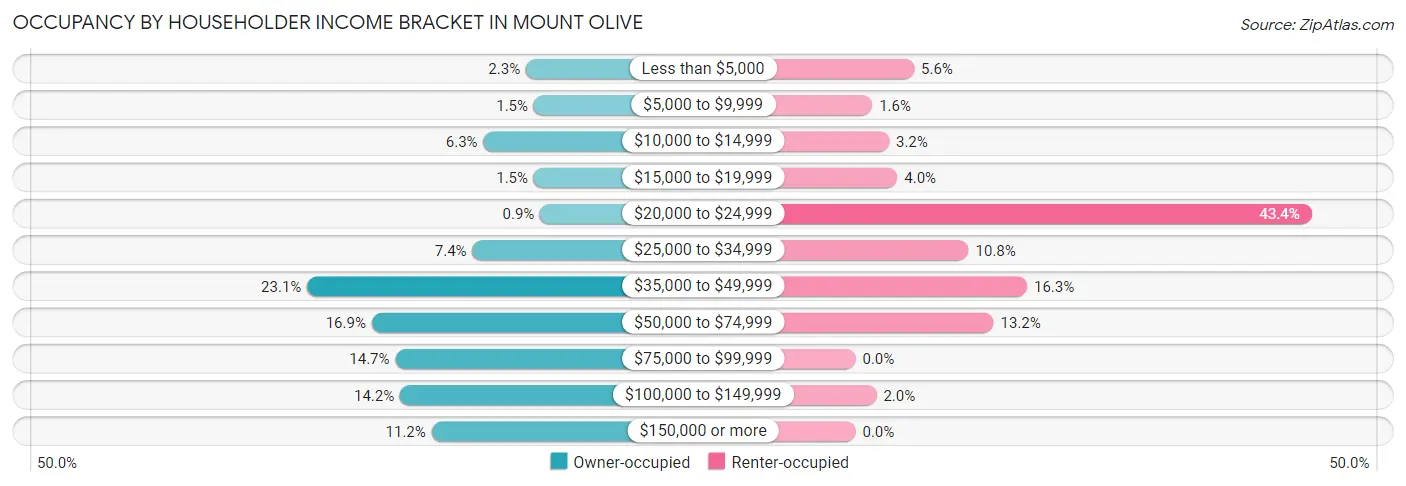
| Income Bracket | Owner-occupied | Renter-occupied |
| Less than $5,000 | 15 (2.2%) | 14 (5.6%) |
| $5,000 to $9,999 | 10 (1.5%) | 4 (1.6%) |
| $10,000 to $14,999 | 42 (6.3%) | 8 (3.2%) |
| $15,000 to $19,999 | 10 (1.5%) | 10 (4.0%) |
| $20,000 to $24,999 | 6 (0.9%) | 109 (43.4%) |
| $25,000 to $34,999 | 49 (7.3%) | 27 (10.8%) |
| $35,000 to $49,999 | 154 (23.1%) | 41 (16.3%) |
| $50,000 to $74,999 | 113 (16.9%) | 33 (13.2%) |
| $75,000 to $99,999 | 98 (14.7%) | 0 (0.0%) |
| $100,000 to $149,999 | 95 (14.2%) | 5 (2.0%) |
| $150,000 or more | 75 (11.2%) | 0 (0.0%) |
| Total | 667 (100.0%) | 251 (100.0%) |
Monthly Housing Cost Tiers in Mount Olive
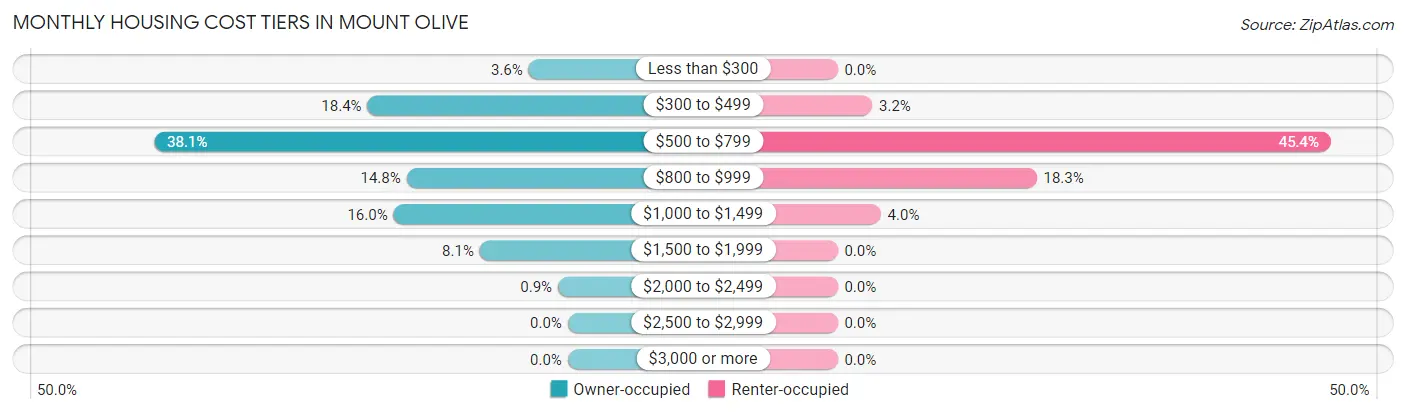
| Monthly Cost | Owner-occupied | Renter-occupied |
| Less than $300 | 24 (3.6%) | 0 (0.0%) |
| $300 to $499 | 123 (18.4%) | 8 (3.2%) |
| $500 to $799 | 254 (38.1%) | 114 (45.4%) |
| $800 to $999 | 99 (14.8%) | 46 (18.3%) |
| $1,000 to $1,499 | 107 (16.0%) | 10 (4.0%) |
| $1,500 to $1,999 | 54 (8.1%) | 0 (0.0%) |
| $2,000 to $2,499 | 6 (0.9%) | 0 (0.0%) |
| $2,500 to $2,999 | 0 (0.0%) | 0 (0.0%) |
| $3,000 or more | 0 (0.0%) | 0 (0.0%) |
| Total | 667 (100.0%) | 251 (100.0%) |
Physical Housing Characteristics in Mount Olive
Housing Structures in Mount Olive
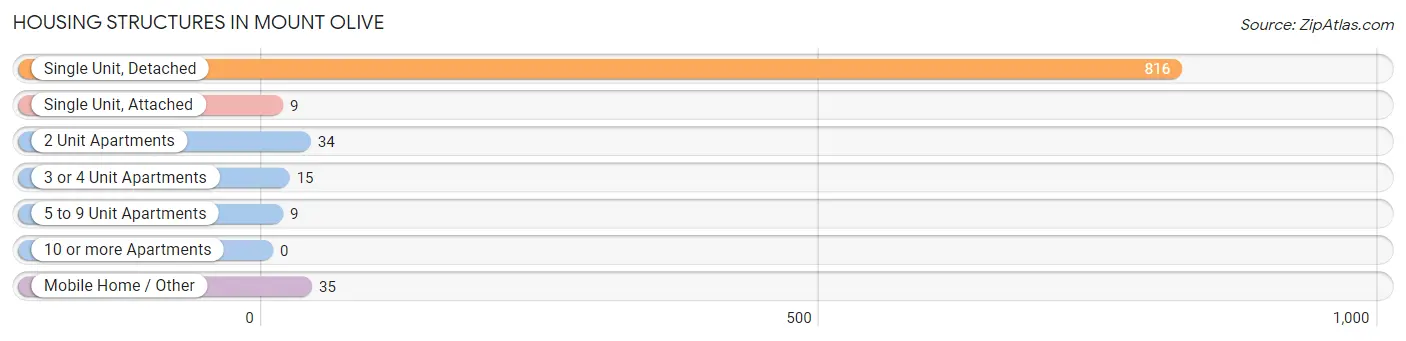
| Structure Type | # Housing Units | % Housing Units |
| Single Unit, Detached | 816 | 88.9% |
| Single Unit, Attached | 9 | 1.0% |
| 2 Unit Apartments | 34 | 3.7% |
| 3 or 4 Unit Apartments | 15 | 1.6% |
| 5 to 9 Unit Apartments | 9 | 1.0% |
| 10 or more Apartments | 0 | 0.0% |
| Mobile Home / Other | 35 | 3.8% |
| Total | 918 | 100.0% |
Housing Structures by Occupancy in Mount Olive
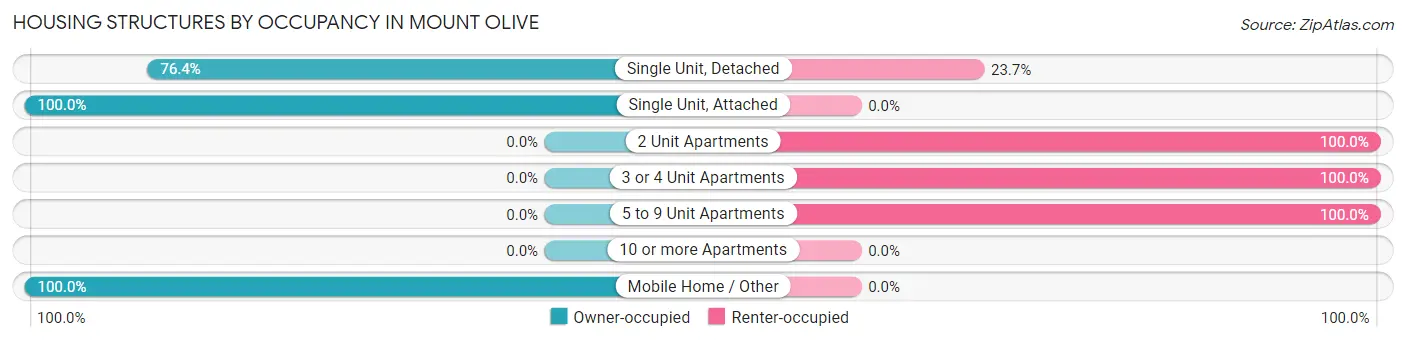
| Structure Type | Owner-occupied | Renter-occupied |
| Single Unit, Detached | 623 (76.3%) | 193 (23.6%) |
| Single Unit, Attached | 9 (100.0%) | 0 (0.0%) |
| 2 Unit Apartments | 0 (0.0%) | 34 (100.0%) |
| 3 or 4 Unit Apartments | 0 (0.0%) | 15 (100.0%) |
| 5 to 9 Unit Apartments | 0 (0.0%) | 9 (100.0%) |
| 10 or more Apartments | 0 (0.0%) | 0 (0.0%) |
| Mobile Home / Other | 35 (100.0%) | 0 (0.0%) |
| Total | 667 (72.7%) | 251 (27.3%) |
Housing Structures by Number of Rooms in Mount Olive
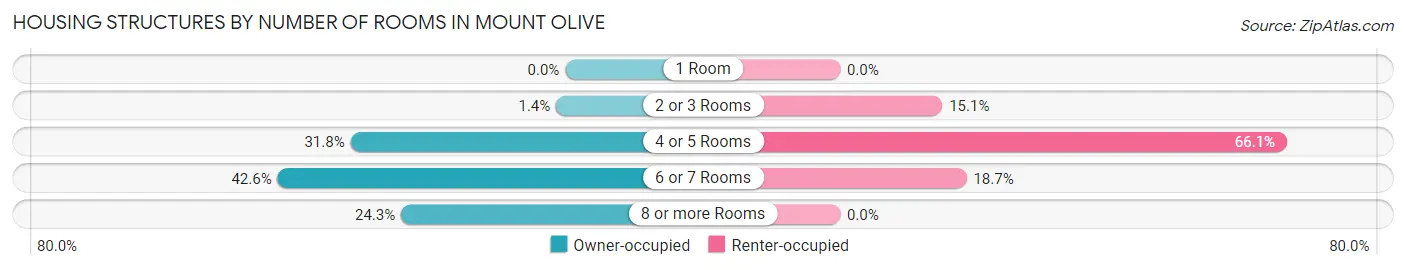
| Number of Rooms | Owner-occupied | Renter-occupied |
| 1 Room | 0 (0.0%) | 0 (0.0%) |
| 2 or 3 Rooms | 9 (1.3%) | 38 (15.1%) |
| 4 or 5 Rooms | 212 (31.8%) | 166 (66.1%) |
| 6 or 7 Rooms | 284 (42.6%) | 47 (18.7%) |
| 8 or more Rooms | 162 (24.3%) | 0 (0.0%) |
| Total | 667 (100.0%) | 251 (100.0%) |
Housing Structure by Heating Type in Mount Olive
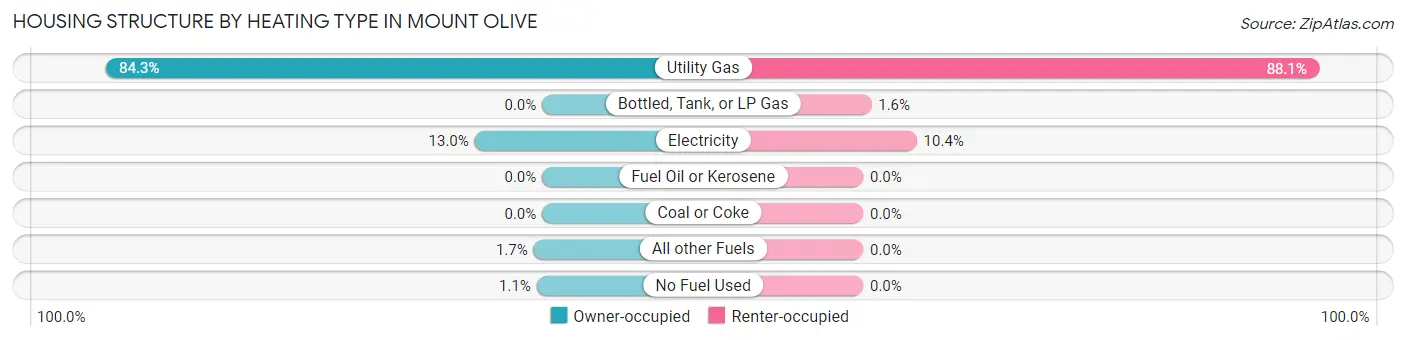
| Heating Type | Owner-occupied | Renter-occupied |
| Utility Gas | 562 (84.3%) | 221 (88.0%) |
| Bottled, Tank, or LP Gas | 0 (0.0%) | 4 (1.6%) |
| Electricity | 87 (13.0%) | 26 (10.4%) |
| Fuel Oil or Kerosene | 0 (0.0%) | 0 (0.0%) |
| Coal or Coke | 0 (0.0%) | 0 (0.0%) |
| All other Fuels | 11 (1.7%) | 0 (0.0%) |
| No Fuel Used | 7 (1.1%) | 0 (0.0%) |
| Total | 667 (100.0%) | 251 (100.0%) |
Household Vehicle Usage in Mount Olive

| Vehicles per Household | Owner-occupied | Renter-occupied |
| No Vehicle | 18 (2.7%) | 17 (6.8%) |
| 1 Vehicle | 151 (22.6%) | 91 (36.2%) |
| 2 Vehicles | 286 (42.9%) | 115 (45.8%) |
| 3 or more Vehicles | 212 (31.8%) | 28 (11.2%) |
| Total | 667 (100.0%) | 251 (100.0%) |
Real Estate & Mortgages in Mount Olive
Real Estate and Mortgage Overview in Mount Olive
| Characteristic | Without Mortgage | With Mortgage |
| Housing Units | 317 | 350 |
| Median Property Value | $97,900 | $88,600 |
| Median Household Income | $62,679 | $35 |
| Monthly Housing Costs | $527 | $0 |
| Real Estate Taxes | $1,919 | $7 |
Property Value by Mortgage Status in Mount Olive
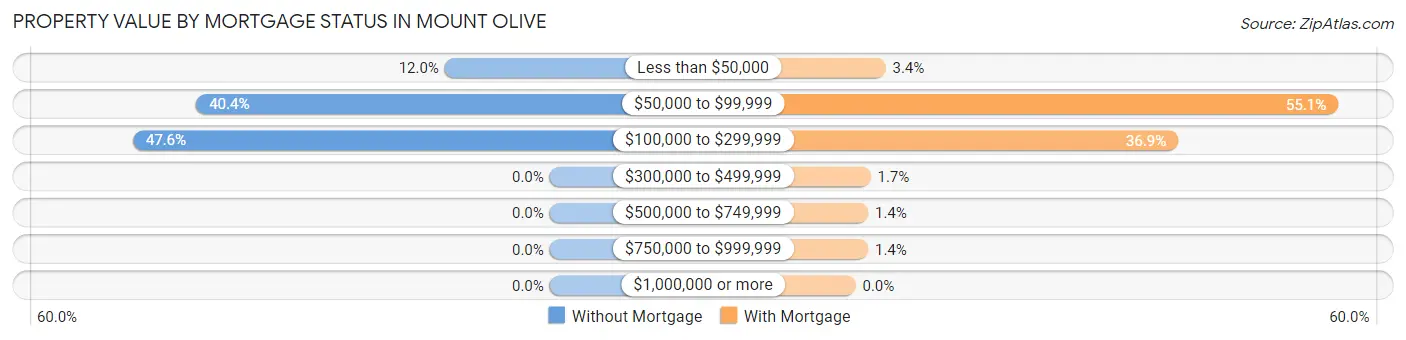
| Property Value | Without Mortgage | With Mortgage |
| Less than $50,000 | 38 (12.0%) | 12 (3.4%) |
| $50,000 to $99,999 | 128 (40.4%) | 193 (55.1%) |
| $100,000 to $299,999 | 151 (47.6%) | 129 (36.9%) |
| $300,000 to $499,999 | 0 (0.0%) | 6 (1.7%) |
| $500,000 to $749,999 | 0 (0.0%) | 5 (1.4%) |
| $750,000 to $999,999 | 0 (0.0%) | 5 (1.4%) |
| $1,000,000 or more | 0 (0.0%) | 0 (0.0%) |
| Total | 317 (100.0%) | 350 (100.0%) |
Household Income by Mortgage Status in Mount Olive
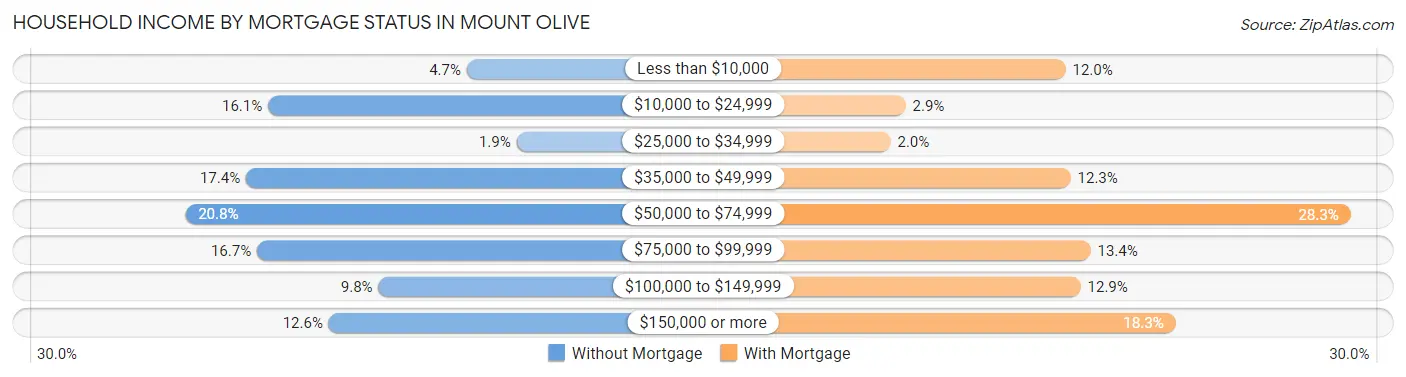
| Household Income | Without Mortgage | With Mortgage |
| Less than $10,000 | 15 (4.7%) | 42 (12.0%) |
| $10,000 to $24,999 | 51 (16.1%) | 10 (2.9%) |
| $25,000 to $34,999 | 6 (1.9%) | 7 (2.0%) |
| $35,000 to $49,999 | 55 (17.3%) | 43 (12.3%) |
| $50,000 to $74,999 | 66 (20.8%) | 99 (28.3%) |
| $75,000 to $99,999 | 53 (16.7%) | 47 (13.4%) |
| $100,000 to $149,999 | 31 (9.8%) | 45 (12.9%) |
| $150,000 or more | 40 (12.6%) | 64 (18.3%) |
| Total | 317 (100.0%) | 350 (100.0%) |
Property Value to Household Income Ratio in Mount Olive
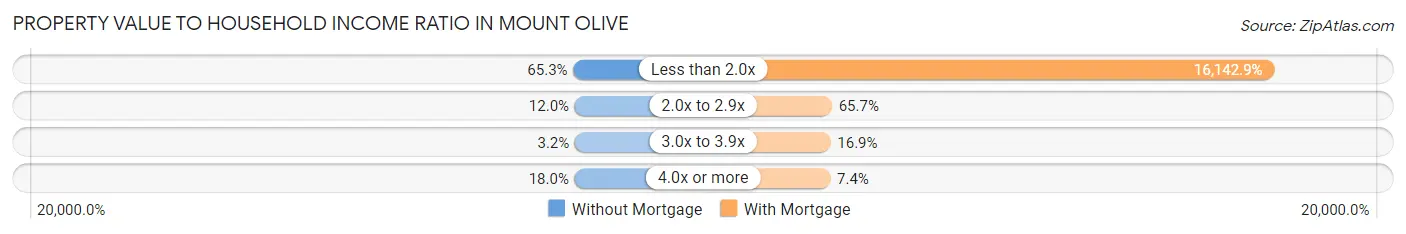
| Value-to-Income Ratio | Without Mortgage | With Mortgage |
| Less than 2.0x | 207 (65.3%) | 56,500 (16,142.9%) |
| 2.0x to 2.9x | 38 (12.0%) | 230 (65.7%) |
| 3.0x to 3.9x | 10 (3.2%) | 59 (16.9%) |
| 4.0x or more | 57 (18.0%) | 26 (7.4%) |
| Total | 317 (100.0%) | 350 (100.0%) |
Real Estate Taxes by Mortgage Status in Mount Olive
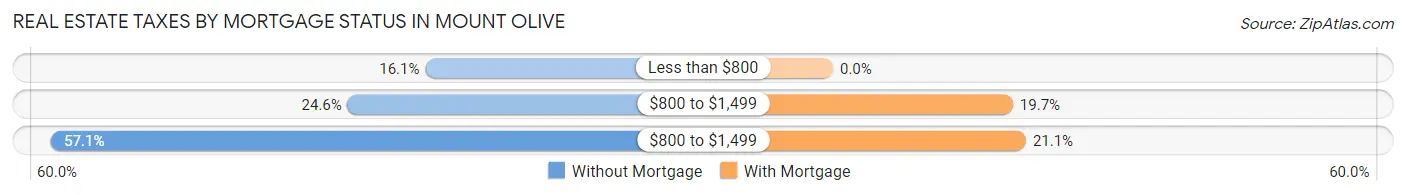
| Property Taxes | Without Mortgage | With Mortgage |
| Less than $800 | 51 (16.1%) | 0 (0.0%) |
| $800 to $1,499 | 78 (24.6%) | 69 (19.7%) |
| $800 to $1,499 | 181 (57.1%) | 74 (21.1%) |
| Total | 317 (100.0%) | 350 (100.0%) |
Health & Disability in Mount Olive
Health Insurance Coverage by Age in Mount Olive
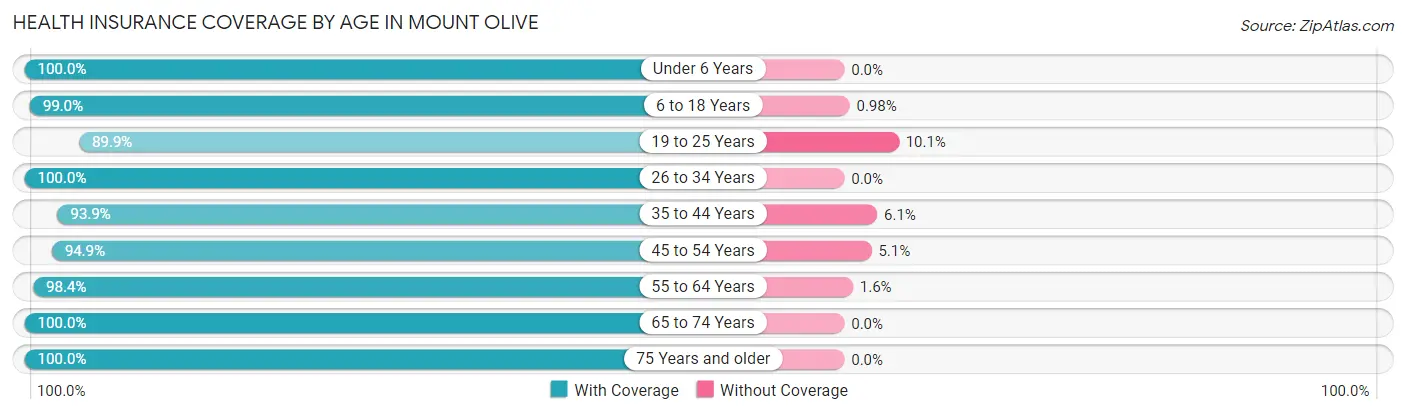
| Age Bracket | With Coverage | Without Coverage |
| Under 6 Years | 124 (100.0%) | 0 (0.0%) |
| 6 to 18 Years | 304 (99.0%) | 3 (1.0%) |
| 19 to 25 Years | 133 (89.9%) | 15 (10.1%) |
| 26 to 34 Years | 135 (100.0%) | 0 (0.0%) |
| 35 to 44 Years | 261 (93.9%) | 17 (6.1%) |
| 45 to 54 Years | 262 (94.9%) | 14 (5.1%) |
| 55 to 64 Years | 310 (98.4%) | 5 (1.6%) |
| 65 to 74 Years | 346 (100.0%) | 0 (0.0%) |
| 75 Years and older | 215 (100.0%) | 0 (0.0%) |
| Total | 2,090 (97.5%) | 54 (2.5%) |
Health Insurance Coverage by Citizenship Status in Mount Olive
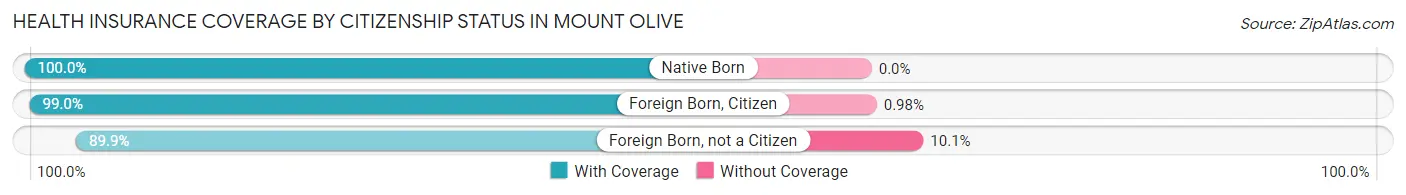
| Citizenship Status | With Coverage | Without Coverage |
| Native Born | 124 (100.0%) | 0 (0.0%) |
| Foreign Born, Citizen | 304 (99.0%) | 3 (1.0%) |
| Foreign Born, not a Citizen | 133 (89.9%) | 15 (10.1%) |
Health Insurance Coverage by Household Income in Mount Olive
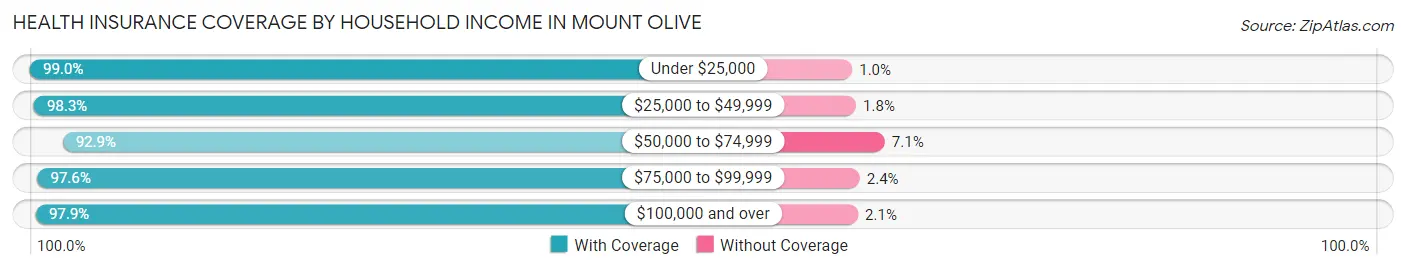
| Household Income | With Coverage | Without Coverage |
| Under $25,000 | 385 (99.0%) | 4 (1.0%) |
| $25,000 to $49,999 | 619 (98.3%) | 11 (1.8%) |
| $50,000 to $74,999 | 260 (92.9%) | 20 (7.1%) |
| $75,000 to $99,999 | 320 (97.6%) | 8 (2.4%) |
| $100,000 and over | 506 (97.9%) | 11 (2.1%) |
Public vs Private Health Insurance Coverage by Age in Mount Olive
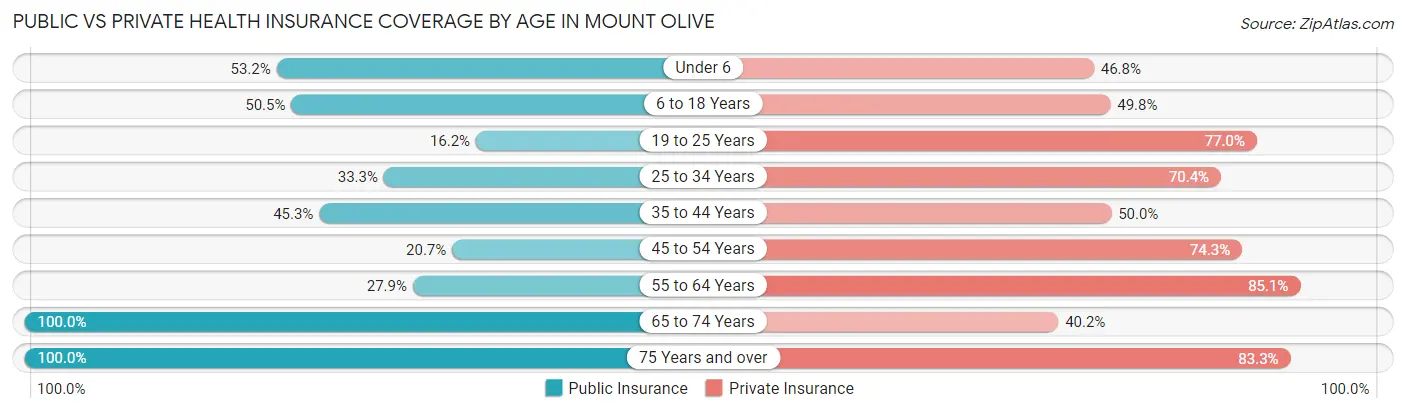
| Age Bracket | Public Insurance | Private Insurance |
| Under 6 | 66 (53.2%) | 58 (46.8%) |
| 6 to 18 Years | 155 (50.5%) | 153 (49.8%) |
| 19 to 25 Years | 24 (16.2%) | 114 (77.0%) |
| 25 to 34 Years | 45 (33.3%) | 95 (70.4%) |
| 35 to 44 Years | 126 (45.3%) | 139 (50.0%) |
| 45 to 54 Years | 57 (20.6%) | 205 (74.3%) |
| 55 to 64 Years | 88 (27.9%) | 268 (85.1%) |
| 65 to 74 Years | 346 (100.0%) | 139 (40.2%) |
| 75 Years and over | 215 (100.0%) | 179 (83.3%) |
| Total | 1,122 (52.3%) | 1,350 (63.0%) |
Disability Status by Sex by Age in Mount Olive
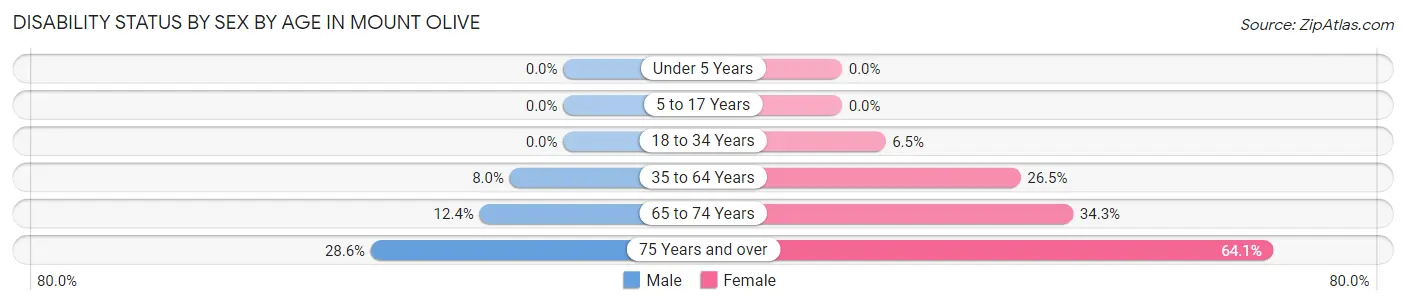
| Age Bracket | Male | Female |
| Under 5 Years | 0 (0.0%) | 0 (0.0%) |
| 5 to 17 Years | 0 (0.0%) | 0 (0.0%) |
| 18 to 34 Years | 0 (0.0%) | 10 (6.5%) |
| 35 to 64 Years | 31 (8.0%) | 127 (26.5%) |
| 65 to 74 Years | 22 (12.4%) | 58 (34.3%) |
| 75 Years and over | 28 (28.6%) | 75 (64.1%) |
Disability Class by Sex by Age in Mount Olive
Disability Class: Hearing Difficulty
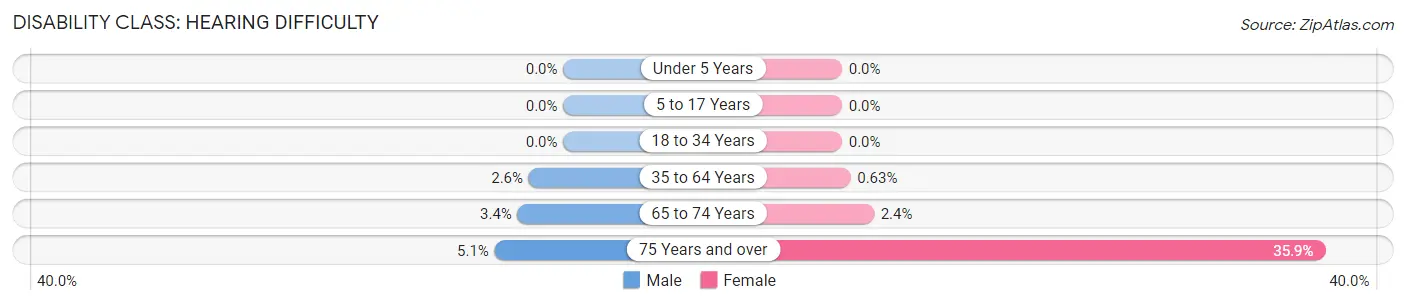
| Age Bracket | Male | Female |
| Under 5 Years | 0 (0.0%) | 0 (0.0%) |
| 5 to 17 Years | 0 (0.0%) | 0 (0.0%) |
| 18 to 34 Years | 0 (0.0%) | 0 (0.0%) |
| 35 to 64 Years | 10 (2.6%) | 3 (0.6%) |
| 65 to 74 Years | 6 (3.4%) | 4 (2.4%) |
| 75 Years and over | 5 (5.1%) | 42 (35.9%) |
Disability Class: Vision Difficulty
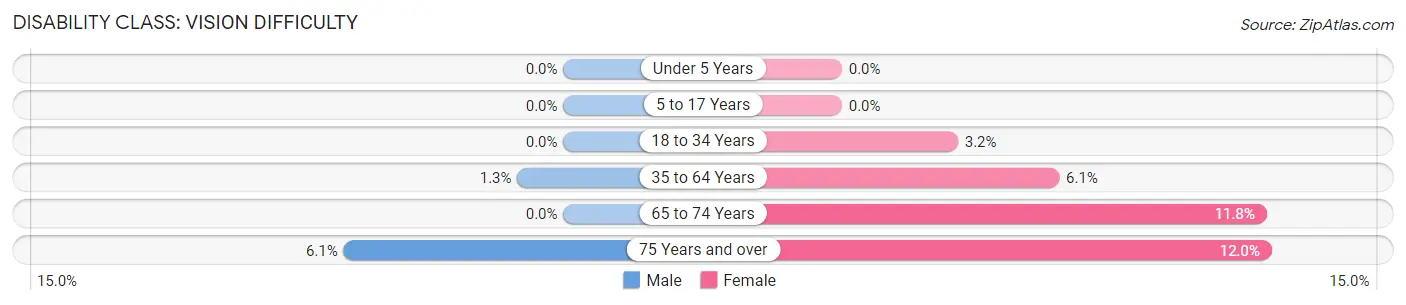
| Age Bracket | Male | Female |
| Under 5 Years | 0 (0.0%) | 0 (0.0%) |
| 5 to 17 Years | 0 (0.0%) | 0 (0.0%) |
| 18 to 34 Years | 0 (0.0%) | 5 (3.2%) |
| 35 to 64 Years | 5 (1.3%) | 29 (6.0%) |
| 65 to 74 Years | 0 (0.0%) | 20 (11.8%) |
| 75 Years and over | 6 (6.1%) | 14 (12.0%) |
Disability Class: Cognitive Difficulty
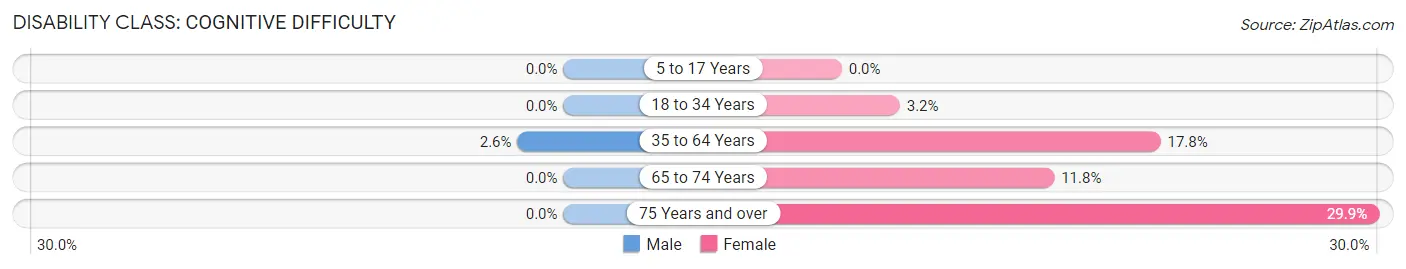
| Age Bracket | Male | Female |
| 5 to 17 Years | 0 (0.0%) | 0 (0.0%) |
| 18 to 34 Years | 0 (0.0%) | 5 (3.2%) |
| 35 to 64 Years | 10 (2.6%) | 85 (17.7%) |
| 65 to 74 Years | 0 (0.0%) | 20 (11.8%) |
| 75 Years and over | 0 (0.0%) | 35 (29.9%) |
Disability Class: Ambulatory Difficulty
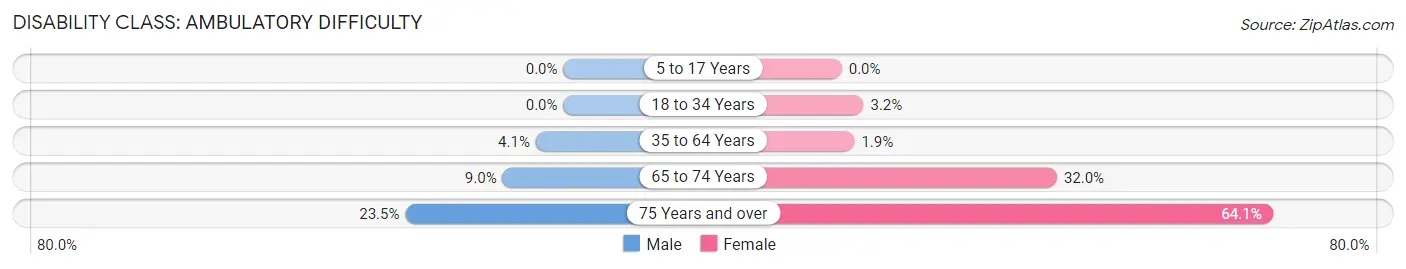
| Age Bracket | Male | Female |
| 5 to 17 Years | 0 (0.0%) | 0 (0.0%) |
| 18 to 34 Years | 0 (0.0%) | 5 (3.2%) |
| 35 to 64 Years | 16 (4.1%) | 9 (1.9%) |
| 65 to 74 Years | 16 (9.0%) | 54 (32.0%) |
| 75 Years and over | 23 (23.5%) | 75 (64.1%) |
Disability Class: Self-Care Difficulty
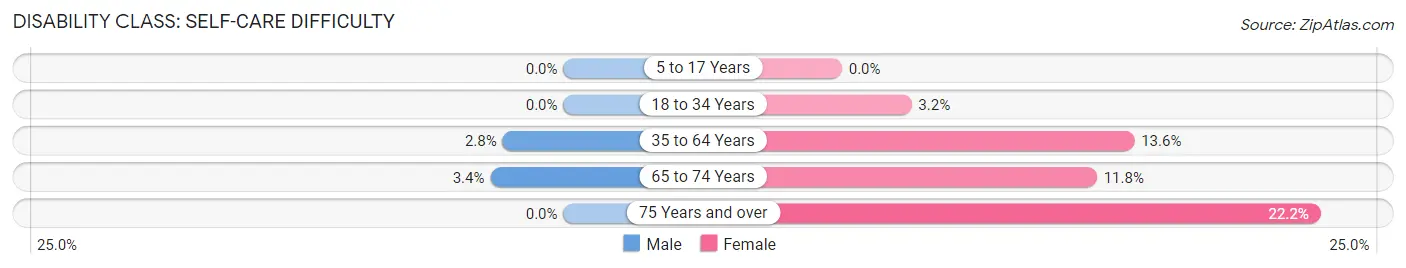
| Age Bracket | Male | Female |
| 5 to 17 Years | 0 (0.0%) | 0 (0.0%) |
| 18 to 34 Years | 0 (0.0%) | 5 (3.2%) |
| 35 to 64 Years | 11 (2.8%) | 65 (13.6%) |
| 65 to 74 Years | 6 (3.4%) | 20 (11.8%) |
| 75 Years and over | 0 (0.0%) | 26 (22.2%) |
Technology Access in Mount Olive
Computing Device Access in Mount Olive
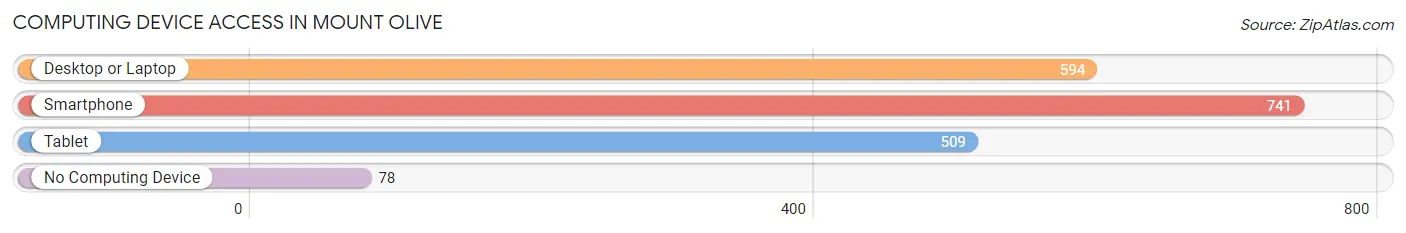
| Device Type | # Households | % Households |
| Desktop or Laptop | 594 | 64.7% |
| Smartphone | 741 | 80.7% |
| Tablet | 509 | 55.4% |
| No Computing Device | 78 | 8.5% |
| Total | 918 | 100.0% |
Internet Access in Mount Olive
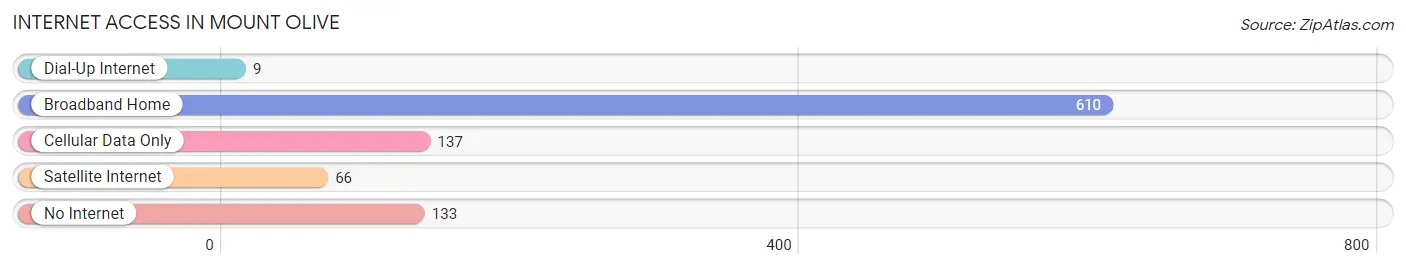
| Internet Type | # Households | % Households |
| Dial-Up Internet | 9 | 1.0% |
| Broadband Home | 610 | 66.4% |
| Cellular Data Only | 137 | 14.9% |
| Satellite Internet | 66 | 7.2% |
| No Internet | 133 | 14.5% |
| Total | 918 | 100.0% |
Mount Olive Summary
Introduction
Mount Olive is a small village located in Macoupin County, Illinois. It is situated in the central part of the state, about 25 miles northeast of St. Louis, Missouri. The village has a population of 1,845 people, according to the 2010 census. The village is known for its rich history, diverse geography, and vibrant economy. This paper will explore the history, geography, economy, and demographics of Mount Olive, Illinois in 2000 words.
History
Mount Olive was founded in 1854 by a group of settlers from the nearby town of Carlinville. The settlers named the village after the biblical Mount of Olives. The village was incorporated in 1872 and has since grown to become a thriving community.
The village has a rich history of industry and agriculture. In the late 19th century, the village was home to several coal mines, which provided employment for many of the residents. The village also had a thriving agricultural industry, with many of the residents working in the fields and orchards.
The village was also home to several churches, including the First Baptist Church, which was founded in 1871. The village also had a school, which was established in 1876.
Geography
Mount Olive is located in the central part of Illinois, about 25 miles northeast of St. Louis, Missouri. The village is situated in Macoupin County, which is part of the Metro-East region of the state.
The village is located in the heart of the Illinois prairie, which is characterized by rolling hills and flat plains. The village is surrounded by farmland, with many of the residents working in the agricultural industry.
The village is located near several major highways, including Interstate 55, which runs north-south through the village. The village is also located near several major cities, including St. Louis, Missouri, and Springfield, Illinois.
Economy
The economy of Mount Olive is largely based on agriculture and industry. The village is home to several farms, which provide employment for many of the residents. The village also has several manufacturing plants, which produce a variety of products, including furniture, clothing, and electronics.
The village is also home to several small businesses, including restaurants, retail stores, and service providers. The village also has a thriving tourism industry, with many visitors coming to the village to explore its history and attractions.
Demographics
According to the 2010 census, the population of Mount Olive is 1,845 people. The village is predominantly white, with 94.3% of the population identifying as white. The village also has a small Hispanic population, with 4.2% of the population identifying as Hispanic or Latino.
The median household income in the village is $45,938, and the median age is 41.7 years. The village has a low unemployment rate, with only 4.2% of the population unemployed.
Conclusion
Mount Olive is a small village located in Macoupin County, Illinois. The village has a rich history, diverse geography, and vibrant economy. The village is predominantly white, with 94.3% of the population identifying as white. The village also has a small Hispanic population, with 4.2% of the population identifying as Hispanic or Latino. The village has a thriving agricultural and industrial economy, with many of the residents working in the fields and factories. The village also has a thriving tourism industry, with many visitors coming to the village to explore its history and attractions.
Common Questions
What is the Total Population of Mount Olive?
Total Population of Mount Olive is 2,144.
What is the Total Male Population of Mount Olive?
Total Male Population of Mount Olive is 1,068.
What is the Total Female Population of Mount Olive?
Total Female Population of Mount Olive is 1,076.
What is the Ratio of Males per 100 Females in Mount Olive?
There are 99.26 Males per 100 Females in Mount Olive.
What is the Ratio of Females per 100 Males in Mount Olive?
There are 100.75 Females per 100 Males in Mount Olive.
What is the Median Population Age in Mount Olive?
Median Population Age in Mount Olive is 48.6 Years.
What is the Average Family Size in Mount Olive
Average Family Size in Mount Olive is 2.8 People.
What is the Average Household Size in Mount Olive
Average Household Size in Mount Olive is 2.3 People.
What is Per Capita Income in Mount Olive?
Per Capita income in Mount Olive is $29,393.
What is the Median Family Income in Mount Olive?
Median Family Income in Mount Olive is $56,800.
What is the Median Household income in Mount Olive?
Median Household Income in Mount Olive is $46,824.
What is Income or Wage Gap in Mount Olive?
Income or Wage Gap in Mount Olive is 26.5%.
Women in Mount Olive earn 73.5 cents for every dollar earned by a man.
What is Inequality or Gini Index in Mount Olive?
Inequality or Gini Index in Mount Olive is 0.44.
How Large is the Labor Force in Mount Olive?
There are 884 People in the Labor Forcein in Mount Olive.
What is the Percentage of People in the Labor Force in Mount Olive?
49.7% of People are in the Labor Force in Mount Olive.
What is the Unemployment Rate in Mount Olive?
Unemployment Rate in Mount Olive is 8.1%.