Immigrants from Guyana vs Bahamian Disability

COMPARE

Immigrants from Guyana
Race
Ancestry
AfghanAfricanAlaska NativeAlaskan AthabascanAlbanianAleutAlsatianAmericanApacheArabArapahoArgentineanArmenianAssyrian/Chaldean/SyriacAustralianAustrianBangladeshiBarbadianBasqueBelgianBelizeanBermudanBhutaneseBlackfeetBolivianBrazilianBritishBritish West IndianBulgarianBurmeseCajunCambodianCanadianCape VerdeanCarpatho RusynCelticCentral AmericanCentral American IndianCherokeeCheyenneChickasawChileanChineseChippewaChoctawColombianColvilleComancheCosta RicanCreeCreekCroatianCrowCubanCypriotCzechCzechoslovakianDanishDelawareDominicanDutchDutch West IndianEastern EuropeanEcuadorianEgyptianEnglishEstonianEthiopianEuropeanFijianFilipinoFinnishFrenchFrench American IndianFrench CanadianGermanGerman RussianGhanaianGreekGuamanian/ChamorroGuatemalanGuyaneseHaitianHmongHonduranHopiHoumaHungarianIcelanderIndian (Asian)IndonesianInupiatIranianIraqiIrishIroquoisIsraeliItalianJamaicanJapaneseJordanianKenyanKiowaKoreanLaotianLatvianLebaneseLiberianLithuanianLumbeeLuxembourgerMacedonianMalaysianMalteseMarshalleseMenomineeMexicanMexican American IndianMongolianMoroccanNative HawaiianNavajoNepaleseNew ZealanderNicaraguanNigerianNorthern EuropeanNorwegianOkinawanOsageOttawaPaiutePakistaniPalestinianPanamanianParaguayanPennsylvania GermanPeruvianPimaPolishPortuguesePotawatomiPuebloPuerto RicanPuget Sound SalishRomanianRussianSalvadoranSamoanScandinavianScotch-IrishScottishSeminoleSenegaleseSerbianShoshoneSierra LeoneanSiouxSlavicSlovakSloveneSomaliSouth AfricanSouth AmericanSouth American IndianSoviet UnionSpaniardSpanishSpanish AmericanSpanish American IndianSri LankanSubsaharan AfricanSudaneseSwedishSwissSyrianTaiwaneseThaiTlingit-HaidaTohono O'OdhamTonganTrinidadian and TobagonianTsimshianTurkishU.S. Virgin IslanderUgandanUkrainianUruguayanUteVenezuelanVietnameseWelshWest IndianYakamaYaquiYugoslavianYumanYup'ikZimbabwean
Immigration
NonimmigrantsImmigrantsAfghanistanAfricaAlbaniaArgentinaArmeniaAsiaAustraliaAustriaBahamasBangladeshBarbadosBelarusBelgiumBelizeBoliviaBosnia and HerzegovinaBrazilBulgariaBurma/MyanmarCabo VerdeCambodiaCameroonCanadaCaribbeanCentral AmericaChileChinaColombiaCongoCosta RicaCroatiaCubaCzechoslovakiaDenmarkDominicaDominican RepublicEastern AfricaEastern AsiaEastern EuropeEcuadorEgyptEl SalvadorEnglandEritreaEthiopiaEuropeFijiFranceGermanyGhanaGreeceGrenadaGuatemalaGuyanaHaitiHondurasHong KongHungaryIndiaIndonesiaIranIraqIrelandIsraelItalyJamaicaJapanJordanKazakhstanKenyaKoreaKuwaitLaosLatin AmericaLatviaLebanonLiberiaLithuaniaMalaysiaMexicoMicronesiaMiddle AfricaMoldovaMoroccoNepalNetherlandsNicaraguaNigeriaNorth AmericaNorth MacedoniaNorthern AfricaNorthern EuropeNorwayOceaniaPakistanPanamaPeruPhilippinesPolandPortugalRomaniaRussiaSaudi ArabiaScotlandSenegalSerbiaSierra LeoneSingaporeSomaliaSouth AfricaSouth AmericaSouth Central AsiaSouth Eastern AsiaSouthern EuropeSpainSri LankaSt. Vincent and the GrenadinesSudanSwedenSwitzerlandSyriaTaiwanThailandTrinidad and TobagoTurkeyUgandaUkraineUruguayUzbekistanVenezuelaVietnamWest IndiesWestern AfricaWestern AsiaWestern EuropeYemenZaireZimbabweAzores
Bahamian
Race
Ancestry
AfghanAfricanAlaska NativeAlaskan AthabascanAlbanianAleutAlsatianAmericanApacheArabArapahoArgentineanArmenianAssyrian/Chaldean/SyriacAustralianAustrianBahamianBangladeshiBarbadianBasqueBelgianBelizeanBermudanBhutaneseBlackfeetBolivianBrazilianBritishBritish West IndianBulgarianBurmeseCajunCambodianCanadianCape VerdeanCarpatho RusynCelticCentral AmericanCentral American IndianCherokeeCheyenneChickasawChileanChineseChippewaChoctawColombianColvilleComancheCosta RicanCreeCreekCroatianCrowCubanCypriotCzechCzechoslovakianDanishDelawareDominicanDutchDutch West IndianEastern EuropeanEcuadorianEgyptianEnglishEstonianEthiopianEuropeanFijianFilipinoFinnishFrenchFrench American IndianFrench CanadianGermanGerman RussianGhanaianGreekGuamanian/ChamorroGuatemalanGuyaneseHaitianHmongHonduranHopiHoumaHungarianIcelanderIndian (Asian)IndonesianInupiatIranianIraqiIrishIroquoisIsraeliItalianJamaicanJapaneseJordanianKenyanKiowaKoreanLaotianLatvianLebaneseLiberianLithuanianLumbeeLuxembourgerMacedonianMalaysianMalteseMarshalleseMenomineeMexicanMexican American IndianMongolianMoroccanNative HawaiianNavajoNepaleseNew ZealanderNicaraguanNigerianNorthern EuropeanNorwegianOkinawanOsageOttawaPaiutePakistaniPalestinianPanamanianParaguayanPennsylvania GermanPeruvianPimaPolishPortuguesePotawatomiPuebloPuerto RicanPuget Sound SalishRomanianRussianSalvadoranSamoanScandinavianScotch-IrishScottishSeminoleSenegaleseSerbianShoshoneSierra LeoneanSiouxSlavicSlovakSloveneSomaliSouth AfricanSouth AmericanSouth American IndianSoviet UnionSpaniardSpanishSpanish AmericanSpanish American IndianSri LankanSubsaharan AfricanSudaneseSwedishSwissSyrianTaiwaneseThaiTlingit-HaidaTohono O'OdhamTonganTrinidadian and TobagonianTsimshianTurkishU.S. Virgin IslanderUgandanUkrainianUruguayanUteVenezuelanVietnameseWelshWest IndianYakamaYaquiYugoslavianYumanYup'ikZimbabwean
Immigration
NonimmigrantsImmigrantsAfghanistanAfricaAlbaniaArgentinaArmeniaAsiaAustraliaAustriaBahamasBangladeshBarbadosBelarusBelgiumBelizeBoliviaBosnia and HerzegovinaBrazilBulgariaBurma/MyanmarCabo VerdeCambodiaCameroonCanadaCaribbeanCentral AmericaChileChinaColombiaCongoCosta RicaCroatiaCubaCzechoslovakiaDenmarkDominicaDominican RepublicEastern AfricaEastern AsiaEastern EuropeEcuadorEgyptEl SalvadorEnglandEritreaEthiopiaEuropeFijiFranceGermanyGhanaGreeceGrenadaGuatemalaHaitiHondurasHong KongHungaryIndiaIndonesiaIranIraqIrelandIsraelItalyJamaicaJapanJordanKazakhstanKenyaKoreaKuwaitLaosLatin AmericaLatviaLebanonLiberiaLithuaniaMalaysiaMexicoMicronesiaMiddle AfricaMoldovaMoroccoNepalNetherlandsNicaraguaNigeriaNorth AmericaNorth MacedoniaNorthern AfricaNorthern EuropeNorwayOceaniaPakistanPanamaPeruPhilippinesPolandPortugalRomaniaRussiaSaudi ArabiaScotlandSenegalSerbiaSierra LeoneSingaporeSomaliaSouth AfricaSouth AmericaSouth Central AsiaSouth Eastern AsiaSouthern EuropeSpainSri LankaSt. Vincent and the GrenadinesSudanSwedenSwitzerlandSyriaTaiwanThailandTrinidad and TobagoTurkeyUgandaUkraineUruguayUzbekistanVenezuelaVietnamWest IndiesWestern AfricaWestern AsiaWestern EuropeYemenZaireZimbabweAzores
Disability
Income
Poverty
Unemployment
Labor Participation
Family Structure
Vehicle Availability
Education Level
Disability

Disability Comparison

Immigrants from Guyana

Bahamians

Excellent
Tragic
11.4%
DISABILITY
88.3/ 100
METRIC RATING
134th/ 347
METRIC RANK
12.2%
DISABILITY
2.3/ 100
METRIC RATING
233rd/ 347
METRIC RANK

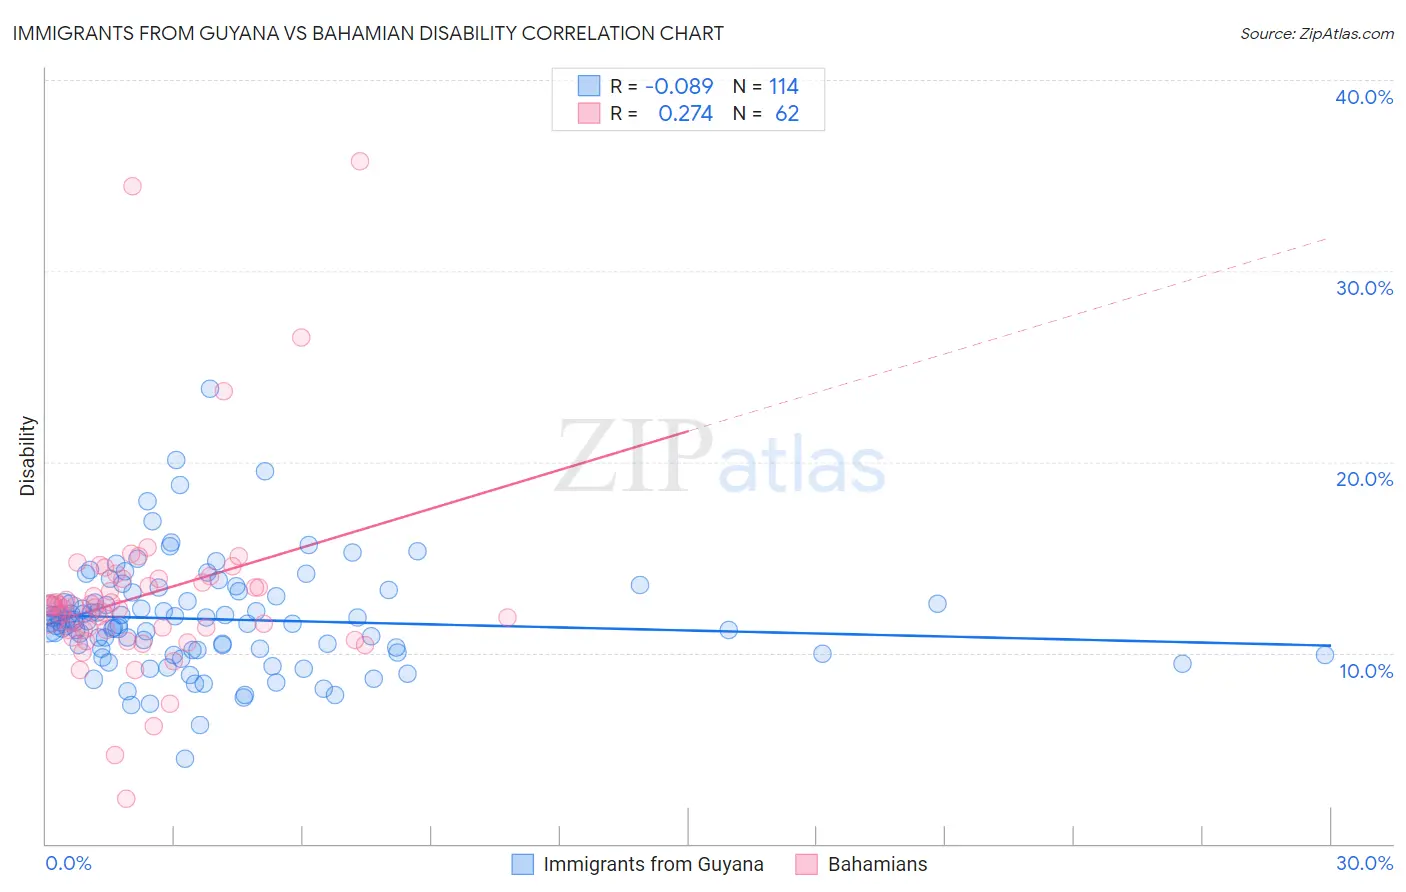
Immigrants from Guyana vs Bahamian Disability Correlation Chart

The statistical analysis conducted on geographies consisting of 183,715,267 people shows a slight negative correlation between the proportion of Immigrants from Guyana and percentage of population with a disability in the United States with a correlation coefficient (R) of -0.089 and weighted average of 11.4%. Similarly, the statistical analysis conducted on geographies consisting of 112,688,060 people shows a weak positive correlation between the proportion of Bahamians and percentage of population with a disability in the United States with a correlation coefficient (R) of 0.274 and weighted average of 12.2%, a difference of 6.5%.
Immigrants from Guyana vs Bahamian Disability

Disability Correlation Summary

MeasurementImmigrants from GuyanaBahamian
Minimum4.4%2.3%
Maximum23.8%35.8%
Range19.4%33.4%
Mean11.8%13.0%
Median11.6%12.4%
Interquartile 25% (IQ1)10.1%11.2%
Interquartile 75% (IQ3)13.0%13.9%
Interquartile Range (IQR)2.8%2.7%
Standard Deviation (Sample)2.8%5.3%
Standard Deviation (Population)2.8%5.2%

Similar Demographics by Disability

Demographics Similar to Immigrants from Guyana by Disability

In terms of disability, the demographic groups most similar to Immigrants from Guyana are Ugandan (11.4%, a difference of 0.050%), Immigrants from St. Vincent and the Grenadines (11.4%, a difference of 0.060%), Arab (11.4%, a difference of 0.080%), Immigrants from Africa (11.4%, a difference of 0.11%), and Kenyan (11.5%, a difference of 0.13%).
DemographicsRating | RankDisability
Immigrants | Italy
90.4
/100
|
#127
Exceptional
11.4%
Immigrants | Europe
90.4
/100
|
#128
Exceptional
11.4%
Macedonians
90.3
/100
|
#129
Exceptional
11.4%
Latvians
89.8
/100
|
#130
Excellent
11.4%
Immigrants | Croatia
89.8
/100
|
#131
Excellent
11.4%
Immigrants | Africa
89.3
/100
|
#132
Excellent
11.4%
Arabs
89.1
/100
|
#133
Excellent
11.4%
Immigrants | Guyana
88.3
/100
|
#134
Excellent
11.4%
Ugandans
87.9
/100
|
#135
Excellent
11.4%
Immigrants | St. Vincent and the Grenadines
87.8
/100
|
#136
Excellent
11.4%
Kenyans
87.1
/100
|
#137
Excellent
11.5%
New Zealanders
87.0
/100
|
#138
Excellent
11.5%
Ghanaians
87.0
/100
|
#139
Excellent
11.5%
Russians
86.8
/100
|
#140
Excellent
11.5%
Immigrants | Grenada
86.1
/100
|
#141
Excellent
11.5%

Demographics Similar to Bahamians by Disability

In terms of disability, the demographic groups most similar to Bahamians are Japanese (12.2%, a difference of 0.030%), Yup'ik (12.2%, a difference of 0.070%), Italian (12.2%, a difference of 0.090%), Malaysian (12.2%, a difference of 0.10%), and Samoan (12.2%, a difference of 0.13%).
DemographicsRating | RankDisability
Jamaicans
3.3
/100
|
#226
Tragic
12.1%
Alsatians
3.3
/100
|
#227
Tragic
12.1%
West Indians
2.9
/100
|
#228
Tragic
12.2%
Inupiat
2.8
/100
|
#229
Tragic
12.2%
Samoans
2.6
/100
|
#230
Tragic
12.2%
Malaysians
2.5
/100
|
#231
Tragic
12.2%
Italians
2.5
/100
|
#232
Tragic
12.2%
Bahamians
2.3
/100
|
#233
Tragic
12.2%
Japanese
2.3
/100
|
#234
Tragic
12.2%
Yup'ik
2.2
/100
|
#235
Tragic
12.2%
Chinese
2.0
/100
|
#236
Tragic
12.2%
Immigrants | Congo
1.9
/100
|
#237
Tragic
12.2%
Norwegians
1.9
/100
|
#238
Tragic
12.2%
Swedes
1.8
/100
|
#239
Tragic
12.2%
Hungarians
1.7
/100
|
#240
Tragic
12.2%