Immigrants from Sudan vs Immigrants from Singapore 1 or more Vehicles in Household

COMPARE

Immigrants from Sudan
Race
Ancestry
AfghanAfricanAlaska NativeAlaskan AthabascanAlbanianAleutAlsatianAmericanApacheArabArapahoArgentineanArmenianAssyrian/Chaldean/SyriacAustralianAustrianBahamianBangladeshiBarbadianBasqueBelgianBelizeanBermudanBhutaneseBlackfeetBolivianBrazilianBritishBritish West IndianBulgarianBurmeseCajunCambodianCanadianCape VerdeanCarpatho RusynCelticCentral AmericanCentral American IndianCherokeeCheyenneChickasawChileanChineseChippewaChoctawColombianColvilleComancheCosta RicanCreeCreekCroatianCrowCubanCypriotCzechCzechoslovakianDanishDelawareDominicanDutchDutch West IndianEastern EuropeanEcuadorianEgyptianEnglishEstonianEthiopianEuropeanFijianFilipinoFinnishFrenchFrench American IndianFrench CanadianGermanGerman RussianGhanaianGreekGuamanian/ChamorroGuatemalanGuyaneseHaitianHmongHonduranHopiHoumaHungarianIcelanderIndian (Asian)IndonesianInupiatIranianIraqiIrishIroquoisIsraeliItalianJamaicanJapaneseJordanianKenyanKiowaKoreanLaotianLatvianLebaneseLiberianLithuanianLumbeeLuxembourgerMacedonianMalaysianMalteseMarshalleseMenomineeMexicanMexican American IndianMongolianMoroccanNative HawaiianNavajoNepaleseNew ZealanderNicaraguanNigerianNorthern EuropeanNorwegianOkinawanOsageOttawaPaiutePakistaniPalestinianPanamanianParaguayanPennsylvania GermanPeruvianPimaPolishPortuguesePotawatomiPuebloPuerto RicanPuget Sound SalishRomanianRussianSalvadoranSamoanScandinavianScotch-IrishScottishSeminoleSenegaleseSerbianShoshoneSierra LeoneanSiouxSlavicSlovakSloveneSomaliSouth AfricanSouth AmericanSouth American IndianSoviet UnionSpaniardSpanishSpanish AmericanSpanish American IndianSri LankanSubsaharan AfricanSudaneseSwedishSwissSyrianTaiwaneseThaiTlingit-HaidaTohono O'OdhamTonganTrinidadian and TobagonianTsimshianTurkishU.S. Virgin IslanderUgandanUkrainianUruguayanUteVenezuelanVietnameseWelshWest IndianYakamaYaquiYugoslavianYumanYup'ikZimbabwean
Immigration
NonimmigrantsImmigrantsAfghanistanAfricaAlbaniaArgentinaArmeniaAsiaAustraliaAustriaBahamasBangladeshBarbadosBelarusBelgiumBelizeBoliviaBosnia and HerzegovinaBrazilBulgariaBurma/MyanmarCabo VerdeCambodiaCameroonCanadaCaribbeanCentral AmericaChileChinaColombiaCongoCosta RicaCroatiaCubaCzechoslovakiaDenmarkDominicaDominican RepublicEastern AfricaEastern AsiaEastern EuropeEcuadorEgyptEl SalvadorEnglandEritreaEthiopiaEuropeFijiFranceGermanyGhanaGreeceGrenadaGuatemalaGuyanaHaitiHondurasHong KongHungaryIndiaIndonesiaIranIraqIrelandIsraelItalyJamaicaJapanJordanKazakhstanKenyaKoreaKuwaitLaosLatin AmericaLatviaLebanonLiberiaLithuaniaMalaysiaMexicoMicronesiaMiddle AfricaMoldovaMoroccoNepalNetherlandsNicaraguaNigeriaNorth AmericaNorth MacedoniaNorthern AfricaNorthern EuropeNorwayOceaniaPakistanPanamaPeruPhilippinesPolandPortugalRomaniaRussiaSaudi ArabiaScotlandSenegalSerbiaSierra LeoneSomaliaSouth AfricaSouth AmericaSouth Central AsiaSouth Eastern AsiaSouthern EuropeSpainSri LankaSt. Vincent and the GrenadinesSudanSwedenSwitzerlandSyriaTaiwanThailandTrinidad and TobagoTurkeyUgandaUkraineUruguayUzbekistanVenezuelaVietnamWest IndiesWestern AfricaWestern AsiaWestern EuropeYemenZaireZimbabweAzores
Immigrants from Singapore
Race
Ancestry
AfghanAfricanAlaska NativeAlaskan AthabascanAlbanianAleutAlsatianAmericanApacheArabArapahoArgentineanArmenianAssyrian/Chaldean/SyriacAustralianAustrianBahamianBangladeshiBarbadianBasqueBelgianBelizeanBermudanBhutaneseBlackfeetBolivianBrazilianBritishBritish West IndianBulgarianBurmeseCajunCambodianCanadianCape VerdeanCarpatho RusynCelticCentral AmericanCentral American IndianCherokeeCheyenneChickasawChileanChineseChippewaChoctawColombianColvilleComancheCosta RicanCreeCreekCroatianCrowCubanCypriotCzechCzechoslovakianDanishDelawareDominicanDutchDutch West IndianEastern EuropeanEcuadorianEgyptianEnglishEstonianEthiopianEuropeanFijianFilipinoFinnishFrenchFrench American IndianFrench CanadianGermanGerman RussianGhanaianGreekGuamanian/ChamorroGuatemalanGuyaneseHaitianHmongHonduranHopiHoumaHungarianIcelanderIndian (Asian)IndonesianInupiatIranianIraqiIrishIroquoisIsraeliItalianJamaicanJapaneseJordanianKenyanKiowaKoreanLaotianLatvianLebaneseLiberianLithuanianLumbeeLuxembourgerMacedonianMalaysianMalteseMarshalleseMenomineeMexicanMexican American IndianMongolianMoroccanNative HawaiianNavajoNepaleseNew ZealanderNicaraguanNigerianNorthern EuropeanNorwegianOkinawanOsageOttawaPaiutePakistaniPalestinianPanamanianParaguayanPennsylvania GermanPeruvianPimaPolishPortuguesePotawatomiPuebloPuerto RicanPuget Sound SalishRomanianRussianSalvadoranSamoanScandinavianScotch-IrishScottishSeminoleSenegaleseSerbianShoshoneSierra LeoneanSiouxSlavicSlovakSloveneSomaliSouth AfricanSouth AmericanSouth American IndianSoviet UnionSpaniardSpanishSpanish AmericanSpanish American IndianSri LankanSubsaharan AfricanSudaneseSwedishSwissSyrianTaiwaneseThaiTlingit-HaidaTohono O'OdhamTonganTrinidadian and TobagonianTsimshianTurkishU.S. Virgin IslanderUgandanUkrainianUruguayanUteVenezuelanVietnameseWelshWest IndianYakamaYaquiYugoslavianYumanYup'ikZimbabwean
Immigration
NonimmigrantsImmigrantsAfghanistanAfricaAlbaniaArgentinaArmeniaAsiaAustraliaAustriaBahamasBangladeshBarbadosBelarusBelgiumBelizeBoliviaBosnia and HerzegovinaBrazilBulgariaBurma/MyanmarCabo VerdeCambodiaCameroonCanadaCaribbeanCentral AmericaChileChinaColombiaCongoCosta RicaCroatiaCubaCzechoslovakiaDenmarkDominicaDominican RepublicEastern AfricaEastern AsiaEastern EuropeEcuadorEgyptEl SalvadorEnglandEritreaEthiopiaEuropeFijiFranceGermanyGhanaGreeceGrenadaGuatemalaGuyanaHaitiHondurasHong KongHungaryIndiaIndonesiaIranIraqIrelandIsraelItalyJamaicaJapanJordanKazakhstanKenyaKoreaKuwaitLaosLatin AmericaLatviaLebanonLiberiaLithuaniaMalaysiaMexicoMicronesiaMiddle AfricaMoldovaMoroccoNepalNetherlandsNicaraguaNigeriaNorth AmericaNorth MacedoniaNorthern AfricaNorthern EuropeNorwayOceaniaPakistanPanamaPeruPhilippinesPolandPortugalRomaniaRussiaSaudi ArabiaScotlandSenegalSerbiaSierra LeoneSingaporeSomaliaSouth AfricaSouth AmericaSouth Central AsiaSouth Eastern AsiaSouthern EuropeSpainSri LankaSt. Vincent and the GrenadinesSwedenSwitzerlandSyriaTaiwanThailandTrinidad and TobagoTurkeyUgandaUkraineUruguayUzbekistanVenezuelaVietnamWest IndiesWestern AfricaWestern AsiaWestern EuropeYemenZaireZimbabweAzores
1 or more Vehicles in Household
Income
Poverty
Unemployment
Labor Participation
Family Structure
Vehicle Availability
Education Level
Disability

1 or more Vehicles in Household Comparison

Immigrants from Sudan

Immigrants from Singapore

Average
Tragic
89.7%
1 OR MORE VEHICLES IN HOUSEHOLD
47.1/ 100
METRIC RATING
176th/ 347
METRIC RANK
87.2%
1 OR MORE VEHICLES IN HOUSEHOLD
0.1/ 100
METRIC RATING
275th/ 347
METRIC RANK

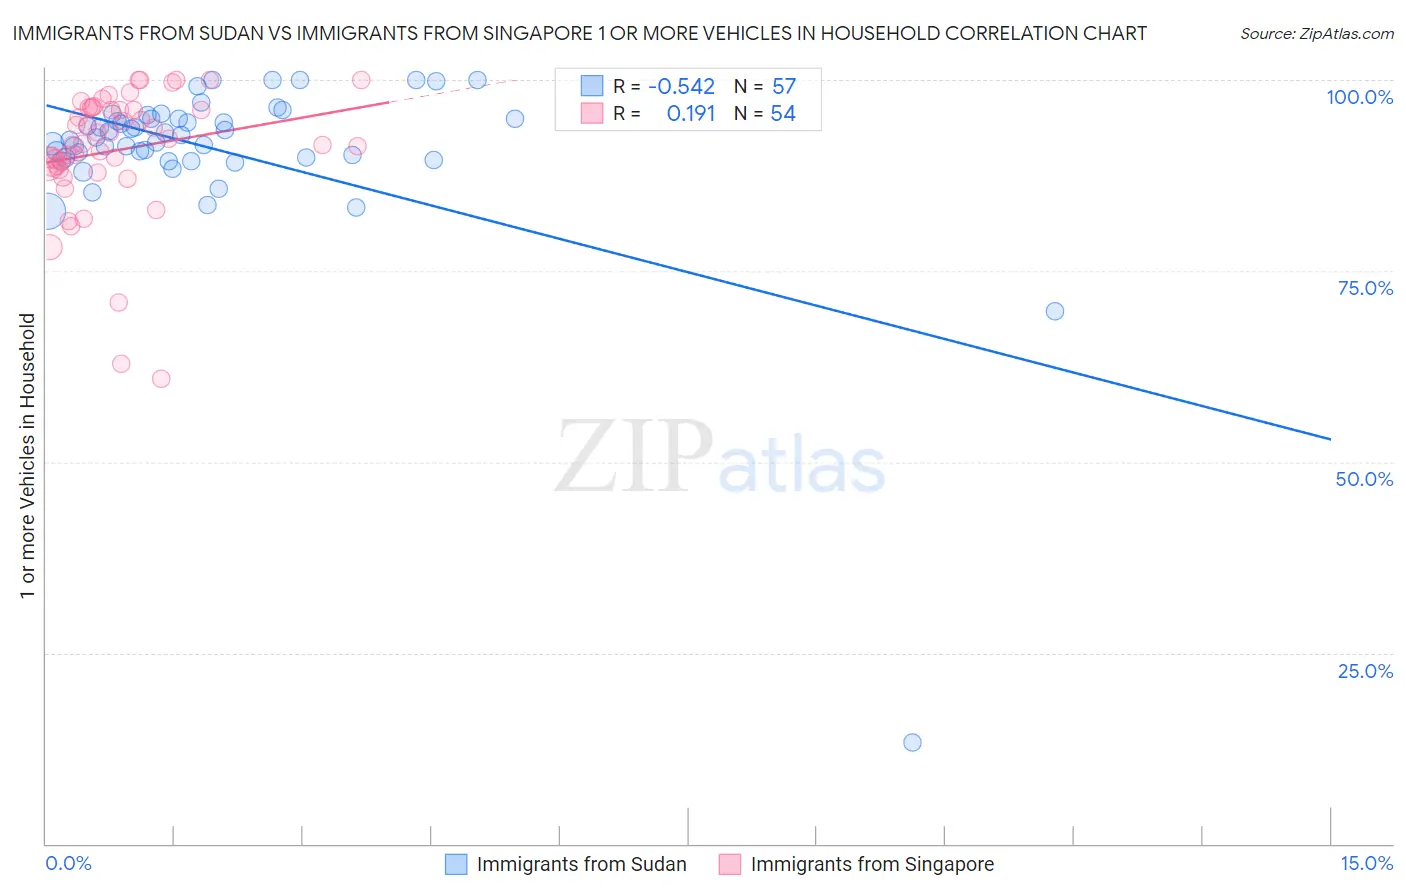
Immigrants from Sudan vs Immigrants from Singapore 1 or more Vehicles in Household Correlation Chart

The statistical analysis conducted on geographies consisting of 118,959,591 people shows a substantial negative correlation between the proportion of Immigrants from Sudan and percentage of households with 1 or more vehicles available in the United States with a correlation coefficient (R) of -0.542 and weighted average of 89.7%. Similarly, the statistical analysis conducted on geographies consisting of 137,467,600 people shows a poor positive correlation between the proportion of Immigrants from Singapore and percentage of households with 1 or more vehicles available in the United States with a correlation coefficient (R) of 0.191 and weighted average of 87.2%, a difference of 2.8%.
Immigrants from Sudan vs Immigrants from Singapore 1 or more Vehicles in Household

1 or more Vehicles in Household Correlation Summary

MeasurementImmigrants from SudanImmigrants from Singapore
Minimum13.3%60.9%
Maximum100.0%100.0%
Range86.7%39.1%
Mean90.9%90.8%
Median92.4%92.0%
Interquartile 25% (IQ1)89.7%88.6%
Interquartile 75% (IQ3)95.0%96.4%
Interquartile Range (IQR)5.3%7.8%
Standard Deviation (Sample)11.7%8.3%
Standard Deviation (Population)11.6%8.3%

Similar Demographics by 1 or more Vehicles in Household

Demographics Similar to Immigrants from Sudan by 1 or more Vehicles in Household

In terms of 1 or more vehicles in household, the demographic groups most similar to Immigrants from Sudan are Immigrants from Burma/Myanmar (89.7%, a difference of 0.010%), Hmong (89.6%, a difference of 0.020%), Filipino (89.7%, a difference of 0.050%), Immigrants from El Salvador (89.6%, a difference of 0.050%), and German Russian (89.6%, a difference of 0.050%).
DemographicsRating | Rank1 or more Vehicles in Household
Natives/Alaskans
59.5
/100
|
#169
Average
89.8%
Immigrants | Costa Rica
57.6
/100
|
#170
Average
89.8%
French American Indians
54.4
/100
|
#171
Average
89.8%
Indonesians
53.0
/100
|
#172
Average
89.7%
Lumbee
52.8
/100
|
#173
Average
89.7%
Filipinos
50.0
/100
|
#174
Average
89.7%
Immigrants | Burma/Myanmar
47.6
/100
|
#175
Average
89.7%
Immigrants | Sudan
47.1
/100
|
#176
Average
89.7%
Hmong
45.8
/100
|
#177
Average
89.6%
Immigrants | El Salvador
44.1
/100
|
#178
Average
89.6%
German Russians
44.0
/100
|
#179
Average
89.6%
Arabs
43.3
/100
|
#180
Average
89.6%
Immigrants | Ethiopia
42.5
/100
|
#181
Average
89.6%
Ukrainians
42.4
/100
|
#182
Average
89.6%
Ethiopians
41.2
/100
|
#183
Average
89.6%

Demographics Similar to Immigrants from Singapore by 1 or more Vehicles in Household

In terms of 1 or more vehicles in household, the demographic groups most similar to Immigrants from Singapore are Immigrants from France (87.1%, a difference of 0.070%), Alsatian (87.1%, a difference of 0.13%), Immigrants from Southern Europe (87.1%, a difference of 0.17%), Immigrants from Albania (87.1%, a difference of 0.17%), and Immigrants from Croatia (87.0%, a difference of 0.20%).
DemographicsRating | Rank1 or more Vehicles in Household
Immigrants | Europe
0.2
/100
|
#268
Tragic
87.6%
Immigrants | Africa
0.2
/100
|
#269
Tragic
87.6%
Panamanians
0.2
/100
|
#270
Tragic
87.5%
Bermudans
0.2
/100
|
#271
Tragic
87.5%
Aleuts
0.2
/100
|
#272
Tragic
87.5%
Immigrants | Northern Africa
0.2
/100
|
#273
Tragic
87.4%
Immigrants | Morocco
0.1
/100
|
#274
Tragic
87.4%
Immigrants | Singapore
0.1
/100
|
#275
Tragic
87.2%
Immigrants | France
0.1
/100
|
#276
Tragic
87.1%
Alsatians
0.1
/100
|
#277
Tragic
87.1%
Immigrants | Southern Europe
0.1
/100
|
#278
Tragic
87.1%
Immigrants | Albania
0.1
/100
|
#279
Tragic
87.1%
Immigrants | Croatia
0.0
/100
|
#280
Tragic
87.0%
Mongolians
0.0
/100
|
#281
Tragic
87.0%
Colville
0.0
/100
|
#282
Tragic
86.8%