Hudson Oaks, TX
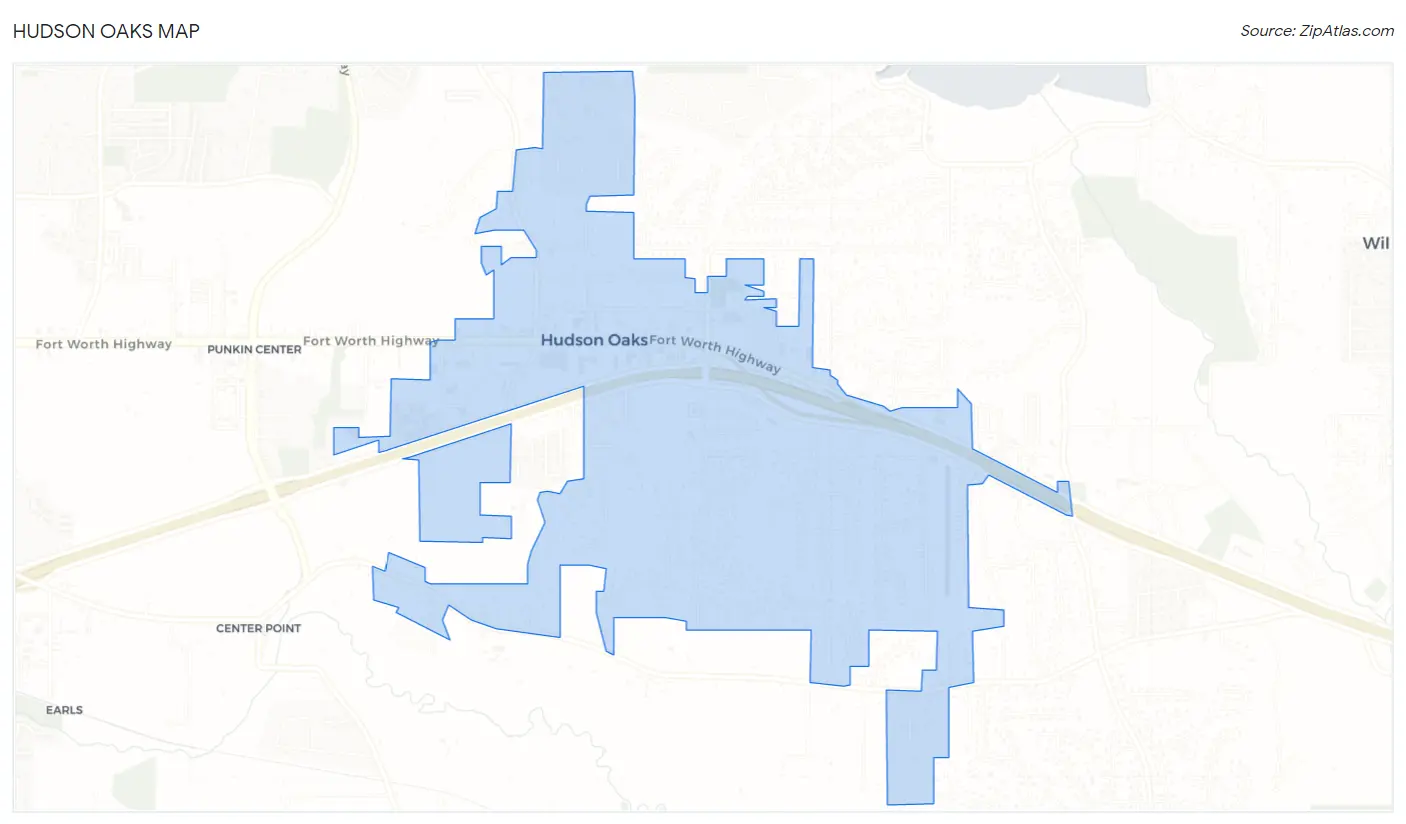
Hudson Oaks Map
Hudson Oaks Overview
2,396
TOTAL POPULATION
1,336
MALE POPULATION
1,060
FEMALE POPULATION
126.04
MALES / 100 FEMALES
79.34
FEMALES / 100 MALES
40.9
MEDIAN AGE
3.2
AVG FAMILY SIZE
2.8
AVG HOUSEHOLD SIZE
$54,041
PER CAPITA INCOME
$139,569
AVG FAMILY INCOME
$125,795
AVG HOUSEHOLD INCOME
38.7%
WAGE / INCOME GAP [ % ]
61.3¢/ $1
WAGE / INCOME GAP [ $ ]
0.37
INEQUALITY / GINI INDEX
1,187
LABOR FORCE [ PEOPLE ]
63.7%
PERCENT IN LABOR FORCE
2.6%
UNEMPLOYMENT RATE
Race in Hudson Oaks
The most populous races in Hudson Oaks are White / Caucasian (2,174 | 90.7%), Hispanic or Latino (200 | 8.4%), and Two or more Races (167 | 7.0%).
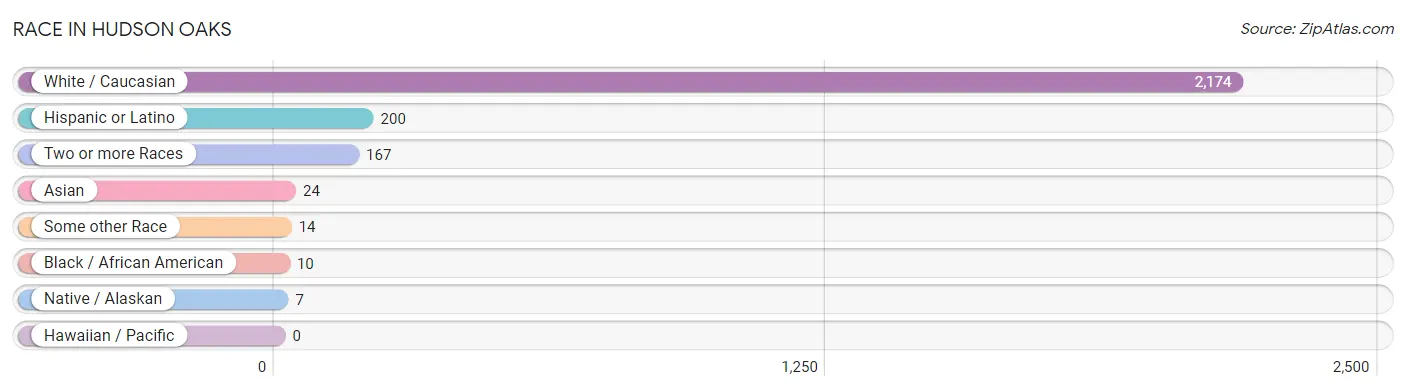
| Race | # Population | % Population |
| Asian | 24 | 1.0% |
| Black / African American | 10 | 0.4% |
| Hawaiian / Pacific | 0 | 0.0% |
| Hispanic or Latino | 200 | 8.4% |
| Native / Alaskan | 7 | 0.3% |
| White / Caucasian | 2,174 | 90.7% |
| Two or more Races | 167 | 7.0% |
| Some other Race | 14 | 0.6% |
| Total | 2,396 | 100.0% |
Ancestry in Hudson Oaks
The most populous ancestries reported in Hudson Oaks are English (545 | 22.8%), German (456 | 19.0%), Irish (265 | 11.1%), Mexican (170 | 7.1%), and American (133 | 5.6%), together accounting for 65.5% of all Hudson Oaks residents.
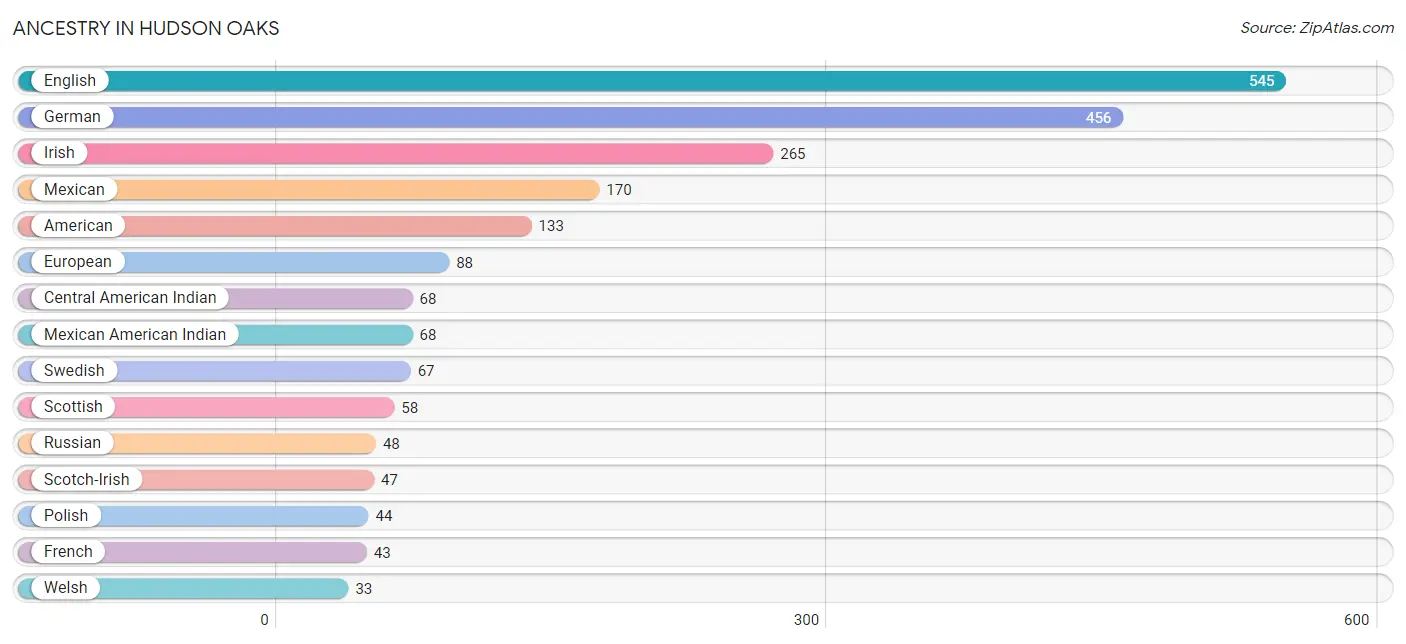
| Ancestry | # Population | % Population |
| American | 133 | 5.6% |
| Armenian | 2 | 0.1% |
| Austrian | 6 | 0.3% |
| Bhutanese | 2 | 0.1% |
| Central American Indian | 68 | 2.8% |
| Cherokee | 14 | 0.6% |
| Colombian | 4 | 0.2% |
| Danish | 26 | 1.1% |
| Dutch | 30 | 1.3% |
| Eastern European | 13 | 0.5% |
| English | 545 | 22.8% |
| European | 88 | 3.7% |
| French | 43 | 1.8% |
| French Canadian | 3 | 0.1% |
| German | 456 | 19.0% |
| Greek | 21 | 0.9% |
| Hungarian | 3 | 0.1% |
| Indian (Asian) | 10 | 0.4% |
| Iranian | 5 | 0.2% |
| Irish | 265 | 11.1% |
| Italian | 19 | 0.8% |
| Korean | 2 | 0.1% |
| Mexican | 170 | 7.1% |
| Mexican American Indian | 68 | 2.8% |
| Northern European | 13 | 0.5% |
| Norwegian | 24 | 1.0% |
| Pakistani | 12 | 0.5% |
| Polish | 44 | 1.8% |
| Pueblo | 4 | 0.2% |
| Puerto Rican | 6 | 0.3% |
| Russian | 48 | 2.0% |
| Scandinavian | 15 | 0.6% |
| Scotch-Irish | 47 | 2.0% |
| Scottish | 58 | 2.4% |
| Seminole | 10 | 0.4% |
| South American | 4 | 0.2% |
| Spaniard | 20 | 0.8% |
| Swedish | 67 | 2.8% |
| Swiss | 18 | 0.7% |
| Ukrainian | 11 | 0.5% |
| Welsh | 33 | 1.4% | View All 41 Rows |
Immigrants in Hudson Oaks
The most numerous immigrant groups reported in Hudson Oaks came from Latin America (22 | 0.9%), Central America (18 | 0.7%), Mexico (18 | 0.7%), Europe (15 | 0.6%), and Western Europe (12 | 0.5%), together accounting for 3.5% of all Hudson Oaks residents.
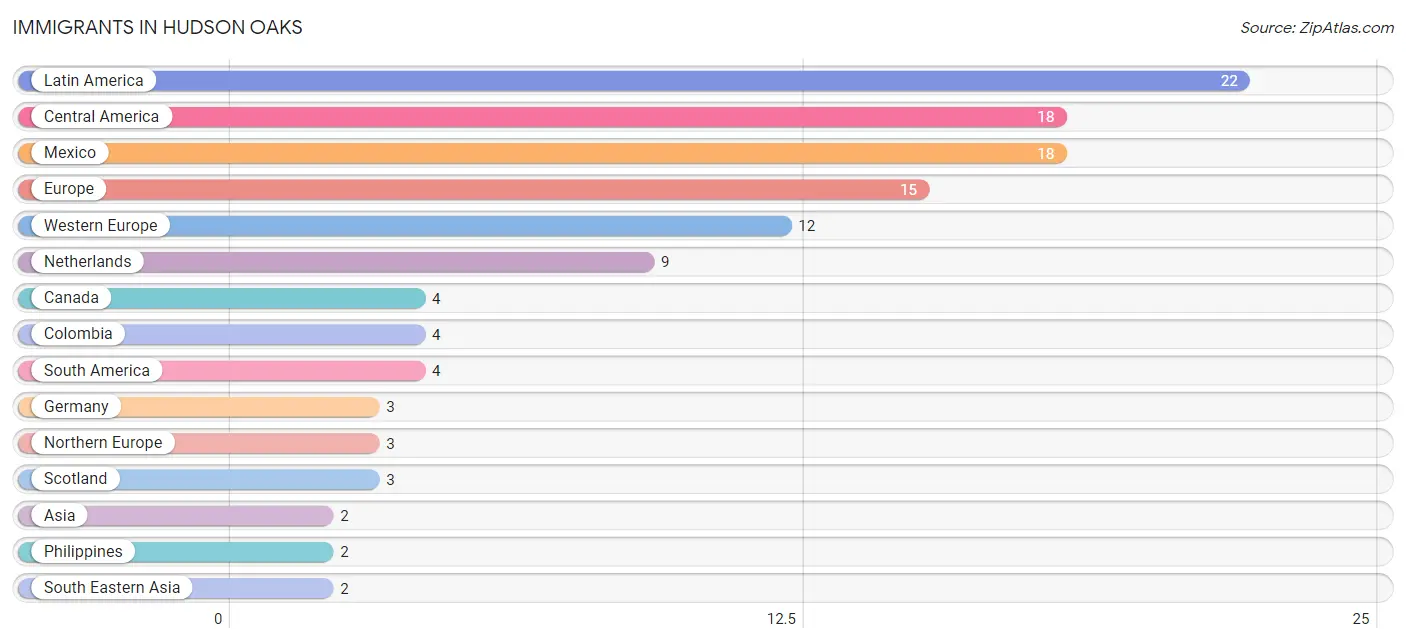
| Immigration Origin | # Population | % Population |
| Asia | 2 | 0.1% |
| Canada | 4 | 0.2% |
| Central America | 18 | 0.7% |
| Colombia | 4 | 0.2% |
| Europe | 15 | 0.6% |
| Germany | 3 | 0.1% |
| Latin America | 22 | 0.9% |
| Mexico | 18 | 0.7% |
| Netherlands | 9 | 0.4% |
| Northern Europe | 3 | 0.1% |
| Philippines | 2 | 0.1% |
| Scotland | 3 | 0.1% |
| South America | 4 | 0.2% |
| South Eastern Asia | 2 | 0.1% |
| Western Europe | 12 | 0.5% | View All 15 Rows |
Sex and Age in Hudson Oaks
Sex and Age in Hudson Oaks
The most populous age groups in Hudson Oaks are 60 to 64 Years (141 | 10.5%) for men and 35 to 39 Years (146 | 13.8%) for women.
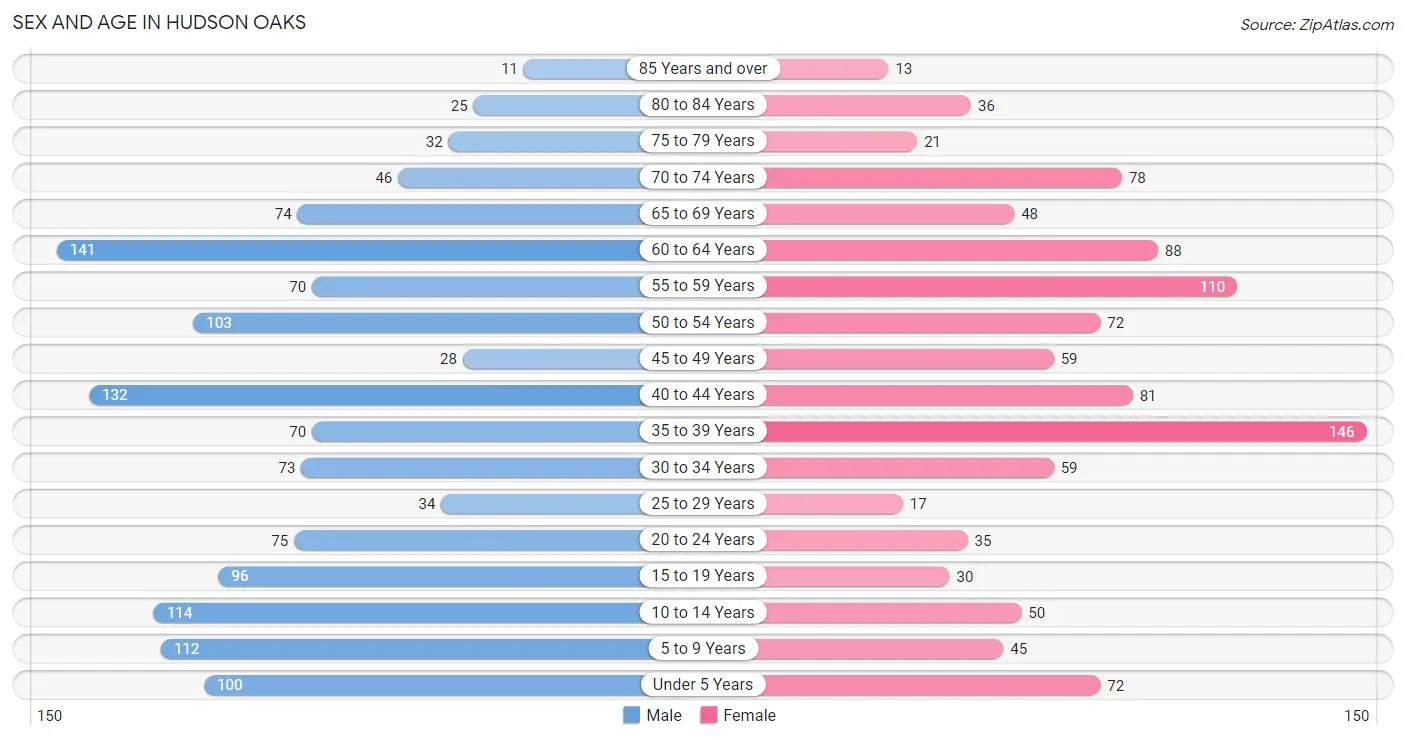
| Age Bracket | Male | Female |
| Under 5 Years | 100 (7.5%) | 72 (6.8%) |
| 5 to 9 Years | 112 (8.4%) | 45 (4.3%) |
| 10 to 14 Years | 114 (8.5%) | 50 (4.7%) |
| 15 to 19 Years | 96 (7.2%) | 30 (2.8%) |
| 20 to 24 Years | 75 (5.6%) | 35 (3.3%) |
| 25 to 29 Years | 34 (2.5%) | 17 (1.6%) |
| 30 to 34 Years | 73 (5.5%) | 59 (5.6%) |
| 35 to 39 Years | 70 (5.2%) | 146 (13.8%) |
| 40 to 44 Years | 132 (9.9%) | 81 (7.6%) |
| 45 to 49 Years | 28 (2.1%) | 59 (5.6%) |
| 50 to 54 Years | 103 (7.7%) | 72 (6.8%) |
| 55 to 59 Years | 70 (5.2%) | 110 (10.4%) |
| 60 to 64 Years | 141 (10.5%) | 88 (8.3%) |
| 65 to 69 Years | 74 (5.5%) | 48 (4.5%) |
| 70 to 74 Years | 46 (3.4%) | 78 (7.4%) |
| 75 to 79 Years | 32 (2.4%) | 21 (2.0%) |
| 80 to 84 Years | 25 (1.9%) | 36 (3.4%) |
| 85 Years and over | 11 (0.8%) | 13 (1.2%) |
| Total | 1,336 (100.0%) | 1,060 (100.0%) |
Families and Households in Hudson Oaks
Median Family Size in Hudson Oaks
The median family size in Hudson Oaks is 3.18 persons per family, with single female/mother families (41 | 6.0%) accounting for the largest median family size of 4 persons per family. On the other hand, single male/father families (14 | 2.1%) represent the smallest median family size with 3.00 persons per family.
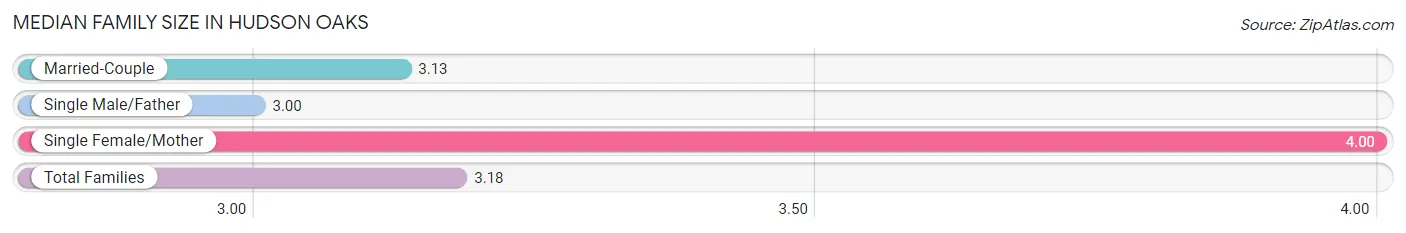
| Family Type | # Families | Family Size |
| Married-Couple | 627 (91.9%) | 3.13 |
| Single Male/Father | 14 (2.1%) | 3.00 |
| Single Female/Mother | 41 (6.0%) | 4.00 |
| Total Families | 682 (100.0%) | 3.18 |
Median Household Size in Hudson Oaks
The median household size in Hudson Oaks is 2.76 persons per household, with single female/mother households (41 | 4.7%) accounting for the largest median household size of 4.12 persons per household. non-family households (187 | 21.5%) represent the smallest median household size with 1.18 persons per household.
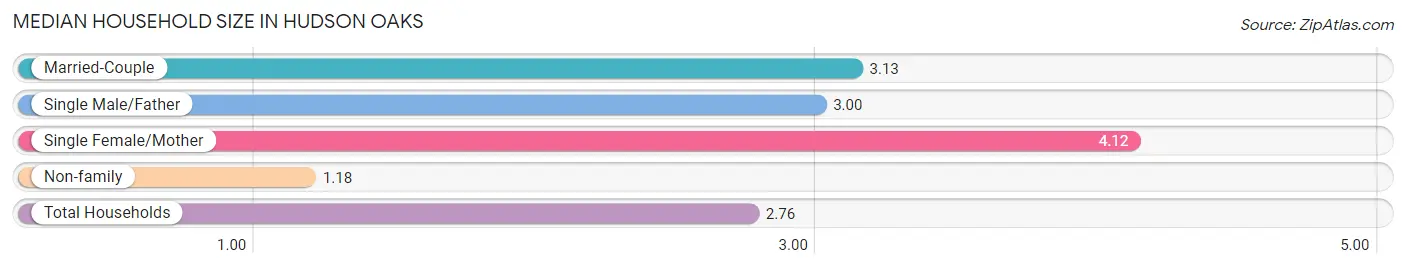
| Household Type | # Households | Household Size |
| Married-Couple | 627 (72.2%) | 3.13 |
| Single Male/Father | 14 (1.6%) | 3.00 |
| Single Female/Mother | 41 (4.7%) | 4.12 |
| Non-family | 187 (21.5%) | 1.18 |
| Total Households | 869 (100.0%) | 2.76 |
Household Size by Marriage Status in Hudson Oaks
Out of a total of 869 households in Hudson Oaks, 682 (78.5%) are family households, while 187 (21.5%) are nonfamily households. The most numerous type of family households are 2-person households, comprising 345, and the most common type of nonfamily households are 1-person households, comprising 157.
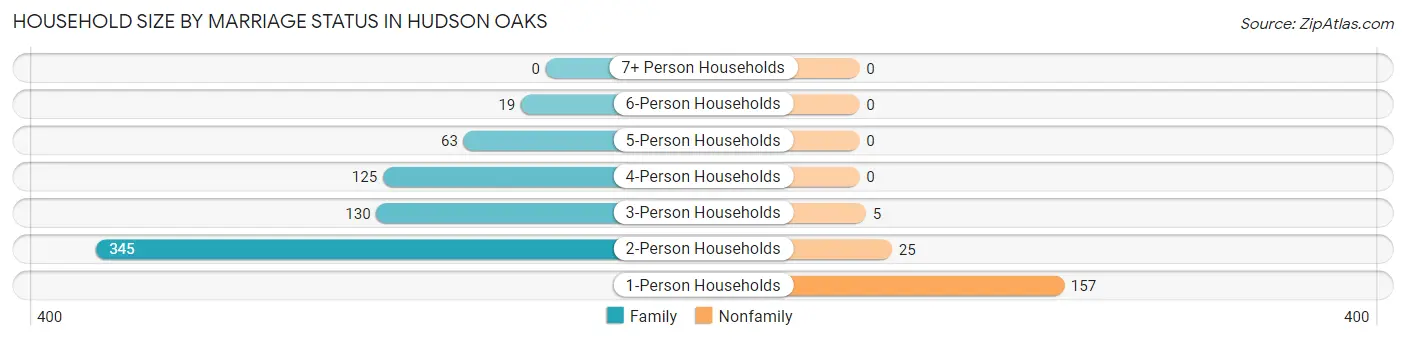
| Household Size | Family Households | Nonfamily Households |
| 1-Person Households | - | 157 (18.1%) |
| 2-Person Households | 345 (39.7%) | 25 (2.9%) |
| 3-Person Households | 130 (15.0%) | 5 (0.6%) |
| 4-Person Households | 125 (14.4%) | 0 (0.0%) |
| 5-Person Households | 63 (7.2%) | 0 (0.0%) |
| 6-Person Households | 19 (2.2%) | 0 (0.0%) |
| 7+ Person Households | 0 (0.0%) | 0 (0.0%) |
| Total | 682 (78.5%) | 187 (21.5%) |
Female Fertility in Hudson Oaks
Fertility by Age in Hudson Oaks
Average fertility rate in Hudson Oaks is 86.0 births per 1,000 women. Women in the age bracket of 20 to 34 years have the highest fertility rate with 180.0 births per 1,000 women. Women in the age bracket of 20 to 34 years acount for 52.6% of all women with births.
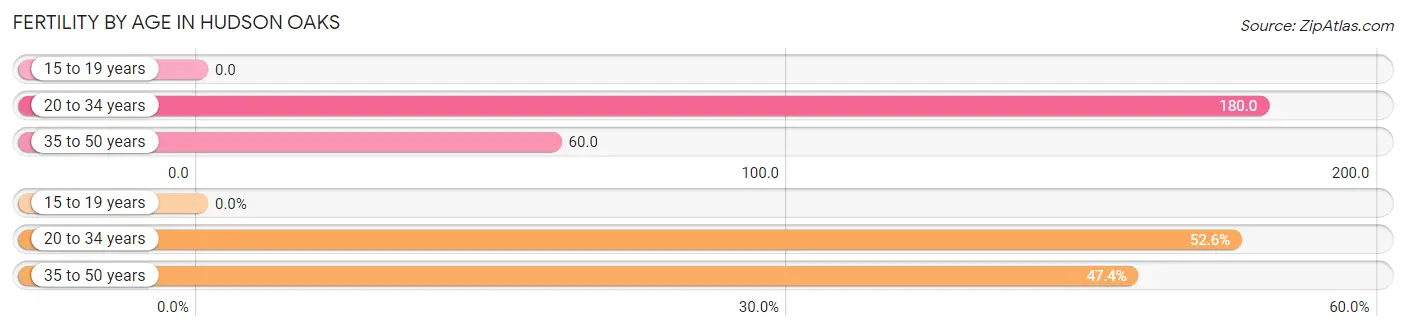
| Age Bracket | Women with Births | Births / 1,000 Women |
| 15 to 19 years | 0 (0.0%) | 0.0 |
| 20 to 34 years | 20 (52.6%) | 180.0 |
| 35 to 50 years | 18 (47.4%) | 60.0 |
| Total | 38 (100.0%) | 86.0 |
Fertility by Age by Marriage Status in Hudson Oaks
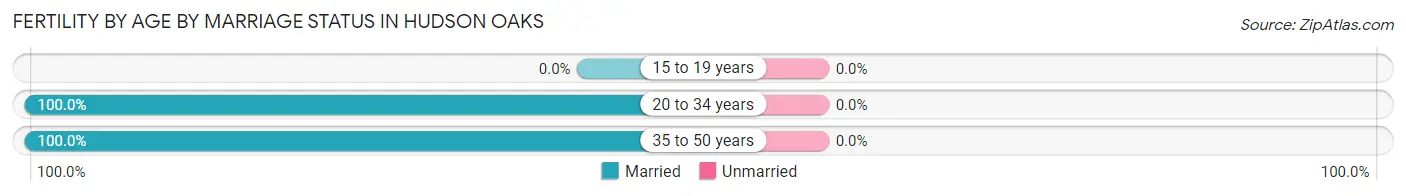
| Age Bracket | Married | Unmarried |
| 15 to 19 years | 0 (0.0%) | 0 (0.0%) |
| 20 to 34 years | 20 (100.0%) | 0 (0.0%) |
| 35 to 50 years | 18 (100.0%) | 0 (0.0%) |
| Total | 38 (100.0%) | 0 (0.0%) |
Fertility by Education in Hudson Oaks
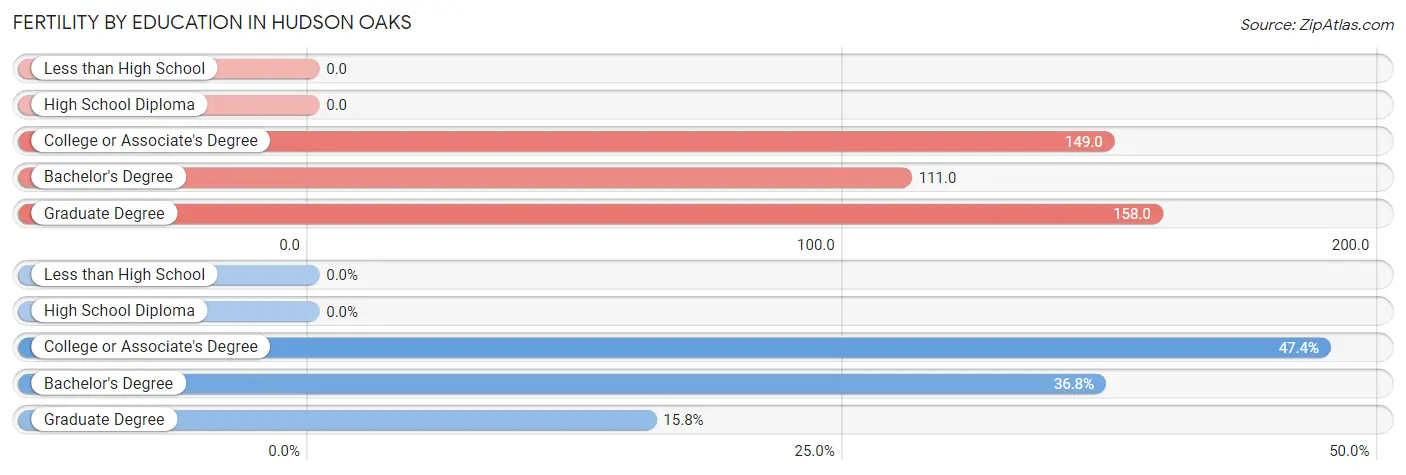
| Educational Attainment | Women with Births | Births / 1,000 Women |
| Less than High School | 0 (0.0%) | 0.0 |
| High School Diploma | 0 (0.0%) | 0.0 |
| College or Associate's Degree | 18 (47.4%) | 149.0 |
| Bachelor's Degree | 14 (36.8%) | 111.0 |
| Graduate Degree | 6 (15.8%) | 158.0 |
| Total | 38 (100.0%) | 86.0 |
Fertility by Education by Marriage Status in Hudson Oaks
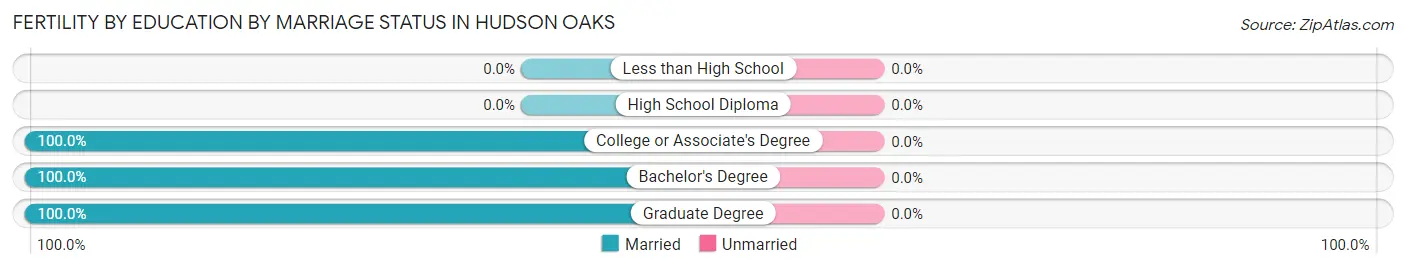
| Educational Attainment | Married | Unmarried |
| Less than High School | 0 (0.0%) | 0 (0.0%) |
| High School Diploma | 0 (0.0%) | 0 (0.0%) |
| College or Associate's Degree | 18 (100.0%) | 0 (0.0%) |
| Bachelor's Degree | 14 (100.0%) | 0 (0.0%) |
| Graduate Degree | 6 (100.0%) | 0 (0.0%) |
| Total | 38 (100.0%) | 0 (0.0%) |
Income in Hudson Oaks
Income Overview in Hudson Oaks
Per Capita Income in Hudson Oaks is $54,041, while median incomes of families and households are $139,569 and $125,795 respectively.
| Characteristic | Number | Measure |
| Per Capita Income | 2,396 | $54,041 |
| Median Family Income | 682 | $139,569 |
| Mean Family Income | 682 | $163,288 |
| Median Household Income | 869 | $125,795 |
| Mean Household Income | 869 | $145,761 |
| Income Deficit | 682 | $0 |
| Wage / Income Gap (%) | 2,396 | 38.70% |
| Wage / Income Gap ($) | 2,396 | 61.30¢ per $1 |
| Gini / Inequality Index | 2,396 | 0.37 |
Earnings by Sex in Hudson Oaks
Average Earnings in Hudson Oaks are $67,841, $96,786 for men and $59,329 for women, a difference of 38.7%.
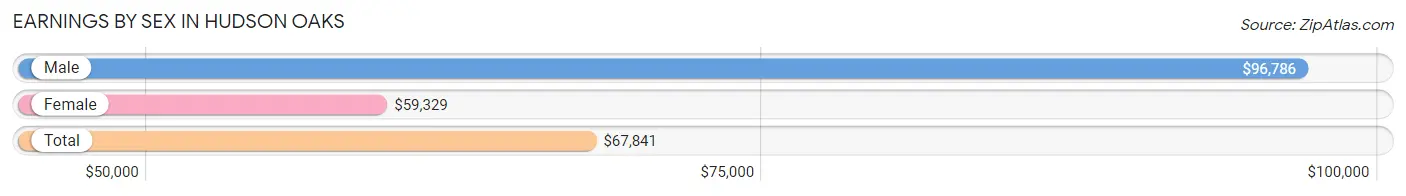
| Sex | Number | Average Earnings |
| Male | 742 (60.7%) | $96,786 |
| Female | 480 (39.3%) | $59,329 |
| Total | 1,222 (100.0%) | $67,841 |
Earnings by Sex by Income Bracket in Hudson Oaks
The most common earnings brackets in Hudson Oaks are $100,000+ for men (367 | 49.5%) and $100,000+ for women (100 | 20.8%).
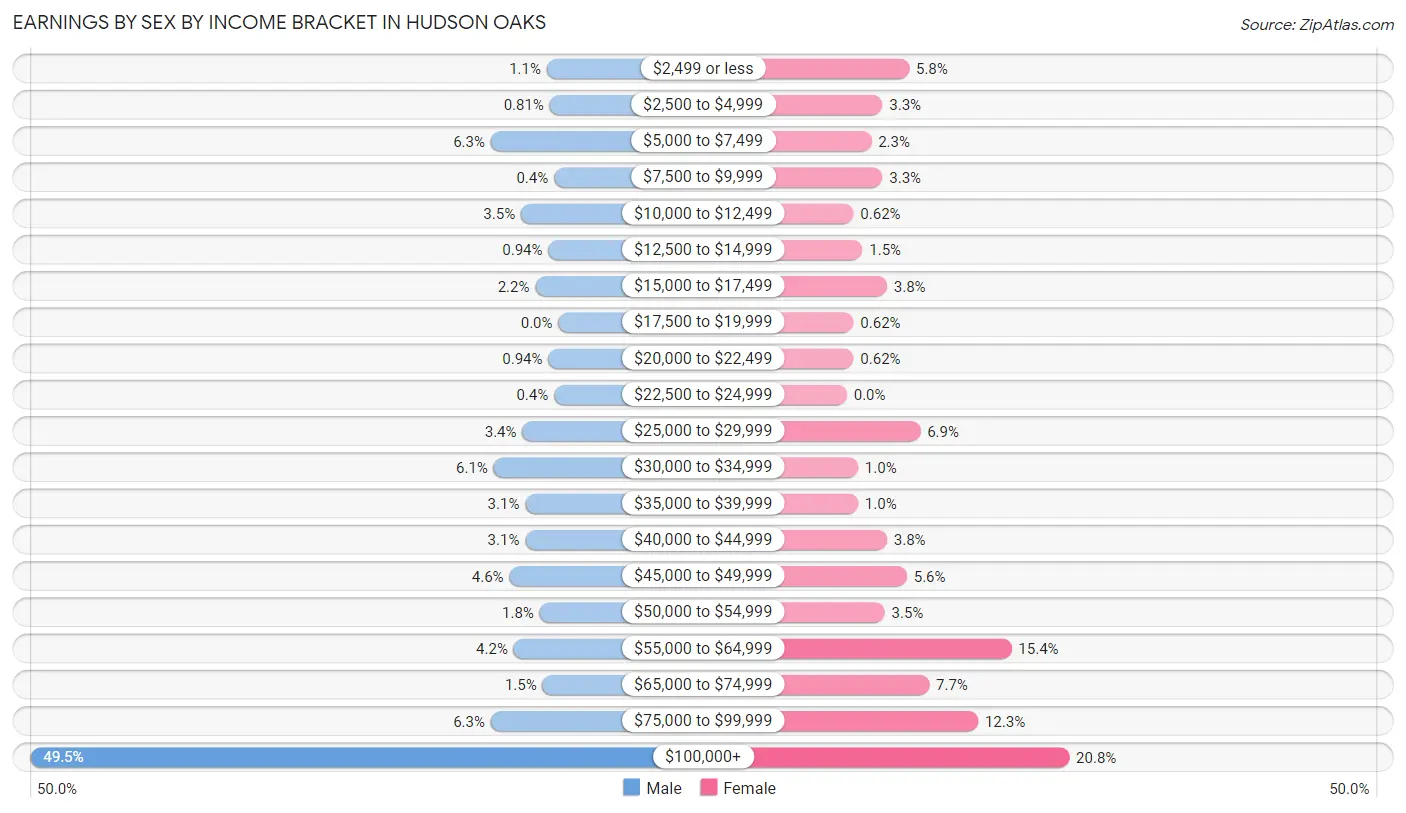
| Income | Male | Female |
| $2,499 or less | 8 (1.1%) | 28 (5.8%) |
| $2,500 to $4,999 | 6 (0.8%) | 16 (3.3%) |
| $5,000 to $7,499 | 47 (6.3%) | 11 (2.3%) |
| $7,500 to $9,999 | 3 (0.4%) | 16 (3.3%) |
| $10,000 to $12,499 | 26 (3.5%) | 3 (0.6%) |
| $12,500 to $14,999 | 7 (0.9%) | 7 (1.5%) |
| $15,000 to $17,499 | 16 (2.2%) | 18 (3.7%) |
| $17,500 to $19,999 | 0 (0.0%) | 3 (0.6%) |
| $20,000 to $22,499 | 7 (0.9%) | 3 (0.6%) |
| $22,500 to $24,999 | 3 (0.4%) | 0 (0.0%) |
| $25,000 to $29,999 | 25 (3.4%) | 33 (6.9%) |
| $30,000 to $34,999 | 45 (6.1%) | 5 (1.0%) |
| $35,000 to $39,999 | 23 (3.1%) | 5 (1.0%) |
| $40,000 to $44,999 | 23 (3.1%) | 18 (3.7%) |
| $45,000 to $49,999 | 34 (4.6%) | 27 (5.6%) |
| $50,000 to $54,999 | 13 (1.8%) | 17 (3.5%) |
| $55,000 to $64,999 | 31 (4.2%) | 74 (15.4%) |
| $65,000 to $74,999 | 11 (1.5%) | 37 (7.7%) |
| $75,000 to $99,999 | 47 (6.3%) | 59 (12.3%) |
| $100,000+ | 367 (49.5%) | 100 (20.8%) |
| Total | 742 (100.0%) | 480 (100.0%) |
Earnings by Sex by Educational Attainment in Hudson Oaks
Average earnings in Hudson Oaks are $112,500 for men and $61,250 for women, a difference of 45.6%. Men with an educational attainment of graduate degree enjoy the highest average annual earnings of $128,438, while those with college or associate's degree education earn the least with $59,545. Women with an educational attainment of graduate degree earn the most with the average annual earnings of $71,250, while those with high school diploma education have the smallest earnings of $25,909.
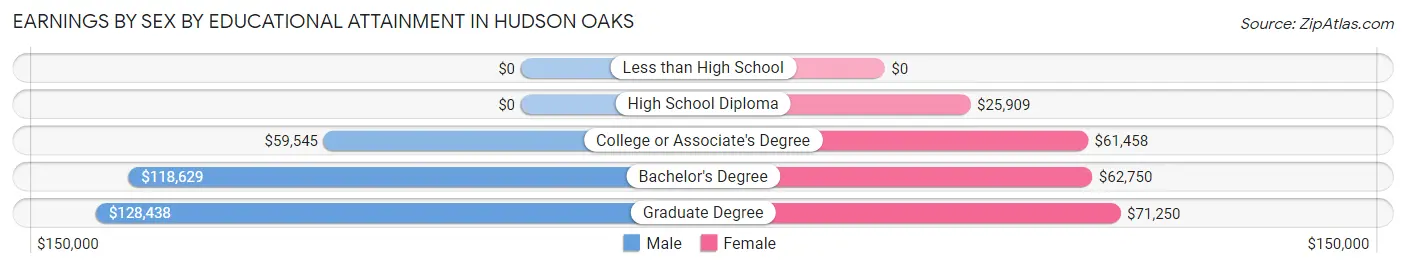
| Educational Attainment | Male Income | Female Income |
| Less than High School | - | - |
| High School Diploma | - | - |
| College or Associate's Degree | $59,545 | $61,458 |
| Bachelor's Degree | $118,629 | $62,750 |
| Graduate Degree | $128,438 | $71,250 |
| Total | $112,500 | $61,250 |
Family Income in Hudson Oaks
Family Income Brackets in Hudson Oaks
According to the Hudson Oaks family income data, there are 239 families falling into the $200,000+ income range, which is the most common income bracket and makes up 35.0% of all families.
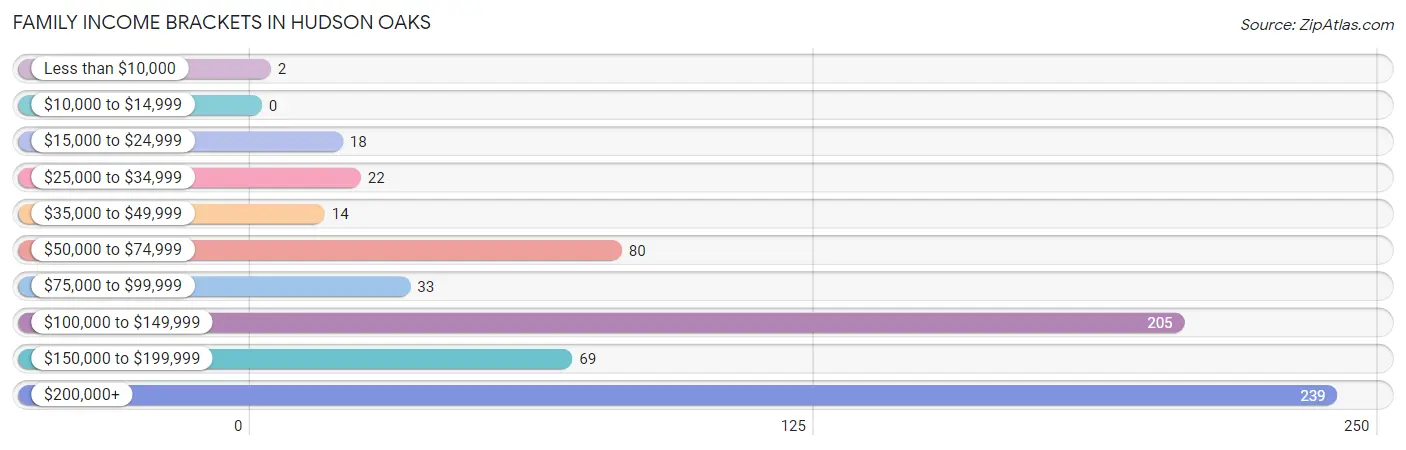
| Income Bracket | # Families | % Families |
| Less than $10,000 | 2 | 0.3% |
| $10,000 to $14,999 | 0 | 0.0% |
| $15,000 to $24,999 | 18 | 2.6% |
| $25,000 to $34,999 | 22 | 3.2% |
| $35,000 to $49,999 | 14 | 2.1% |
| $50,000 to $74,999 | 80 | 11.7% |
| $75,000 to $99,999 | 33 | 4.8% |
| $100,000 to $149,999 | 205 | 30.1% |
| $150,000 to $199,999 | 69 | 10.1% |
| $200,000+ | 239 | 35.0% |
Family Income by Famaliy Size in Hudson Oaks
5-person families (63 | 9.2%) account for the highest median family income in Hudson Oaks with $222,847 per family, while 2-person families (345 | 50.6%) have the highest median income of $59,140 per family member.
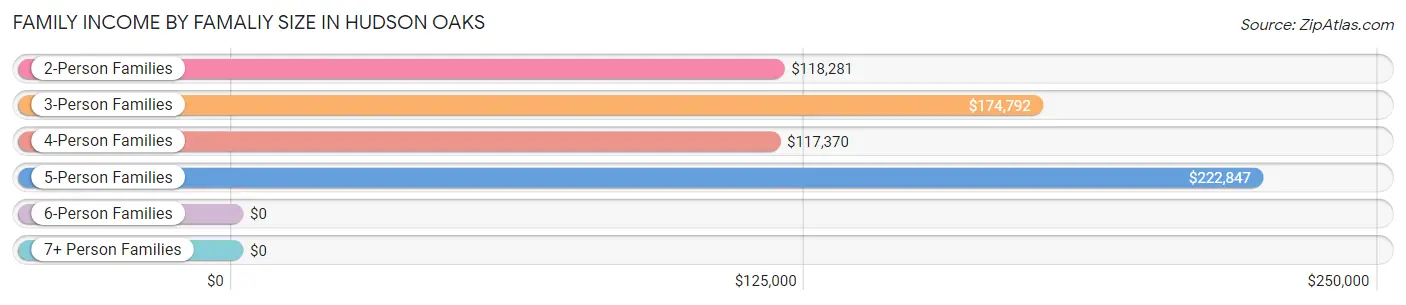
| Income Bracket | # Families | Median Income |
| 2-Person Families | 345 (50.6%) | $118,281 |
| 3-Person Families | 133 (19.5%) | $174,792 |
| 4-Person Families | 125 (18.3%) | $117,370 |
| 5-Person Families | 63 (9.2%) | $222,847 |
| 6-Person Families | 16 (2.4%) | $0 |
| 7+ Person Families | 0 (0.0%) | $0 |
| Total | 682 (100.0%) | $139,569 |
Family Income by Number of Earners in Hudson Oaks
The median family income in Hudson Oaks is $139,569, with families comprising 2 earners (295) having the highest median family income of $218,819, while families with no earners (125) have the lowest median family income of $76,875, accounting for 43.3% and 18.3% of families, respectively.
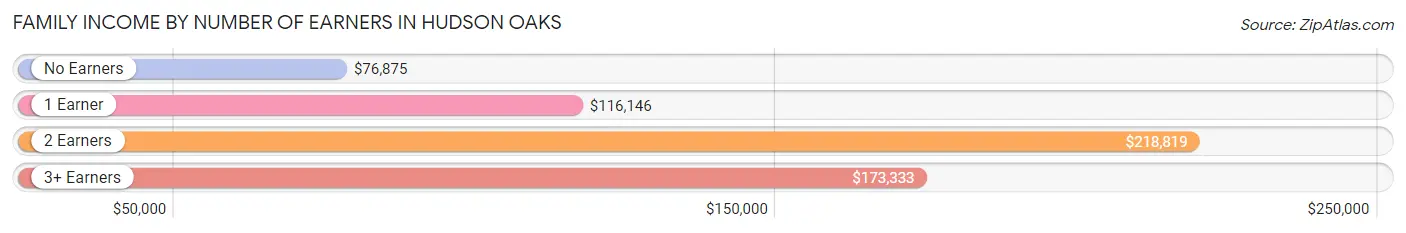
| Number of Earners | # Families | Median Income |
| No Earners | 125 (18.3%) | $76,875 |
| 1 Earner | 194 (28.4%) | $116,146 |
| 2 Earners | 295 (43.3%) | $218,819 |
| 3+ Earners | 68 (10.0%) | $173,333 |
| Total | 682 (100.0%) | $139,569 |
Household Income in Hudson Oaks
Household Income Brackets in Hudson Oaks
With 255 households falling in the category, the $200,000+ income range is the most frequent in Hudson Oaks, accounting for 29.3% of all households. In contrast, only 11 households (1.3%) fall into the less than $10,000 income bracket, making it the least populous group.
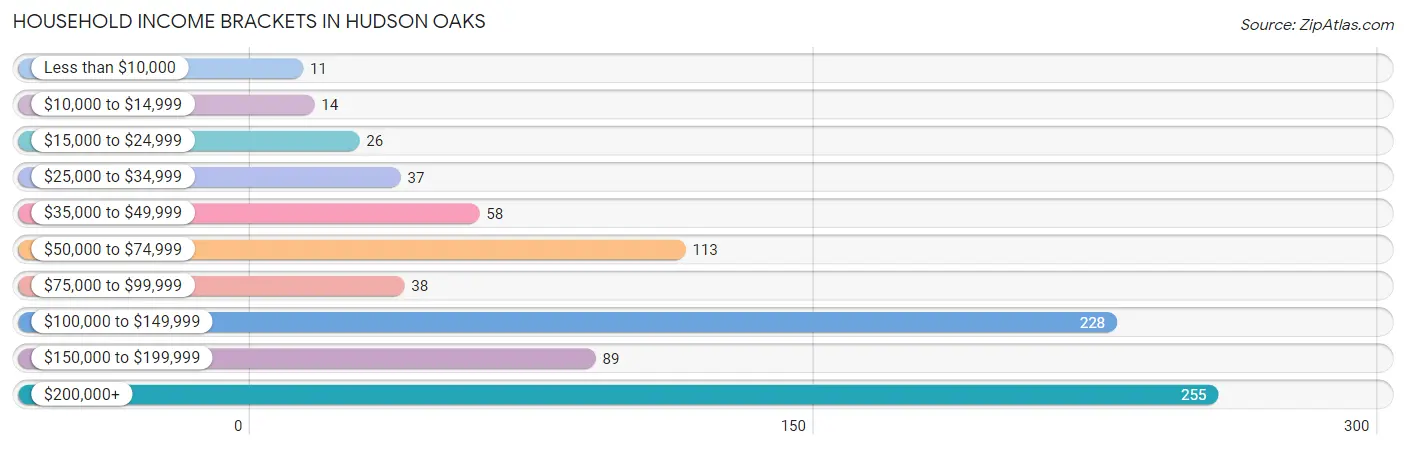
| Income Bracket | # Households | % Households |
| Less than $10,000 | 11 | 1.3% |
| $10,000 to $14,999 | 14 | 1.6% |
| $15,000 to $24,999 | 26 | 3.0% |
| $25,000 to $34,999 | 37 | 4.3% |
| $35,000 to $49,999 | 58 | 6.7% |
| $50,000 to $74,999 | 113 | 13.0% |
| $75,000 to $99,999 | 38 | 4.4% |
| $100,000 to $149,999 | 228 | 26.2% |
| $150,000 to $199,999 | 89 | 10.2% |
| $200,000+ | 255 | 29.3% |
Household Income by Householder Age in Hudson Oaks
The median household income in Hudson Oaks is $125,795, with the highest median household income of $168,500 found in the 25 to 44 years age bracket for the primary householder. A total of 234 households (26.9%) fall into this category. Meanwhile, the 15 to 24 years age bracket for the primary householder has the lowest median household income of $0, with 29 households (3.3%) in this group.
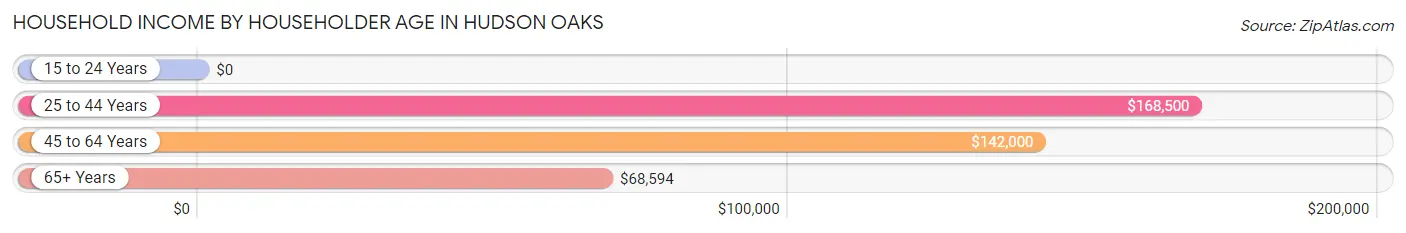
| Income Bracket | # Households | Median Income |
| 15 to 24 Years | 29 (3.3%) | $0 |
| 25 to 44 Years | 234 (26.9%) | $168,500 |
| 45 to 64 Years | 390 (44.9%) | $142,000 |
| 65+ Years | 216 (24.9%) | $68,594 |
| Total | 869 (100.0%) | $125,795 |
Poverty in Hudson Oaks
Income Below Poverty by Sex and Age in Hudson Oaks
With 2.8% poverty level for males and 3.4% for females among the residents of Hudson Oaks, 25 to 34 year old males and 6 to 11 year old females are the most vulnerable to poverty, with 8 males (7.5%) and 8 females (12.5%) in their respective age groups living below the poverty level.
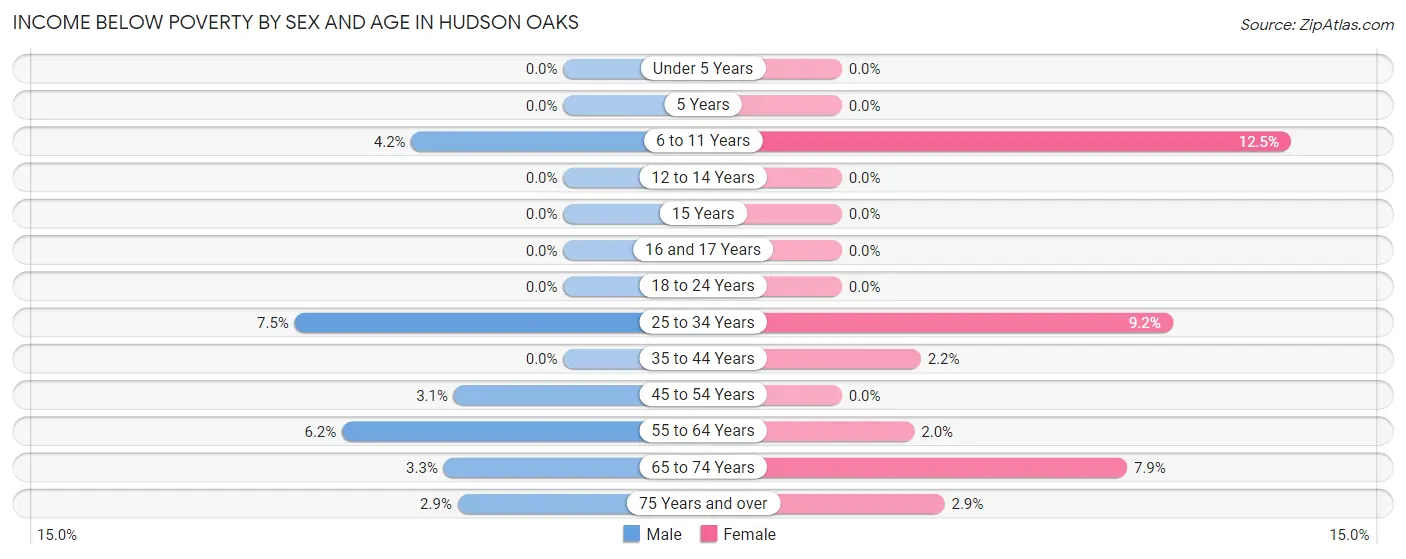
| Age Bracket | Male | Female |
| Under 5 Years | 0 (0.0%) | 0 (0.0%) |
| 5 Years | 0 (0.0%) | 0 (0.0%) |
| 6 to 11 Years | 6 (4.2%) | 8 (12.5%) |
| 12 to 14 Years | 0 (0.0%) | 0 (0.0%) |
| 15 Years | 0 (0.0%) | 0 (0.0%) |
| 16 and 17 Years | 0 (0.0%) | 0 (0.0%) |
| 18 to 24 Years | 0 (0.0%) | 0 (0.0%) |
| 25 to 34 Years | 8 (7.5%) | 7 (9.2%) |
| 35 to 44 Years | 0 (0.0%) | 5 (2.2%) |
| 45 to 54 Years | 4 (3.0%) | 0 (0.0%) |
| 55 to 64 Years | 13 (6.2%) | 4 (2.0%) |
| 65 to 74 Years | 4 (3.3%) | 10 (7.9%) |
| 75 Years and over | 2 (2.9%) | 2 (2.9%) |
| Total | 37 (2.8%) | 36 (3.4%) |
Income Above Poverty by Sex and Age in Hudson Oaks
According to the poverty statistics in Hudson Oaks, males aged under 5 years and females aged under 5 years are the age groups that are most secure financially, with 100.0% of males and 100.0% of females in these age groups living above the poverty line.
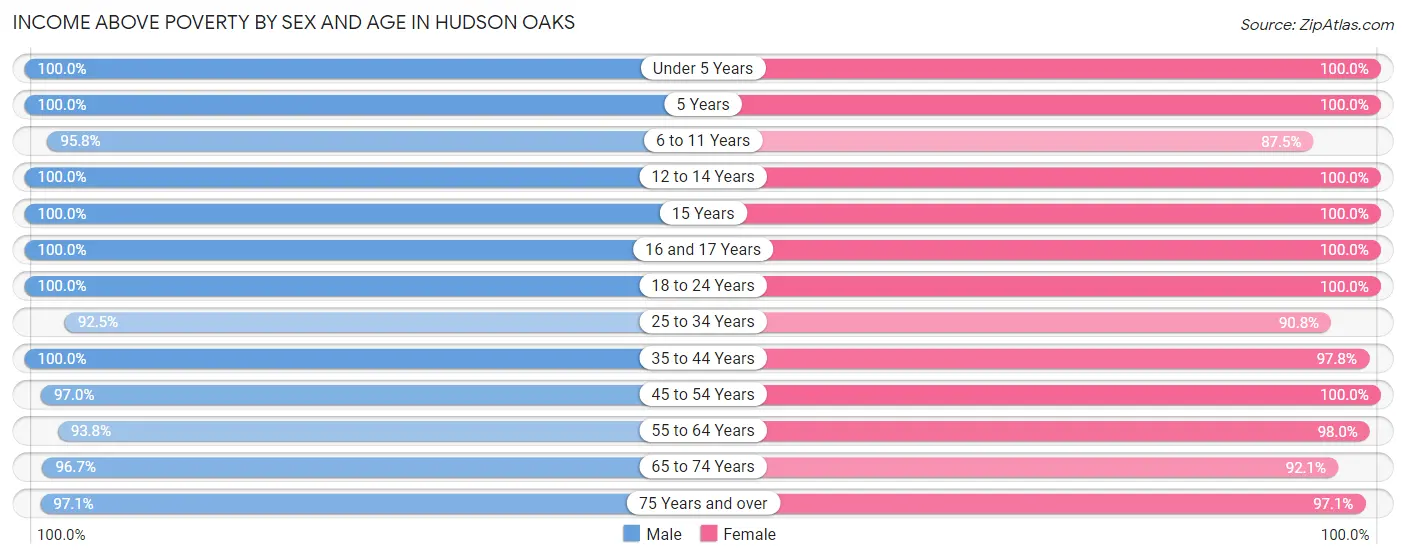
| Age Bracket | Male | Female |
| Under 5 Years | 100 (100.0%) | 72 (100.0%) |
| 5 Years | 18 (100.0%) | 6 (100.0%) |
| 6 to 11 Years | 136 (95.8%) | 56 (87.5%) |
| 12 to 14 Years | 66 (100.0%) | 25 (100.0%) |
| 15 Years | 35 (100.0%) | 5 (100.0%) |
| 16 and 17 Years | 29 (100.0%) | 19 (100.0%) |
| 18 to 24 Years | 107 (100.0%) | 41 (100.0%) |
| 25 to 34 Years | 99 (92.5%) | 69 (90.8%) |
| 35 to 44 Years | 202 (100.0%) | 222 (97.8%) |
| 45 to 54 Years | 127 (97.0%) | 131 (100.0%) |
| 55 to 64 Years | 198 (93.8%) | 194 (98.0%) |
| 65 to 74 Years | 116 (96.7%) | 116 (92.1%) |
| 75 Years and over | 66 (97.1%) | 68 (97.1%) |
| Total | 1,299 (97.2%) | 1,024 (96.6%) |
Income Below Poverty Among Married-Couple Families in Hudson Oaks
The poverty statistics for married-couple families in Hudson Oaks show that 1.4% or 9 of the total 627 families live below the poverty line. Families with 1 or 2 children have the highest poverty rate of 4.3%, comprising of 7 families. On the other hand, families with 3 or 4 children have the lowest poverty rate of 0.0%, which includes 0 families.
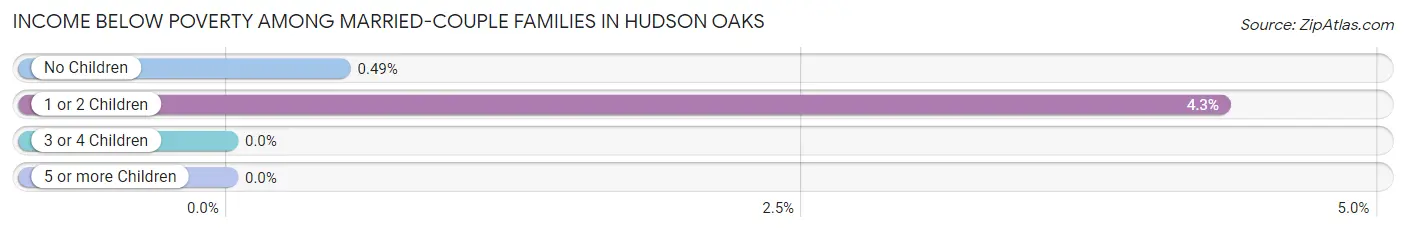
| Children | Above Poverty | Below Poverty |
| No Children | 405 (99.5%) | 2 (0.5%) |
| 1 or 2 Children | 155 (95.7%) | 7 (4.3%) |
| 3 or 4 Children | 58 (100.0%) | 0 (0.0%) |
| 5 or more Children | 0 (0.0%) | 0 (0.0%) |
| Total | 618 (98.6%) | 9 (1.4%) |
Income Below Poverty Among Single-Parent Households in Hudson Oaks
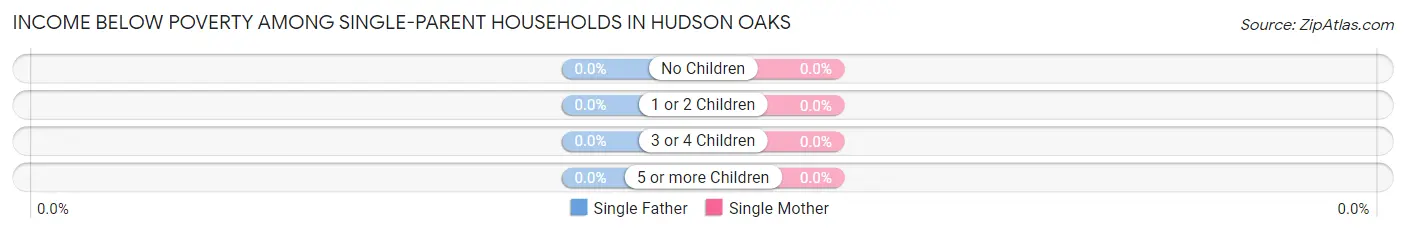
| Children | Single Father | Single Mother |
| No Children | 0 (0.0%) | 0 (0.0%) |
| 1 or 2 Children | 0 (0.0%) | 0 (0.0%) |
| 3 or 4 Children | 0 (0.0%) | 0 (0.0%) |
| 5 or more Children | 0 (0.0%) | 0 (0.0%) |
| Total | 0 (0.0%) | 0 (0.0%) |
Income Below Poverty Among Married-Couple vs Single-Parent Households in Hudson Oaks
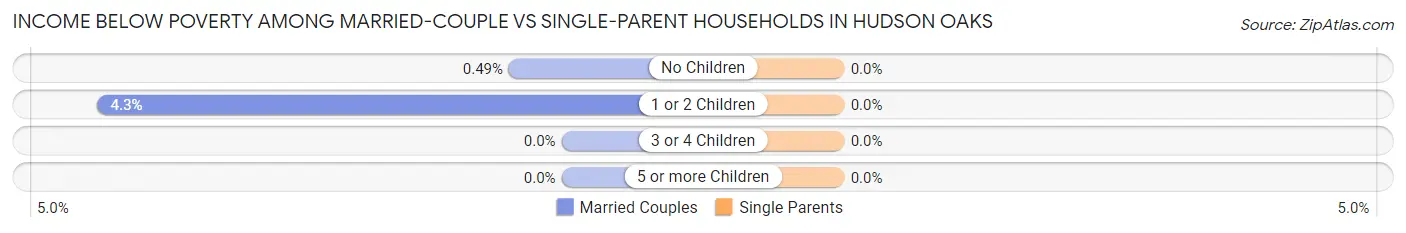
| Children | Married-Couple Families | Single-Parent Households |
| No Children | 2 (0.5%) | 0 (0.0%) |
| 1 or 2 Children | 7 (4.3%) | 0 (0.0%) |
| 3 or 4 Children | 0 (0.0%) | 0 (0.0%) |
| 5 or more Children | 0 (0.0%) | 0 (0.0%) |
| Total | 9 (1.4%) | 0 (0.0%) |
Employment Characteristics in Hudson Oaks
Employment by Class of Employer in Hudson Oaks
Among the 1,128 employed individuals in Hudson Oaks, private company employees (772 | 68.4%), local government employees (129 | 11.4%), and not-for-profit organizations (86 | 7.6%) make up the most common classes of employment.
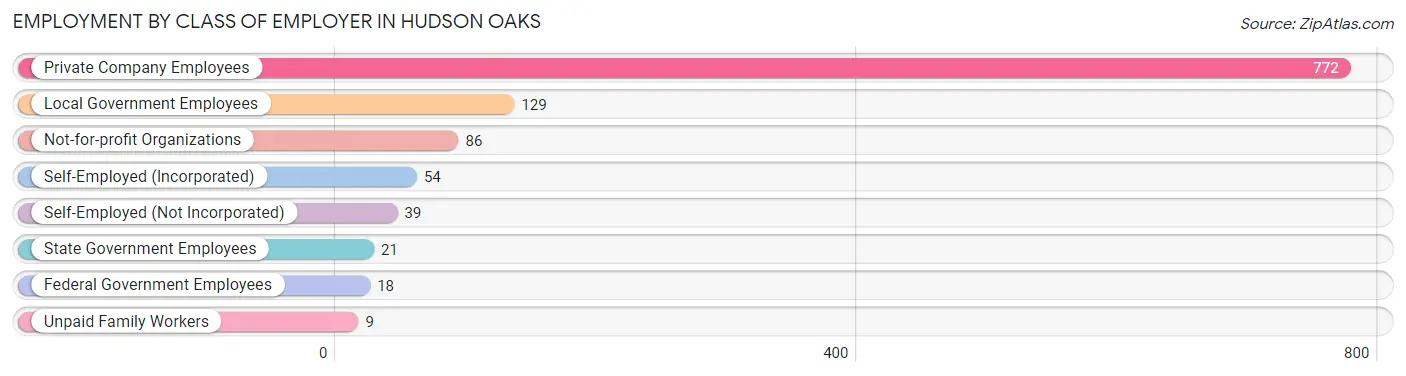
| Employer Class | # Employees | % Employees |
| Private Company Employees | 772 | 68.4% |
| Self-Employed (Incorporated) | 54 | 4.8% |
| Self-Employed (Not Incorporated) | 39 | 3.5% |
| Not-for-profit Organizations | 86 | 7.6% |
| Local Government Employees | 129 | 11.4% |
| State Government Employees | 21 | 1.9% |
| Federal Government Employees | 18 | 1.6% |
| Unpaid Family Workers | 9 | 0.8% |
| Total | 1,128 | 100.0% |
Employment Status by Age in Hudson Oaks
According to the labor force statistics for Hudson Oaks, out of the total population over 16 years of age (1,863), 63.7% or 1,187 individuals are in the labor force, with 2.6% or 31 of them unemployed. The age group with the highest labor force participation rate is 20 to 24 years, with 90.9% or 100 individuals in the labor force. Within the labor force, the 16 to 19 years age range has the highest percentage of unemployed individuals, with 35.6% or 16 of them being unemployed.
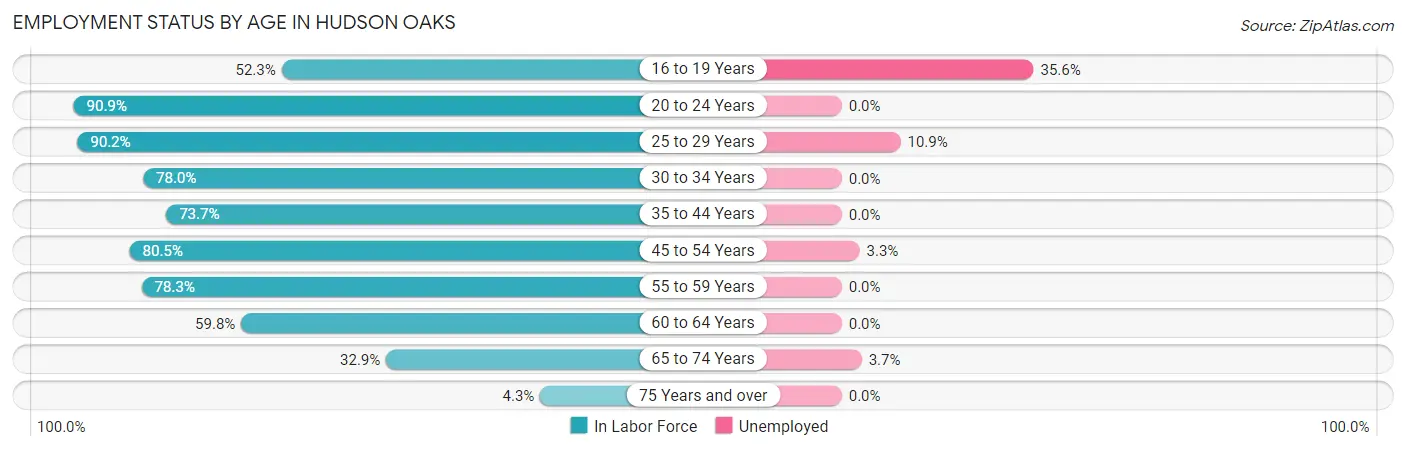
| Age Bracket | In Labor Force | Unemployed |
| 16 to 19 Years | 45 (52.3%) | 16 (35.6%) |
| 20 to 24 Years | 100 (90.9%) | 0 (0.0%) |
| 25 to 29 Years | 46 (90.2%) | 5 (10.9%) |
| 30 to 34 Years | 103 (78.0%) | 0 (0.0%) |
| 35 to 44 Years | 316 (73.7%) | 0 (0.0%) |
| 45 to 54 Years | 211 (80.5%) | 7 (3.3%) |
| 55 to 59 Years | 141 (78.3%) | 0 (0.0%) |
| 60 to 64 Years | 137 (59.8%) | 0 (0.0%) |
| 65 to 74 Years | 81 (32.9%) | 3 (3.7%) |
| 75 Years and over | 6 (4.3%) | 0 (0.0%) |
| Total | 1,187 (63.7%) | 31 (2.6%) |
Employment Status by Educational Attainment in Hudson Oaks
According to labor force statistics for Hudson Oaks, 74.4% of individuals (955) out of the total population between 25 and 64 years of age (1,283) are in the labor force, with 1.3% or 12 of them being unemployed. The group with the highest labor force participation rate are those with the educational attainment of bachelor's degree or higher, with 86.3% or 541 individuals in the labor force. Within the labor force, individuals with high school diploma education have the highest percentage of unemployment, with 10.0% or 12 of them being unemployed.
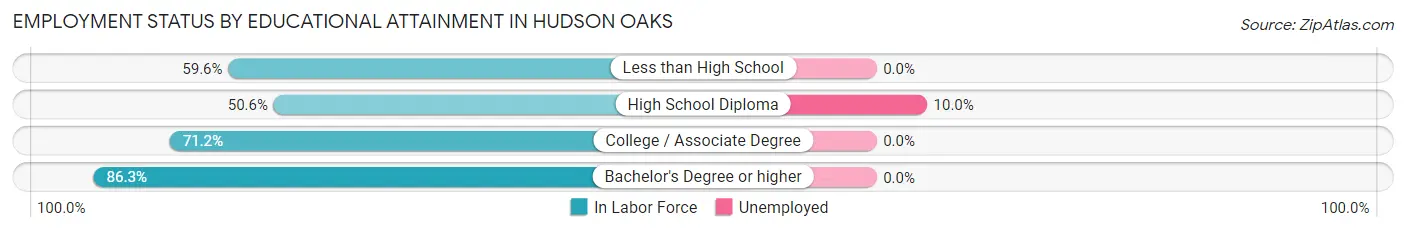
| Educational Attainment | In Labor Force | Unemployed |
| Less than High School | 28 (59.6%) | 0 (0.0%) |
| High School Diploma | 120 (50.6%) | 24 (10.0%) |
| College / Associate Degree | 265 (71.2%) | 0 (0.0%) |
| Bachelor's Degree or higher | 541 (86.3%) | 0 (0.0%) |
| Total | 955 (74.4%) | 17 (1.3%) |
Employment Occupations by Sex in Hudson Oaks
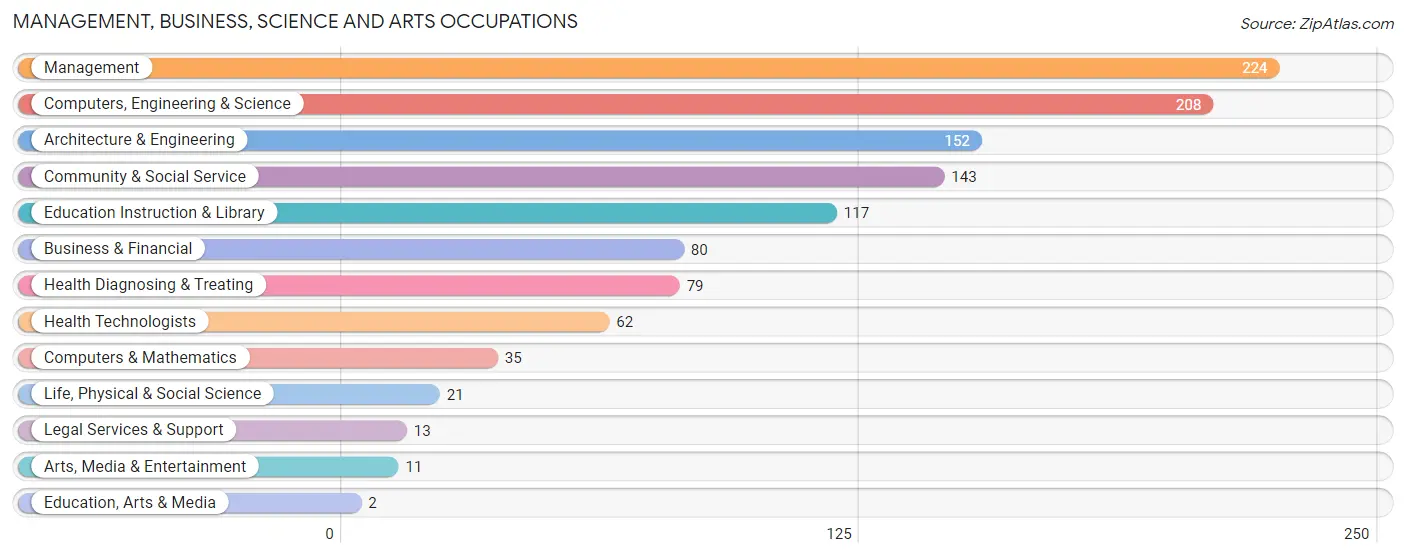
Management, Business, Science and Arts Occupations
The most common Management, Business, Science and Arts occupations in Hudson Oaks are Management (224 | 19.5%), Computers, Engineering & Science (208 | 18.1%), Architecture & Engineering (152 | 13.2%), Community & Social Service (143 | 12.4%), and Education Instruction & Library (117 | 10.2%).
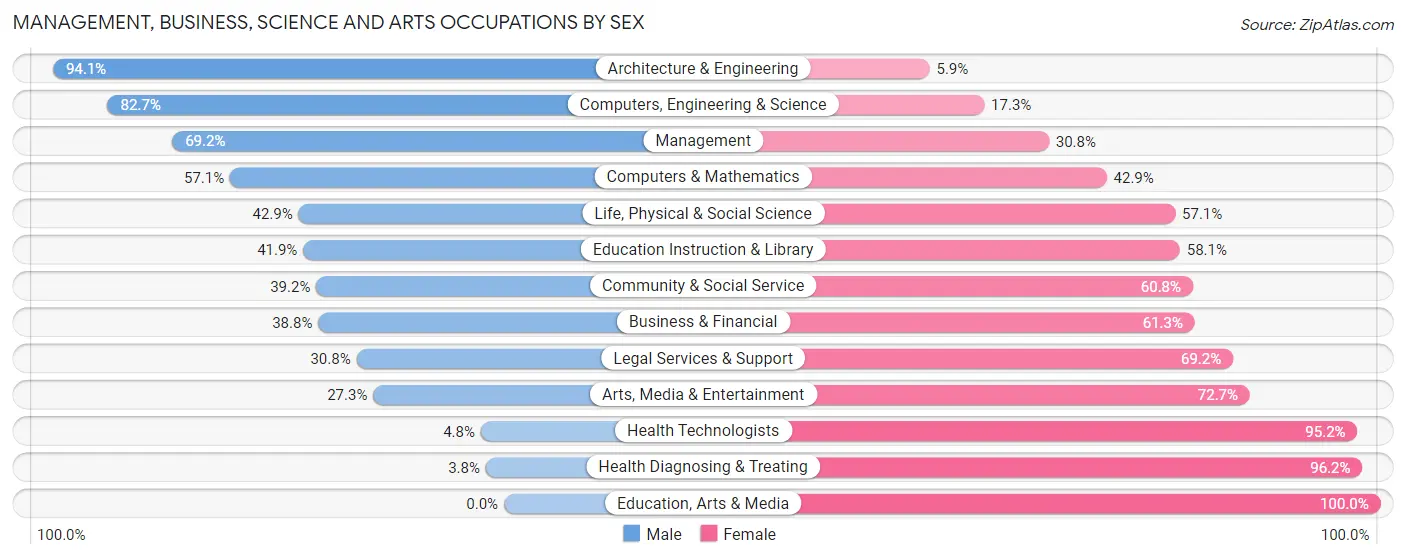
Management, Business, Science and Arts Occupations by Sex
Within the Management, Business, Science and Arts occupations in Hudson Oaks, the most male-oriented occupations are Architecture & Engineering (94.1%), Computers, Engineering & Science (82.7%), and Management (69.2%), while the most female-oriented occupations are Education, Arts & Media (100.0%), Health Diagnosing & Treating (96.2%), and Health Technologists (95.2%).
| Occupation | Male | Female |
| Management | 155 (69.2%) | 69 (30.8%) |
| Business & Financial | 31 (38.8%) | 49 (61.3%) |
| Computers, Engineering & Science | 172 (82.7%) | 36 (17.3%) |
| Computers & Mathematics | 20 (57.1%) | 15 (42.9%) |
| Architecture & Engineering | 143 (94.1%) | 9 (5.9%) |
| Life, Physical & Social Science | 9 (42.9%) | 12 (57.1%) |
| Community & Social Service | 56 (39.2%) | 87 (60.8%) |
| Education, Arts & Media | 0 (0.0%) | 2 (100.0%) |
| Legal Services & Support | 4 (30.8%) | 9 (69.2%) |
| Education Instruction & Library | 49 (41.9%) | 68 (58.1%) |
| Arts, Media & Entertainment | 3 (27.3%) | 8 (72.7%) |
| Health Diagnosing & Treating | 3 (3.8%) | 76 (96.2%) |
| Health Technologists | 3 (4.8%) | 59 (95.2%) |
| Total (Category) | 417 (56.8%) | 317 (43.2%) |
| Total (Overall) | 705 (61.3%) | 445 (38.7%) |
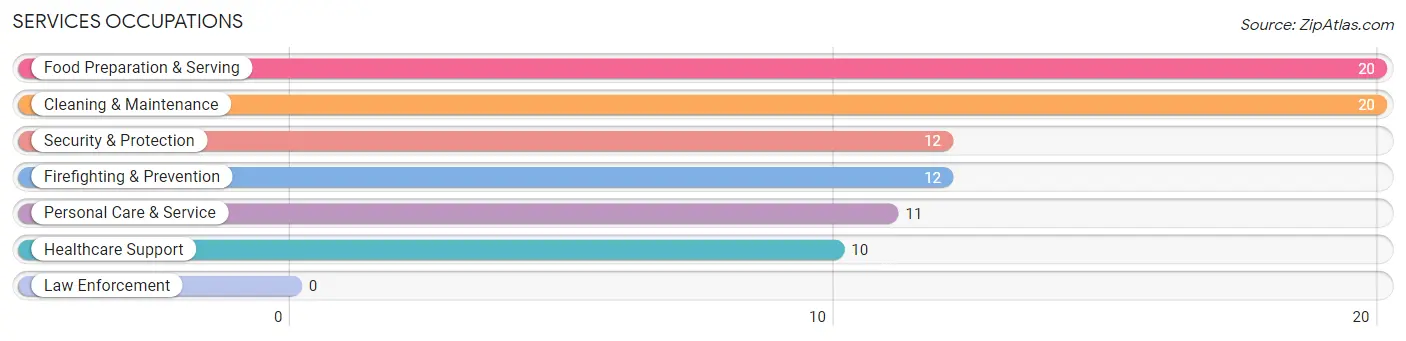
Services Occupations
The most common Services occupations in Hudson Oaks are Food Preparation & Serving (20 | 1.7%), Cleaning & Maintenance (20 | 1.7%), Security & Protection (12 | 1.0%), Firefighting & Prevention (12 | 1.0%), and Personal Care & Service (11 | 1.0%).
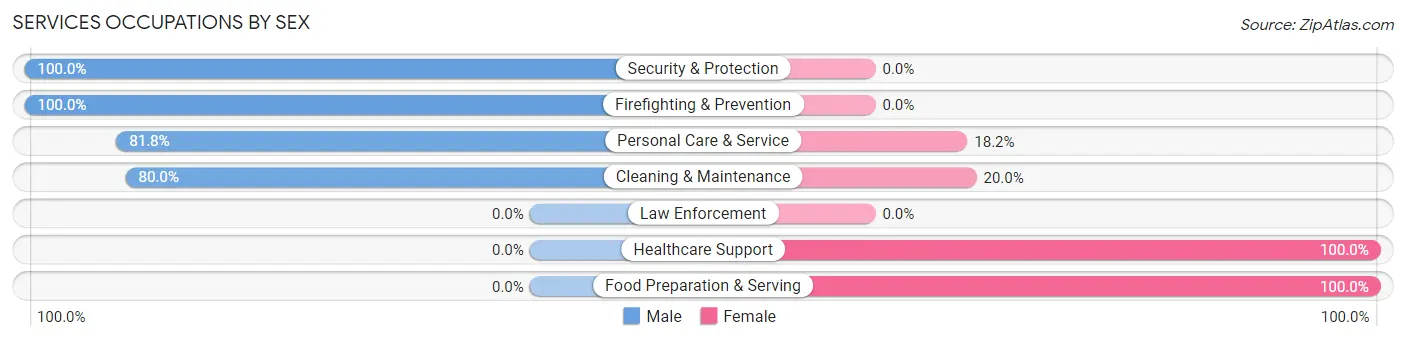
Services Occupations by Sex
Within the Services occupations in Hudson Oaks, the most male-oriented occupations are Security & Protection (100.0%), Firefighting & Prevention (100.0%), and Personal Care & Service (81.8%), while the most female-oriented occupations are Healthcare Support (100.0%), Food Preparation & Serving (100.0%), and Cleaning & Maintenance (20.0%).
| Occupation | Male | Female |
| Healthcare Support | 0 (0.0%) | 10 (100.0%) |
| Security & Protection | 12 (100.0%) | 0 (0.0%) |
| Firefighting & Prevention | 12 (100.0%) | 0 (0.0%) |
| Law Enforcement | 0 (0.0%) | 0 (0.0%) |
| Food Preparation & Serving | 0 (0.0%) | 20 (100.0%) |
| Cleaning & Maintenance | 16 (80.0%) | 4 (20.0%) |
| Personal Care & Service | 9 (81.8%) | 2 (18.2%) |
| Total (Category) | 37 (50.7%) | 36 (49.3%) |
| Total (Overall) | 705 (61.3%) | 445 (38.7%) |
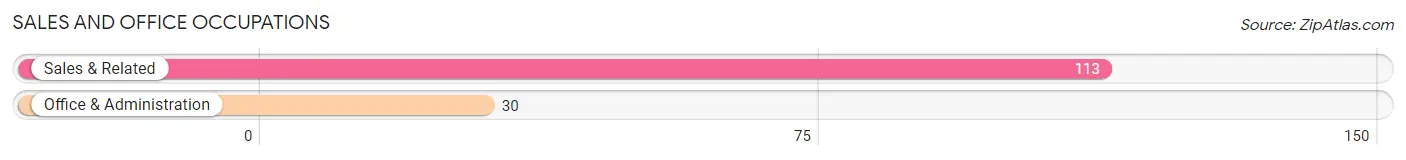
Sales and Office Occupations
The most common Sales and Office occupations in Hudson Oaks are Sales & Related (113 | 9.8%), and Office & Administration (30 | 2.6%).
Sales and Office Occupations by Sex
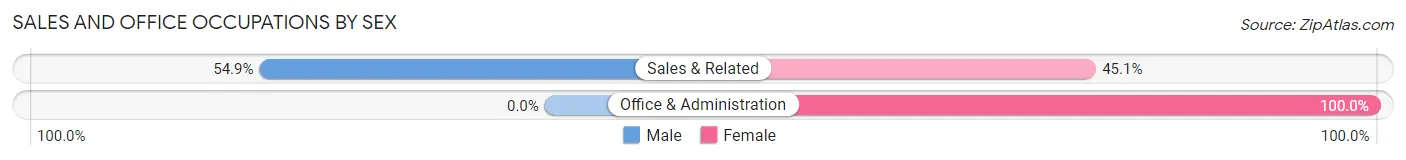
| Occupation | Male | Female |
| Sales & Related | 62 (54.9%) | 51 (45.1%) |
| Office & Administration | 0 (0.0%) | 30 (100.0%) |
| Total (Category) | 62 (43.4%) | 81 (56.6%) |
| Total (Overall) | 705 (61.3%) | 445 (38.7%) |
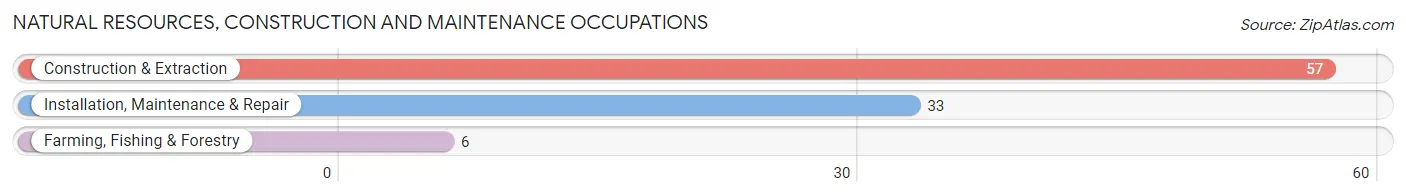
Natural Resources, Construction and Maintenance Occupations
The most common Natural Resources, Construction and Maintenance occupations in Hudson Oaks are Construction & Extraction (57 | 5.0%), Installation, Maintenance & Repair (33 | 2.9%), and Farming, Fishing & Forestry (6 | 0.5%).
Natural Resources, Construction and Maintenance Occupations by Sex
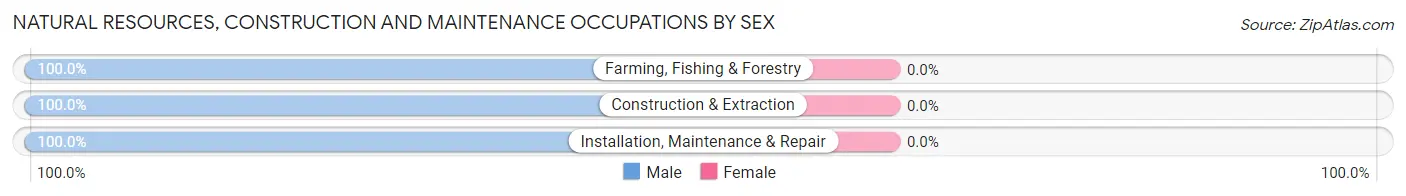
| Occupation | Male | Female |
| Farming, Fishing & Forestry | 6 (100.0%) | 0 (0.0%) |
| Construction & Extraction | 57 (100.0%) | 0 (0.0%) |
| Installation, Maintenance & Repair | 33 (100.0%) | 0 (0.0%) |
| Total (Category) | 96 (100.0%) | 0 (0.0%) |
| Total (Overall) | 705 (61.3%) | 445 (38.7%) |
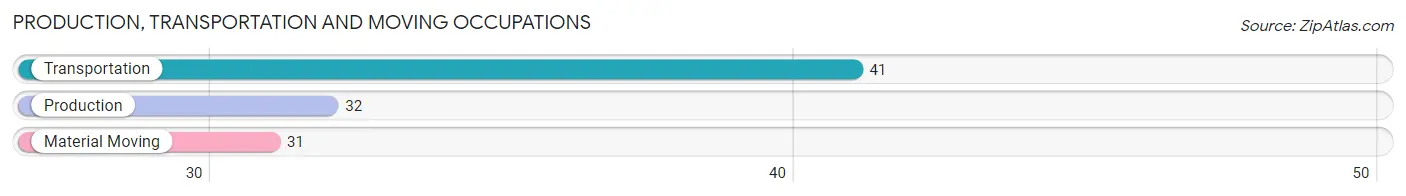
Production, Transportation and Moving Occupations
The most common Production, Transportation and Moving occupations in Hudson Oaks are Transportation (41 | 3.6%), Production (32 | 2.8%), and Material Moving (31 | 2.7%).
Production, Transportation and Moving Occupations by Sex
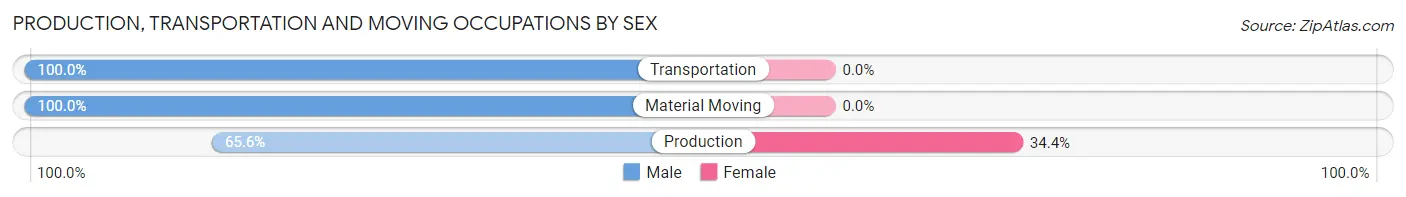
| Occupation | Male | Female |
| Production | 21 (65.6%) | 11 (34.4%) |
| Transportation | 41 (100.0%) | 0 (0.0%) |
| Material Moving | 31 (100.0%) | 0 (0.0%) |
| Total (Category) | 93 (89.4%) | 11 (10.6%) |
| Total (Overall) | 705 (61.3%) | 445 (38.7%) |
Employment Industries by Sex in Hudson Oaks
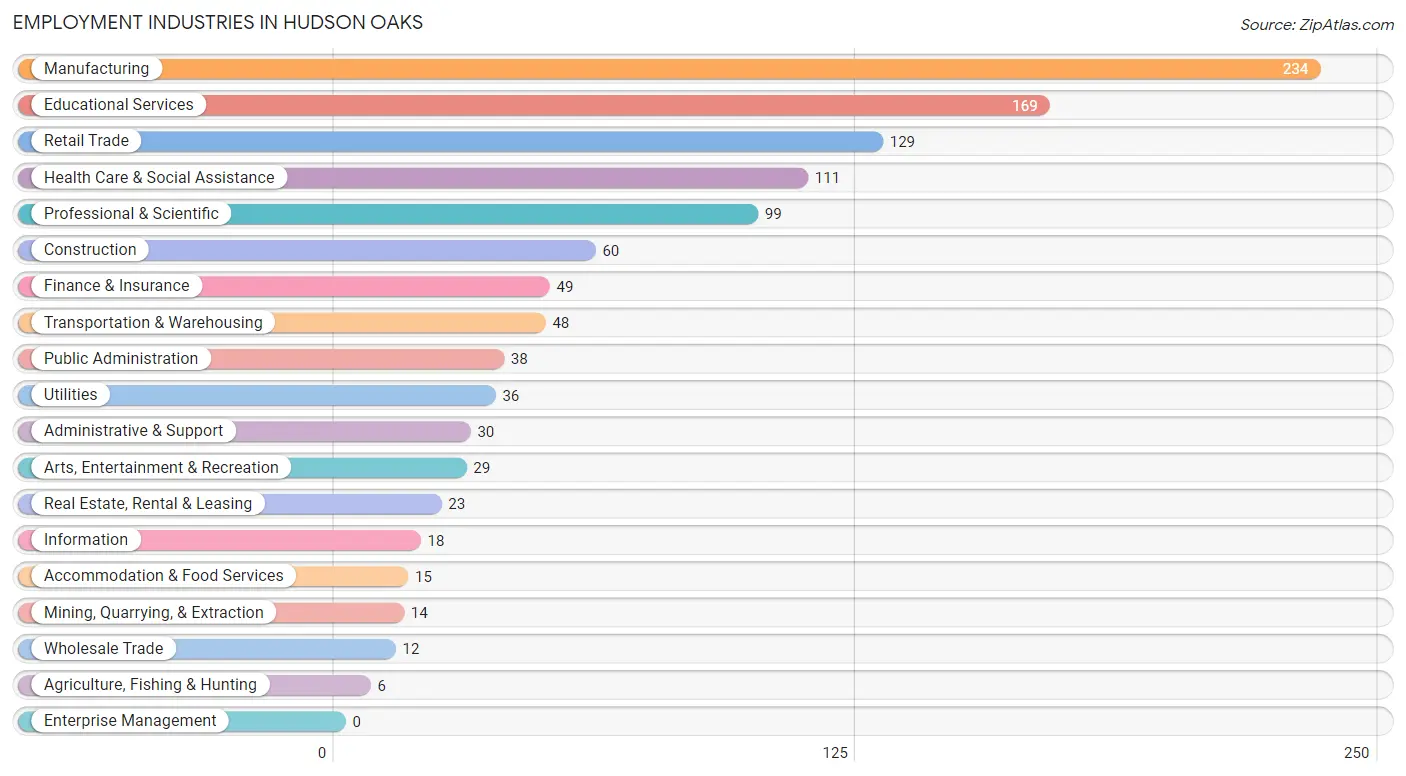
Employment Industries in Hudson Oaks
The major employment industries in Hudson Oaks include Manufacturing (234 | 20.3%), Educational Services (169 | 14.7%), Retail Trade (129 | 11.2%), Health Care & Social Assistance (111 | 9.7%), and Professional & Scientific (99 | 8.6%).
Employment Industries by Sex in Hudson Oaks
The Hudson Oaks industries that see more men than women are Agriculture, Fishing & Hunting (100.0%), Construction (100.0%), and Manufacturing (94.9%), whereas the industries that tend to have a higher number of women are Accommodation & Food Services (100.0%), Health Care & Social Assistance (92.8%), and Administrative & Support (73.3%).
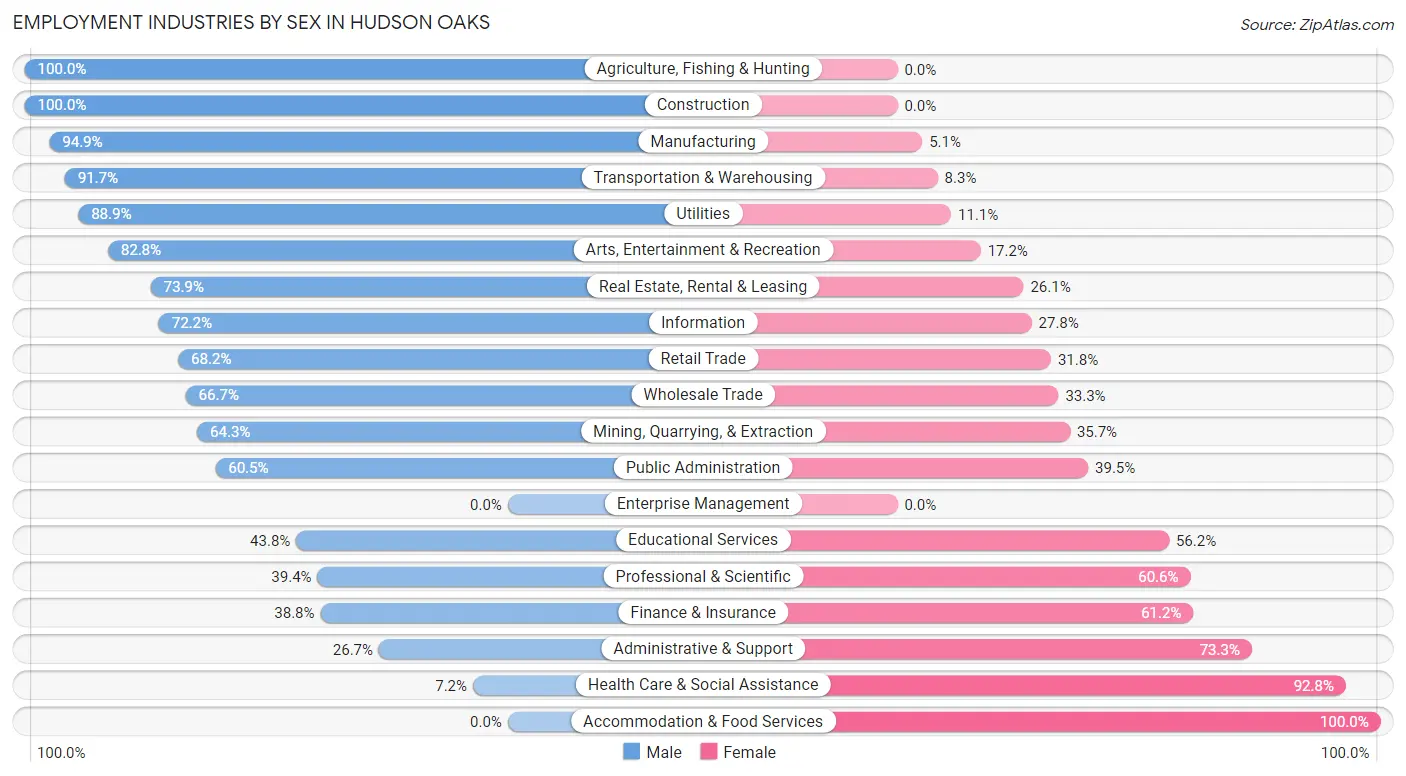
| Industry | Male | Female |
| Agriculture, Fishing & Hunting | 6 (100.0%) | 0 (0.0%) |
| Mining, Quarrying, & Extraction | 9 (64.3%) | 5 (35.7%) |
| Construction | 60 (100.0%) | 0 (0.0%) |
| Manufacturing | 222 (94.9%) | 12 (5.1%) |
| Wholesale Trade | 8 (66.7%) | 4 (33.3%) |
| Retail Trade | 88 (68.2%) | 41 (31.8%) |
| Transportation & Warehousing | 44 (91.7%) | 4 (8.3%) |
| Utilities | 32 (88.9%) | 4 (11.1%) |
| Information | 13 (72.2%) | 5 (27.8%) |
| Finance & Insurance | 19 (38.8%) | 30 (61.2%) |
| Real Estate, Rental & Leasing | 17 (73.9%) | 6 (26.1%) |
| Professional & Scientific | 39 (39.4%) | 60 (60.6%) |
| Enterprise Management | 0 (0.0%) | 0 (0.0%) |
| Administrative & Support | 8 (26.7%) | 22 (73.3%) |
| Educational Services | 74 (43.8%) | 95 (56.2%) |
| Health Care & Social Assistance | 8 (7.2%) | 103 (92.8%) |
| Arts, Entertainment & Recreation | 24 (82.8%) | 5 (17.2%) |
| Accommodation & Food Services | 0 (0.0%) | 15 (100.0%) |
| Public Administration | 23 (60.5%) | 15 (39.5%) |
| Total | 705 (61.3%) | 445 (38.7%) |
Education in Hudson Oaks
School Enrollment in Hudson Oaks
The most common levels of schooling among the 518 students in Hudson Oaks are middle school (147 | 28.4%), high school (94 | 18.1%), and elementary school (86 | 16.6%).
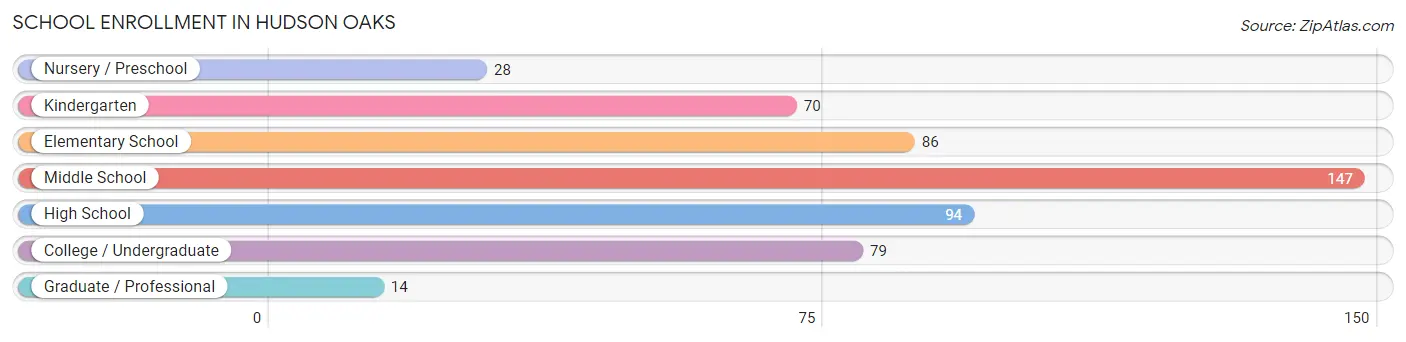
| School Level | # Students | % Students |
| Nursery / Preschool | 28 | 5.4% |
| Kindergarten | 70 | 13.5% |
| Elementary School | 86 | 16.6% |
| Middle School | 147 | 28.4% |
| High School | 94 | 18.1% |
| College / Undergraduate | 79 | 15.2% |
| Graduate / Professional | 14 | 2.7% |
| Total | 518 | 100.0% |
School Enrollment by Age by Funding Source in Hudson Oaks
Out of a total of 518 students who are enrolled in schools in Hudson Oaks, 92 (17.8%) attend a private institution, while the remaining 426 (82.2%) are enrolled in public schools. The age group of 35 years and over has the highest likelihood of being enrolled in private schools, with 16 (61.5% in the age bracket) enrolled. Conversely, the age group of 18 to 19 year olds has the lowest likelihood of being enrolled in a private school, with 13 (100.0% in the age bracket) attending a public institution.
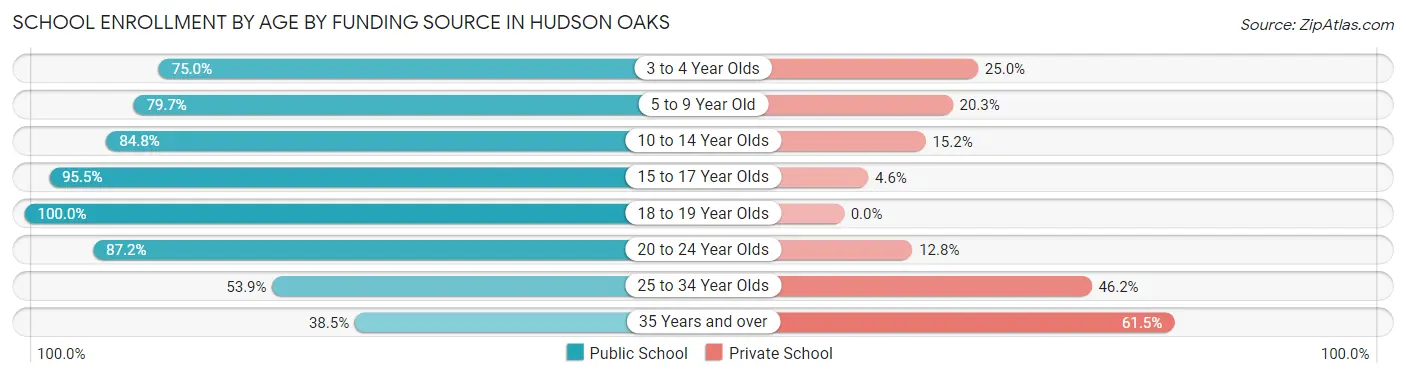
| Age Bracket | Public School | Private School |
| 3 to 4 Year Olds | 18 (75.0%) | 6 (25.0%) |
| 5 to 9 Year Old | 114 (79.7%) | 29 (20.3%) |
| 10 to 14 Year Olds | 139 (84.8%) | 25 (15.2%) |
| 15 to 17 Year Olds | 84 (95.5%) | 4 (4.5%) |
| 18 to 19 Year Olds | 13 (100.0%) | 0 (0.0%) |
| 20 to 24 Year Olds | 41 (87.2%) | 6 (12.8%) |
| 25 to 34 Year Olds | 7 (53.8%) | 6 (46.2%) |
| 35 Years and over | 10 (38.5%) | 16 (61.5%) |
| Total | 426 (82.2%) | 92 (17.8%) |
Educational Attainment by Field of Study in Hudson Oaks
Engineering (206 | 25.1%), business (147 | 17.9%), education (116 | 14.1%), science & technology (68 | 8.3%), and arts & humanities (47 | 5.7%) are the most common fields of study among 822 individuals in Hudson Oaks who have obtained a bachelor's degree or higher.
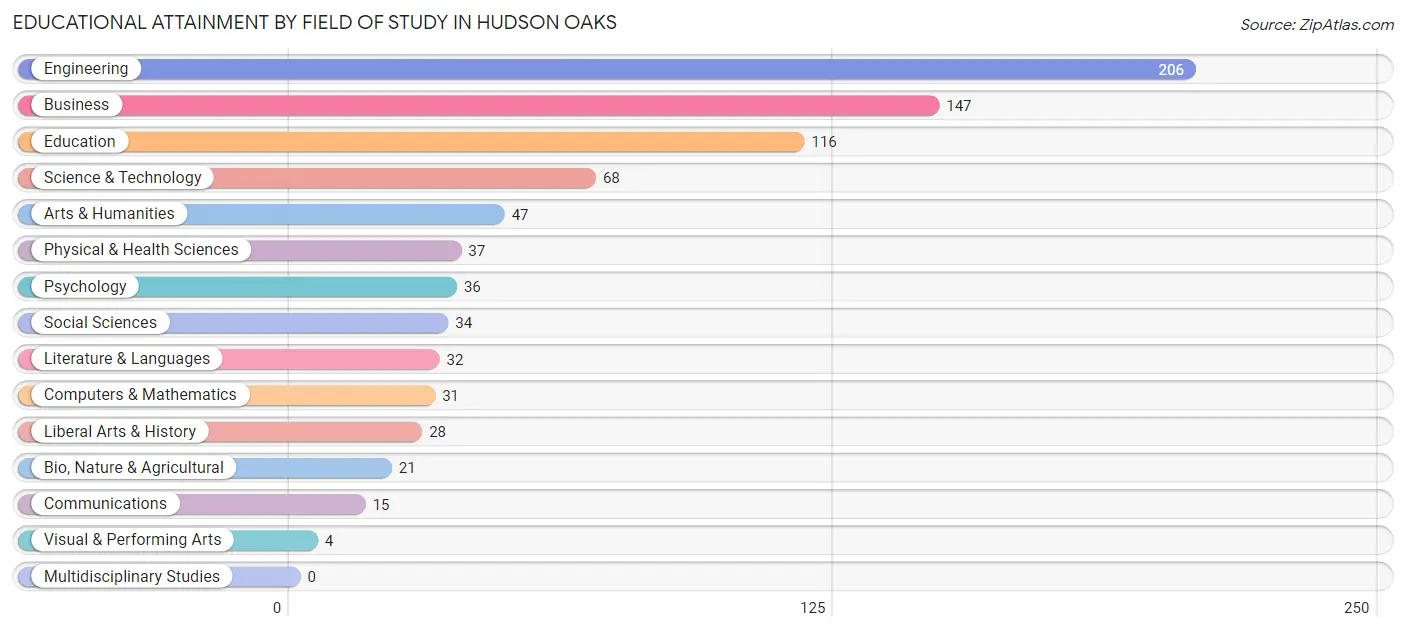
| Field of Study | # Graduates | % Graduates |
| Computers & Mathematics | 31 | 3.8% |
| Bio, Nature & Agricultural | 21 | 2.5% |
| Physical & Health Sciences | 37 | 4.5% |
| Psychology | 36 | 4.4% |
| Social Sciences | 34 | 4.1% |
| Engineering | 206 | 25.1% |
| Multidisciplinary Studies | 0 | 0.0% |
| Science & Technology | 68 | 8.3% |
| Business | 147 | 17.9% |
| Education | 116 | 14.1% |
| Literature & Languages | 32 | 3.9% |
| Liberal Arts & History | 28 | 3.4% |
| Visual & Performing Arts | 4 | 0.5% |
| Communications | 15 | 1.8% |
| Arts & Humanities | 47 | 5.7% |
| Total | 822 | 100.0% |
Transportation & Commute in Hudson Oaks
Vehicle Availability by Sex in Hudson Oaks
The most prevalent vehicle ownership categories in Hudson Oaks are males with 2 vehicles (298, accounting for 42.4%) and females with 2 vehicles (148, making up 70.1%).
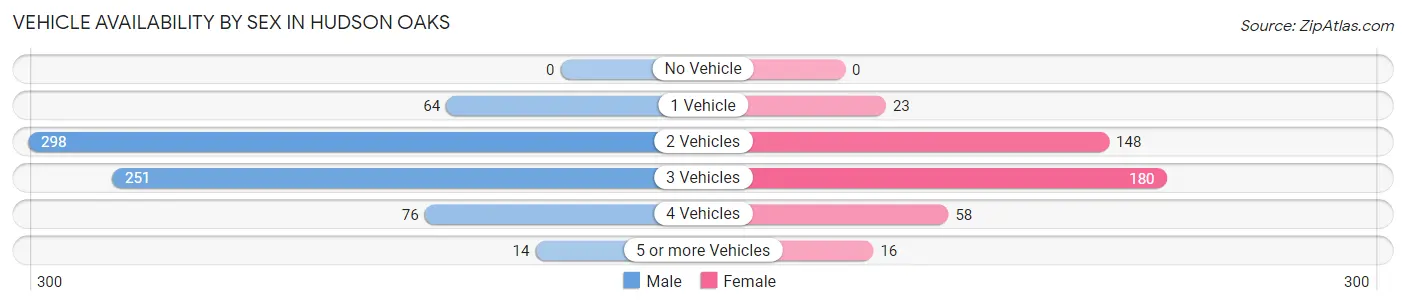
| Vehicles Available | Male | Female |
| No Vehicle | 0 (0.0%) | 0 (0.0%) |
| 1 Vehicle | 64 (9.1%) | 23 (5.4%) |
| 2 Vehicles | 298 (42.4%) | 148 (34.8%) |
| 3 Vehicles | 251 (35.7%) | 180 (42.3%) |
| 4 Vehicles | 76 (10.8%) | 58 (13.7%) |
| 5 or more Vehicles | 14 (2.0%) | 16 (3.8%) |
| Total | 703 (100.0%) | 425 (100.0%) |
Commute Time in Hudson Oaks
The most frequently occuring commute durations in Hudson Oaks are 15 to 19 minutes (159 commuters, 16.1%), 20 to 24 minutes (148 commuters, 15.0%), and 30 to 34 minutes (148 commuters, 15.0%).
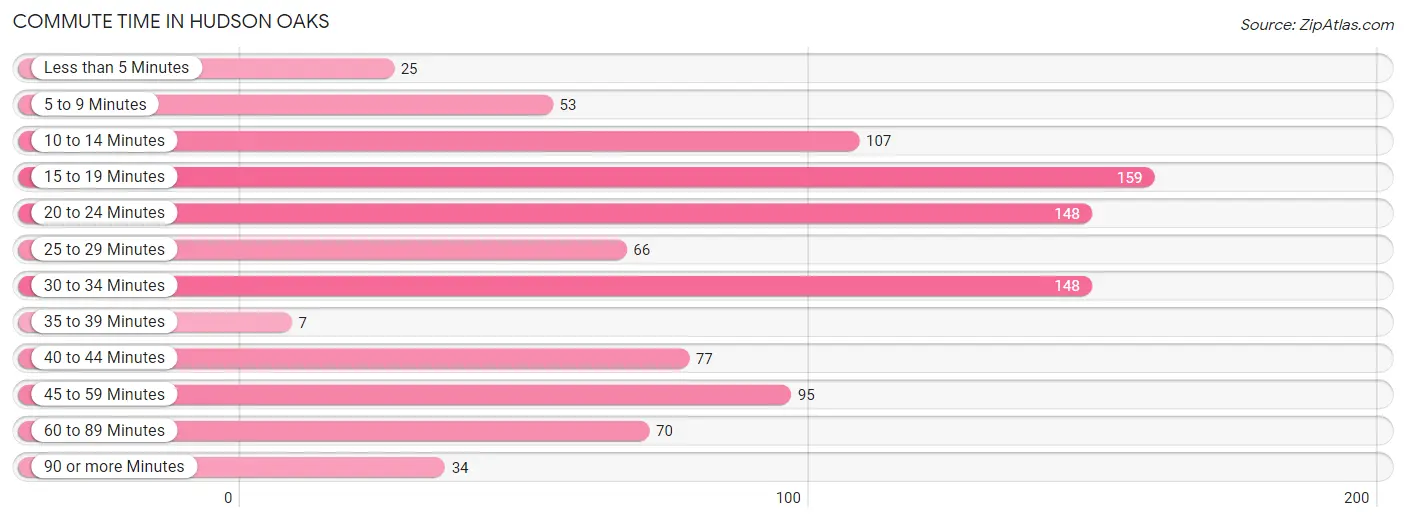
| Commute Time | # Commuters | % Commuters |
| Less than 5 Minutes | 25 | 2.5% |
| 5 to 9 Minutes | 53 | 5.4% |
| 10 to 14 Minutes | 107 | 10.8% |
| 15 to 19 Minutes | 159 | 16.1% |
| 20 to 24 Minutes | 148 | 15.0% |
| 25 to 29 Minutes | 66 | 6.7% |
| 30 to 34 Minutes | 148 | 15.0% |
| 35 to 39 Minutes | 7 | 0.7% |
| 40 to 44 Minutes | 77 | 7.8% |
| 45 to 59 Minutes | 95 | 9.6% |
| 60 to 89 Minutes | 70 | 7.1% |
| 90 or more Minutes | 34 | 3.4% |
Commute Time by Sex in Hudson Oaks
The most common commute times in Hudson Oaks are 20 to 24 minutes (126 commuters, 19.5%) for males and 15 to 19 minutes (87 commuters, 25.4%) for females.
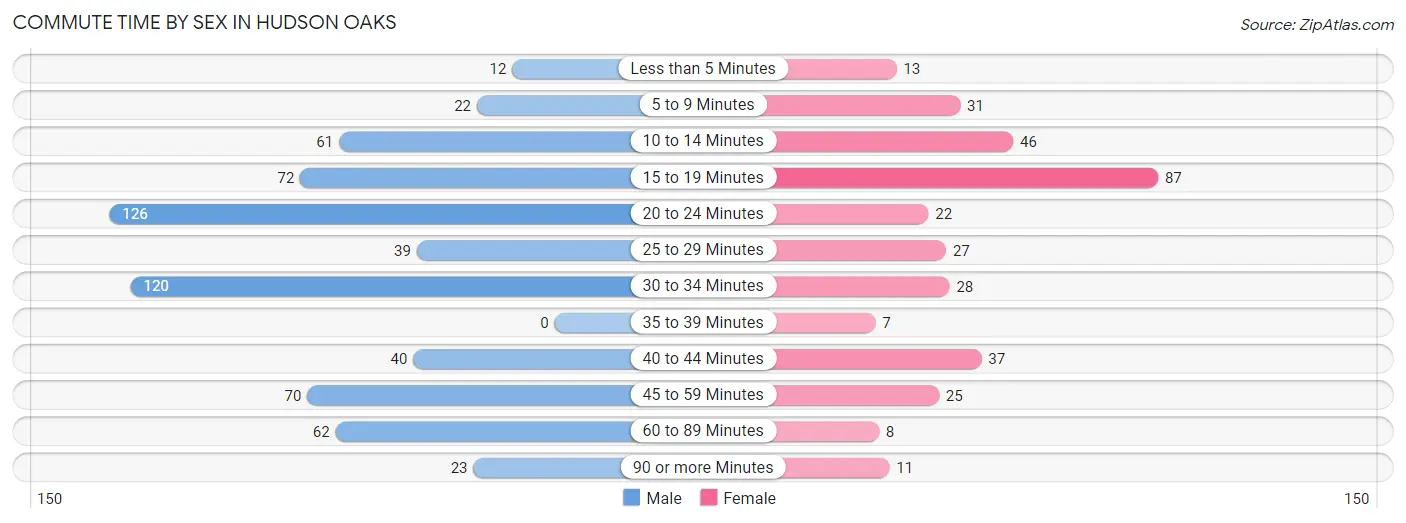
| Commute Time | Male | Female |
| Less than 5 Minutes | 12 (1.8%) | 13 (3.8%) |
| 5 to 9 Minutes | 22 (3.4%) | 31 (9.1%) |
| 10 to 14 Minutes | 61 (9.4%) | 46 (13.5%) |
| 15 to 19 Minutes | 72 (11.1%) | 87 (25.4%) |
| 20 to 24 Minutes | 126 (19.5%) | 22 (6.4%) |
| 25 to 29 Minutes | 39 (6.0%) | 27 (7.9%) |
| 30 to 34 Minutes | 120 (18.5%) | 28 (8.2%) |
| 35 to 39 Minutes | 0 (0.0%) | 7 (2.1%) |
| 40 to 44 Minutes | 40 (6.2%) | 37 (10.8%) |
| 45 to 59 Minutes | 70 (10.8%) | 25 (7.3%) |
| 60 to 89 Minutes | 62 (9.6%) | 8 (2.3%) |
| 90 or more Minutes | 23 (3.5%) | 11 (3.2%) |
Time of Departure to Work by Sex in Hudson Oaks
The most frequent times of departure to work in Hudson Oaks are 7:00 AM to 7:29 AM (137, 21.2%) for males and 7:00 AM to 7:29 AM (71, 20.8%) for females.
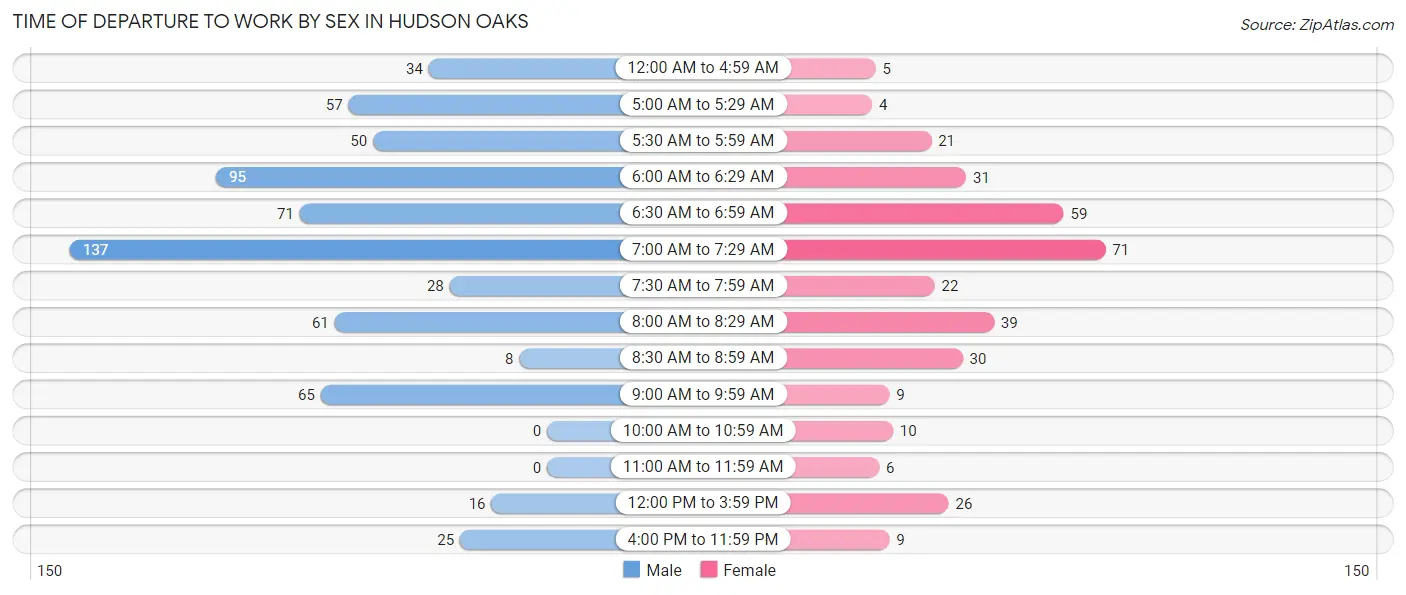
| Time of Departure | Male | Female |
| 12:00 AM to 4:59 AM | 34 (5.3%) | 5 (1.5%) |
| 5:00 AM to 5:29 AM | 57 (8.8%) | 4 (1.2%) |
| 5:30 AM to 5:59 AM | 50 (7.7%) | 21 (6.1%) |
| 6:00 AM to 6:29 AM | 95 (14.7%) | 31 (9.1%) |
| 6:30 AM to 6:59 AM | 71 (11.0%) | 59 (17.2%) |
| 7:00 AM to 7:29 AM | 137 (21.2%) | 71 (20.8%) |
| 7:30 AM to 7:59 AM | 28 (4.3%) | 22 (6.4%) |
| 8:00 AM to 8:29 AM | 61 (9.4%) | 39 (11.4%) |
| 8:30 AM to 8:59 AM | 8 (1.2%) | 30 (8.8%) |
| 9:00 AM to 9:59 AM | 65 (10.1%) | 9 (2.6%) |
| 10:00 AM to 10:59 AM | 0 (0.0%) | 10 (2.9%) |
| 11:00 AM to 11:59 AM | 0 (0.0%) | 6 (1.8%) |
| 12:00 PM to 3:59 PM | 16 (2.5%) | 26 (7.6%) |
| 4:00 PM to 11:59 PM | 25 (3.9%) | 9 (2.6%) |
| Total | 647 (100.0%) | 342 (100.0%) |
Housing Occupancy in Hudson Oaks
Occupancy by Ownership in Hudson Oaks
Of the total 869 dwellings in Hudson Oaks, owner-occupied units account for 785 (90.3%), while renter-occupied units make up 84 (9.7%).
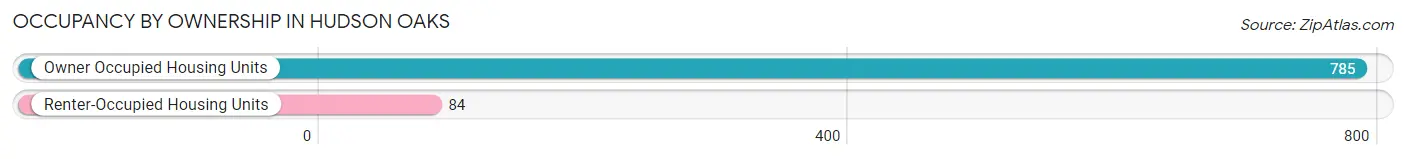
| Occupancy | # Housing Units | % Housing Units |
| Owner Occupied Housing Units | 785 | 90.3% |
| Renter-Occupied Housing Units | 84 | 9.7% |
| Total Occupied Housing Units | 869 | 100.0% |
Occupancy by Household Size in Hudson Oaks
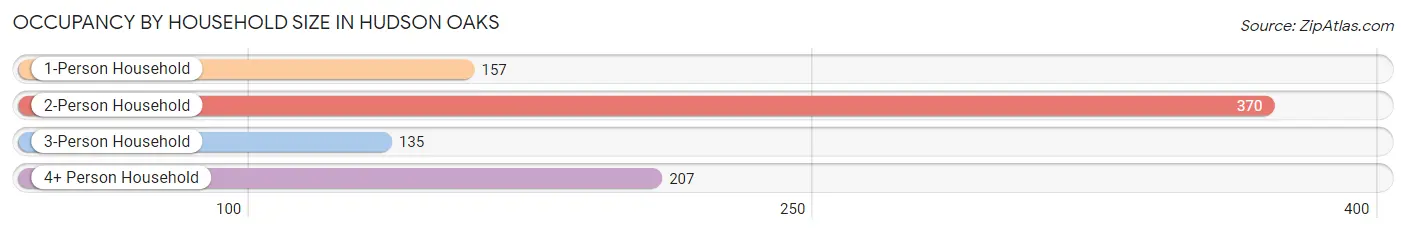
| Household Size | # Housing Units | % Housing Units |
| 1-Person Household | 157 | 18.1% |
| 2-Person Household | 370 | 42.6% |
| 3-Person Household | 135 | 15.5% |
| 4+ Person Household | 207 | 23.8% |
| Total Housing Units | 869 | 100.0% |
Occupancy by Ownership by Household Size in Hudson Oaks
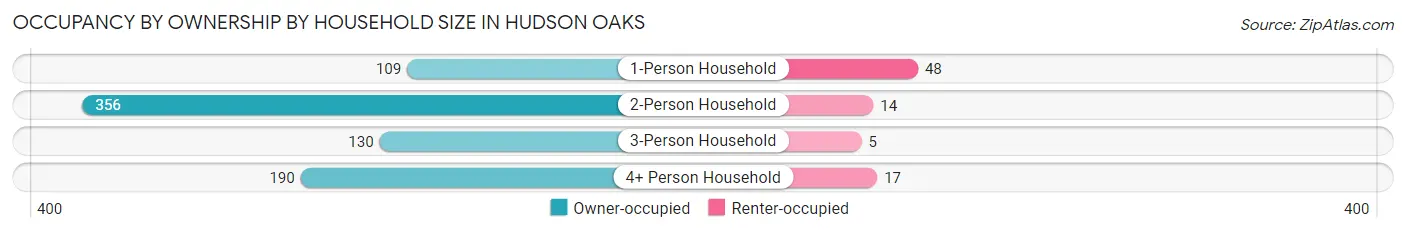
| Household Size | Owner-occupied | Renter-occupied |
| 1-Person Household | 109 (69.4%) | 48 (30.6%) |
| 2-Person Household | 356 (96.2%) | 14 (3.8%) |
| 3-Person Household | 130 (96.3%) | 5 (3.7%) |
| 4+ Person Household | 190 (91.8%) | 17 (8.2%) |
| Total Housing Units | 785 (90.3%) | 84 (9.7%) |
Occupancy by Educational Attainment in Hudson Oaks
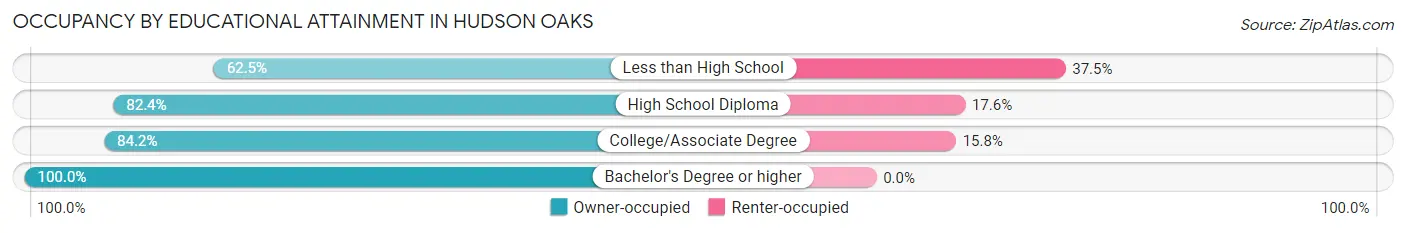
| Household Size | Owner-occupied | Renter-occupied |
| Less than High School | 15 (62.5%) | 9 (37.5%) |
| High School Diploma | 131 (82.4%) | 28 (17.6%) |
| College/Associate Degree | 251 (84.2%) | 47 (15.8%) |
| Bachelor's Degree or higher | 388 (100.0%) | 0 (0.0%) |
Occupancy by Age of Householder in Hudson Oaks
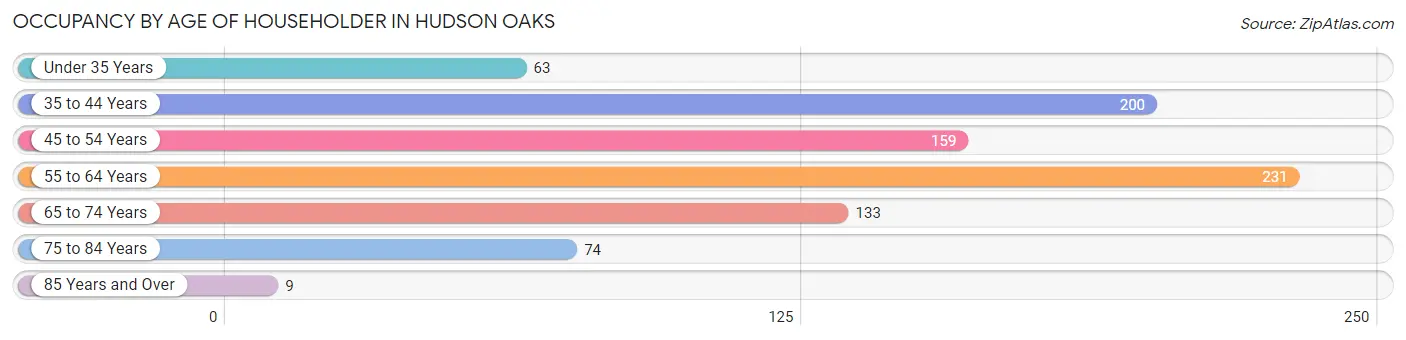
| Age Bracket | # Households | % Households |
| Under 35 Years | 63 | 7.2% |
| 35 to 44 Years | 200 | 23.0% |
| 45 to 54 Years | 159 | 18.3% |
| 55 to 64 Years | 231 | 26.6% |
| 65 to 74 Years | 133 | 15.3% |
| 75 to 84 Years | 74 | 8.5% |
| 85 Years and Over | 9 | 1.0% |
| Total | 869 | 100.0% |
Housing Finances in Hudson Oaks
Median Income by Occupancy in Hudson Oaks
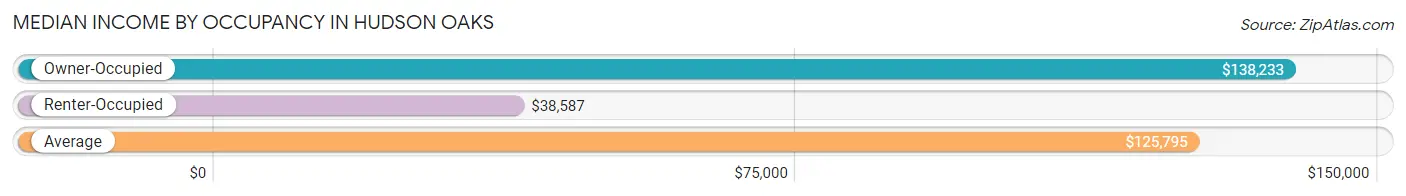
| Occupancy Type | # Households | Median Income |
| Owner-Occupied | 785 (90.3%) | $138,233 |
| Renter-Occupied | 84 (9.7%) | $38,587 |
| Average | 869 (100.0%) | $125,795 |
Occupancy by Householder Income Bracket in Hudson Oaks
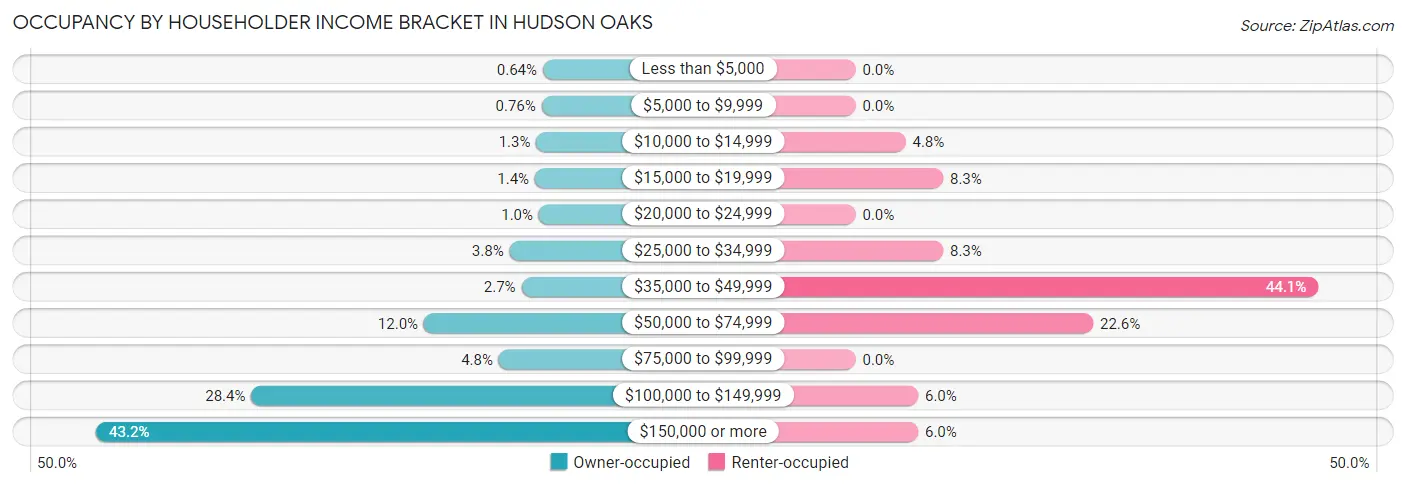
| Income Bracket | Owner-occupied | Renter-occupied |
| Less than $5,000 | 5 (0.6%) | 0 (0.0%) |
| $5,000 to $9,999 | 6 (0.8%) | 0 (0.0%) |
| $10,000 to $14,999 | 10 (1.3%) | 4 (4.8%) |
| $15,000 to $19,999 | 11 (1.4%) | 7 (8.3%) |
| $20,000 to $24,999 | 8 (1.0%) | 0 (0.0%) |
| $25,000 to $34,999 | 30 (3.8%) | 7 (8.3%) |
| $35,000 to $49,999 | 21 (2.7%) | 37 (44.1%) |
| $50,000 to $74,999 | 94 (12.0%) | 19 (22.6%) |
| $75,000 to $99,999 | 38 (4.8%) | 0 (0.0%) |
| $100,000 to $149,999 | 223 (28.4%) | 5 (5.9%) |
| $150,000 or more | 339 (43.2%) | 5 (5.9%) |
| Total | 785 (100.0%) | 84 (100.0%) |
Monthly Housing Cost Tiers in Hudson Oaks
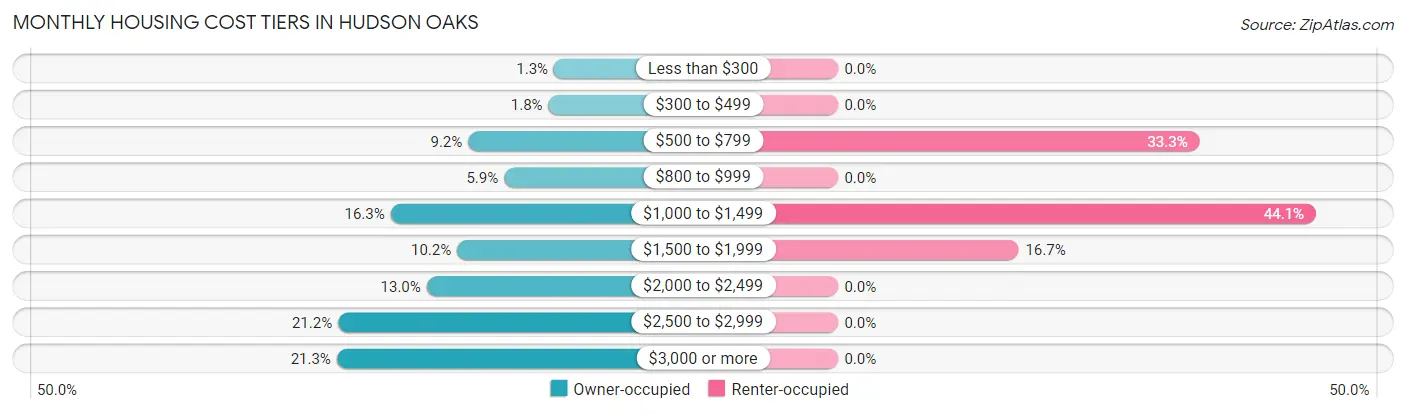
| Monthly Cost | Owner-occupied | Renter-occupied |
| Less than $300 | 10 (1.3%) | 0 (0.0%) |
| $300 to $499 | 14 (1.8%) | 0 (0.0%) |
| $500 to $799 | 72 (9.2%) | 28 (33.3%) |
| $800 to $999 | 46 (5.9%) | 0 (0.0%) |
| $1,000 to $1,499 | 128 (16.3%) | 37 (44.1%) |
| $1,500 to $1,999 | 80 (10.2%) | 14 (16.7%) |
| $2,000 to $2,499 | 102 (13.0%) | 0 (0.0%) |
| $2,500 to $2,999 | 166 (21.1%) | 0 (0.0%) |
| $3,000 or more | 167 (21.3%) | 0 (0.0%) |
| Total | 785 (100.0%) | 84 (100.0%) |
Physical Housing Characteristics in Hudson Oaks
Housing Structures in Hudson Oaks
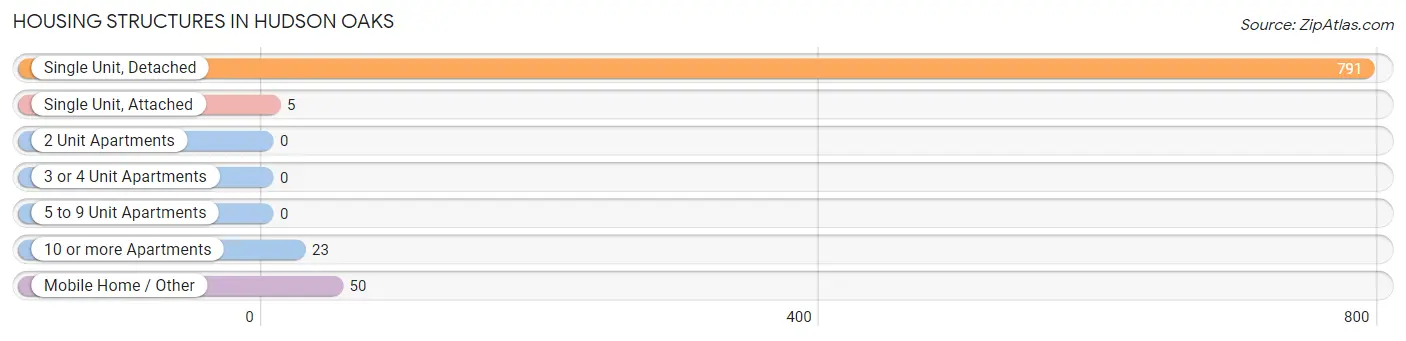
| Structure Type | # Housing Units | % Housing Units |
| Single Unit, Detached | 791 | 91.0% |
| Single Unit, Attached | 5 | 0.6% |
| 2 Unit Apartments | 0 | 0.0% |
| 3 or 4 Unit Apartments | 0 | 0.0% |
| 5 to 9 Unit Apartments | 0 | 0.0% |
| 10 or more Apartments | 23 | 2.6% |
| Mobile Home / Other | 50 | 5.8% |
| Total | 869 | 100.0% |
Housing Structures by Occupancy in Hudson Oaks
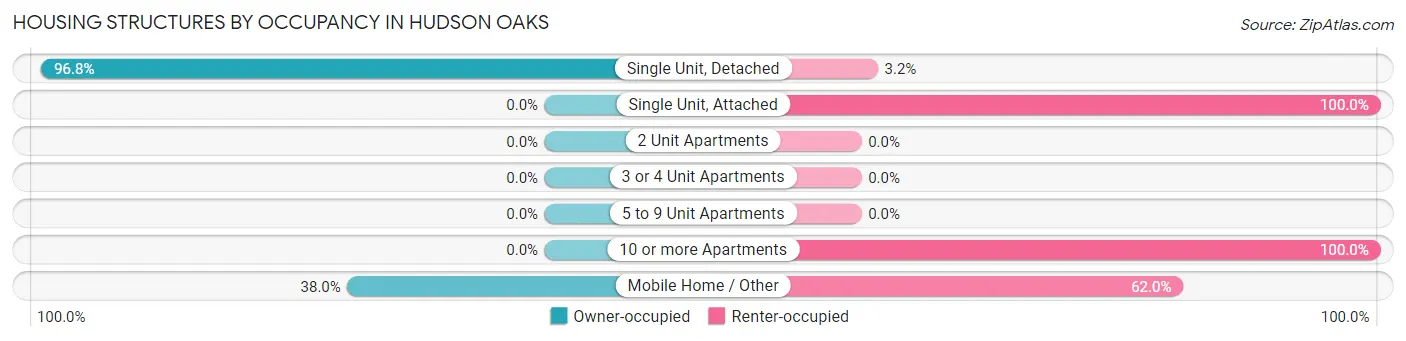
| Structure Type | Owner-occupied | Renter-occupied |
| Single Unit, Detached | 766 (96.8%) | 25 (3.2%) |
| Single Unit, Attached | 0 (0.0%) | 5 (100.0%) |
| 2 Unit Apartments | 0 (0.0%) | 0 (0.0%) |
| 3 or 4 Unit Apartments | 0 (0.0%) | 0 (0.0%) |
| 5 to 9 Unit Apartments | 0 (0.0%) | 0 (0.0%) |
| 10 or more Apartments | 0 (0.0%) | 23 (100.0%) |
| Mobile Home / Other | 19 (38.0%) | 31 (62.0%) |
| Total | 785 (90.3%) | 84 (9.7%) |
Housing Structures by Number of Rooms in Hudson Oaks
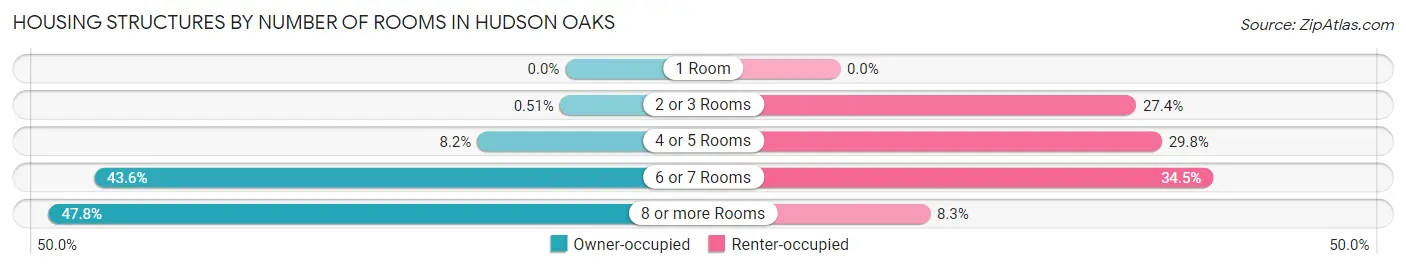
| Number of Rooms | Owner-occupied | Renter-occupied |
| 1 Room | 0 (0.0%) | 0 (0.0%) |
| 2 or 3 Rooms | 4 (0.5%) | 23 (27.4%) |
| 4 or 5 Rooms | 64 (8.2%) | 25 (29.8%) |
| 6 or 7 Rooms | 342 (43.6%) | 29 (34.5%) |
| 8 or more Rooms | 375 (47.8%) | 7 (8.3%) |
| Total | 785 (100.0%) | 84 (100.0%) |
Housing Structure by Heating Type in Hudson Oaks
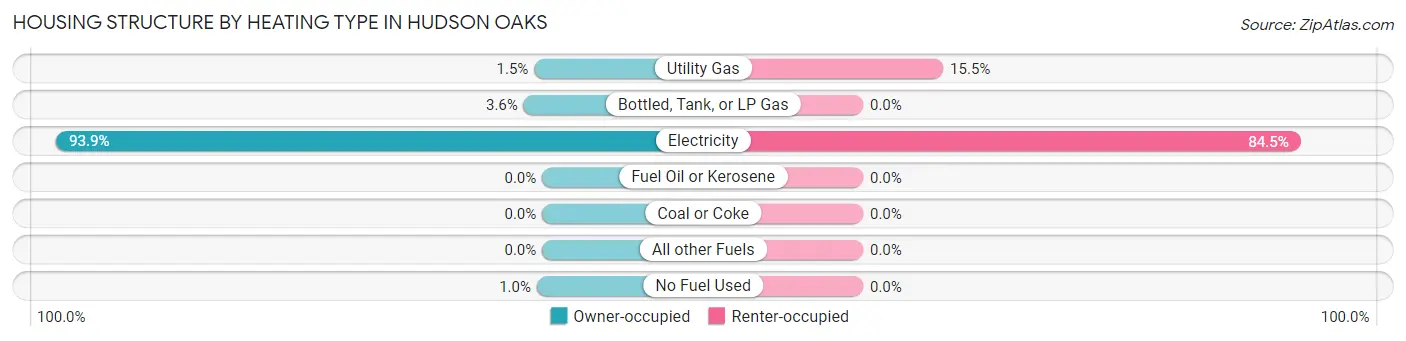
| Heating Type | Owner-occupied | Renter-occupied |
| Utility Gas | 12 (1.5%) | 13 (15.5%) |
| Bottled, Tank, or LP Gas | 28 (3.6%) | 0 (0.0%) |
| Electricity | 737 (93.9%) | 71 (84.5%) |
| Fuel Oil or Kerosene | 0 (0.0%) | 0 (0.0%) |
| Coal or Coke | 0 (0.0%) | 0 (0.0%) |
| All other Fuels | 0 (0.0%) | 0 (0.0%) |
| No Fuel Used | 8 (1.0%) | 0 (0.0%) |
| Total | 785 (100.0%) | 84 (100.0%) |
Household Vehicle Usage in Hudson Oaks
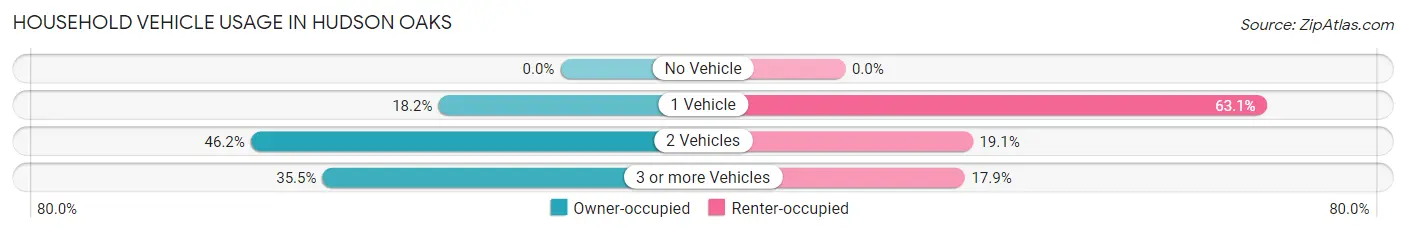
| Vehicles per Household | Owner-occupied | Renter-occupied |
| No Vehicle | 0 (0.0%) | 0 (0.0%) |
| 1 Vehicle | 143 (18.2%) | 53 (63.1%) |
| 2 Vehicles | 363 (46.2%) | 16 (19.1%) |
| 3 or more Vehicles | 279 (35.5%) | 15 (17.9%) |
| Total | 785 (100.0%) | 84 (100.0%) |
Real Estate & Mortgages in Hudson Oaks
Real Estate and Mortgage Overview in Hudson Oaks
| Characteristic | Without Mortgage | With Mortgage |
| Housing Units | 228 | 557 |
| Median Property Value | $355,400 | $433,100 |
| Median Household Income | $97,917 | $267 |
| Monthly Housing Costs | $938 | $167 |
| Real Estate Taxes | $5,264 | $25 |
Property Value by Mortgage Status in Hudson Oaks
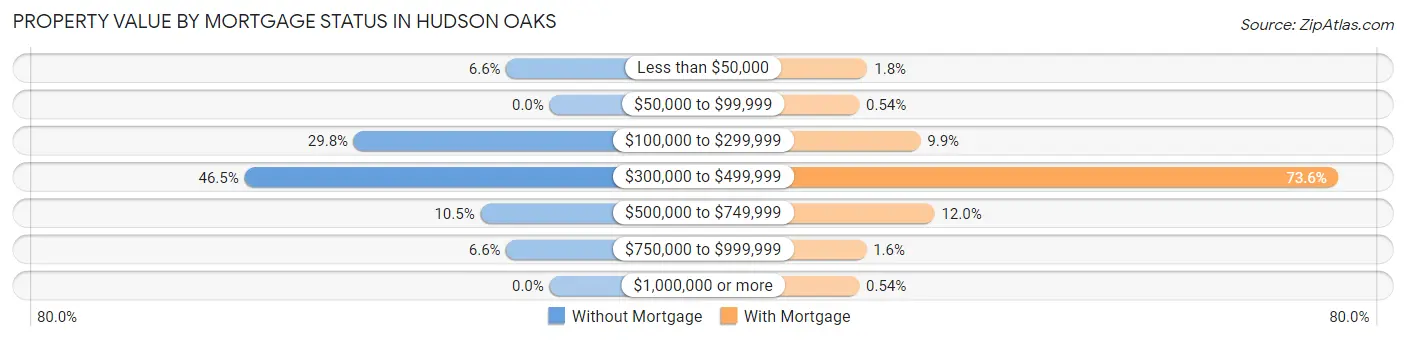
| Property Value | Without Mortgage | With Mortgage |
| Less than $50,000 | 15 (6.6%) | 10 (1.8%) |
| $50,000 to $99,999 | 0 (0.0%) | 3 (0.5%) |
| $100,000 to $299,999 | 68 (29.8%) | 55 (9.9%) |
| $300,000 to $499,999 | 106 (46.5%) | 410 (73.6%) |
| $500,000 to $749,999 | 24 (10.5%) | 67 (12.0%) |
| $750,000 to $999,999 | 15 (6.6%) | 9 (1.6%) |
| $1,000,000 or more | 0 (0.0%) | 3 (0.5%) |
| Total | 228 (100.0%) | 557 (100.0%) |
Household Income by Mortgage Status in Hudson Oaks
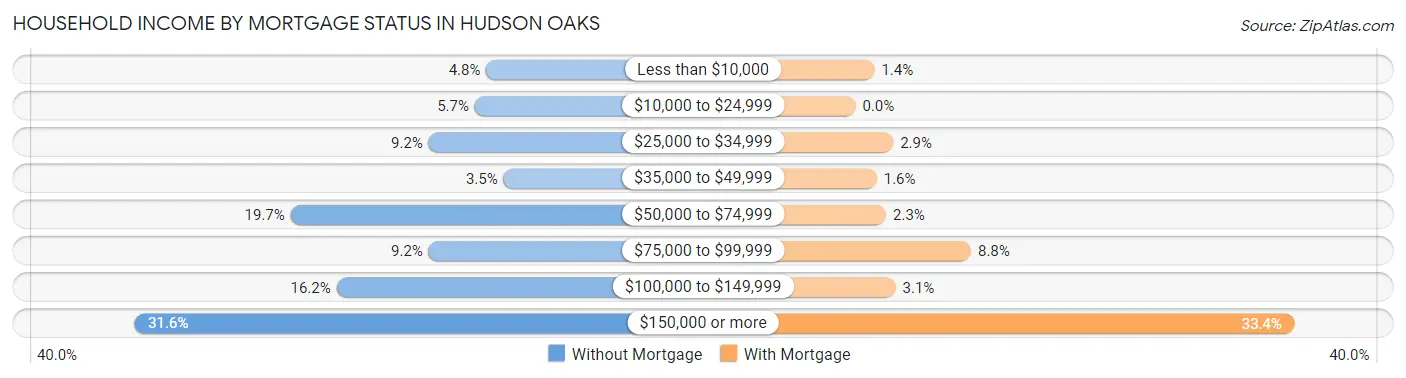
| Household Income | Without Mortgage | With Mortgage |
| Less than $10,000 | 11 (4.8%) | 8 (1.4%) |
| $10,000 to $24,999 | 13 (5.7%) | 0 (0.0%) |
| $25,000 to $34,999 | 21 (9.2%) | 16 (2.9%) |
| $35,000 to $49,999 | 8 (3.5%) | 9 (1.6%) |
| $50,000 to $74,999 | 45 (19.7%) | 13 (2.3%) |
| $75,000 to $99,999 | 21 (9.2%) | 49 (8.8%) |
| $100,000 to $149,999 | 37 (16.2%) | 17 (3.0%) |
| $150,000 or more | 72 (31.6%) | 186 (33.4%) |
| Total | 228 (100.0%) | 557 (100.0%) |
Property Value to Household Income Ratio in Hudson Oaks
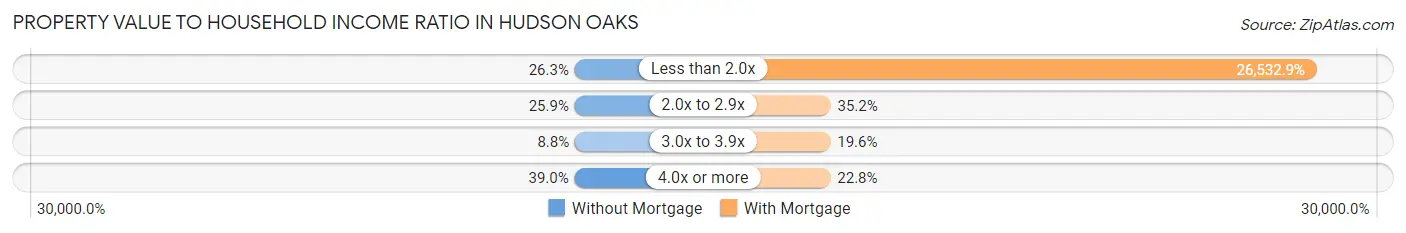
| Value-to-Income Ratio | Without Mortgage | With Mortgage |
| Less than 2.0x | 60 (26.3%) | 147,788 (26,532.9%) |
| 2.0x to 2.9x | 59 (25.9%) | 196 (35.2%) |
| 3.0x to 3.9x | 20 (8.8%) | 109 (19.6%) |
| 4.0x or more | 89 (39.0%) | 127 (22.8%) |
| Total | 228 (100.0%) | 557 (100.0%) |
Real Estate Taxes by Mortgage Status in Hudson Oaks
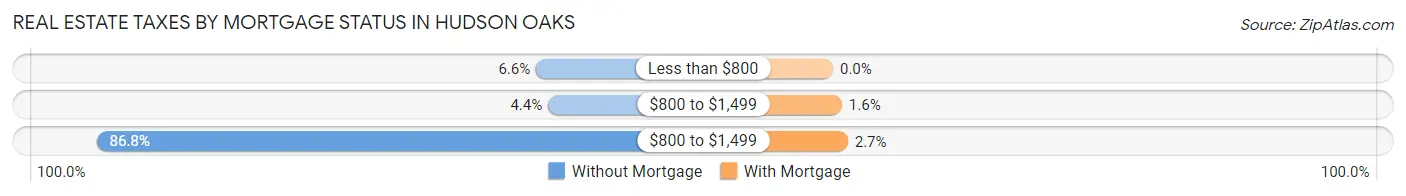
| Property Taxes | Without Mortgage | With Mortgage |
| Less than $800 | 15 (6.6%) | 0 (0.0%) |
| $800 to $1,499 | 10 (4.4%) | 9 (1.6%) |
| $800 to $1,499 | 198 (86.8%) | 15 (2.7%) |
| Total | 228 (100.0%) | 557 (100.0%) |
Health & Disability in Hudson Oaks
Health Insurance Coverage by Age in Hudson Oaks
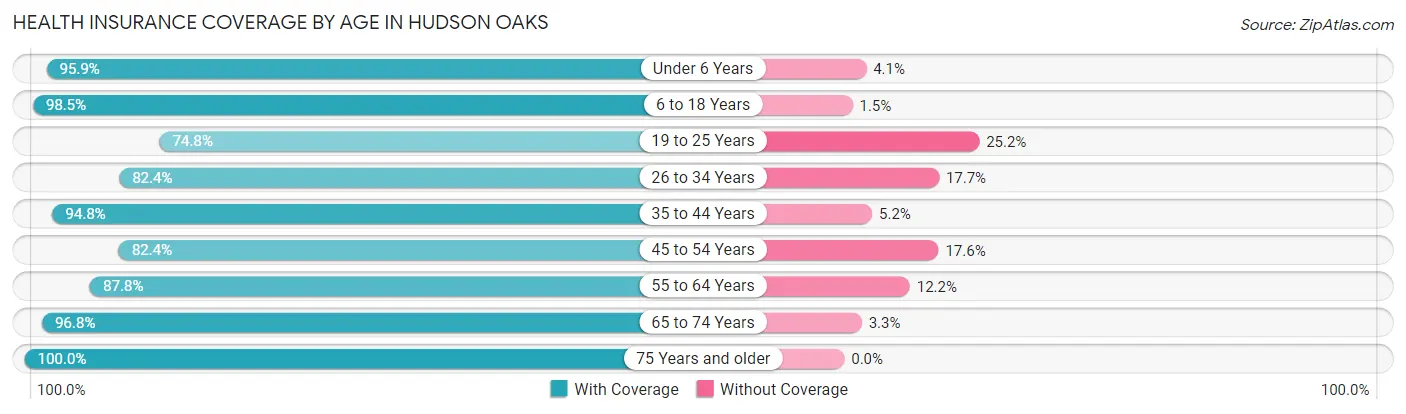
| Age Bracket | With Coverage | Without Coverage |
| Under 6 Years | 188 (95.9%) | 8 (4.1%) |
| 6 to 18 Years | 385 (98.5%) | 6 (1.5%) |
| 19 to 25 Years | 116 (74.8%) | 39 (25.2%) |
| 26 to 34 Years | 140 (82.4%) | 30 (17.6%) |
| 35 to 44 Years | 402 (94.8%) | 22 (5.2%) |
| 45 to 54 Years | 216 (82.4%) | 46 (17.6%) |
| 55 to 64 Years | 359 (87.8%) | 50 (12.2%) |
| 65 to 74 Years | 238 (96.8%) | 8 (3.3%) |
| 75 Years and older | 138 (100.0%) | 0 (0.0%) |
| Total | 2,182 (91.3%) | 209 (8.7%) |
Health Insurance Coverage by Citizenship Status in Hudson Oaks
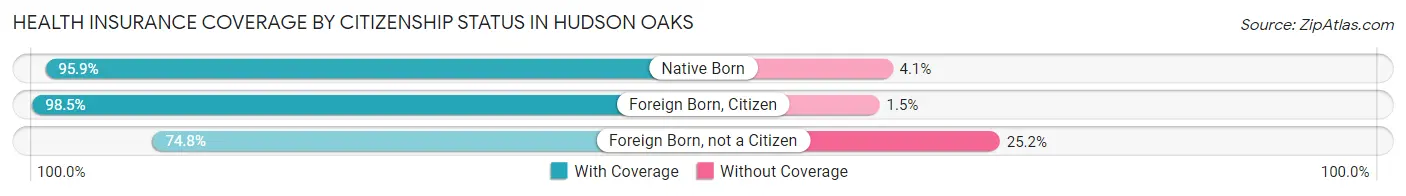
| Citizenship Status | With Coverage | Without Coverage |
| Native Born | 188 (95.9%) | 8 (4.1%) |
| Foreign Born, Citizen | 385 (98.5%) | 6 (1.5%) |
| Foreign Born, not a Citizen | 116 (74.8%) | 39 (25.2%) |
Health Insurance Coverage by Household Income in Hudson Oaks
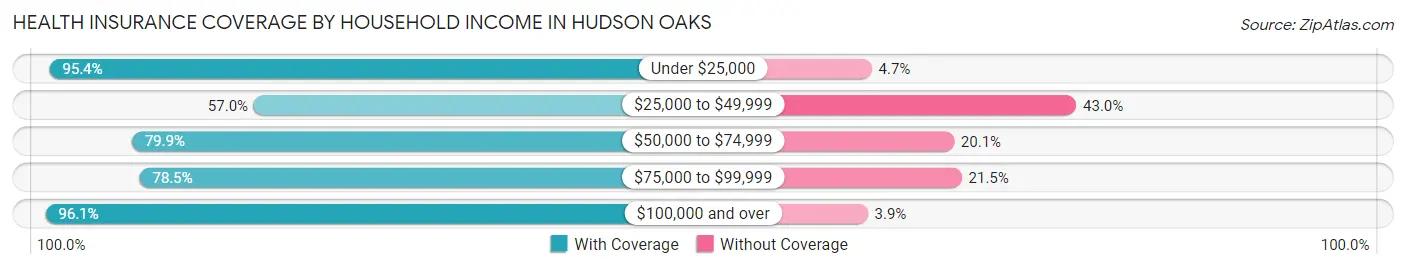
| Household Income | With Coverage | Without Coverage |
| Under $25,000 | 82 (95.4%) | 4 (4.6%) |
| $25,000 to $49,999 | 81 (57.0%) | 61 (43.0%) |
| $50,000 to $74,999 | 215 (79.9%) | 54 (20.1%) |
| $75,000 to $99,999 | 73 (78.5%) | 20 (21.5%) |
| $100,000 and over | 1,731 (96.1%) | 70 (3.9%) |
Public vs Private Health Insurance Coverage by Age in Hudson Oaks
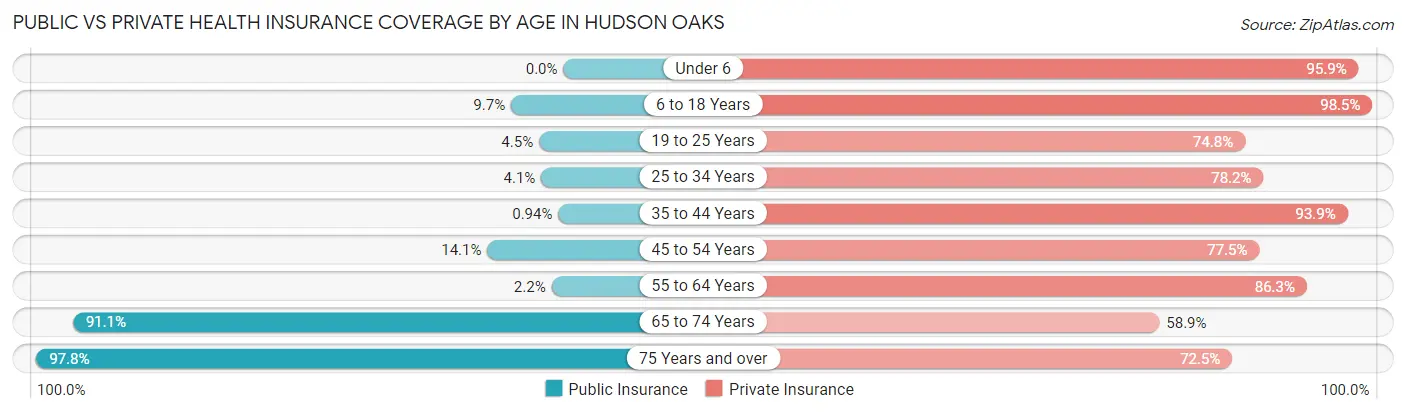
| Age Bracket | Public Insurance | Private Insurance |
| Under 6 | 0 (0.0%) | 188 (95.9%) |
| 6 to 18 Years | 38 (9.7%) | 385 (98.5%) |
| 19 to 25 Years | 7 (4.5%) | 116 (74.8%) |
| 25 to 34 Years | 7 (4.1%) | 133 (78.2%) |
| 35 to 44 Years | 4 (0.9%) | 398 (93.9%) |
| 45 to 54 Years | 37 (14.1%) | 203 (77.5%) |
| 55 to 64 Years | 9 (2.2%) | 353 (86.3%) |
| 65 to 74 Years | 224 (91.1%) | 145 (58.9%) |
| 75 Years and over | 135 (97.8%) | 100 (72.5%) |
| Total | 461 (19.3%) | 2,021 (84.5%) |
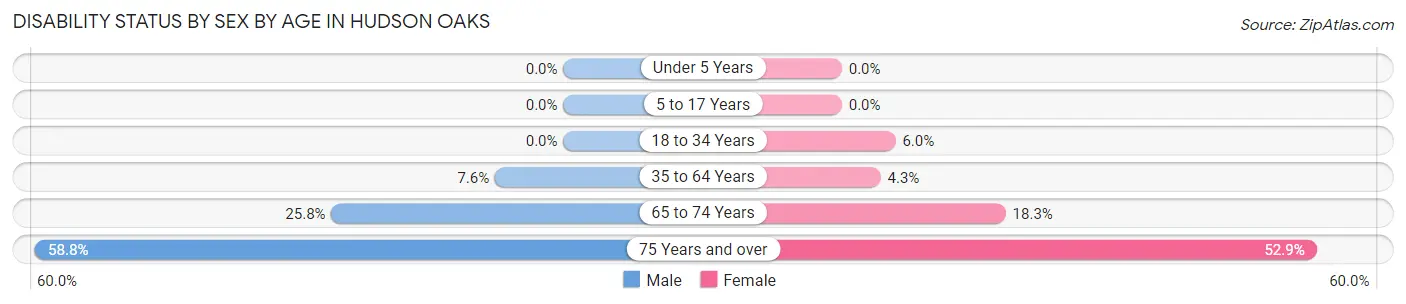
Disability Status by Sex by Age in Hudson Oaks
| Age Bracket | Male | Female |
| Under 5 Years | 0 (0.0%) | 0 (0.0%) |
| 5 to 17 Years | 0 (0.0%) | 0 (0.0%) |
| 18 to 34 Years | 0 (0.0%) | 7 (6.0%) |
| 35 to 64 Years | 41 (7.6%) | 24 (4.3%) |
| 65 to 74 Years | 31 (25.8%) | 23 (18.2%) |
| 75 Years and over | 40 (58.8%) | 37 (52.9%) |
Disability Class by Sex by Age in Hudson Oaks
Disability Class: Hearing Difficulty
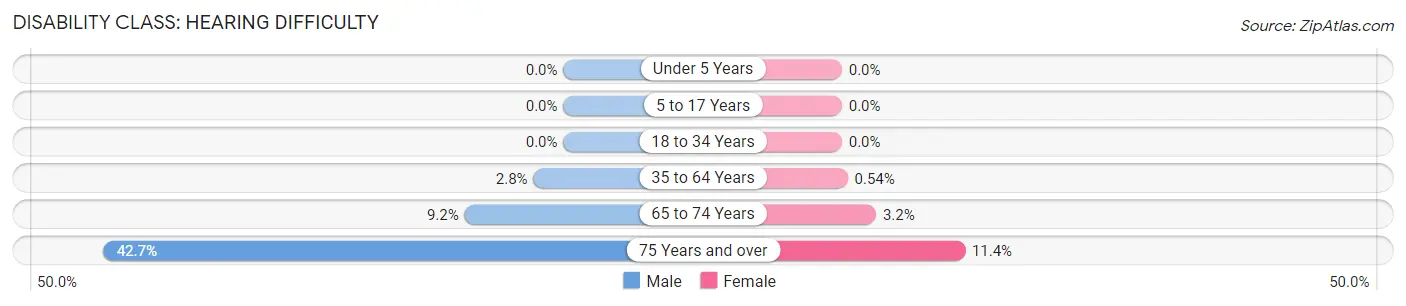
| Age Bracket | Male | Female |
| Under 5 Years | 0 (0.0%) | 0 (0.0%) |
| 5 to 17 Years | 0 (0.0%) | 0 (0.0%) |
| 18 to 34 Years | 0 (0.0%) | 0 (0.0%) |
| 35 to 64 Years | 15 (2.8%) | 3 (0.5%) |
| 65 to 74 Years | 11 (9.2%) | 4 (3.2%) |
| 75 Years and over | 29 (42.6%) | 8 (11.4%) |
Disability Class: Vision Difficulty
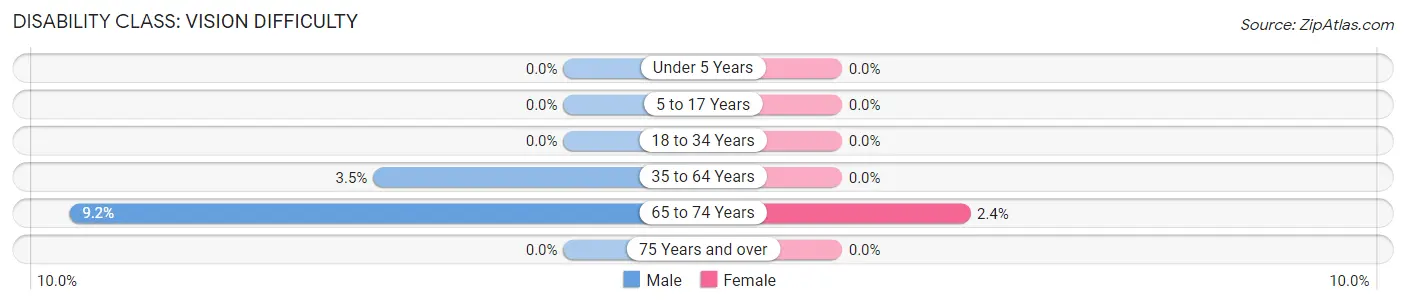
| Age Bracket | Male | Female |
| Under 5 Years | 0 (0.0%) | 0 (0.0%) |
| 5 to 17 Years | 0 (0.0%) | 0 (0.0%) |
| 18 to 34 Years | 0 (0.0%) | 0 (0.0%) |
| 35 to 64 Years | 19 (3.5%) | 0 (0.0%) |
| 65 to 74 Years | 11 (9.2%) | 3 (2.4%) |
| 75 Years and over | 0 (0.0%) | 0 (0.0%) |
Disability Class: Cognitive Difficulty
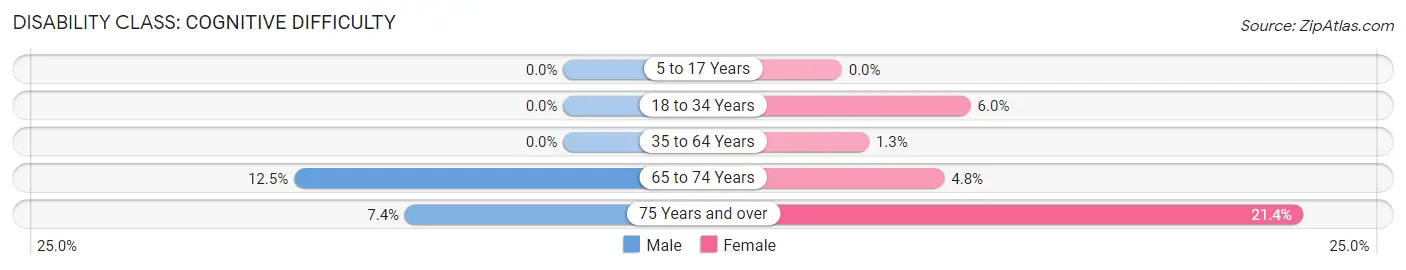
| Age Bracket | Male | Female |
| 5 to 17 Years | 0 (0.0%) | 0 (0.0%) |
| 18 to 34 Years | 0 (0.0%) | 7 (6.0%) |
| 35 to 64 Years | 0 (0.0%) | 7 (1.3%) |
| 65 to 74 Years | 15 (12.5%) | 6 (4.8%) |
| 75 Years and over | 5 (7.3%) | 15 (21.4%) |
Disability Class: Ambulatory Difficulty
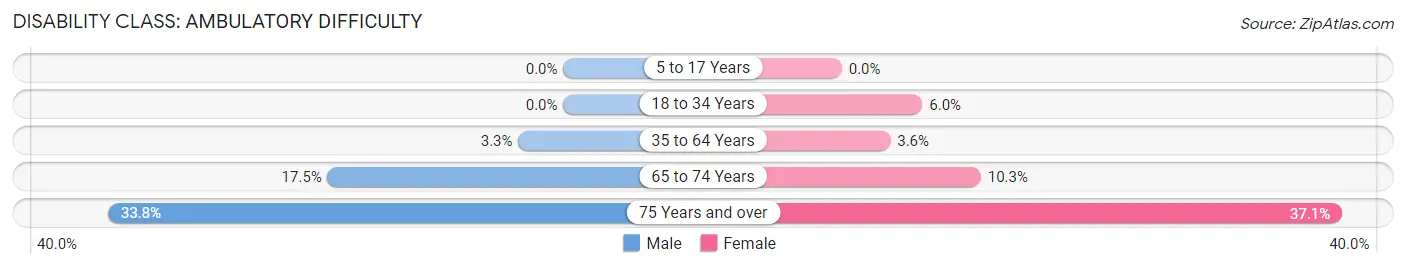
| Age Bracket | Male | Female |
| 5 to 17 Years | 0 (0.0%) | 0 (0.0%) |
| 18 to 34 Years | 0 (0.0%) | 7 (6.0%) |
| 35 to 64 Years | 18 (3.3%) | 20 (3.6%) |
| 65 to 74 Years | 21 (17.5%) | 13 (10.3%) |
| 75 Years and over | 23 (33.8%) | 26 (37.1%) |
Disability Class: Self-Care Difficulty
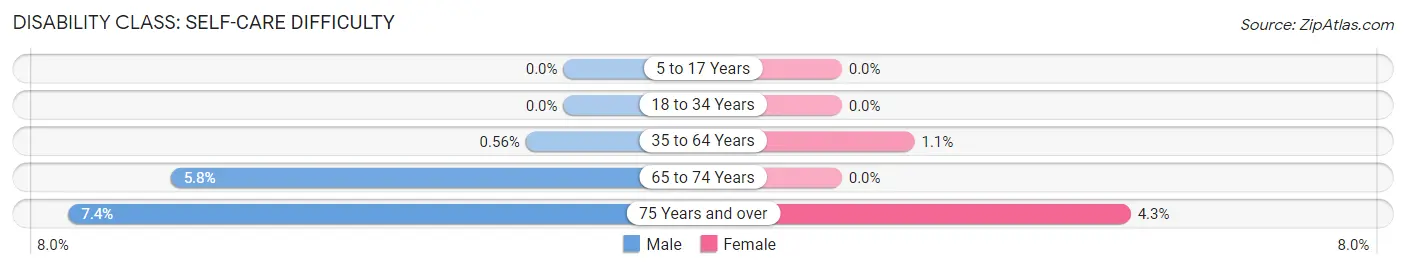
| Age Bracket | Male | Female |
| 5 to 17 Years | 0 (0.0%) | 0 (0.0%) |
| 18 to 34 Years | 0 (0.0%) | 0 (0.0%) |
| 35 to 64 Years | 3 (0.6%) | 6 (1.1%) |
| 65 to 74 Years | 7 (5.8%) | 0 (0.0%) |
| 75 Years and over | 5 (7.3%) | 3 (4.3%) |
Technology Access in Hudson Oaks
Computing Device Access in Hudson Oaks
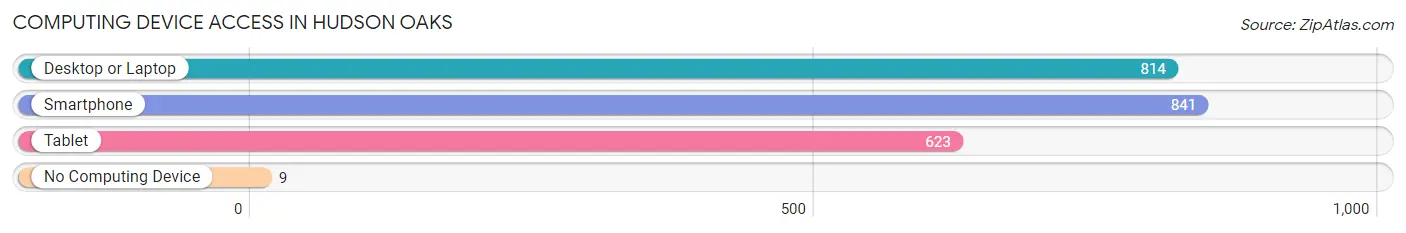
| Device Type | # Households | % Households |
| Desktop or Laptop | 814 | 93.7% |
| Smartphone | 841 | 96.8% |
| Tablet | 623 | 71.7% |
| No Computing Device | 9 | 1.0% |
| Total | 869 | 100.0% |
Internet Access in Hudson Oaks
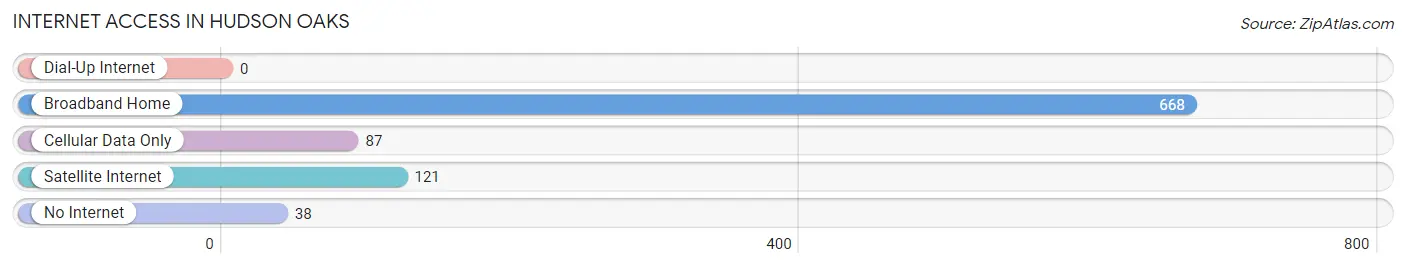
| Internet Type | # Households | % Households |
| Dial-Up Internet | 0 | 0.0% |
| Broadband Home | 668 | 76.9% |
| Cellular Data Only | 87 | 10.0% |
| Satellite Internet | 121 | 13.9% |
| No Internet | 38 | 4.4% |
| Total | 869 | 100.0% |
Hudson Oaks Summary
Hudson Oaks is a small city located in Parker County, Texas, United States. It is situated about 25 miles west of Fort Worth and is part of the Dallas-Fort Worth-Arlington metropolitan area. The city has a population of 2,845 as of the 2010 census.
History
Hudson Oaks was founded in 1854 by William Hudson, who purchased land in the area and built a trading post. The town was originally known as Hudson's Crossing, but the name was changed to Hudson Oaks in 1876. The town was incorporated in 1952.
Geography
Hudson Oaks is located at 32°45'25" North, 97°41'45" West (32.756944, -97.695833). The city has a total area of 2.2 square miles, all of which is land.
Economy
Hudson Oaks is primarily a bedroom community, with most of its residents commuting to nearby cities for work. The city is home to several businesses, including a convenience store, a gas station, a restaurant, and a few other small businesses.
Demographics
As of the 2010 census, there were 2,845 people, 1,072 households, and 817 families residing in the city. The population density was 1,288.6 people per square mile. The racial makeup of the city was 92.2% White, 0.7% African American, 0.7% Native American, 0.7% Asian, 0.1% Pacific Islander, 4.2% from other races, and 1.5% from two or more races. Hispanic or Latino of any race were 8.3% of the population.
The median income for a household in the city was $50,938, and the median income for a family was $60,000. The per capita income for the city was $25,945. About 6.2% of families and 8.2% of the population were below the poverty line, including 10.2% of those under age 18 and 6.2% of those age 65 or over.
Conclusion
Hudson Oaks is a small city located in Parker County, Texas, United States. It is situated about 25 miles west of Fort Worth and is part of the Dallas-Fort Worth-Arlington metropolitan area. The city has a population of 2,845 as of the 2010 census. The city was founded in 1854 and was originally known as Hudson's Crossing, but the name was changed to Hudson Oaks in 1876. The city is primarily a bedroom community, with most of its residents commuting to nearby cities for work. The racial makeup of the city is 92.2% White, 0.7% African American, 0.7% Native American, 0.7% Asian, 0.1% Pacific Islander, 4.2% from other races, and 1.5% from two or more races. The median income for a household in the city was $50,938, and the median income for a family was $60,000.
Common Questions
What is the Total Population of Hudson Oaks?
Total Population of Hudson Oaks is 2,396.
What is the Total Male Population of Hudson Oaks?
Total Male Population of Hudson Oaks is 1,336.
What is the Total Female Population of Hudson Oaks?
Total Female Population of Hudson Oaks is 1,060.
What is the Ratio of Males per 100 Females in Hudson Oaks?
There are 126.04 Males per 100 Females in Hudson Oaks.
What is the Ratio of Females per 100 Males in Hudson Oaks?
There are 79.34 Females per 100 Males in Hudson Oaks.
What is the Median Population Age in Hudson Oaks?
Median Population Age in Hudson Oaks is 40.9 Years.
What is the Average Family Size in Hudson Oaks
Average Family Size in Hudson Oaks is 3.2 People.
What is the Average Household Size in Hudson Oaks
Average Household Size in Hudson Oaks is 2.8 People.
What is Per Capita Income in Hudson Oaks?
Per Capita income in Hudson Oaks is $54,041.
What is the Median Family Income in Hudson Oaks?
Median Family Income in Hudson Oaks is $139,569.
What is the Median Household income in Hudson Oaks?
Median Household Income in Hudson Oaks is $125,795.
What is Income or Wage Gap in Hudson Oaks?
Income or Wage Gap in Hudson Oaks is 38.7%.
Women in Hudson Oaks earn 61.3 cents for every dollar earned by a man.
What is Inequality or Gini Index in Hudson Oaks?
Inequality or Gini Index in Hudson Oaks is 0.37.
How Large is the Labor Force in Hudson Oaks?
There are 1,187 People in the Labor Forcein in Hudson Oaks.
What is the Percentage of People in the Labor Force in Hudson Oaks?
63.7% of People are in the Labor Force in Hudson Oaks.
What is the Unemployment Rate in Hudson Oaks?
Unemployment Rate in Hudson Oaks is 2.6%.