Lakeside town Tarrant County, TX
Lakeside town Tarrant County Overview
1,898
TOTAL POPULATION
932
MALE POPULATION
966
FEMALE POPULATION
96.48
MALES / 100 FEMALES
103.65
FEMALES / 100 MALES
39.1
MEDIAN AGE
3.2
AVG FAMILY SIZE
2.9
AVG HOUSEHOLD SIZE
$43,214
PER CAPITA INCOME
$114,412
AVG FAMILY INCOME
$94,375
AVG HOUSEHOLD INCOME
56.9%
WAGE / INCOME GAP [ % ]
43.1¢/ $1
WAGE / INCOME GAP [ $ ]
0.42
INEQUALITY / GINI INDEX
981
LABOR FORCE [ PEOPLE ]
67.3%
PERCENT IN LABOR FORCE
2.4%
UNEMPLOYMENT RATE
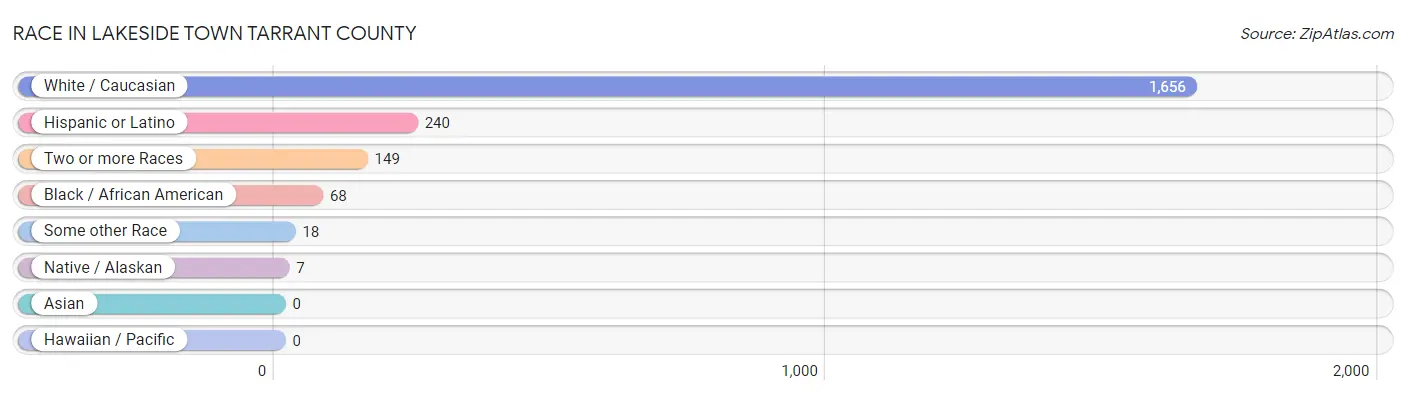
Race in Lakeside town Tarrant County
The most populous races in Lakeside town Tarrant County are White / Caucasian (1,656 | 87.3%), Hispanic or Latino (240 | 12.6%), and Two or more Races (149 | 7.9%).
| Race | # Population | % Population |
| Asian | 0 | 0.0% |
| Black / African American | 68 | 3.6% |
| Hawaiian / Pacific | 0 | 0.0% |
| Hispanic or Latino | 240 | 12.6% |
| Native / Alaskan | 7 | 0.4% |
| White / Caucasian | 1,656 | 87.3% |
| Two or more Races | 149 | 7.9% |
| Some other Race | 18 | 0.9% |
| Total | 1,898 | 100.0% |
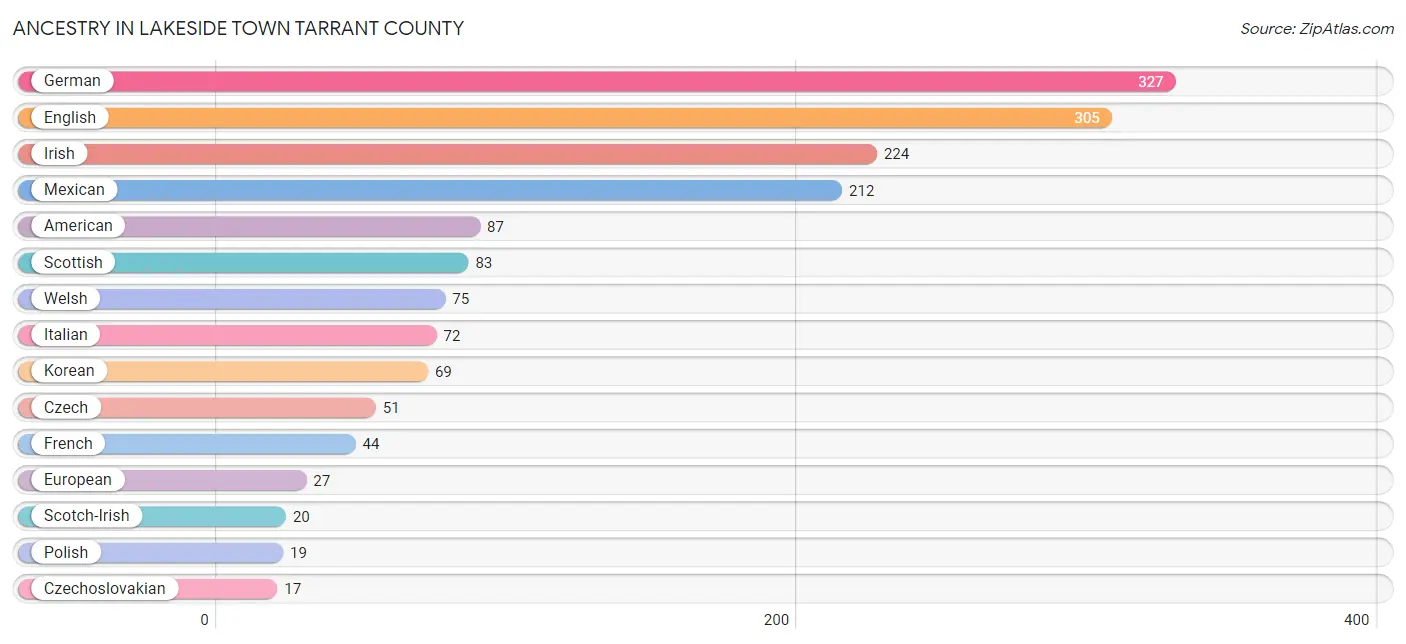
Ancestry in Lakeside town Tarrant County
The most populous ancestries reported in Lakeside town Tarrant County are German (327 | 17.2%), English (305 | 16.1%), Irish (224 | 11.8%), Mexican (212 | 11.2%), and American (87 | 4.6%), together accounting for 60.8% of all Lakeside town Tarrant County residents.
| Ancestry | # Population | % Population |
| American | 87 | 4.6% |
| Blackfeet | 8 | 0.4% |
| Choctaw | 10 | 0.5% |
| Comanche | 8 | 0.4% |
| Czech | 51 | 2.7% |
| Czechoslovakian | 17 | 0.9% |
| Dutch | 17 | 0.9% |
| English | 305 | 16.1% |
| European | 27 | 1.4% |
| Finnish | 6 | 0.3% |
| French | 44 | 2.3% |
| French Canadian | 3 | 0.2% |
| German | 327 | 17.2% |
| Greek | 3 | 0.2% |
| Iranian | 12 | 0.6% |
| Irish | 224 | 11.8% |
| Italian | 72 | 3.8% |
| Korean | 69 | 3.6% |
| Laotian | 4 | 0.2% |
| Mexican | 212 | 11.2% |
| Norwegian | 5 | 0.3% |
| Polish | 19 | 1.0% |
| Puerto Rican | 13 | 0.7% |
| Russian | 5 | 0.3% |
| Scandinavian | 12 | 0.6% |
| Scotch-Irish | 20 | 1.1% |
| Scottish | 83 | 4.4% |
| Spanish | 4 | 0.2% |
| Swedish | 14 | 0.7% |
| Swiss | 5 | 0.3% |
| Welsh | 75 | 4.0% |
| Yugoslavian | 2 | 0.1% | View All 32 Rows |
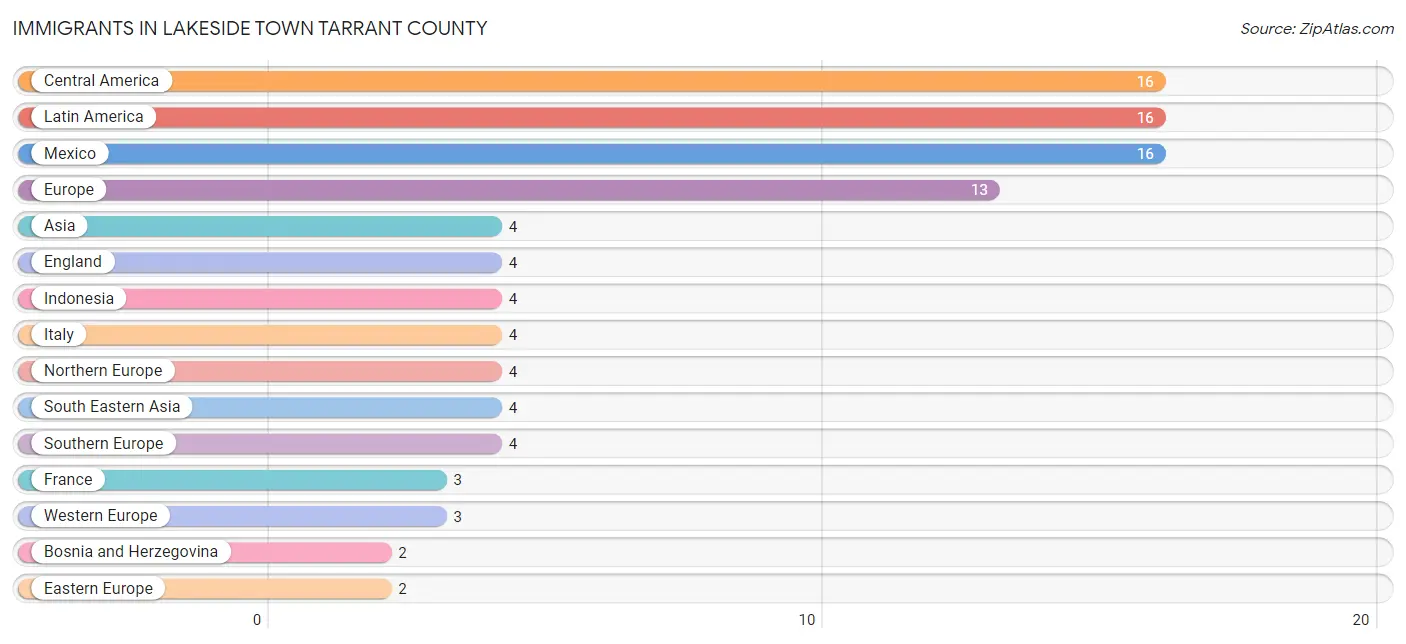
Immigrants in Lakeside town Tarrant County
The most numerous immigrant groups reported in Lakeside town Tarrant County came from Central America (16 | 0.8%), Latin America (16 | 0.8%), Mexico (16 | 0.8%), Europe (13 | 0.7%), and Asia (4 | 0.2%), together accounting for 3.4% of all Lakeside town Tarrant County residents.
| Immigration Origin | # Population | % Population |
| Asia | 4 | 0.2% |
| Bosnia and Herzegovina | 2 | 0.1% |
| Central America | 16 | 0.8% |
| Eastern Europe | 2 | 0.1% |
| England | 4 | 0.2% |
| Europe | 13 | 0.7% |
| France | 3 | 0.2% |
| Indonesia | 4 | 0.2% |
| Italy | 4 | 0.2% |
| Latin America | 16 | 0.8% |
| Mexico | 16 | 0.8% |
| Northern Europe | 4 | 0.2% |
| South Eastern Asia | 4 | 0.2% |
| Southern Europe | 4 | 0.2% |
| Western Europe | 3 | 0.2% | View All 15 Rows |
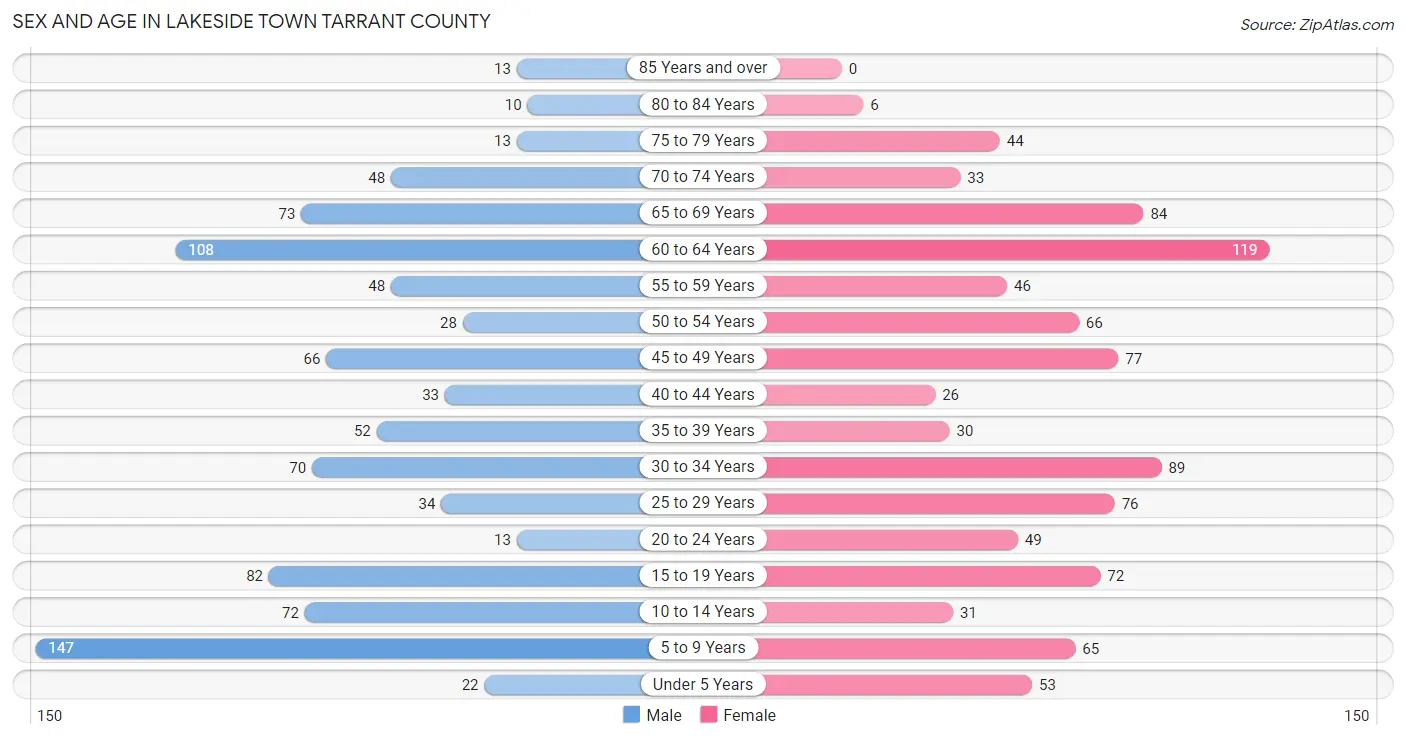
Sex and Age in Lakeside town Tarrant County
Sex and Age in Lakeside town Tarrant County
The most populous age groups in Lakeside town Tarrant County are 5 to 9 Years (147 | 15.8%) for men and 60 to 64 Years (119 | 12.3%) for women.
| Age Bracket | Male | Female |
| Under 5 Years | 22 (2.4%) | 53 (5.5%) |
| 5 to 9 Years | 147 (15.8%) | 65 (6.7%) |
| 10 to 14 Years | 72 (7.7%) | 31 (3.2%) |
| 15 to 19 Years | 82 (8.8%) | 72 (7.4%) |
| 20 to 24 Years | 13 (1.4%) | 49 (5.1%) |
| 25 to 29 Years | 34 (3.6%) | 76 (7.9%) |
| 30 to 34 Years | 70 (7.5%) | 89 (9.2%) |
| 35 to 39 Years | 52 (5.6%) | 30 (3.1%) |
| 40 to 44 Years | 33 (3.5%) | 26 (2.7%) |
| 45 to 49 Years | 66 (7.1%) | 77 (8.0%) |
| 50 to 54 Years | 28 (3.0%) | 66 (6.8%) |
| 55 to 59 Years | 48 (5.1%) | 46 (4.8%) |
| 60 to 64 Years | 108 (11.6%) | 119 (12.3%) |
| 65 to 69 Years | 73 (7.8%) | 84 (8.7%) |
| 70 to 74 Years | 48 (5.1%) | 33 (3.4%) |
| 75 to 79 Years | 13 (1.4%) | 44 (4.5%) |
| 80 to 84 Years | 10 (1.1%) | 6 (0.6%) |
| 85 Years and over | 13 (1.4%) | 0 (0.0%) |
| Total | 932 (100.0%) | 966 (100.0%) |
Families and Households in Lakeside town Tarrant County
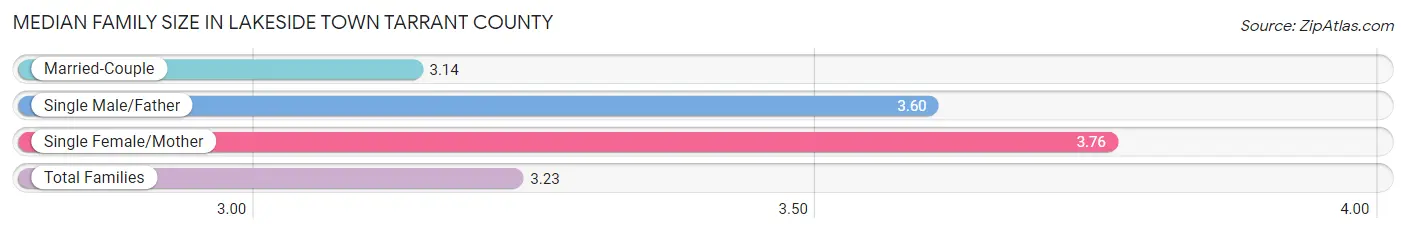
Median Family Size in Lakeside town Tarrant County
The median family size in Lakeside town Tarrant County is 3.23 persons per family, with single female/mother families (46 | 9.3%) accounting for the largest median family size of 3.76 persons per family. On the other hand, married-couple families (418 | 84.6%) represent the smallest median family size with 3.14 persons per family.
| Family Type | # Families | Family Size |
| Married-Couple | 418 (84.6%) | 3.14 |
| Single Male/Father | 30 (6.1%) | 3.60 |
| Single Female/Mother | 46 (9.3%) | 3.76 |
| Total Families | 494 (100.0%) | 3.23 |
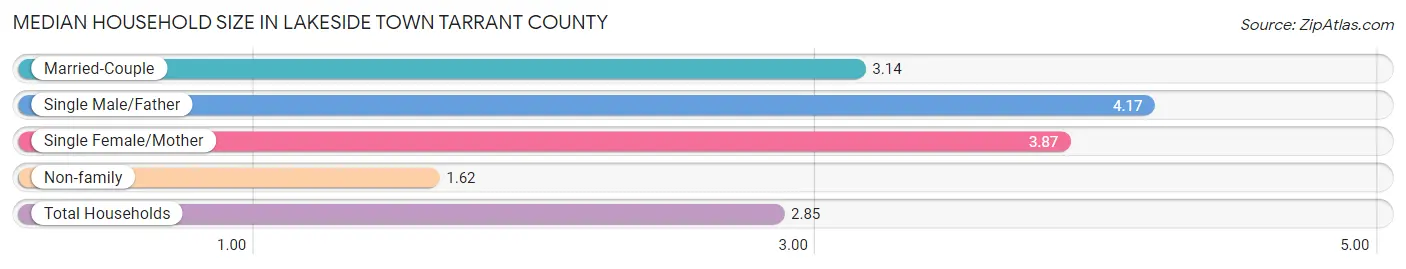
Median Household Size in Lakeside town Tarrant County
The median household size in Lakeside town Tarrant County is 2.85 persons per household, with single male/father households (30 | 4.5%) accounting for the largest median household size of 4.17 persons per household. non-family households (167 | 25.3%) represent the smallest median household size with 1.62 persons per household.
| Household Type | # Households | Household Size |
| Married-Couple | 418 (63.2%) | 3.14 |
| Single Male/Father | 30 (4.5%) | 4.17 |
| Single Female/Mother | 46 (7.0%) | 3.87 |
| Non-family | 167 (25.3%) | 1.62 |
| Total Households | 661 (100.0%) | 2.85 |
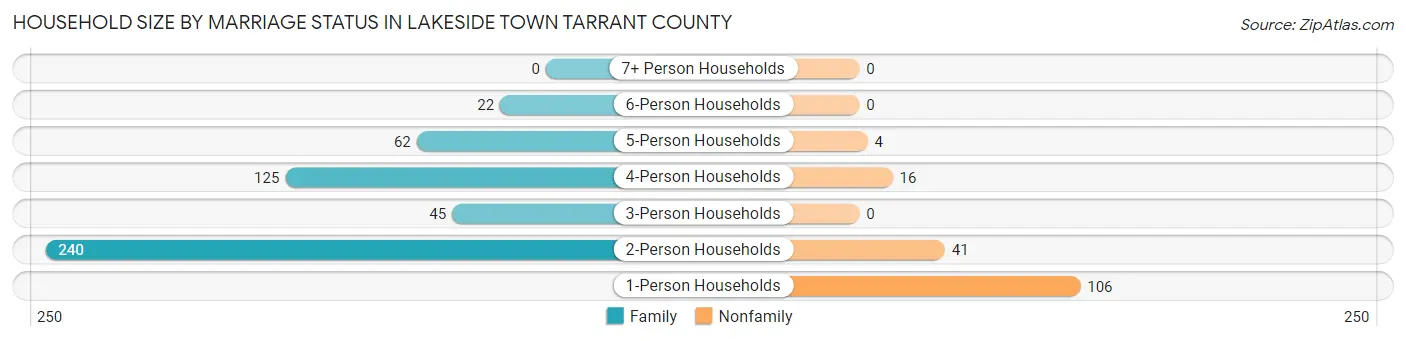
Household Size by Marriage Status in Lakeside town Tarrant County
Out of a total of 661 households in Lakeside town Tarrant County, 494 (74.7%) are family households, while 167 (25.3%) are nonfamily households. The most numerous type of family households are 2-person households, comprising 240, and the most common type of nonfamily households are 1-person households, comprising 106.
| Household Size | Family Households | Nonfamily Households |
| 1-Person Households | - | 106 (16.0%) |
| 2-Person Households | 240 (36.3%) | 41 (6.2%) |
| 3-Person Households | 45 (6.8%) | 0 (0.0%) |
| 4-Person Households | 125 (18.9%) | 16 (2.4%) |
| 5-Person Households | 62 (9.4%) | 4 (0.6%) |
| 6-Person Households | 22 (3.3%) | 0 (0.0%) |
| 7+ Person Households | 0 (0.0%) | 0 (0.0%) |
| Total | 494 (74.7%) | 167 (25.3%) |
Female Fertility in Lakeside town Tarrant County
Fertility by Age in Lakeside town Tarrant County
| Age Bracket | Women with Births | Births / 1,000 Women |
| 15 to 19 years | 0 (0.0%) | 0.0 |
| 20 to 34 years | 0 (0.0%) | 0.0 |
| 35 to 50 years | 0 (0.0%) | 0.0 |
| Total | 0 (0.0%) | 0.0 |
Fertility by Age by Marriage Status in Lakeside town Tarrant County
| Age Bracket | Married | Unmarried |
| 15 to 19 years | 0 (0.0%) | 0 (0.0%) |
| 20 to 34 years | 0 (0.0%) | 0 (0.0%) |
| 35 to 50 years | 0 (0.0%) | 0 (0.0%) |
| Total | 0 (0.0%) | 0 (0.0%) |
Fertility by Education in Lakeside town Tarrant County
| Educational Attainment | Women with Births | Births / 1,000 Women |
| Less than High School | 0 (0.0%) | 0.0 |
| High School Diploma | 0 (0.0%) | 0.0 |
| College or Associate's Degree | 0 (0.0%) | 0.0 |
| Bachelor's Degree | 0 (0.0%) | 0.0 |
| Graduate Degree | 0 (0.0%) | 0.0 |
| Total | 0 (0.0%) | 0.0 |
Fertility by Education by Marriage Status in Lakeside town Tarrant County
| Educational Attainment | Married | Unmarried |
| Less than High School | 0 (0.0%) | 0 (0.0%) |
| High School Diploma | 0 (0.0%) | 0 (0.0%) |
| College or Associate's Degree | 0 (0.0%) | 0 (0.0%) |
| Bachelor's Degree | 0 (0.0%) | 0 (0.0%) |
| Graduate Degree | 0 (0.0%) | 0 (0.0%) |
| Total | 0 (0.0%) | 0 (0.0%) |
Income in Lakeside town Tarrant County
Income Overview in Lakeside town Tarrant County
Per Capita Income in Lakeside town Tarrant County is $43,214, while median incomes of families and households are $114,412 and $94,375 respectively.
| Characteristic | Number | Measure |
| Per Capita Income | 1,898 | $43,214 |
| Median Family Income | 494 | $114,412 |
| Mean Family Income | 494 | $147,386 |
| Median Household Income | 661 | $94,375 |
| Mean Household Income | 661 | $124,355 |
| Income Deficit | 494 | $0 |
| Wage / Income Gap (%) | 1,898 | 56.92% |
| Wage / Income Gap ($) | 1,898 | 43.08¢ per $1 |
| Gini / Inequality Index | 1,898 | 0.42 |
Earnings by Sex in Lakeside town Tarrant County
Average Earnings in Lakeside town Tarrant County are $44,694, $63,250 for men and $27,250 for women, a difference of 56.9%.
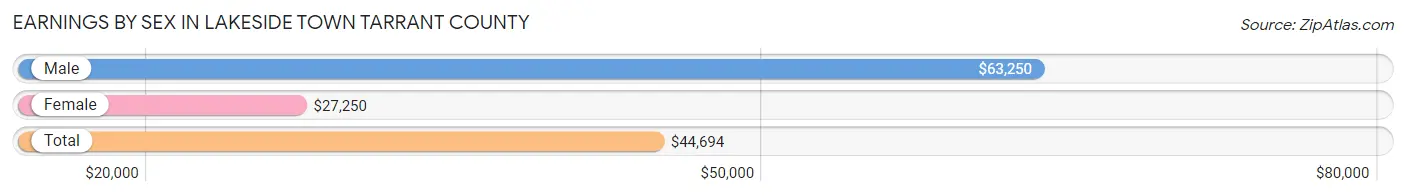
| Sex | Number | Average Earnings |
| Male | 474 (45.2%) | $63,250 |
| Female | 575 (54.8%) | $27,250 |
| Total | 1,049 (100.0%) | $44,694 |
Earnings by Sex by Income Bracket in Lakeside town Tarrant County
The most common earnings brackets in Lakeside town Tarrant County are $100,000+ for men (127 | 26.8%) and $2,499 or less for women (104 | 18.1%).
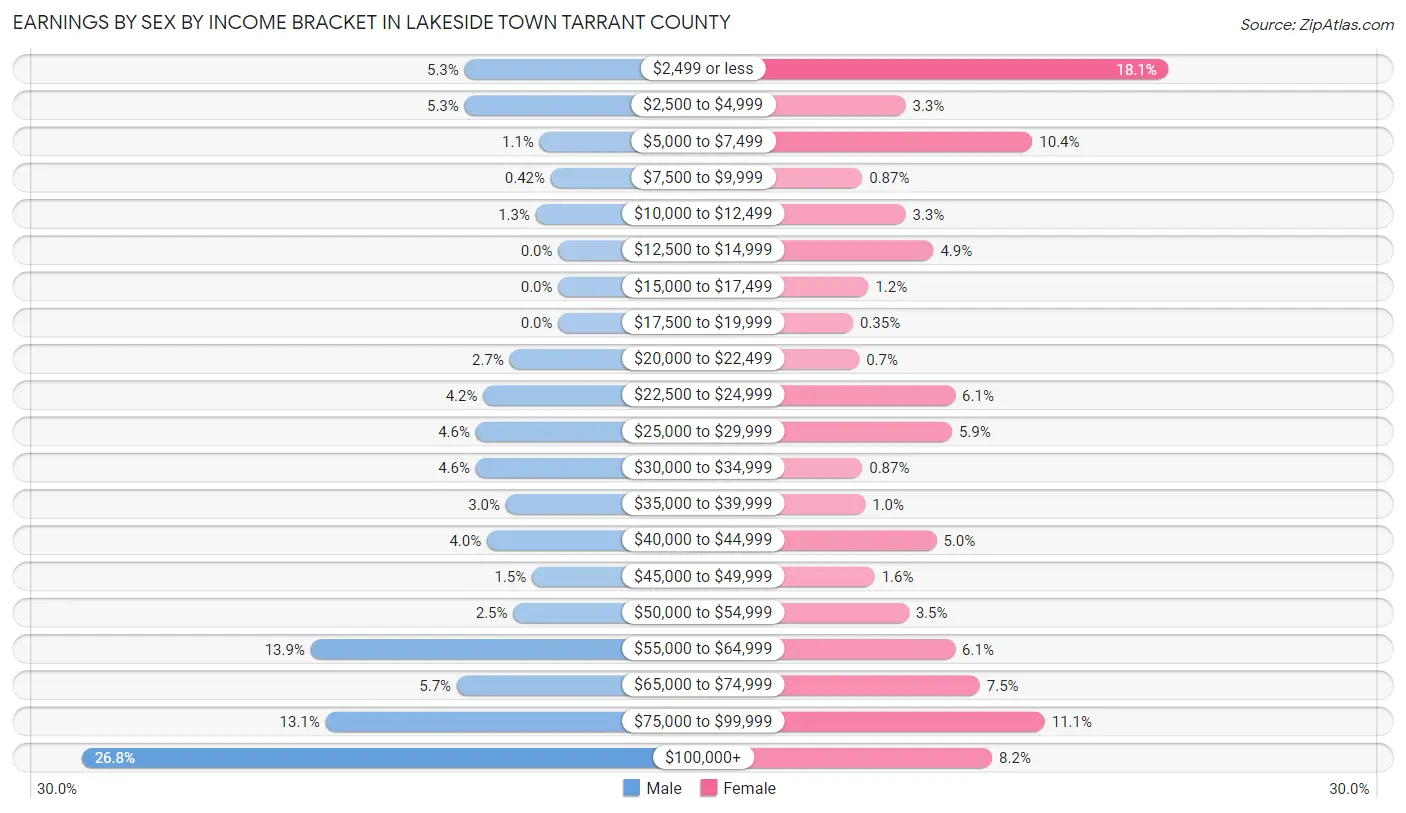
| Income | Male | Female |
| $2,499 or less | 25 (5.3%) | 104 (18.1%) |
| $2,500 to $4,999 | 25 (5.3%) | 19 (3.3%) |
| $5,000 to $7,499 | 5 (1.1%) | 60 (10.4%) |
| $7,500 to $9,999 | 2 (0.4%) | 5 (0.9%) |
| $10,000 to $12,499 | 6 (1.3%) | 19 (3.3%) |
| $12,500 to $14,999 | 0 (0.0%) | 28 (4.9%) |
| $15,000 to $17,499 | 0 (0.0%) | 7 (1.2%) |
| $17,500 to $19,999 | 0 (0.0%) | 2 (0.4%) |
| $20,000 to $22,499 | 13 (2.7%) | 4 (0.7%) |
| $22,500 to $24,999 | 20 (4.2%) | 35 (6.1%) |
| $25,000 to $29,999 | 22 (4.6%) | 34 (5.9%) |
| $30,000 to $34,999 | 22 (4.6%) | 5 (0.9%) |
| $35,000 to $39,999 | 14 (2.9%) | 6 (1.0%) |
| $40,000 to $44,999 | 19 (4.0%) | 29 (5.0%) |
| $45,000 to $49,999 | 7 (1.5%) | 9 (1.6%) |
| $50,000 to $54,999 | 12 (2.5%) | 20 (3.5%) |
| $55,000 to $64,999 | 66 (13.9%) | 35 (6.1%) |
| $65,000 to $74,999 | 27 (5.7%) | 43 (7.5%) |
| $75,000 to $99,999 | 62 (13.1%) | 64 (11.1%) |
| $100,000+ | 127 (26.8%) | 47 (8.2%) |
| Total | 474 (100.0%) | 575 (100.0%) |
Earnings by Sex by Educational Attainment in Lakeside town Tarrant County
Average earnings in Lakeside town Tarrant County are $64,917 for men and $43,405 for women, a difference of 33.1%. Men with an educational attainment of bachelor's degree enjoy the highest average annual earnings of $108,750, while those with high school diploma education earn the least with $55,500. Women with an educational attainment of graduate degree earn the most with the average annual earnings of $79,167, while those with college or associate's degree education have the smallest earnings of $24,732.
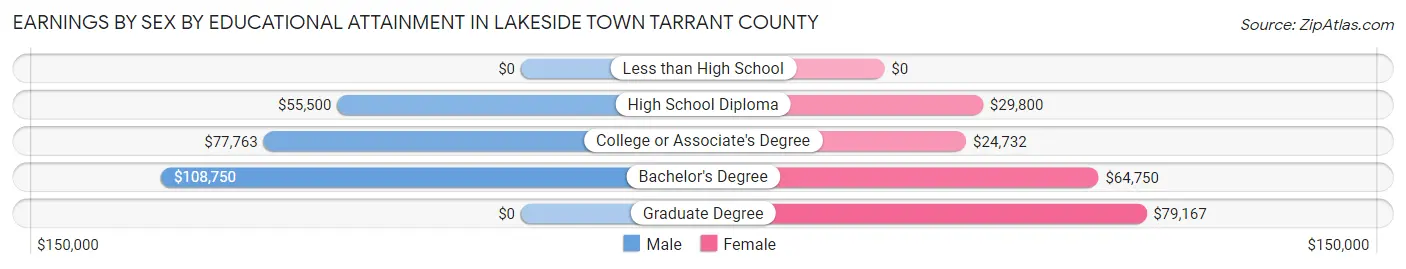
| Educational Attainment | Male Income | Female Income |
| Less than High School | - | - |
| High School Diploma | $55,500 | $29,800 |
| College or Associate's Degree | $77,763 | $24,732 |
| Bachelor's Degree | $108,750 | $64,750 |
| Graduate Degree | - | - |
| Total | $64,917 | $43,405 |
Family Income in Lakeside town Tarrant County
Family Income Brackets in Lakeside town Tarrant County
According to the Lakeside town Tarrant County family income data, there are 136 families falling into the $100,000 to $149,999 income range, which is the most common income bracket and makes up 27.5% of all families.
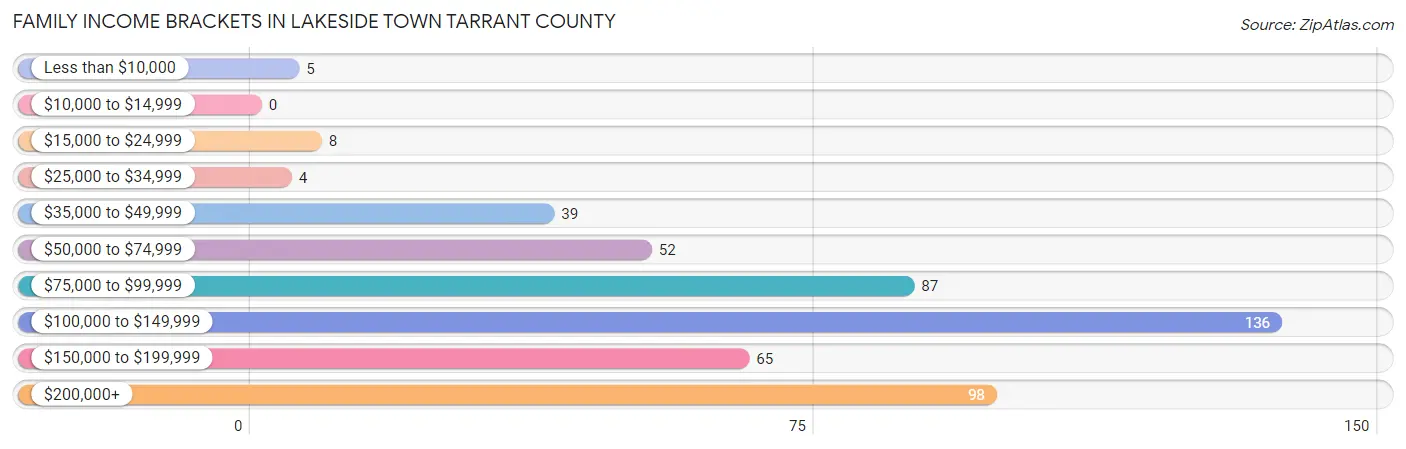
| Income Bracket | # Families | % Families |
| Less than $10,000 | 5 | 1.0% |
| $10,000 to $14,999 | 0 | 0.0% |
| $15,000 to $24,999 | 8 | 1.6% |
| $25,000 to $34,999 | 4 | 0.8% |
| $35,000 to $49,999 | 39 | 7.9% |
| $50,000 to $74,999 | 52 | 10.5% |
| $75,000 to $99,999 | 87 | 17.6% |
| $100,000 to $149,999 | 136 | 27.5% |
| $150,000 to $199,999 | 65 | 13.2% |
| $200,000+ | 98 | 19.8% |
Family Income by Famaliy Size in Lakeside town Tarrant County
5-person families (48 | 9.7%) account for the highest median family income in Lakeside town Tarrant County with $162,667 per family, while 2-person families (240 | 48.6%) have the highest median income of $58,750 per family member.
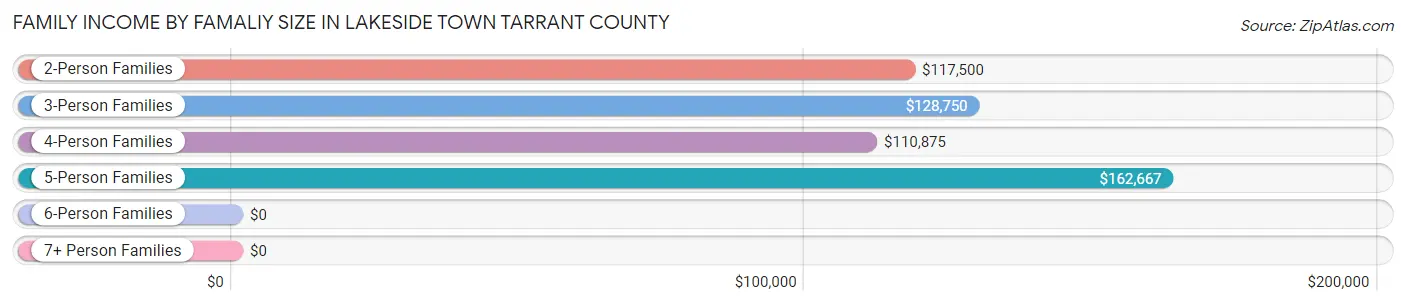
| Income Bracket | # Families | Median Income |
| 2-Person Families | 240 (48.6%) | $117,500 |
| 3-Person Families | 50 (10.1%) | $128,750 |
| 4-Person Families | 134 (27.1%) | $110,875 |
| 5-Person Families | 48 (9.7%) | $162,667 |
| 6-Person Families | 22 (4.4%) | $0 |
| 7+ Person Families | 0 (0.0%) | $0 |
| Total | 494 (100.0%) | $114,412 |
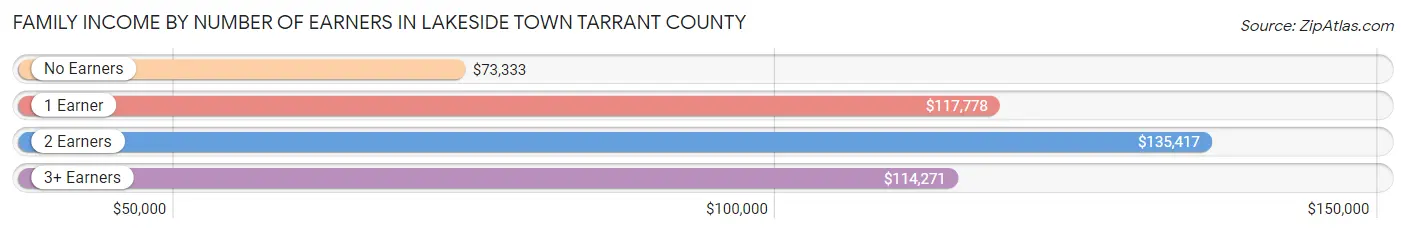
Family Income by Number of Earners in Lakeside town Tarrant County
The median family income in Lakeside town Tarrant County is $114,412, with families comprising 2 earners (199) having the highest median family income of $135,417, while families with no earners (66) have the lowest median family income of $73,333, accounting for 40.3% and 13.4% of families, respectively.
| Number of Earners | # Families | Median Income |
| No Earners | 66 (13.4%) | $73,333 |
| 1 Earner | 152 (30.8%) | $117,778 |
| 2 Earners | 199 (40.3%) | $135,417 |
| 3+ Earners | 77 (15.6%) | $114,271 |
| Total | 494 (100.0%) | $114,412 |
Household Income in Lakeside town Tarrant County
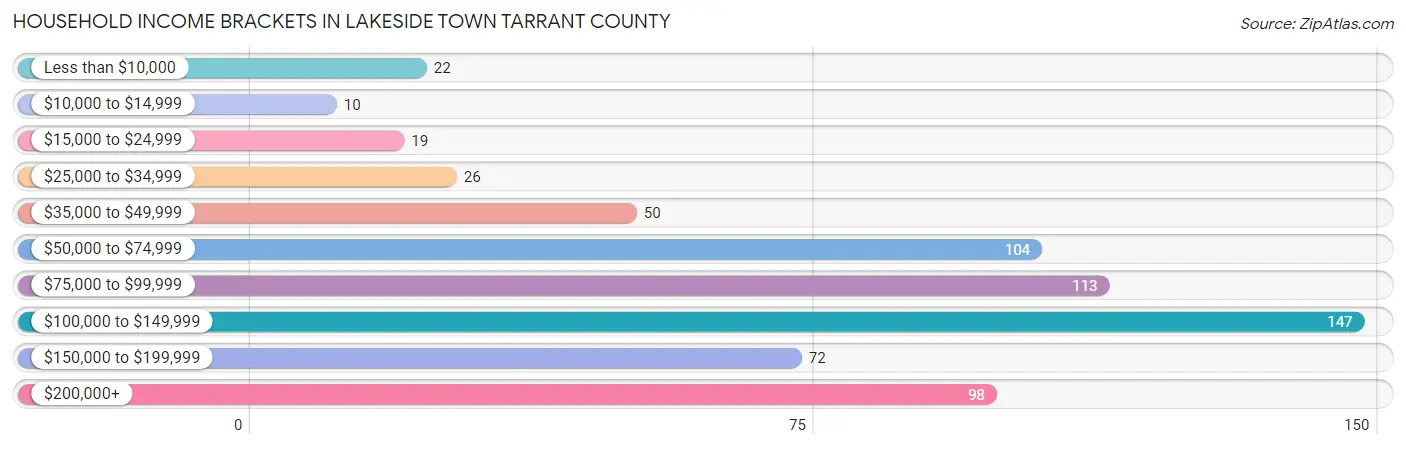
Household Income Brackets in Lakeside town Tarrant County
With 147 households falling in the category, the $100,000 to $149,999 income range is the most frequent in Lakeside town Tarrant County, accounting for 22.2% of all households. In contrast, only 10 households (1.5%) fall into the $10,000 to $14,999 income bracket, making it the least populous group.
| Income Bracket | # Households | % Households |
| Less than $10,000 | 22 | 3.3% |
| $10,000 to $14,999 | 10 | 1.5% |
| $15,000 to $24,999 | 19 | 2.9% |
| $25,000 to $34,999 | 26 | 3.9% |
| $35,000 to $49,999 | 50 | 7.6% |
| $50,000 to $74,999 | 104 | 15.7% |
| $75,000 to $99,999 | 113 | 17.1% |
| $100,000 to $149,999 | 147 | 22.2% |
| $150,000 to $199,999 | 72 | 10.9% |
| $200,000+ | 98 | 14.8% |
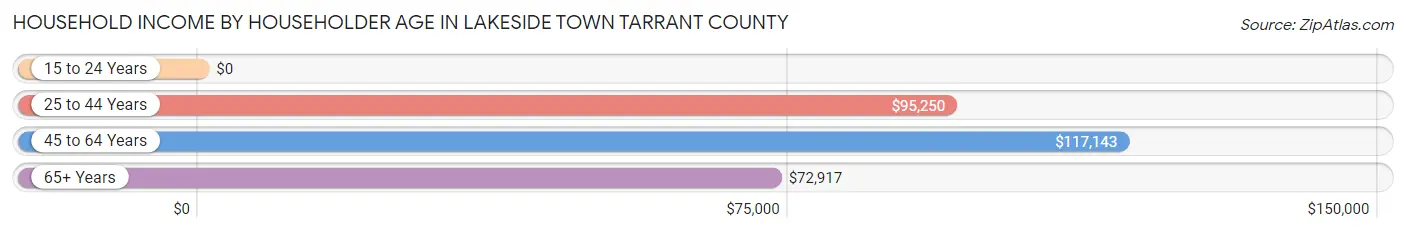
Household Income by Householder Age in Lakeside town Tarrant County
The median household income in Lakeside town Tarrant County is $94,375, with the highest median household income of $117,143 found in the 45 to 64 years age bracket for the primary householder. A total of 300 households (45.4%) fall into this category.
| Income Bracket | # Households | Median Income |
| 15 to 24 Years | 0 (0.0%) | $0 |
| 25 to 44 Years | 177 (26.8%) | $95,250 |
| 45 to 64 Years | 300 (45.4%) | $117,143 |
| 65+ Years | 184 (27.8%) | $72,917 |
| Total | 661 (100.0%) | $94,375 |
Poverty in Lakeside town Tarrant County
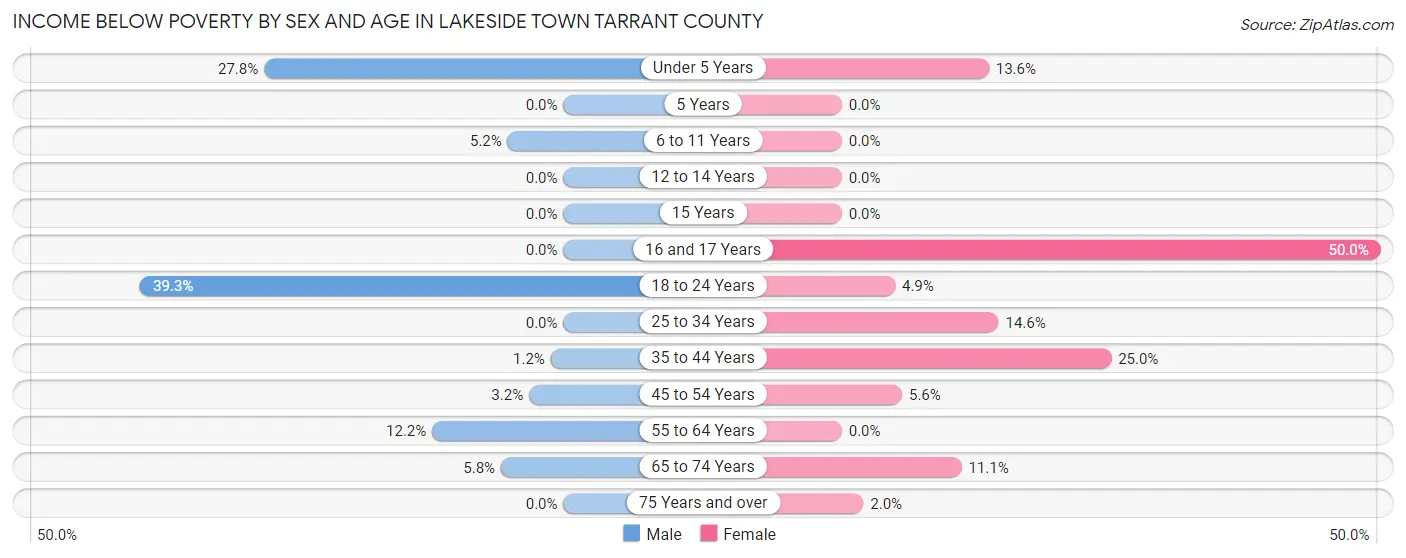
Income Below Poverty by Sex and Age in Lakeside town Tarrant County
With 5.7% poverty level for males and 9.1% for females among the residents of Lakeside town Tarrant County, 18 to 24 year old males and 16 and 17 year old females are the most vulnerable to poverty, with 11 males (39.3%) and 17 females (50.0%) in their respective age groups living below the poverty level.
| Age Bracket | Male | Female |
| Under 5 Years | 5 (27.8%) | 6 (13.6%) |
| 5 Years | 0 (0.0%) | 0 (0.0%) |
| 6 to 11 Years | 6 (5.2%) | 0 (0.0%) |
| 12 to 14 Years | 0 (0.0%) | 0 (0.0%) |
| 15 Years | 0 (0.0%) | 0 (0.0%) |
| 16 and 17 Years | 0 (0.0%) | 17 (50.0%) |
| 18 to 24 Years | 11 (39.3%) | 4 (4.9%) |
| 25 to 34 Years | 0 (0.0%) | 24 (14.5%) |
| 35 to 44 Years | 1 (1.2%) | 14 (25.0%) |
| 45 to 54 Years | 3 (3.2%) | 8 (5.6%) |
| 55 to 64 Years | 19 (12.2%) | 0 (0.0%) |
| 65 to 74 Years | 7 (5.8%) | 13 (11.1%) |
| 75 Years and over | 0 (0.0%) | 1 (2.0%) |
| Total | 52 (5.7%) | 87 (9.1%) |
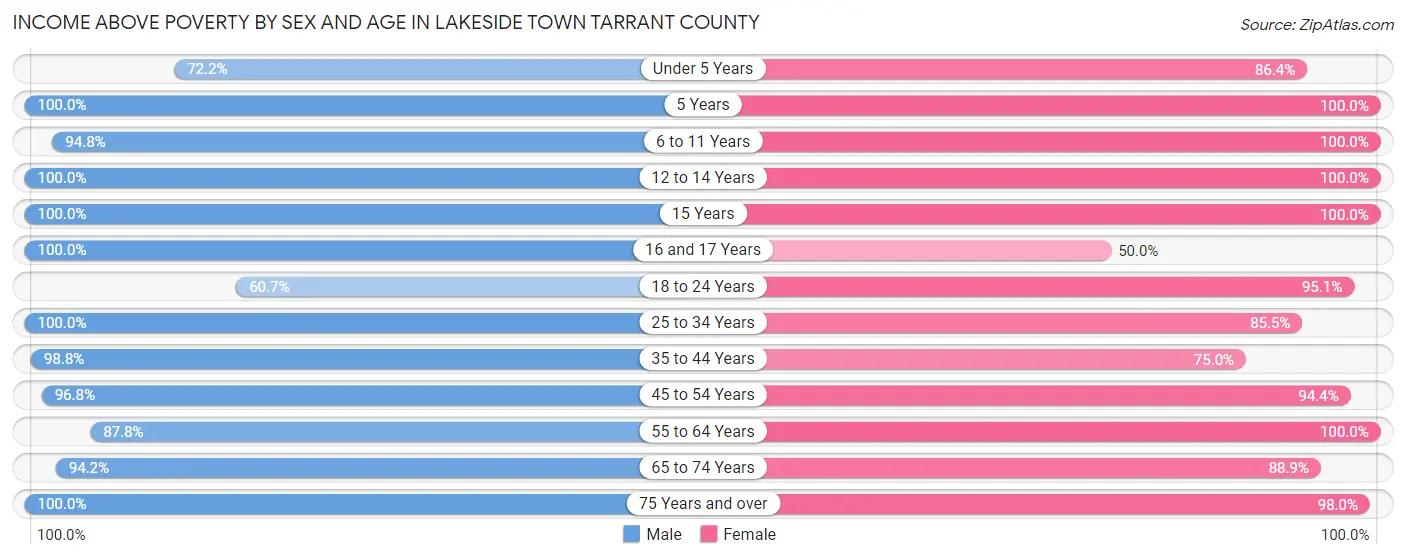
Income Above Poverty by Sex and Age in Lakeside town Tarrant County
According to the poverty statistics in Lakeside town Tarrant County, males aged 5 years and females aged 5 years are the age groups that are most secure financially, with 100.0% of males and 100.0% of females in these age groups living above the poverty line.
| Age Bracket | Male | Female |
| Under 5 Years | 13 (72.2%) | 38 (86.4%) |
| 5 Years | 41 (100.0%) | 26 (100.0%) |
| 6 to 11 Years | 110 (94.8%) | 39 (100.0%) |
| 12 to 14 Years | 42 (100.0%) | 31 (100.0%) |
| 15 Years | 45 (100.0%) | 6 (100.0%) |
| 16 and 17 Years | 22 (100.0%) | 17 (50.0%) |
| 18 to 24 Years | 17 (60.7%) | 77 (95.1%) |
| 25 to 34 Years | 104 (100.0%) | 141 (85.5%) |
| 35 to 44 Years | 84 (98.8%) | 42 (75.0%) |
| 45 to 54 Years | 91 (96.8%) | 135 (94.4%) |
| 55 to 64 Years | 137 (87.8%) | 165 (100.0%) |
| 65 to 74 Years | 114 (94.2%) | 104 (88.9%) |
| 75 Years and over | 36 (100.0%) | 49 (98.0%) |
| Total | 856 (94.3%) | 870 (90.9%) |
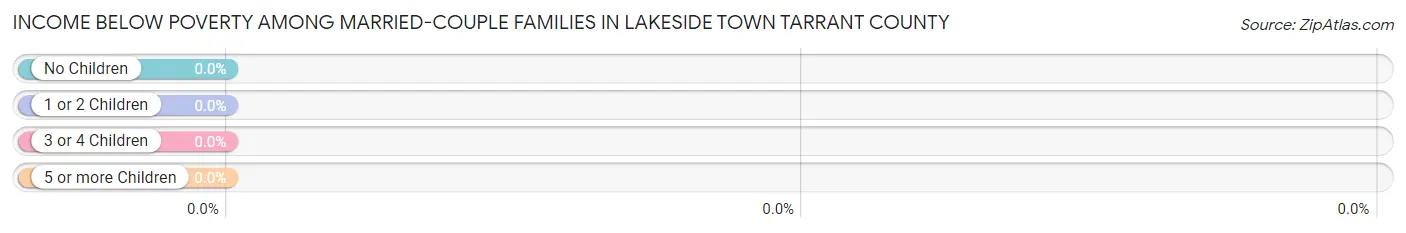
Income Below Poverty Among Married-Couple Families in Lakeside town Tarrant County
| Children | Above Poverty | Below Poverty |
| No Children | 260 (100.0%) | 0 (0.0%) |
| 1 or 2 Children | 126 (100.0%) | 0 (0.0%) |
| 3 or 4 Children | 32 (100.0%) | 0 (0.0%) |
| 5 or more Children | 0 (0.0%) | 0 (0.0%) |
| Total | 418 (100.0%) | 0 (0.0%) |
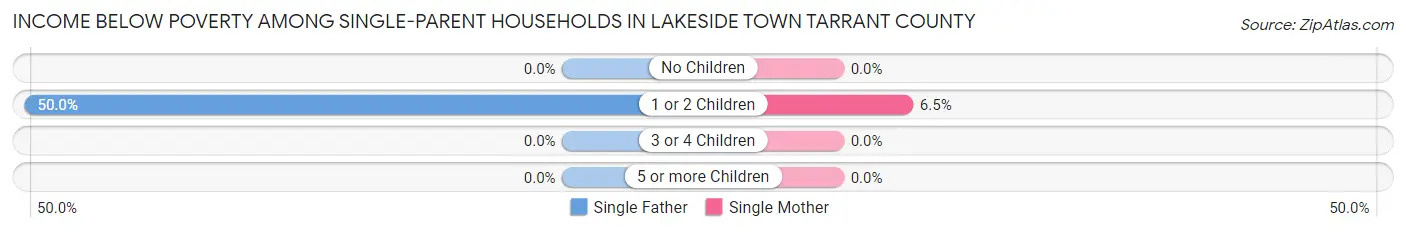
Income Below Poverty Among Single-Parent Households in Lakeside town Tarrant County
According to the poverty data in Lakeside town Tarrant County, 16.7% or 5 single-father households and 4.3% or 2 single-mother households are living below the poverty line. Among single-father households, those with 1 or 2 children have the highest poverty rate, with 5 households (50.0%) experiencing poverty. Likewise, among single-mother households, those with 1 or 2 children have the highest poverty rate, with 2 households (6.5%) falling below the poverty line.
| Children | Single Father | Single Mother |
| No Children | 0 (0.0%) | 0 (0.0%) |
| 1 or 2 Children | 5 (50.0%) | 2 (6.5%) |
| 3 or 4 Children | 0 (0.0%) | 0 (0.0%) |
| 5 or more Children | 0 (0.0%) | 0 (0.0%) |
| Total | 5 (16.7%) | 2 (4.3%) |
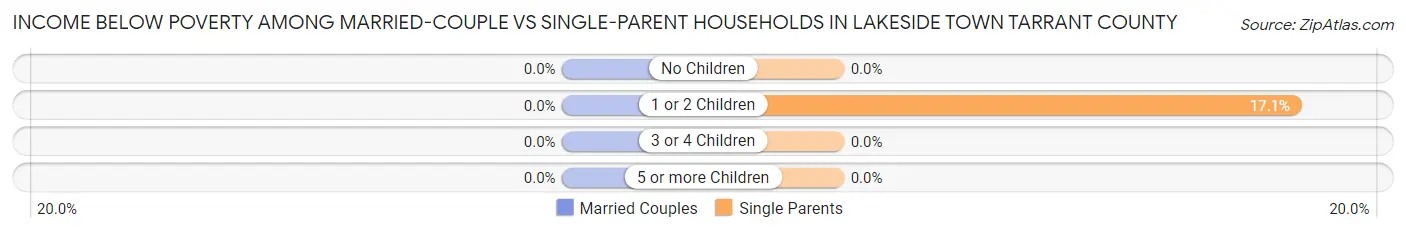
Income Below Poverty Among Married-Couple vs Single-Parent Households in Lakeside town Tarrant County
| Children | Married-Couple Families | Single-Parent Households |
| No Children | 0 (0.0%) | 0 (0.0%) |
| 1 or 2 Children | 0 (0.0%) | 7 (17.1%) |
| 3 or 4 Children | 0 (0.0%) | 0 (0.0%) |
| 5 or more Children | 0 (0.0%) | 0 (0.0%) |
| Total | 0 (0.0%) | 7 (9.2%) |
Employment Characteristics in Lakeside town Tarrant County
Employment by Class of Employer in Lakeside town Tarrant County
Among the 954 employed individuals in Lakeside town Tarrant County, private company employees (523 | 54.8%), self-employed (not incorporated) (164 | 17.2%), and not-for-profit organizations (104 | 10.9%) make up the most common classes of employment.
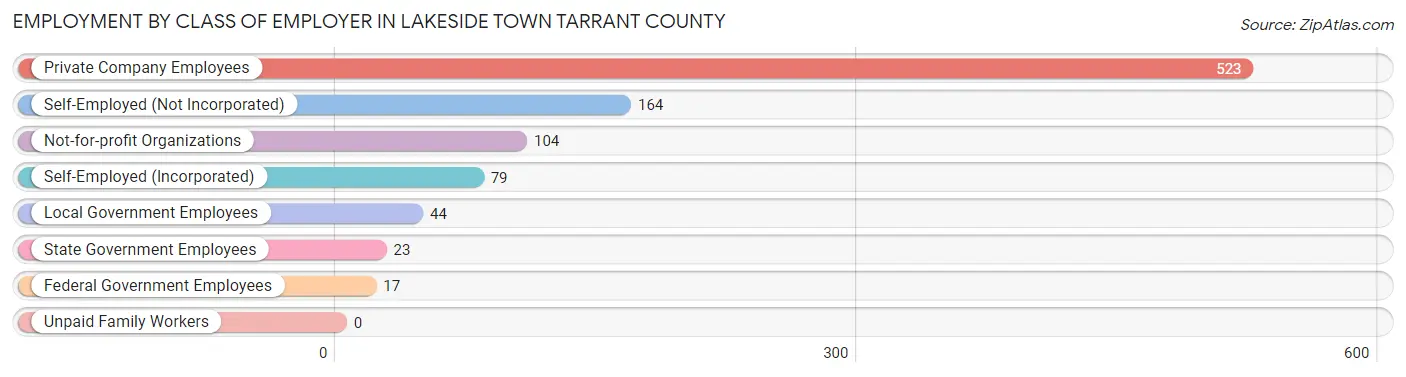
| Employer Class | # Employees | % Employees |
| Private Company Employees | 523 | 54.8% |
| Self-Employed (Incorporated) | 79 | 8.3% |
| Self-Employed (Not Incorporated) | 164 | 17.2% |
| Not-for-profit Organizations | 104 | 10.9% |
| Local Government Employees | 44 | 4.6% |
| State Government Employees | 23 | 2.4% |
| Federal Government Employees | 17 | 1.8% |
| Unpaid Family Workers | 0 | 0.0% |
| Total | 954 | 100.0% |
Employment Status by Age in Lakeside town Tarrant County
According to the labor force statistics for Lakeside town Tarrant County, out of the total population over 16 years of age (1,457), 67.3% or 981 individuals are in the labor force, with 2.4% or 24 of them unemployed. The age group with the highest labor force participation rate is 30 to 34 years, with 100.0% or 159 individuals in the labor force. Within the labor force, the 55 to 59 years age range has the highest percentage of unemployed individuals, with 11.4% or 9 of them being unemployed.
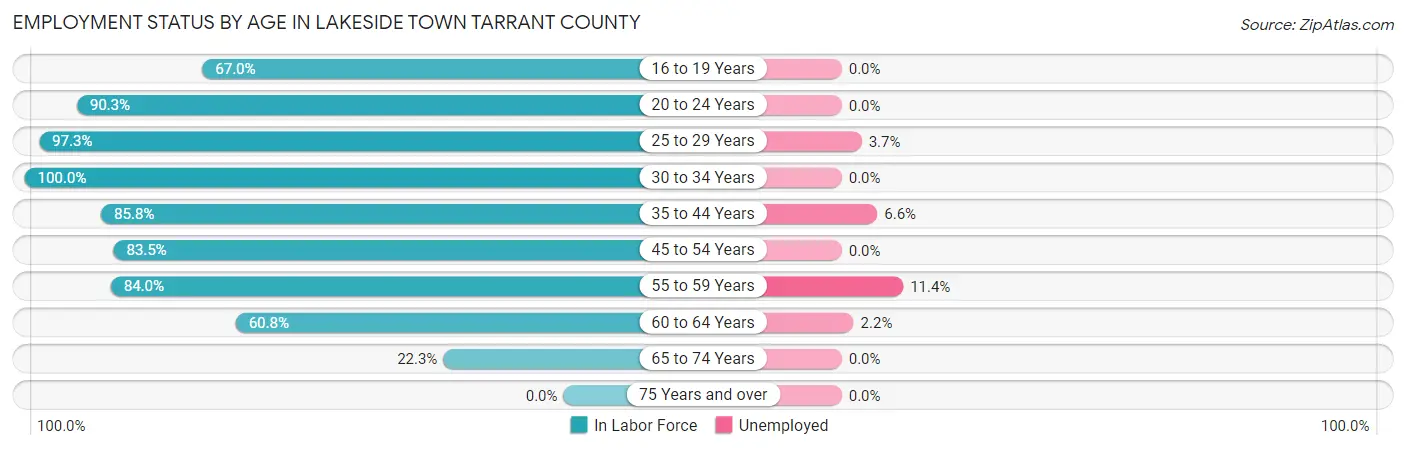
| Age Bracket | In Labor Force | Unemployed |
| 16 to 19 Years | 69 (67.0%) | 0 (0.0%) |
| 20 to 24 Years | 56 (90.3%) | 0 (0.0%) |
| 25 to 29 Years | 107 (97.3%) | 4 (3.7%) |
| 30 to 34 Years | 159 (100.0%) | 0 (0.0%) |
| 35 to 44 Years | 121 (85.8%) | 8 (6.6%) |
| 45 to 54 Years | 198 (83.5%) | 0 (0.0%) |
| 55 to 59 Years | 79 (84.0%) | 9 (11.4%) |
| 60 to 64 Years | 138 (60.8%) | 3 (2.2%) |
| 65 to 74 Years | 53 (22.3%) | 0 (0.0%) |
| 75 Years and over | 0 (0.0%) | 0 (0.0%) |
| Total | 981 (67.3%) | 24 (2.4%) |
Employment Status by Educational Attainment in Lakeside town Tarrant County
According to labor force statistics for Lakeside town Tarrant County, 82.9% of individuals (802) out of the total population between 25 and 64 years of age (968) are in the labor force, with 3.0% or 24 of them being unemployed. The group with the highest labor force participation rate are those with the educational attainment of high school diploma, with 91.2% or 248 individuals in the labor force. Within the labor force, individuals with less than high school education have the highest percentage of unemployment, with 6.7% or 2 of them being unemployed.
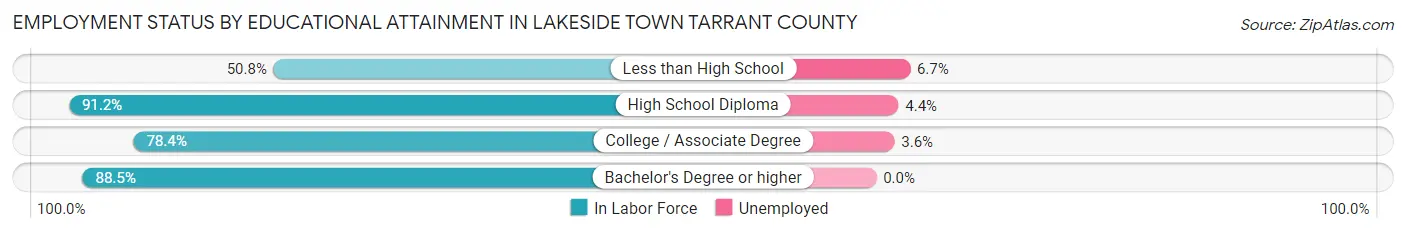
| Educational Attainment | In Labor Force | Unemployed |
| Less than High School | 30 (50.8%) | 4 (6.7%) |
| High School Diploma | 248 (91.2%) | 12 (4.4%) |
| College / Associate Degree | 309 (78.4%) | 14 (3.6%) |
| Bachelor's Degree or higher | 215 (88.5%) | 0 (0.0%) |
| Total | 802 (82.9%) | 29 (3.0%) |
Employment Occupations by Sex in Lakeside town Tarrant County
Management, Business, Science and Arts Occupations
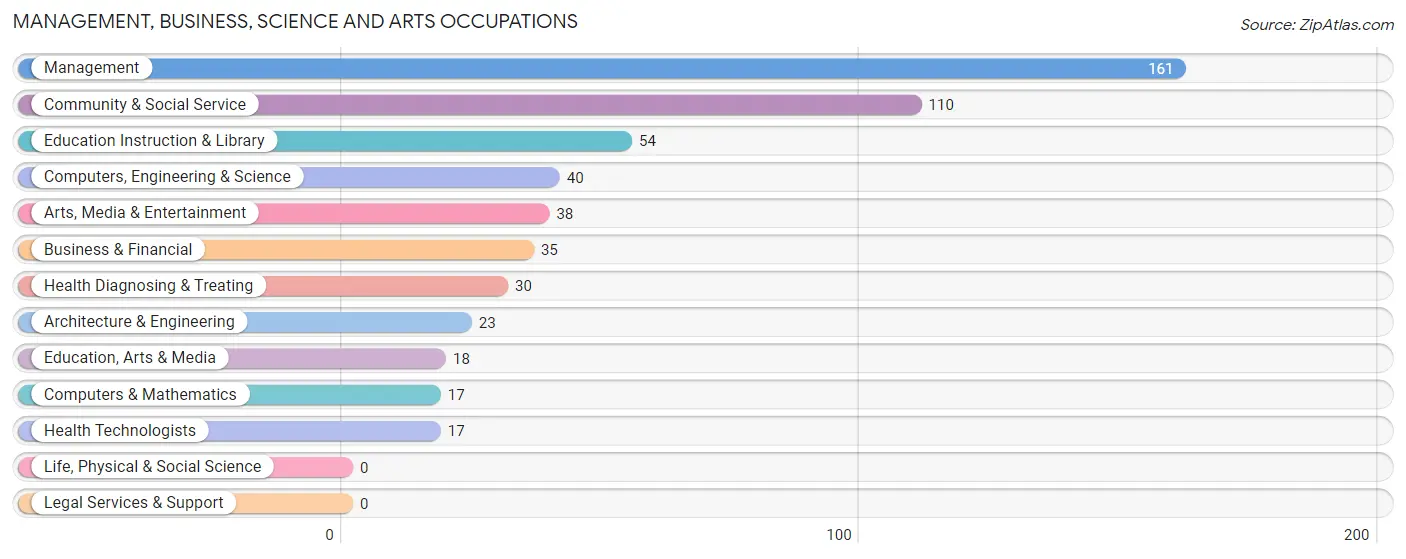
The most common Management, Business, Science and Arts occupations in Lakeside town Tarrant County are Management (161 | 16.8%), Community & Social Service (110 | 11.5%), Education Instruction & Library (54 | 5.7%), Computers, Engineering & Science (40 | 4.2%), and Arts, Media & Entertainment (38 | 4.0%).
Management, Business, Science and Arts Occupations by Sex
Within the Management, Business, Science and Arts occupations in Lakeside town Tarrant County, the most male-oriented occupations are Education, Arts & Media (83.3%), Management (66.5%), and Business & Financial (62.9%), while the most female-oriented occupations are Health Technologists (100.0%), Education Instruction & Library (94.4%), and Health Diagnosing & Treating (86.7%).
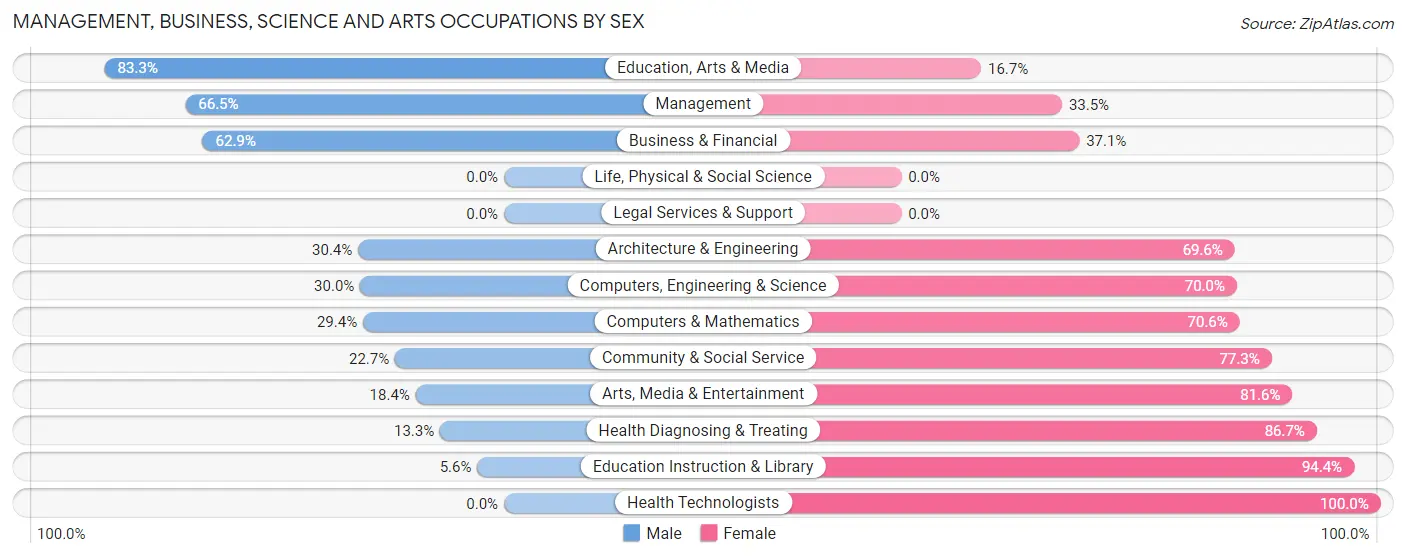
| Occupation | Male | Female |
| Management | 107 (66.5%) | 54 (33.5%) |
| Business & Financial | 22 (62.9%) | 13 (37.1%) |
| Computers, Engineering & Science | 12 (30.0%) | 28 (70.0%) |
| Computers & Mathematics | 5 (29.4%) | 12 (70.6%) |
| Architecture & Engineering | 7 (30.4%) | 16 (69.6%) |
| Life, Physical & Social Science | 0 (0.0%) | 0 (0.0%) |
| Community & Social Service | 25 (22.7%) | 85 (77.3%) |
| Education, Arts & Media | 15 (83.3%) | 3 (16.7%) |
| Legal Services & Support | 0 (0.0%) | 0 (0.0%) |
| Education Instruction & Library | 3 (5.6%) | 51 (94.4%) |
| Arts, Media & Entertainment | 7 (18.4%) | 31 (81.6%) |
| Health Diagnosing & Treating | 4 (13.3%) | 26 (86.7%) |
| Health Technologists | 0 (0.0%) | 17 (100.0%) |
| Total (Category) | 170 (45.2%) | 206 (54.8%) |
| Total (Overall) | 428 (44.8%) | 528 (55.2%) |
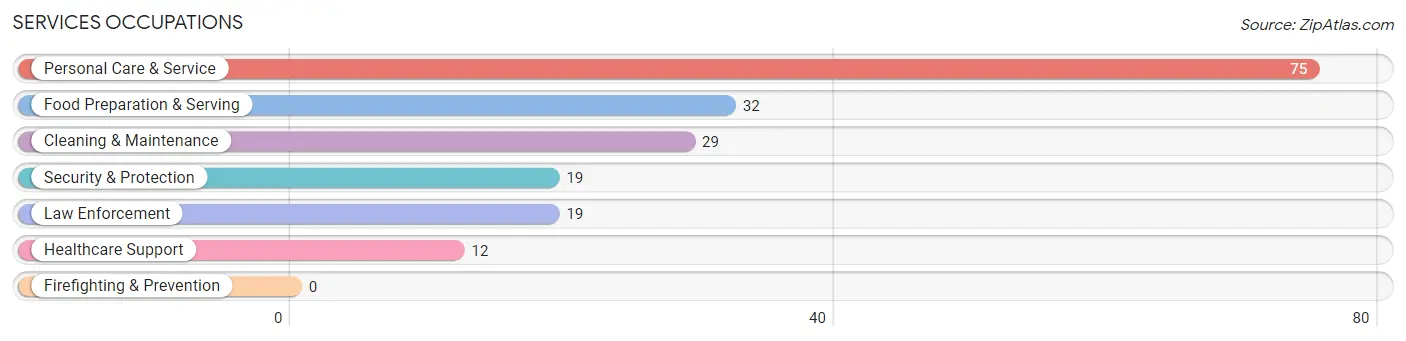
Services Occupations
The most common Services occupations in Lakeside town Tarrant County are Personal Care & Service (75 | 7.9%), Food Preparation & Serving (32 | 3.4%), Cleaning & Maintenance (29 | 3.0%), Security & Protection (19 | 2.0%), and Law Enforcement (19 | 2.0%).
Services Occupations by Sex
Within the Services occupations in Lakeside town Tarrant County, the most male-oriented occupations are Cleaning & Maintenance (89.7%), Healthcare Support (16.7%), and Food Preparation & Serving (9.4%), while the most female-oriented occupations are Security & Protection (100.0%), Law Enforcement (100.0%), and Personal Care & Service (94.7%).
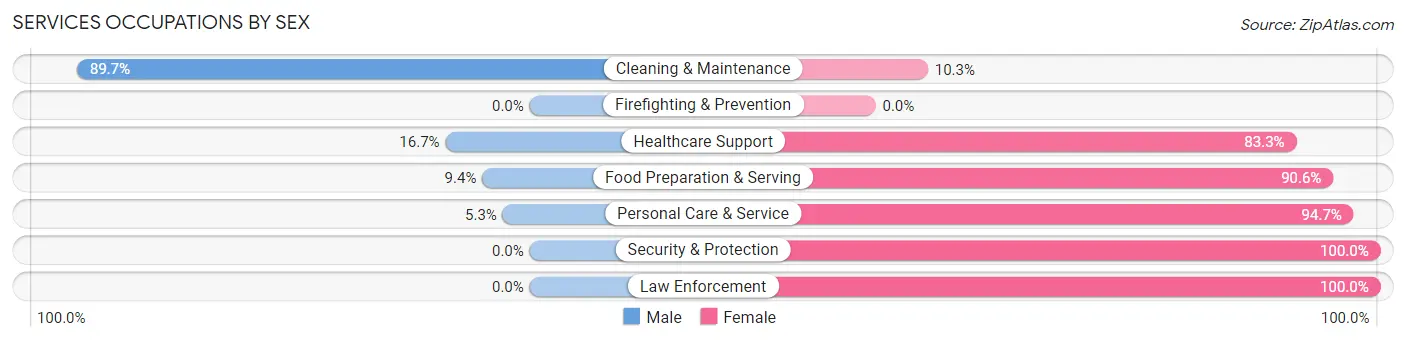
| Occupation | Male | Female |
| Healthcare Support | 2 (16.7%) | 10 (83.3%) |
| Security & Protection | 0 (0.0%) | 19 (100.0%) |
| Firefighting & Prevention | 0 (0.0%) | 0 (0.0%) |
| Law Enforcement | 0 (0.0%) | 19 (100.0%) |
| Food Preparation & Serving | 3 (9.4%) | 29 (90.6%) |
| Cleaning & Maintenance | 26 (89.7%) | 3 (10.3%) |
| Personal Care & Service | 4 (5.3%) | 71 (94.7%) |
| Total (Category) | 35 (21.0%) | 132 (79.0%) |
| Total (Overall) | 428 (44.8%) | 528 (55.2%) |
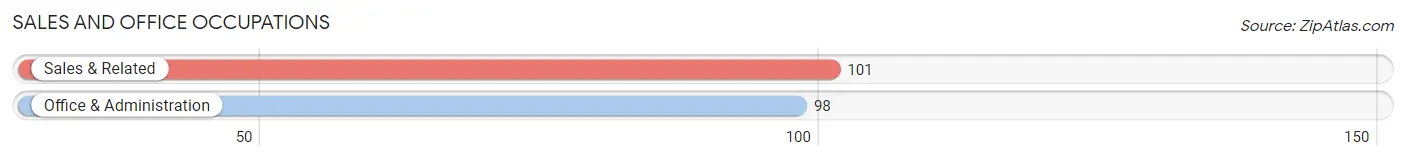
Sales and Office Occupations
The most common Sales and Office occupations in Lakeside town Tarrant County are Sales & Related (101 | 10.6%), and Office & Administration (98 | 10.2%).
Sales and Office Occupations by Sex
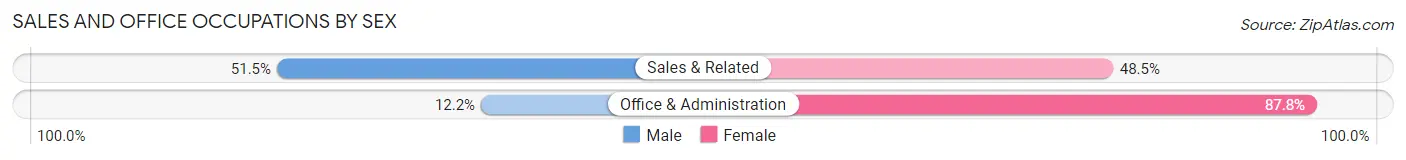
| Occupation | Male | Female |
| Sales & Related | 52 (51.5%) | 49 (48.5%) |
| Office & Administration | 12 (12.2%) | 86 (87.8%) |
| Total (Category) | 64 (32.2%) | 135 (67.8%) |
| Total (Overall) | 428 (44.8%) | 528 (55.2%) |
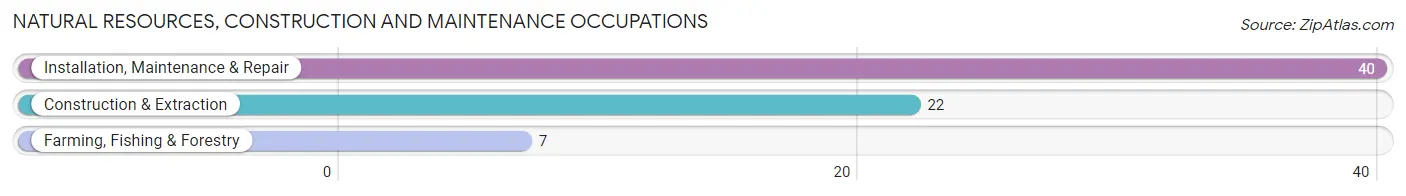
Natural Resources, Construction and Maintenance Occupations
The most common Natural Resources, Construction and Maintenance occupations in Lakeside town Tarrant County are Installation, Maintenance & Repair (40 | 4.2%), Construction & Extraction (22 | 2.3%), and Farming, Fishing & Forestry (7 | 0.7%).
Natural Resources, Construction and Maintenance Occupations by Sex
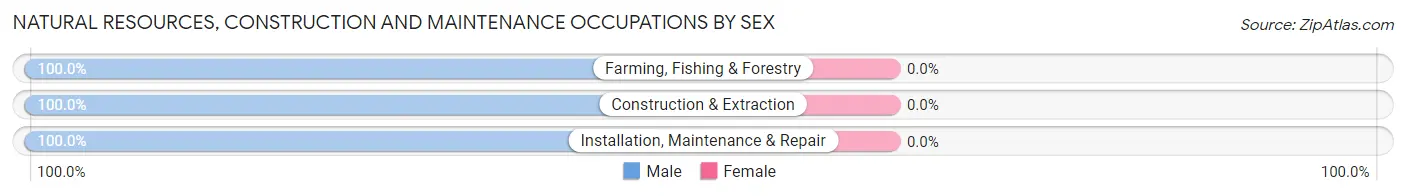
| Occupation | Male | Female |
| Farming, Fishing & Forestry | 7 (100.0%) | 0 (0.0%) |
| Construction & Extraction | 22 (100.0%) | 0 (0.0%) |
| Installation, Maintenance & Repair | 40 (100.0%) | 0 (0.0%) |
| Total (Category) | 69 (100.0%) | 0 (0.0%) |
| Total (Overall) | 428 (44.8%) | 528 (55.2%) |
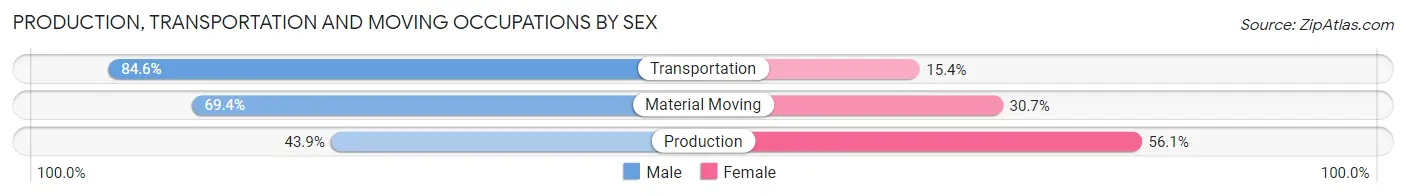
Production, Transportation and Moving Occupations
The most common Production, Transportation and Moving occupations in Lakeside town Tarrant County are Material Moving (62 | 6.5%), Production (57 | 6.0%), and Transportation (26 | 2.7%).
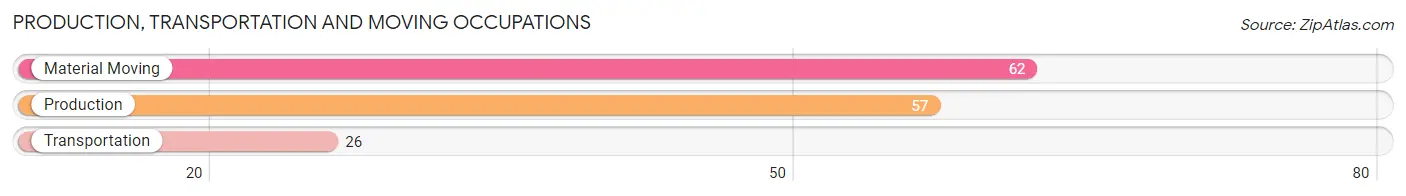
Production, Transportation and Moving Occupations by Sex
| Occupation | Male | Female |
| Production | 25 (43.9%) | 32 (56.1%) |
| Transportation | 22 (84.6%) | 4 (15.4%) |
| Material Moving | 43 (69.4%) | 19 (30.6%) |
| Total (Category) | 90 (62.1%) | 55 (37.9%) |
| Total (Overall) | 428 (44.8%) | 528 (55.2%) |
Employment Industries by Sex in Lakeside town Tarrant County
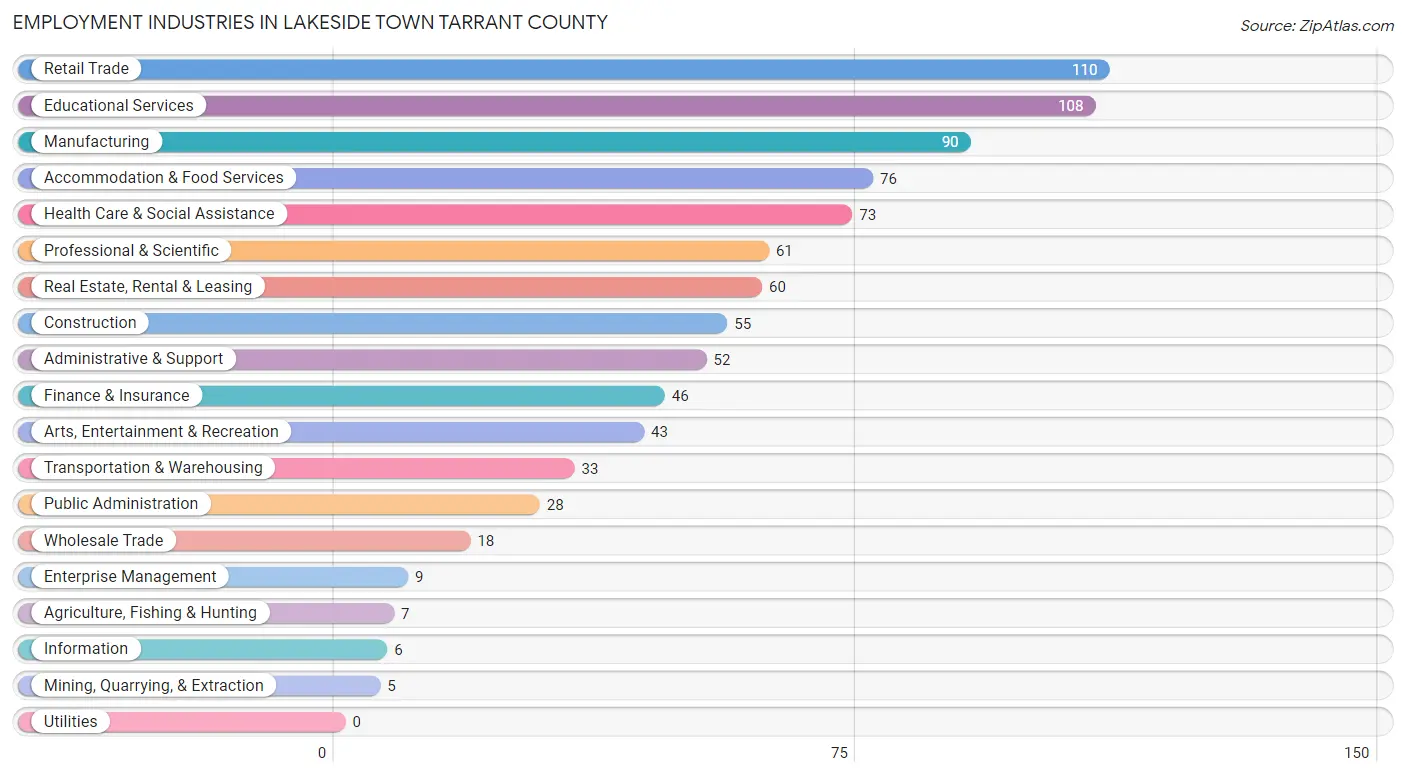
Employment Industries in Lakeside town Tarrant County
The major employment industries in Lakeside town Tarrant County include Retail Trade (110 | 11.5%), Educational Services (108 | 11.3%), Manufacturing (90 | 9.4%), Accommodation & Food Services (76 | 8.0%), and Health Care & Social Assistance (73 | 7.6%).
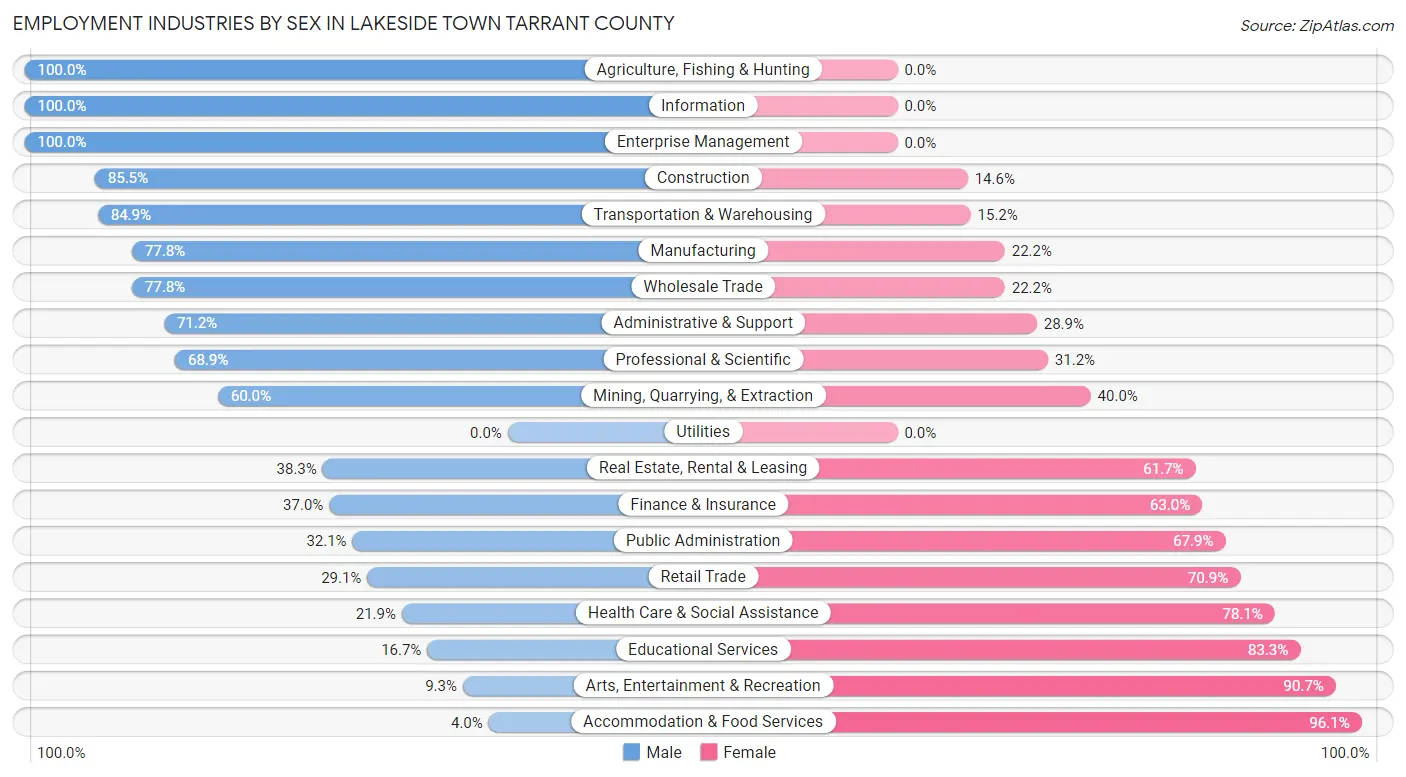
Employment Industries by Sex in Lakeside town Tarrant County
The Lakeside town Tarrant County industries that see more men than women are Agriculture, Fishing & Hunting (100.0%), Information (100.0%), and Enterprise Management (100.0%), whereas the industries that tend to have a higher number of women are Accommodation & Food Services (96.1%), Arts, Entertainment & Recreation (90.7%), and Educational Services (83.3%).
| Industry | Male | Female |
| Agriculture, Fishing & Hunting | 7 (100.0%) | 0 (0.0%) |
| Mining, Quarrying, & Extraction | 3 (60.0%) | 2 (40.0%) |
| Construction | 47 (85.5%) | 8 (14.5%) |
| Manufacturing | 70 (77.8%) | 20 (22.2%) |
| Wholesale Trade | 14 (77.8%) | 4 (22.2%) |
| Retail Trade | 32 (29.1%) | 78 (70.9%) |
| Transportation & Warehousing | 28 (84.9%) | 5 (15.1%) |
| Utilities | 0 (0.0%) | 0 (0.0%) |
| Information | 6 (100.0%) | 0 (0.0%) |
| Finance & Insurance | 17 (37.0%) | 29 (63.0%) |
| Real Estate, Rental & Leasing | 23 (38.3%) | 37 (61.7%) |
| Professional & Scientific | 42 (68.9%) | 19 (31.1%) |
| Enterprise Management | 9 (100.0%) | 0 (0.0%) |
| Administrative & Support | 37 (71.2%) | 15 (28.8%) |
| Educational Services | 18 (16.7%) | 90 (83.3%) |
| Health Care & Social Assistance | 16 (21.9%) | 57 (78.1%) |
| Arts, Entertainment & Recreation | 4 (9.3%) | 39 (90.7%) |
| Accommodation & Food Services | 3 (4.0%) | 73 (96.1%) |
| Public Administration | 9 (32.1%) | 19 (67.9%) |
| Total | 428 (44.8%) | 528 (55.2%) |
Education in Lakeside town Tarrant County
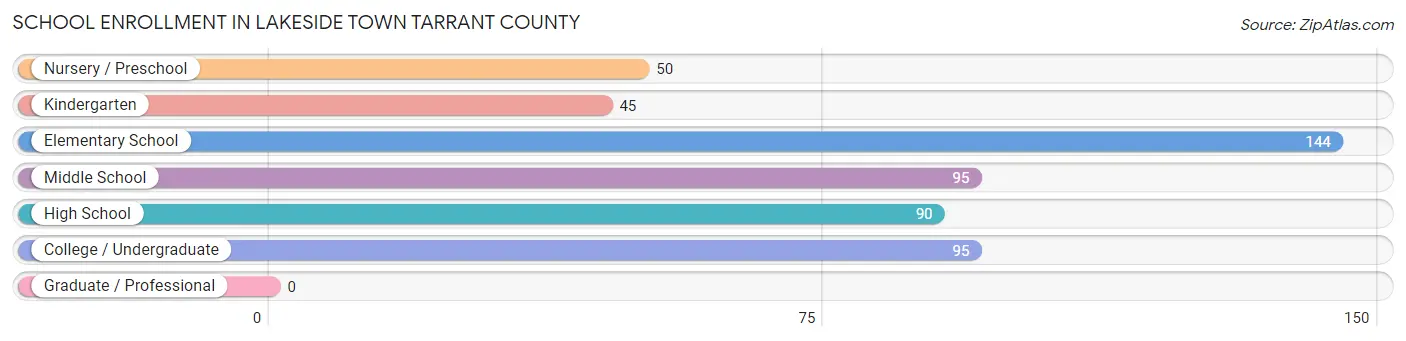
School Enrollment in Lakeside town Tarrant County
The most common levels of schooling among the 519 students in Lakeside town Tarrant County are elementary school (144 | 27.8%), middle school (95 | 18.3%), and college / undergraduate (95 | 18.3%).
| School Level | # Students | % Students |
| Nursery / Preschool | 50 | 9.6% |
| Kindergarten | 45 | 8.7% |
| Elementary School | 144 | 27.8% |
| Middle School | 95 | 18.3% |
| High School | 90 | 17.3% |
| College / Undergraduate | 95 | 18.3% |
| Graduate / Professional | 0 | 0.0% |
| Total | 519 | 100.0% |
School Enrollment by Age by Funding Source in Lakeside town Tarrant County
Out of a total of 519 students who are enrolled in schools in Lakeside town Tarrant County, 99 (19.1%) attend a private institution, while the remaining 420 (80.9%) are enrolled in public schools. The age group of 20 to 24 year olds has the highest likelihood of being enrolled in private schools, with 28 (60.9% in the age bracket) enrolled. Conversely, the age group of 3 to 4 year olds has the lowest likelihood of being enrolled in a private school, with 27 (100.0% in the age bracket) attending a public institution.
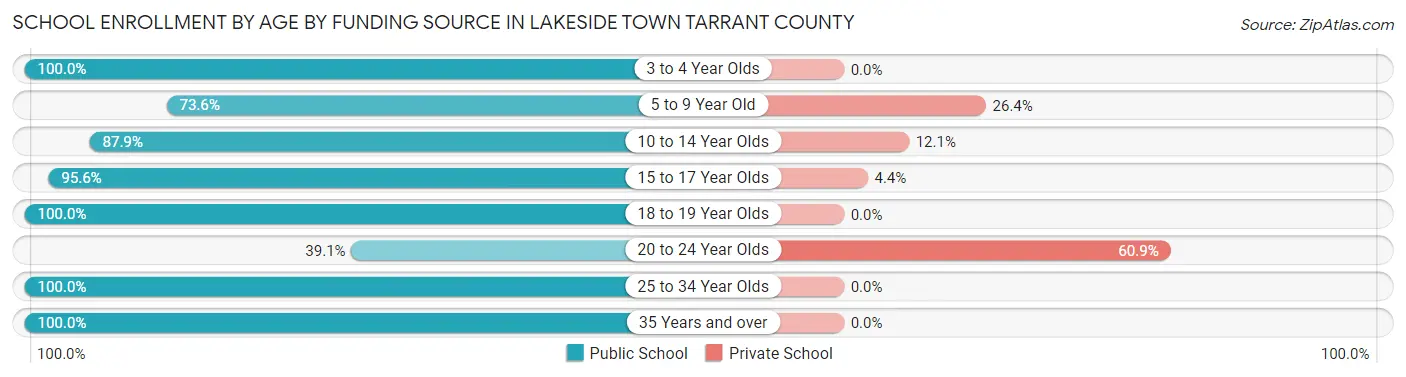
| Age Bracket | Public School | Private School |
| 3 to 4 Year Olds | 27 (100.0%) | 0 (0.0%) |
| 5 to 9 Year Old | 153 (73.6%) | 55 (26.4%) |
| 10 to 14 Year Olds | 87 (87.9%) | 12 (12.1%) |
| 15 to 17 Year Olds | 86 (95.6%) | 4 (4.4%) |
| 18 to 19 Year Olds | 24 (100.0%) | 0 (0.0%) |
| 20 to 24 Year Olds | 18 (39.1%) | 28 (60.9%) |
| 25 to 34 Year Olds | 6 (100.0%) | 0 (0.0%) |
| 35 Years and over | 19 (100.0%) | 0 (0.0%) |
| Total | 420 (80.9%) | 99 (19.1%) |
Educational Attainment by Field of Study in Lakeside town Tarrant County
Business (73 | 21.2%), arts & humanities (54 | 15.7%), education (42 | 12.2%), engineering (34 | 9.9%), and social sciences (26 | 7.6%) are the most common fields of study among 344 individuals in Lakeside town Tarrant County who have obtained a bachelor's degree or higher.
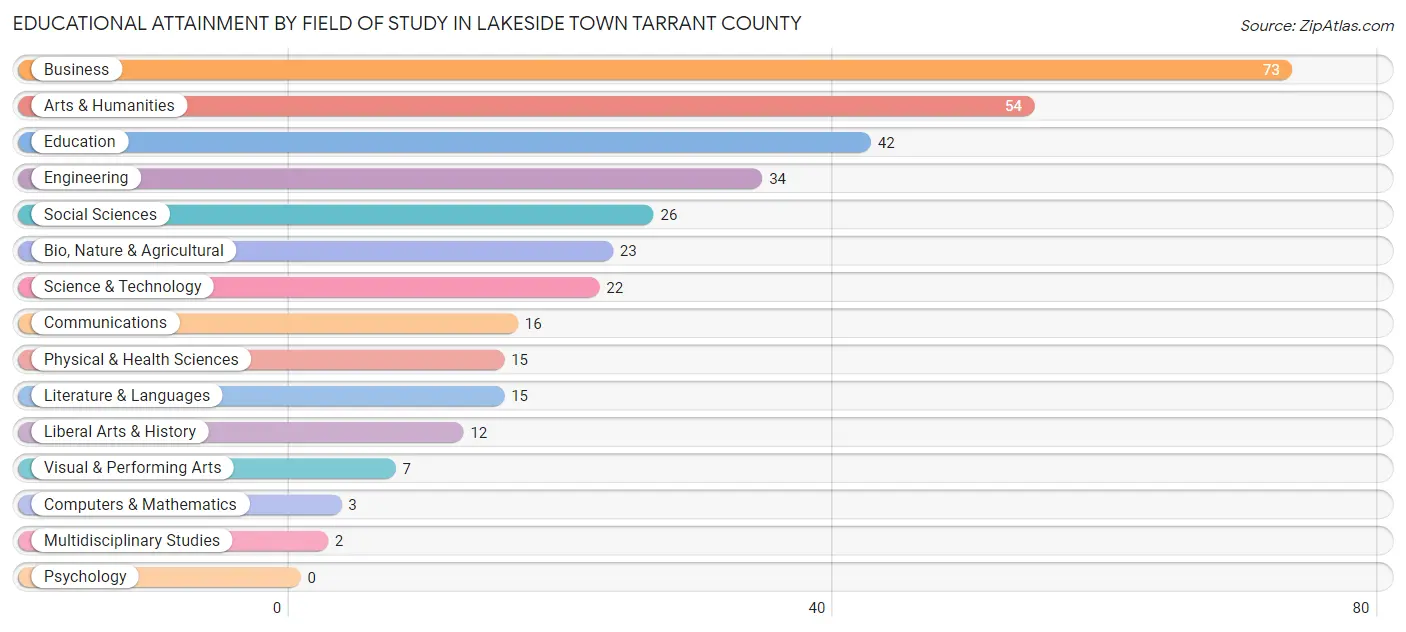
| Field of Study | # Graduates | % Graduates |
| Computers & Mathematics | 3 | 0.9% |
| Bio, Nature & Agricultural | 23 | 6.7% |
| Physical & Health Sciences | 15 | 4.4% |
| Psychology | 0 | 0.0% |
| Social Sciences | 26 | 7.6% |
| Engineering | 34 | 9.9% |
| Multidisciplinary Studies | 2 | 0.6% |
| Science & Technology | 22 | 6.4% |
| Business | 73 | 21.2% |
| Education | 42 | 12.2% |
| Literature & Languages | 15 | 4.4% |
| Liberal Arts & History | 12 | 3.5% |
| Visual & Performing Arts | 7 | 2.0% |
| Communications | 16 | 4.6% |
| Arts & Humanities | 54 | 15.7% |
| Total | 344 | 100.0% |
Transportation & Commute in Lakeside town Tarrant County
Vehicle Availability by Sex in Lakeside town Tarrant County
The most prevalent vehicle ownership categories in Lakeside town Tarrant County are males with 2 vehicles (210, accounting for 49.3%) and females with 2 vehicles (203, making up 39.9%).
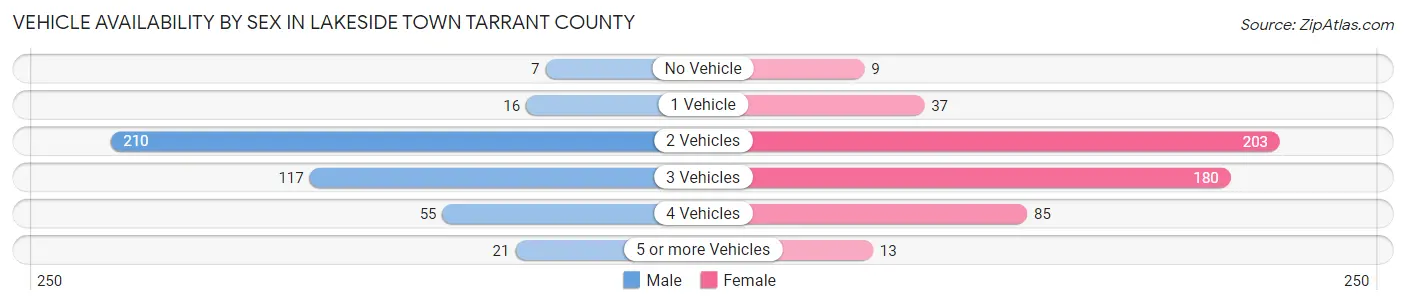
| Vehicles Available | Male | Female |
| No Vehicle | 7 (1.6%) | 9 (1.7%) |
| 1 Vehicle | 16 (3.8%) | 37 (7.0%) |
| 2 Vehicles | 210 (49.3%) | 203 (38.5%) |
| 3 Vehicles | 117 (27.5%) | 180 (34.2%) |
| 4 Vehicles | 55 (12.9%) | 85 (16.1%) |
| 5 or more Vehicles | 21 (4.9%) | 13 (2.5%) |
| Total | 426 (100.0%) | 527 (100.0%) |
Commute Time in Lakeside town Tarrant County
The most frequently occuring commute durations in Lakeside town Tarrant County are 20 to 24 minutes (179 commuters, 22.6%), 15 to 19 minutes (108 commuters, 13.7%), and 30 to 34 minutes (107 commuters, 13.5%).
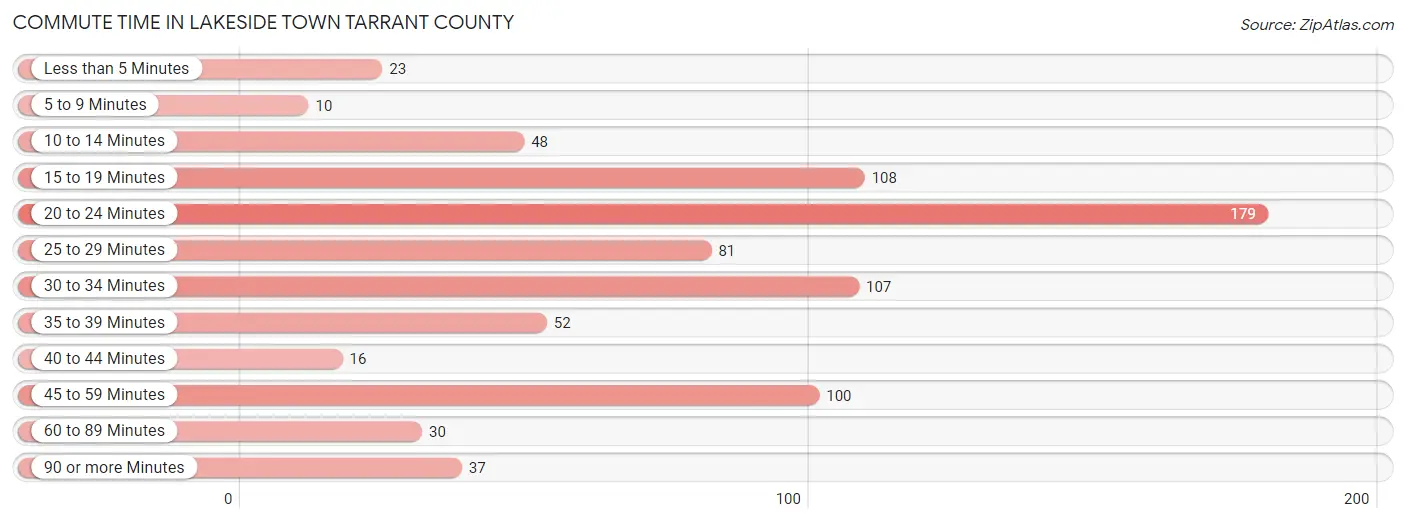
| Commute Time | # Commuters | % Commuters |
| Less than 5 Minutes | 23 | 2.9% |
| 5 to 9 Minutes | 10 | 1.3% |
| 10 to 14 Minutes | 48 | 6.1% |
| 15 to 19 Minutes | 108 | 13.7% |
| 20 to 24 Minutes | 179 | 22.6% |
| 25 to 29 Minutes | 81 | 10.2% |
| 30 to 34 Minutes | 107 | 13.5% |
| 35 to 39 Minutes | 52 | 6.6% |
| 40 to 44 Minutes | 16 | 2.0% |
| 45 to 59 Minutes | 100 | 12.6% |
| 60 to 89 Minutes | 30 | 3.8% |
| 90 or more Minutes | 37 | 4.7% |
Commute Time by Sex in Lakeside town Tarrant County
The most common commute times in Lakeside town Tarrant County are 20 to 24 minutes (77 commuters, 22.3%) for males and 20 to 24 minutes (102 commuters, 22.9%) for females.
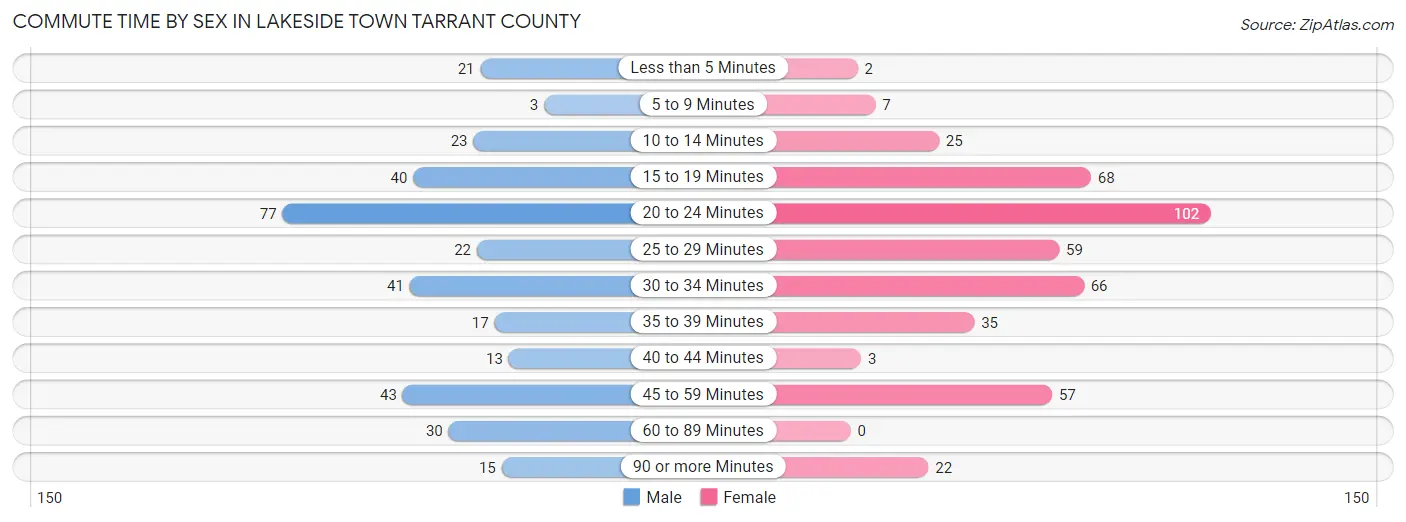
| Commute Time | Male | Female |
| Less than 5 Minutes | 21 (6.1%) | 2 (0.4%) |
| 5 to 9 Minutes | 3 (0.9%) | 7 (1.6%) |
| 10 to 14 Minutes | 23 (6.7%) | 25 (5.6%) |
| 15 to 19 Minutes | 40 (11.6%) | 68 (15.2%) |
| 20 to 24 Minutes | 77 (22.3%) | 102 (22.9%) |
| 25 to 29 Minutes | 22 (6.4%) | 59 (13.2%) |
| 30 to 34 Minutes | 41 (11.9%) | 66 (14.8%) |
| 35 to 39 Minutes | 17 (4.9%) | 35 (7.9%) |
| 40 to 44 Minutes | 13 (3.8%) | 3 (0.7%) |
| 45 to 59 Minutes | 43 (12.5%) | 57 (12.8%) |
| 60 to 89 Minutes | 30 (8.7%) | 0 (0.0%) |
| 90 or more Minutes | 15 (4.3%) | 22 (4.9%) |
Time of Departure to Work by Sex in Lakeside town Tarrant County
The most frequent times of departure to work in Lakeside town Tarrant County are 8:00 AM to 8:29 AM (58, 16.8%) for males and 7:00 AM to 7:29 AM (100, 22.4%) for females.
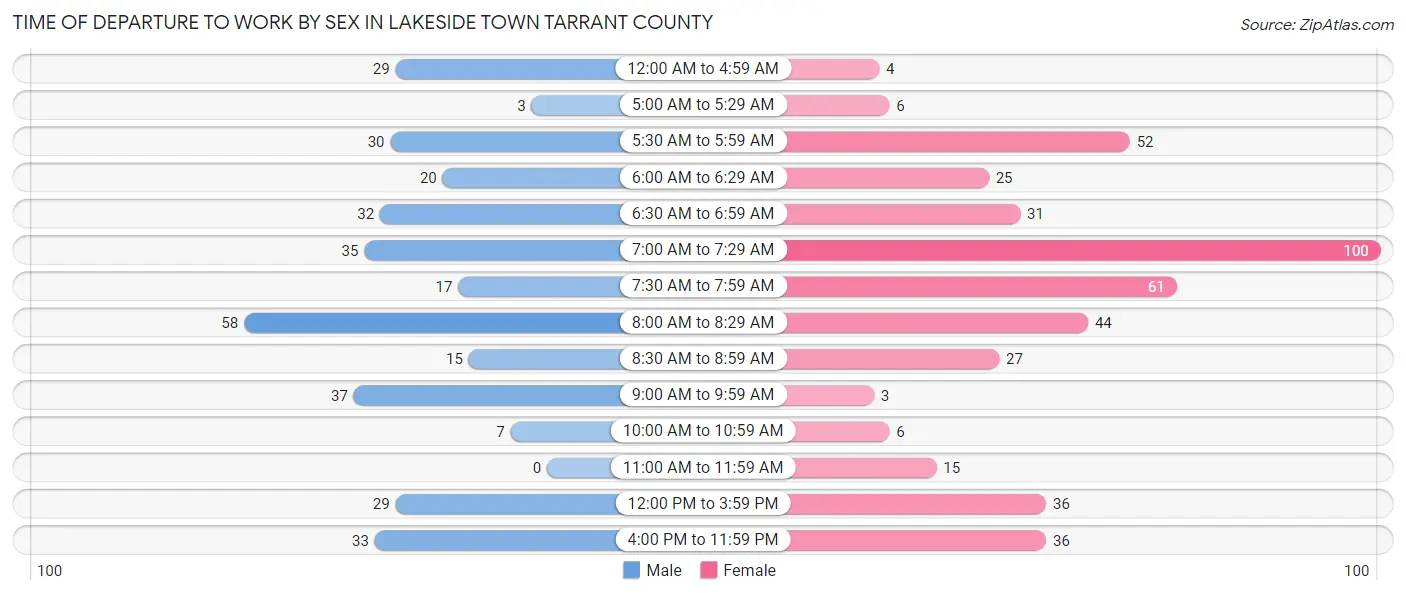
| Time of Departure | Male | Female |
| 12:00 AM to 4:59 AM | 29 (8.4%) | 4 (0.9%) |
| 5:00 AM to 5:29 AM | 3 (0.9%) | 6 (1.3%) |
| 5:30 AM to 5:59 AM | 30 (8.7%) | 52 (11.7%) |
| 6:00 AM to 6:29 AM | 20 (5.8%) | 25 (5.6%) |
| 6:30 AM to 6:59 AM | 32 (9.3%) | 31 (7.0%) |
| 7:00 AM to 7:29 AM | 35 (10.1%) | 100 (22.4%) |
| 7:30 AM to 7:59 AM | 17 (4.9%) | 61 (13.7%) |
| 8:00 AM to 8:29 AM | 58 (16.8%) | 44 (9.9%) |
| 8:30 AM to 8:59 AM | 15 (4.3%) | 27 (6.0%) |
| 9:00 AM to 9:59 AM | 37 (10.7%) | 3 (0.7%) |
| 10:00 AM to 10:59 AM | 7 (2.0%) | 6 (1.3%) |
| 11:00 AM to 11:59 AM | 0 (0.0%) | 15 (3.4%) |
| 12:00 PM to 3:59 PM | 29 (8.4%) | 36 (8.1%) |
| 4:00 PM to 11:59 PM | 33 (9.6%) | 36 (8.1%) |
| Total | 345 (100.0%) | 446 (100.0%) |
Housing Occupancy in Lakeside town Tarrant County
Occupancy by Ownership in Lakeside town Tarrant County
Of the total 661 dwellings in Lakeside town Tarrant County, owner-occupied units account for 601 (90.9%), while renter-occupied units make up 60 (9.1%).
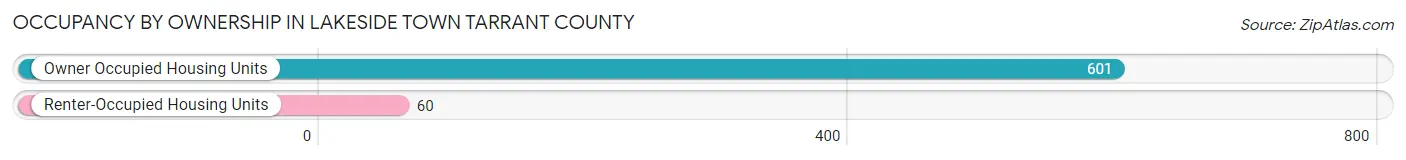
| Occupancy | # Housing Units | % Housing Units |
| Owner Occupied Housing Units | 601 | 90.9% |
| Renter-Occupied Housing Units | 60 | 9.1% |
| Total Occupied Housing Units | 661 | 100.0% |
Occupancy by Household Size in Lakeside town Tarrant County
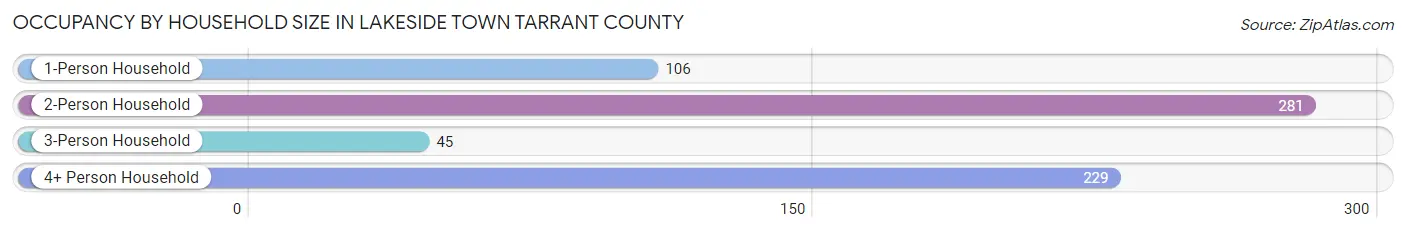
| Household Size | # Housing Units | % Housing Units |
| 1-Person Household | 106 | 16.0% |
| 2-Person Household | 281 | 42.5% |
| 3-Person Household | 45 | 6.8% |
| 4+ Person Household | 229 | 34.6% |
| Total Housing Units | 661 | 100.0% |
Occupancy by Ownership by Household Size in Lakeside town Tarrant County
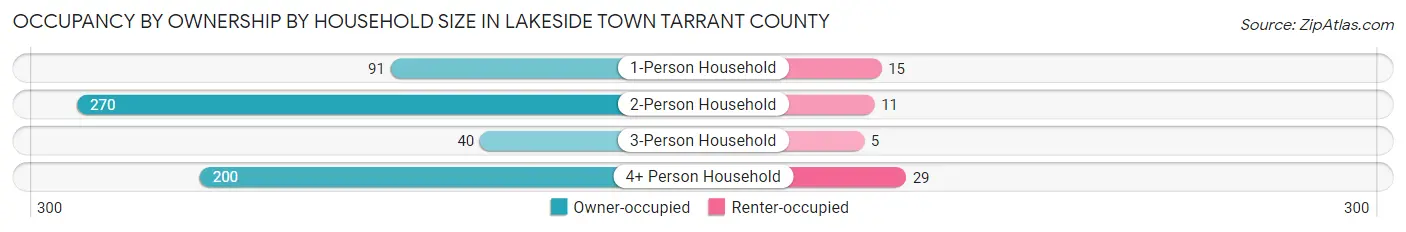
| Household Size | Owner-occupied | Renter-occupied |
| 1-Person Household | 91 (85.9%) | 15 (14.1%) |
| 2-Person Household | 270 (96.1%) | 11 (3.9%) |
| 3-Person Household | 40 (88.9%) | 5 (11.1%) |
| 4+ Person Household | 200 (87.3%) | 29 (12.7%) |
| Total Housing Units | 601 (90.9%) | 60 (9.1%) |
Occupancy by Educational Attainment in Lakeside town Tarrant County
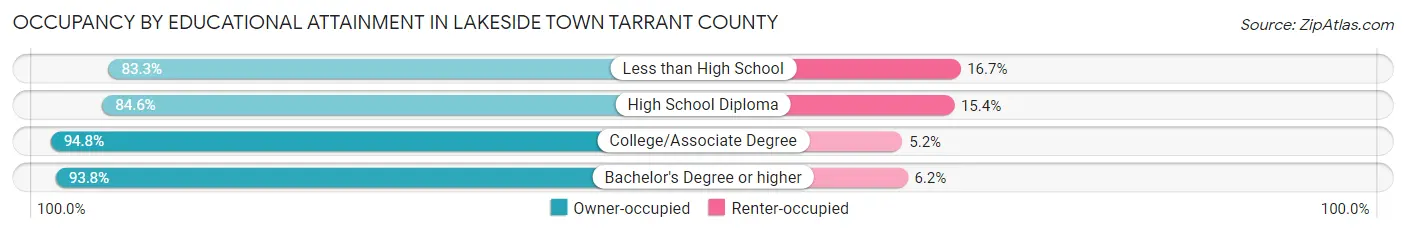
| Household Size | Owner-occupied | Renter-occupied |
| Less than High School | 35 (83.3%) | 7 (16.7%) |
| High School Diploma | 159 (84.6%) | 29 (15.4%) |
| College/Associate Degree | 256 (94.8%) | 14 (5.2%) |
| Bachelor's Degree or higher | 151 (93.8%) | 10 (6.2%) |
Occupancy by Age of Householder in Lakeside town Tarrant County
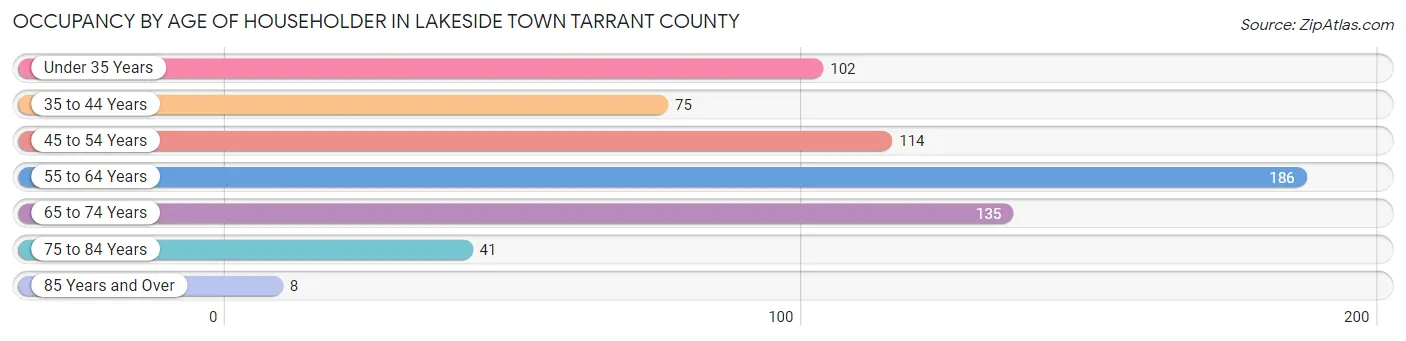
| Age Bracket | # Households | % Households |
| Under 35 Years | 102 | 15.4% |
| 35 to 44 Years | 75 | 11.4% |
| 45 to 54 Years | 114 | 17.2% |
| 55 to 64 Years | 186 | 28.1% |
| 65 to 74 Years | 135 | 20.4% |
| 75 to 84 Years | 41 | 6.2% |
| 85 Years and Over | 8 | 1.2% |
| Total | 661 | 100.0% |
Housing Finances in Lakeside town Tarrant County
Median Income by Occupancy in Lakeside town Tarrant County
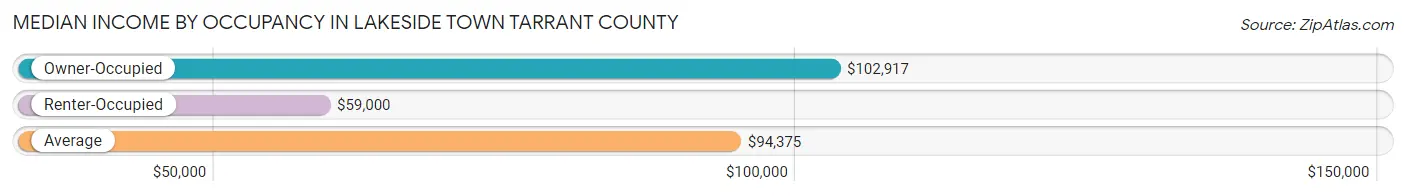
| Occupancy Type | # Households | Median Income |
| Owner-Occupied | 601 (90.9%) | $102,917 |
| Renter-Occupied | 60 (9.1%) | $59,000 |
| Average | 661 (100.0%) | $94,375 |
Occupancy by Householder Income Bracket in Lakeside town Tarrant County
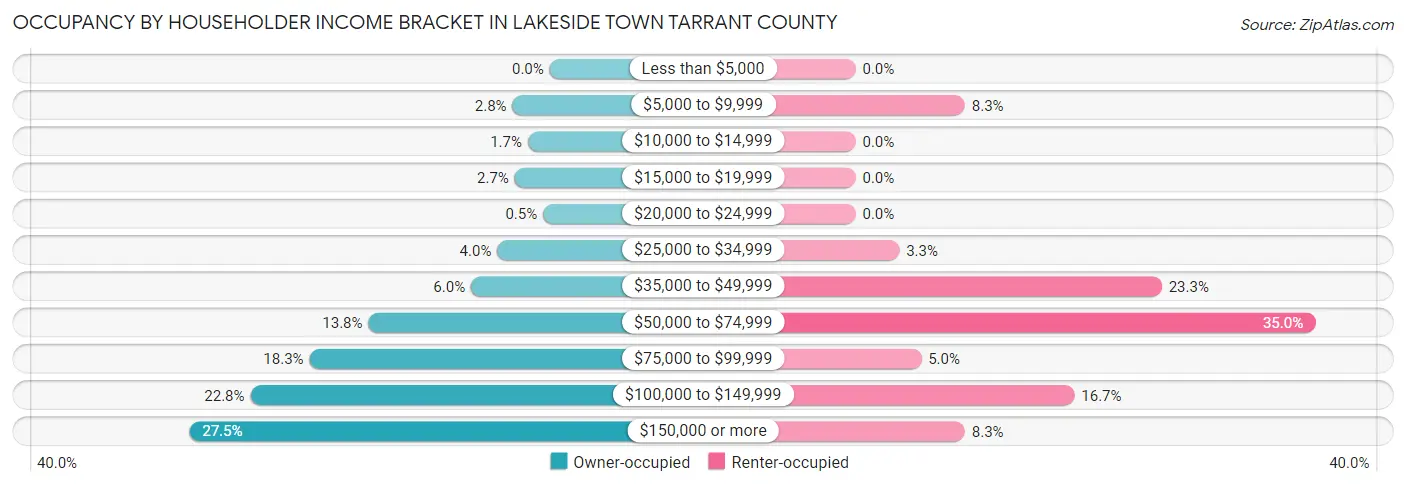
| Income Bracket | Owner-occupied | Renter-occupied |
| Less than $5,000 | 0 (0.0%) | 0 (0.0%) |
| $5,000 to $9,999 | 17 (2.8%) | 5 (8.3%) |
| $10,000 to $14,999 | 10 (1.7%) | 0 (0.0%) |
| $15,000 to $19,999 | 16 (2.7%) | 0 (0.0%) |
| $20,000 to $24,999 | 3 (0.5%) | 0 (0.0%) |
| $25,000 to $34,999 | 24 (4.0%) | 2 (3.3%) |
| $35,000 to $49,999 | 36 (6.0%) | 14 (23.3%) |
| $50,000 to $74,999 | 83 (13.8%) | 21 (35.0%) |
| $75,000 to $99,999 | 110 (18.3%) | 3 (5.0%) |
| $100,000 to $149,999 | 137 (22.8%) | 10 (16.7%) |
| $150,000 or more | 165 (27.5%) | 5 (8.3%) |
| Total | 601 (100.0%) | 60 (100.0%) |
Monthly Housing Cost Tiers in Lakeside town Tarrant County
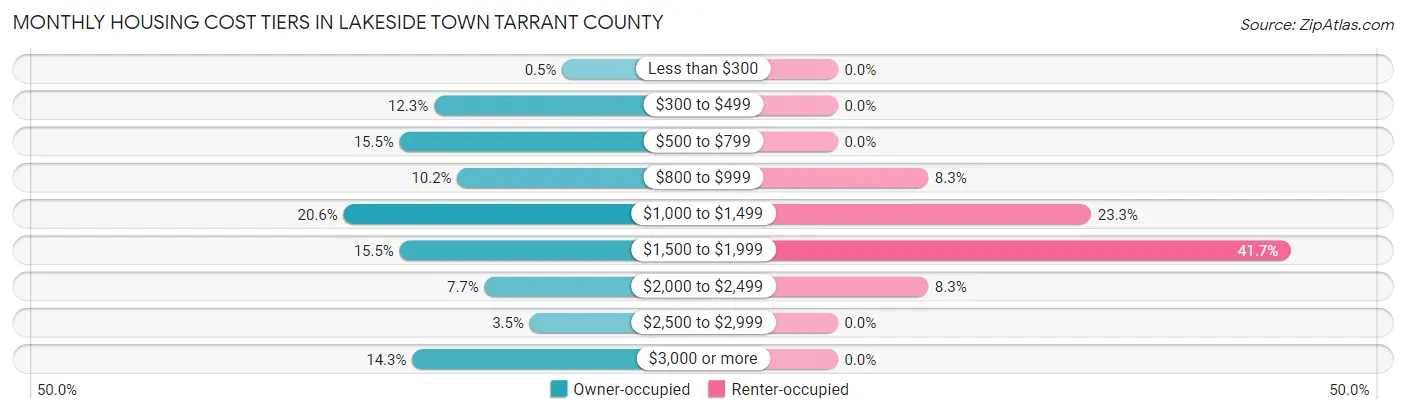
| Monthly Cost | Owner-occupied | Renter-occupied |
| Less than $300 | 3 (0.5%) | 0 (0.0%) |
| $300 to $499 | 74 (12.3%) | 0 (0.0%) |
| $500 to $799 | 93 (15.5%) | 0 (0.0%) |
| $800 to $999 | 61 (10.2%) | 5 (8.3%) |
| $1,000 to $1,499 | 124 (20.6%) | 14 (23.3%) |
| $1,500 to $1,999 | 93 (15.5%) | 25 (41.7%) |
| $2,000 to $2,499 | 46 (7.6%) | 5 (8.3%) |
| $2,500 to $2,999 | 21 (3.5%) | 0 (0.0%) |
| $3,000 or more | 86 (14.3%) | 0 (0.0%) |
| Total | 601 (100.0%) | 60 (100.0%) |
Physical Housing Characteristics in Lakeside town Tarrant County
Housing Structures in Lakeside town Tarrant County
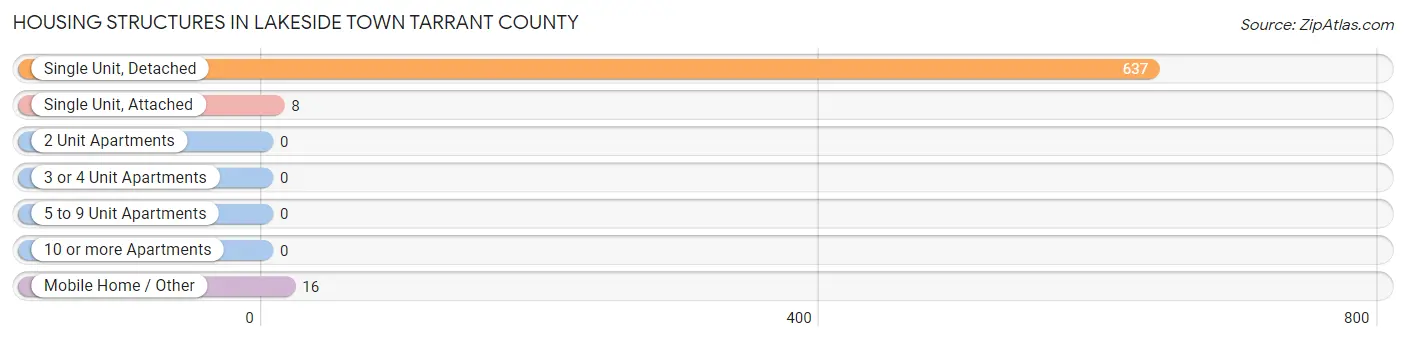
| Structure Type | # Housing Units | % Housing Units |
| Single Unit, Detached | 637 | 96.4% |
| Single Unit, Attached | 8 | 1.2% |
| 2 Unit Apartments | 0 | 0.0% |
| 3 or 4 Unit Apartments | 0 | 0.0% |
| 5 to 9 Unit Apartments | 0 | 0.0% |
| 10 or more Apartments | 0 | 0.0% |
| Mobile Home / Other | 16 | 2.4% |
| Total | 661 | 100.0% |
Housing Structures by Occupancy in Lakeside town Tarrant County
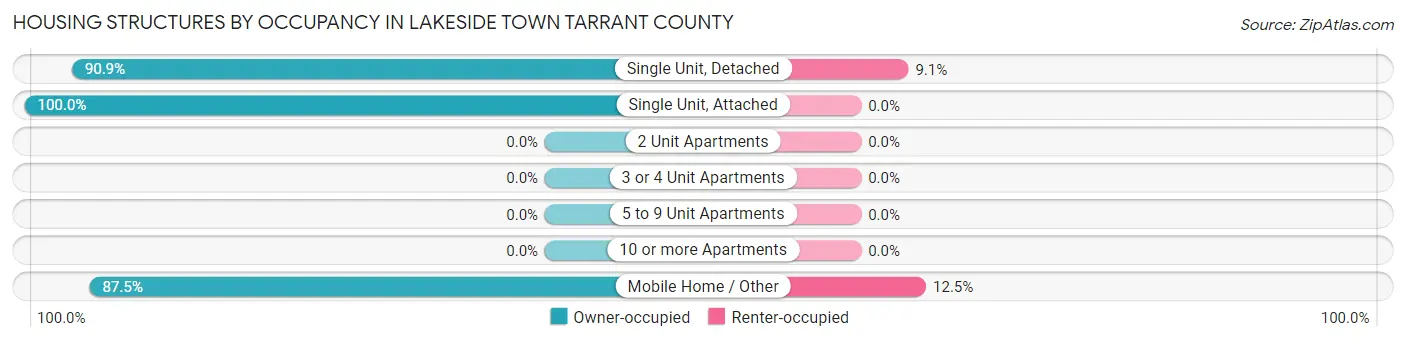
| Structure Type | Owner-occupied | Renter-occupied |
| Single Unit, Detached | 579 (90.9%) | 58 (9.1%) |
| Single Unit, Attached | 8 (100.0%) | 0 (0.0%) |
| 2 Unit Apartments | 0 (0.0%) | 0 (0.0%) |
| 3 or 4 Unit Apartments | 0 (0.0%) | 0 (0.0%) |
| 5 to 9 Unit Apartments | 0 (0.0%) | 0 (0.0%) |
| 10 or more Apartments | 0 (0.0%) | 0 (0.0%) |
| Mobile Home / Other | 14 (87.5%) | 2 (12.5%) |
| Total | 601 (90.9%) | 60 (9.1%) |
Housing Structures by Number of Rooms in Lakeside town Tarrant County
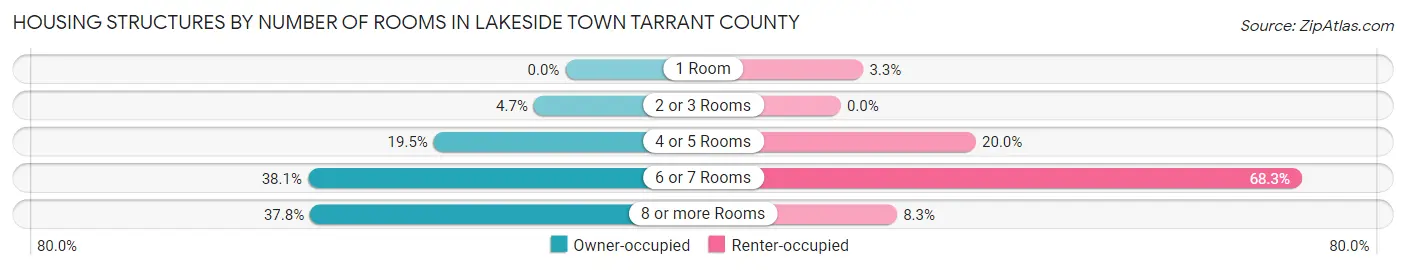
| Number of Rooms | Owner-occupied | Renter-occupied |
| 1 Room | 0 (0.0%) | 2 (3.3%) |
| 2 or 3 Rooms | 28 (4.7%) | 0 (0.0%) |
| 4 or 5 Rooms | 117 (19.5%) | 12 (20.0%) |
| 6 or 7 Rooms | 229 (38.1%) | 41 (68.3%) |
| 8 or more Rooms | 227 (37.8%) | 5 (8.3%) |
| Total | 601 (100.0%) | 60 (100.0%) |
Housing Structure by Heating Type in Lakeside town Tarrant County
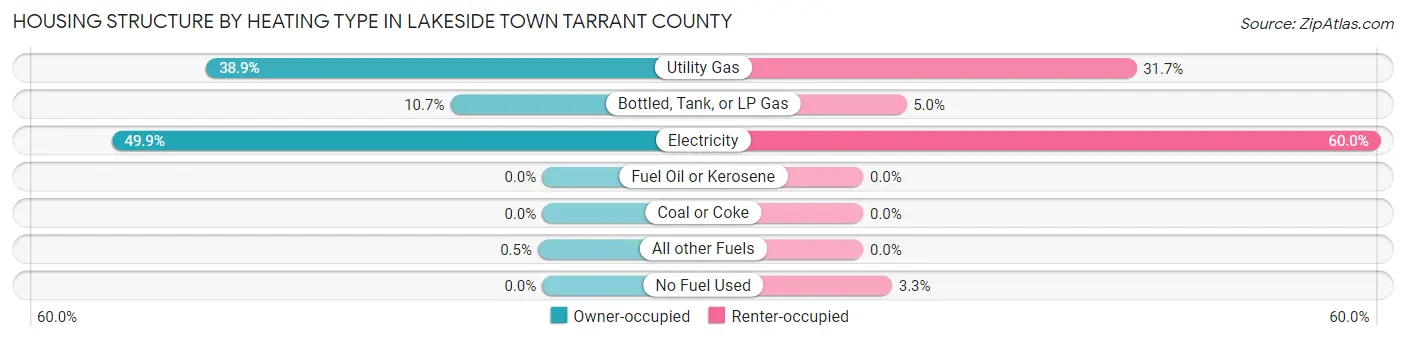
| Heating Type | Owner-occupied | Renter-occupied |
| Utility Gas | 234 (38.9%) | 19 (31.7%) |
| Bottled, Tank, or LP Gas | 64 (10.6%) | 3 (5.0%) |
| Electricity | 300 (49.9%) | 36 (60.0%) |
| Fuel Oil or Kerosene | 0 (0.0%) | 0 (0.0%) |
| Coal or Coke | 0 (0.0%) | 0 (0.0%) |
| All other Fuels | 3 (0.5%) | 0 (0.0%) |
| No Fuel Used | 0 (0.0%) | 2 (3.3%) |
| Total | 601 (100.0%) | 60 (100.0%) |
Household Vehicle Usage in Lakeside town Tarrant County
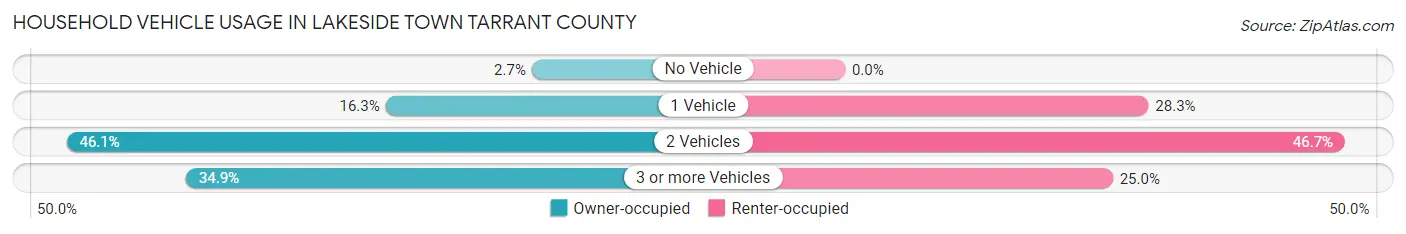
| Vehicles per Household | Owner-occupied | Renter-occupied |
| No Vehicle | 16 (2.7%) | 0 (0.0%) |
| 1 Vehicle | 98 (16.3%) | 17 (28.3%) |
| 2 Vehicles | 277 (46.1%) | 28 (46.7%) |
| 3 or more Vehicles | 210 (34.9%) | 15 (25.0%) |
| Total | 601 (100.0%) | 60 (100.0%) |
Real Estate & Mortgages in Lakeside town Tarrant County
Real Estate and Mortgage Overview in Lakeside town Tarrant County
| Characteristic | Without Mortgage | With Mortgage |
| Housing Units | 262 | 339 |
| Median Property Value | $244,300 | $338,400 |
| Median Household Income | $61,250 | $134 |
| Monthly Housing Costs | $727 | $86 |
| Real Estate Taxes | $2,893 | $14 |
Property Value by Mortgage Status in Lakeside town Tarrant County
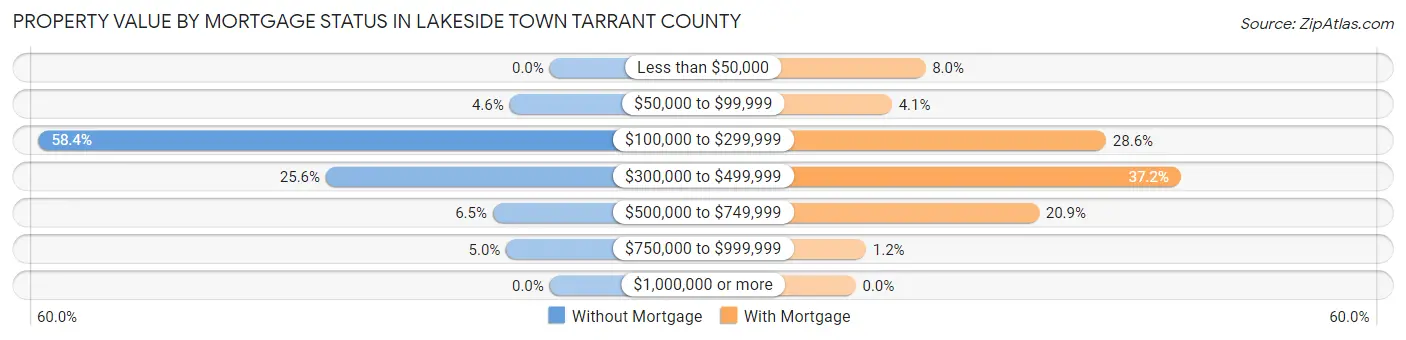
| Property Value | Without Mortgage | With Mortgage |
| Less than $50,000 | 0 (0.0%) | 27 (8.0%) |
| $50,000 to $99,999 | 12 (4.6%) | 14 (4.1%) |
| $100,000 to $299,999 | 153 (58.4%) | 97 (28.6%) |
| $300,000 to $499,999 | 67 (25.6%) | 126 (37.2%) |
| $500,000 to $749,999 | 17 (6.5%) | 71 (20.9%) |
| $750,000 to $999,999 | 13 (5.0%) | 4 (1.2%) |
| $1,000,000 or more | 0 (0.0%) | 0 (0.0%) |
| Total | 262 (100.0%) | 339 (100.0%) |
Household Income by Mortgage Status in Lakeside town Tarrant County
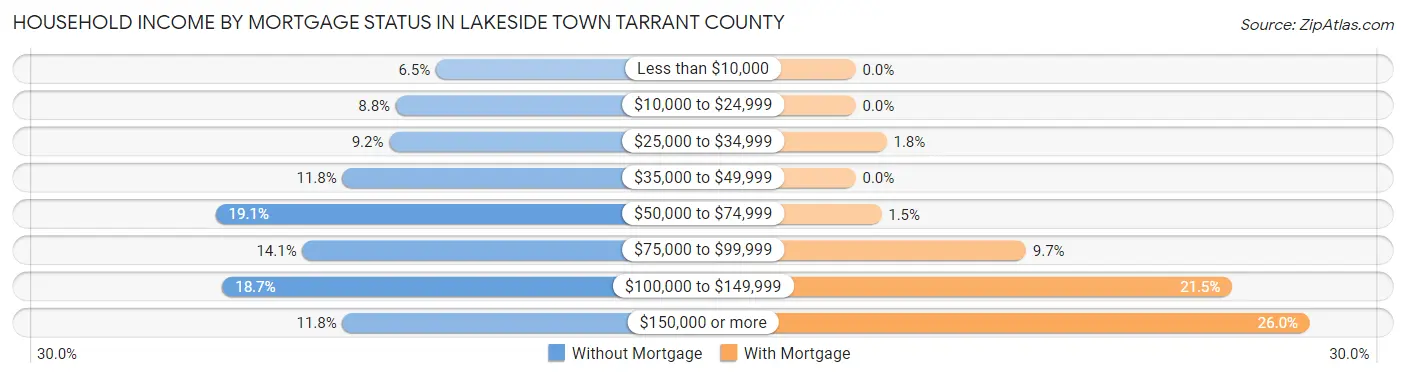
| Household Income | Without Mortgage | With Mortgage |
| Less than $10,000 | 17 (6.5%) | 0 (0.0%) |
| $10,000 to $24,999 | 23 (8.8%) | 0 (0.0%) |
| $25,000 to $34,999 | 24 (9.2%) | 6 (1.8%) |
| $35,000 to $49,999 | 31 (11.8%) | 0 (0.0%) |
| $50,000 to $74,999 | 50 (19.1%) | 5 (1.5%) |
| $75,000 to $99,999 | 37 (14.1%) | 33 (9.7%) |
| $100,000 to $149,999 | 49 (18.7%) | 73 (21.5%) |
| $150,000 or more | 31 (11.8%) | 88 (26.0%) |
| Total | 262 (100.0%) | 339 (100.0%) |
Property Value to Household Income Ratio in Lakeside town Tarrant County
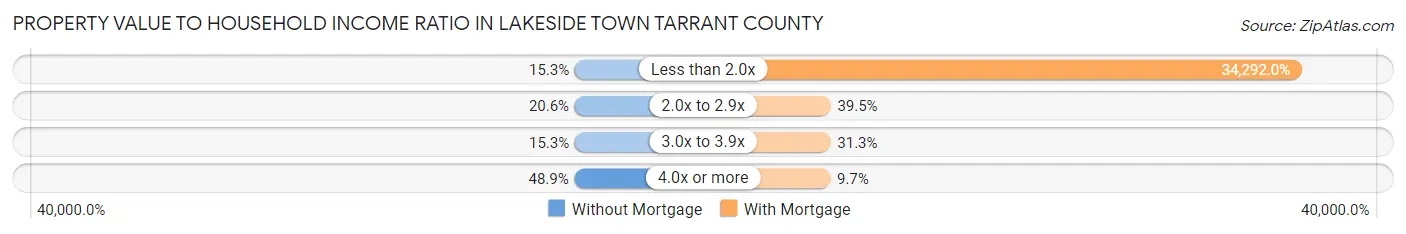
| Value-to-Income Ratio | Without Mortgage | With Mortgage |
| Less than 2.0x | 40 (15.3%) | 116,250 (34,292.0%) |
| 2.0x to 2.9x | 54 (20.6%) | 134 (39.5%) |
| 3.0x to 3.9x | 40 (15.3%) | 106 (31.3%) |
| 4.0x or more | 128 (48.8%) | 33 (9.7%) |
| Total | 262 (100.0%) | 339 (100.0%) |
Real Estate Taxes by Mortgage Status in Lakeside town Tarrant County
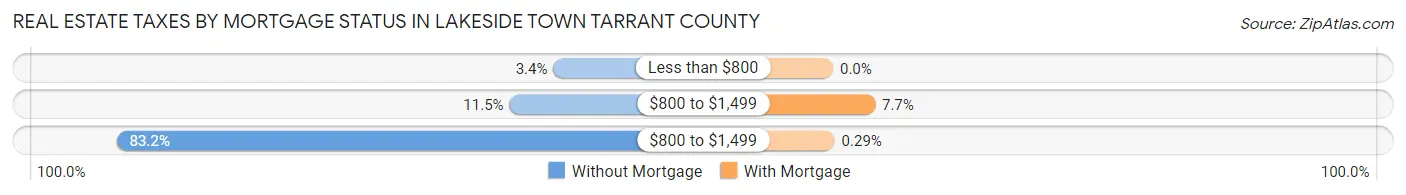
| Property Taxes | Without Mortgage | With Mortgage |
| Less than $800 | 9 (3.4%) | 0 (0.0%) |
| $800 to $1,499 | 30 (11.5%) | 26 (7.7%) |
| $800 to $1,499 | 218 (83.2%) | 1 (0.3%) |
| Total | 262 (100.0%) | 339 (100.0%) |
Health & Disability in Lakeside town Tarrant County
Health Insurance Coverage by Age in Lakeside town Tarrant County
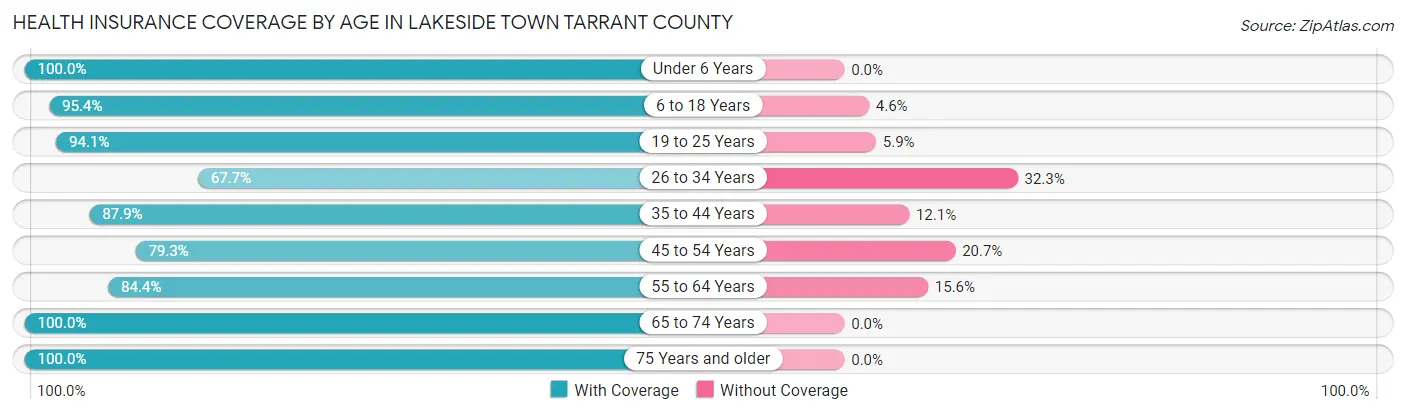
| Age Bracket | With Coverage | Without Coverage |
| Under 6 Years | 142 (100.0%) | 0 (0.0%) |
| 6 to 18 Years | 354 (95.4%) | 17 (4.6%) |
| 19 to 25 Years | 128 (94.1%) | 8 (5.9%) |
| 26 to 34 Years | 153 (67.7%) | 73 (32.3%) |
| 35 to 44 Years | 124 (87.9%) | 17 (12.1%) |
| 45 to 54 Years | 188 (79.3%) | 49 (20.7%) |
| 55 to 64 Years | 271 (84.4%) | 50 (15.6%) |
| 65 to 74 Years | 238 (100.0%) | 0 (0.0%) |
| 75 Years and older | 86 (100.0%) | 0 (0.0%) |
| Total | 1,684 (88.7%) | 214 (11.3%) |
Health Insurance Coverage by Citizenship Status in Lakeside town Tarrant County
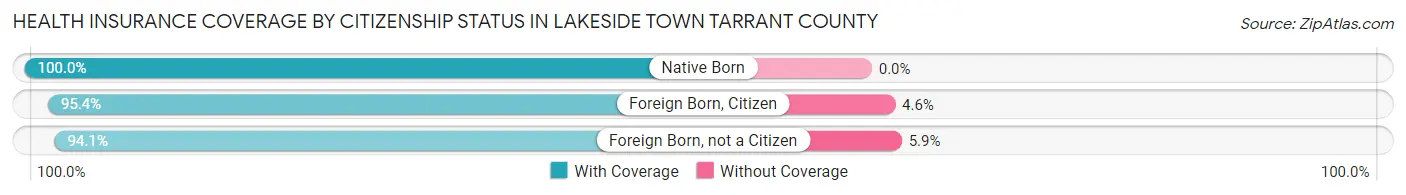
| Citizenship Status | With Coverage | Without Coverage |
| Native Born | 142 (100.0%) | 0 (0.0%) |
| Foreign Born, Citizen | 354 (95.4%) | 17 (4.6%) |
| Foreign Born, not a Citizen | 128 (94.1%) | 8 (5.9%) |
Health Insurance Coverage by Household Income in Lakeside town Tarrant County
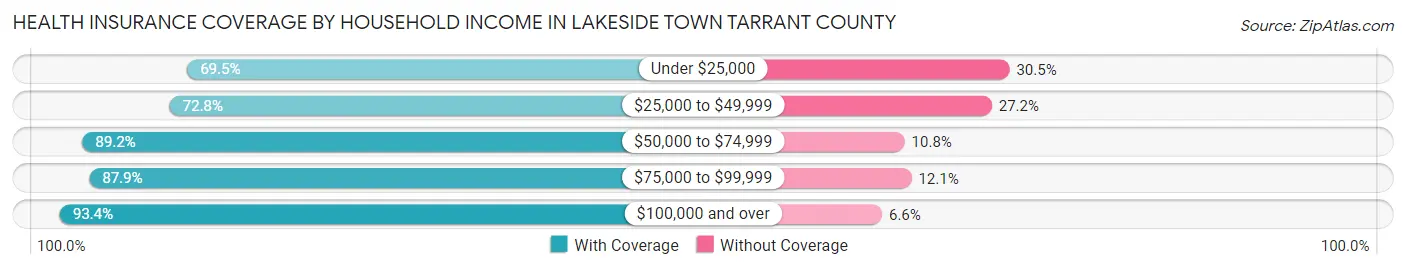
| Household Income | With Coverage | Without Coverage |
| Under $25,000 | 73 (69.5%) | 32 (30.5%) |
| $25,000 to $49,999 | 126 (72.8%) | 47 (27.2%) |
| $50,000 to $74,999 | 222 (89.2%) | 27 (10.8%) |
| $75,000 to $99,999 | 290 (87.9%) | 40 (12.1%) |
| $100,000 and over | 962 (93.4%) | 68 (6.6%) |
Public vs Private Health Insurance Coverage by Age in Lakeside town Tarrant County
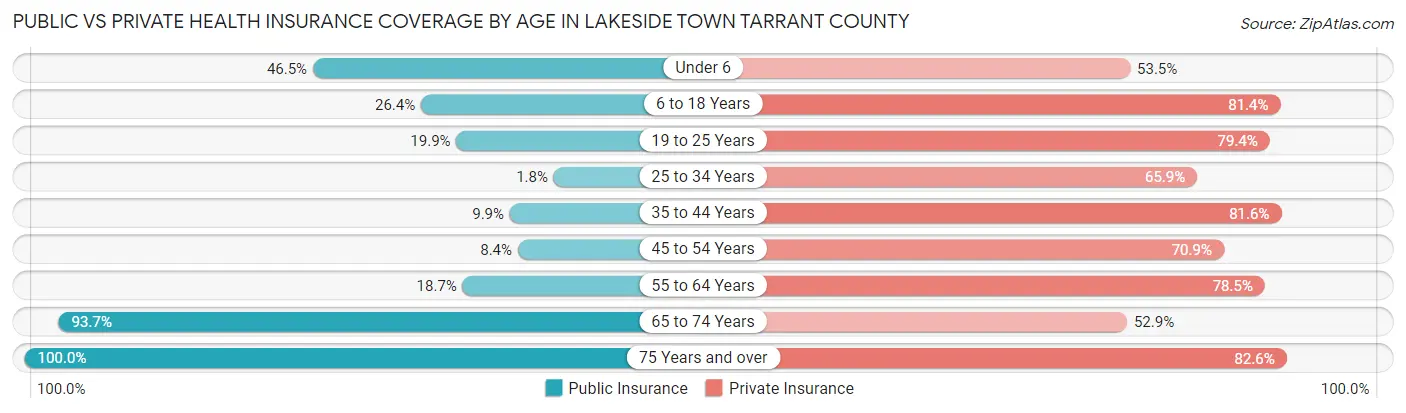
| Age Bracket | Public Insurance | Private Insurance |
| Under 6 | 66 (46.5%) | 76 (53.5%) |
| 6 to 18 Years | 98 (26.4%) | 302 (81.4%) |
| 19 to 25 Years | 27 (19.9%) | 108 (79.4%) |
| 25 to 34 Years | 4 (1.8%) | 149 (65.9%) |
| 35 to 44 Years | 14 (9.9%) | 115 (81.6%) |
| 45 to 54 Years | 20 (8.4%) | 168 (70.9%) |
| 55 to 64 Years | 60 (18.7%) | 252 (78.5%) |
| 65 to 74 Years | 223 (93.7%) | 126 (52.9%) |
| 75 Years and over | 86 (100.0%) | 71 (82.6%) |
| Total | 598 (31.5%) | 1,367 (72.0%) |
Disability Status by Sex by Age in Lakeside town Tarrant County
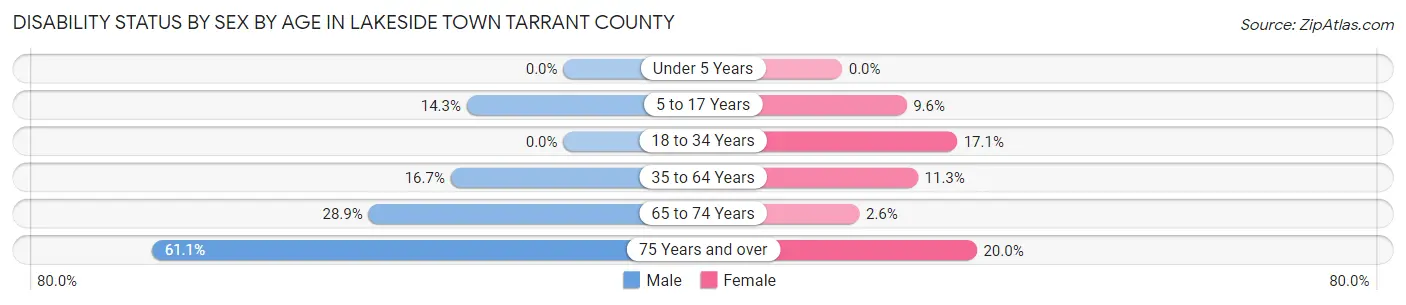
| Age Bracket | Male | Female |
| Under 5 Years | 0 (0.0%) | 0 (0.0%) |
| 5 to 17 Years | 41 (14.3%) | 13 (9.6%) |
| 18 to 34 Years | 0 (0.0%) | 42 (17.1%) |
| 35 to 64 Years | 56 (16.7%) | 41 (11.3%) |
| 65 to 74 Years | 35 (28.9%) | 3 (2.6%) |
| 75 Years and over | 22 (61.1%) | 10 (20.0%) |
Disability Class by Sex by Age in Lakeside town Tarrant County
Disability Class: Hearing Difficulty
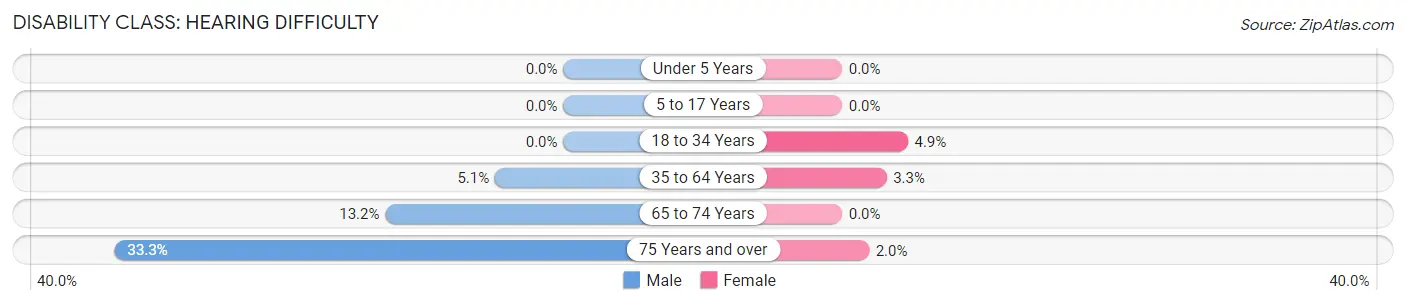
| Age Bracket | Male | Female |
| Under 5 Years | 0 (0.0%) | 0 (0.0%) |
| 5 to 17 Years | 0 (0.0%) | 0 (0.0%) |
| 18 to 34 Years | 0 (0.0%) | 12 (4.9%) |
| 35 to 64 Years | 17 (5.1%) | 12 (3.3%) |
| 65 to 74 Years | 16 (13.2%) | 0 (0.0%) |
| 75 Years and over | 12 (33.3%) | 1 (2.0%) |
Disability Class: Vision Difficulty
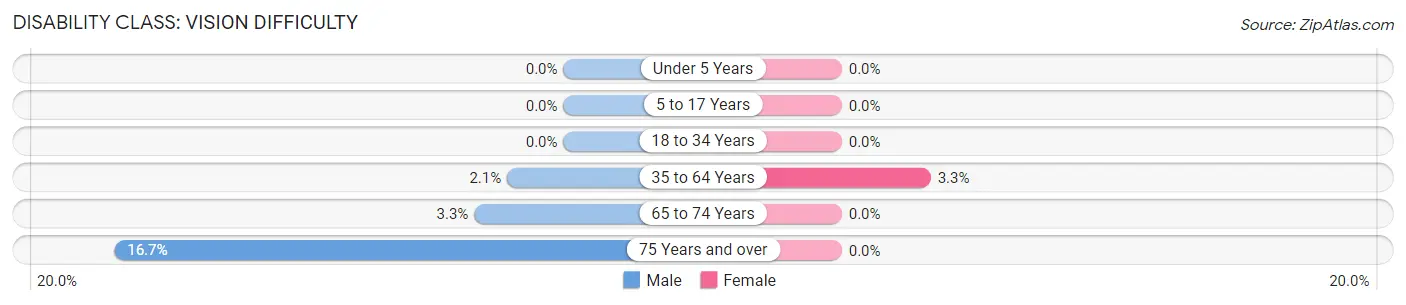
| Age Bracket | Male | Female |
| Under 5 Years | 0 (0.0%) | 0 (0.0%) |
| 5 to 17 Years | 0 (0.0%) | 0 (0.0%) |
| 18 to 34 Years | 0 (0.0%) | 0 (0.0%) |
| 35 to 64 Years | 7 (2.1%) | 12 (3.3%) |
| 65 to 74 Years | 4 (3.3%) | 0 (0.0%) |
| 75 Years and over | 6 (16.7%) | 0 (0.0%) |
Disability Class: Cognitive Difficulty
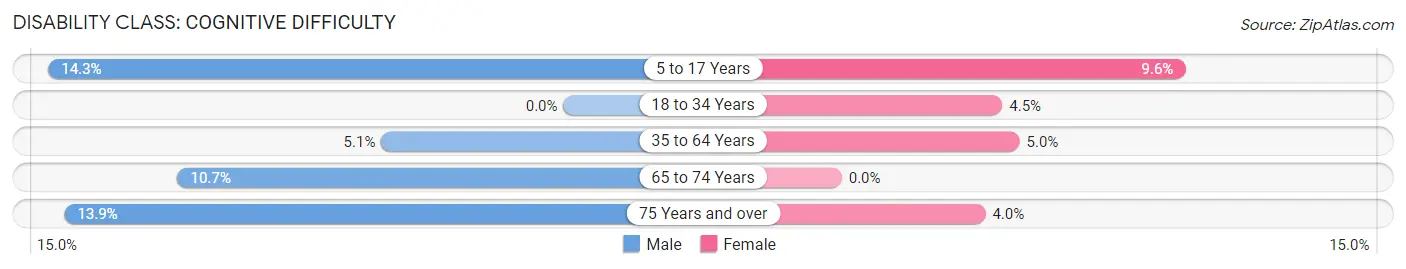
| Age Bracket | Male | Female |
| 5 to 17 Years | 41 (14.3%) | 13 (9.6%) |
| 18 to 34 Years | 0 (0.0%) | 11 (4.5%) |
| 35 to 64 Years | 17 (5.1%) | 18 (5.0%) |
| 65 to 74 Years | 13 (10.7%) | 0 (0.0%) |
| 75 Years and over | 5 (13.9%) | 2 (4.0%) |
Disability Class: Ambulatory Difficulty
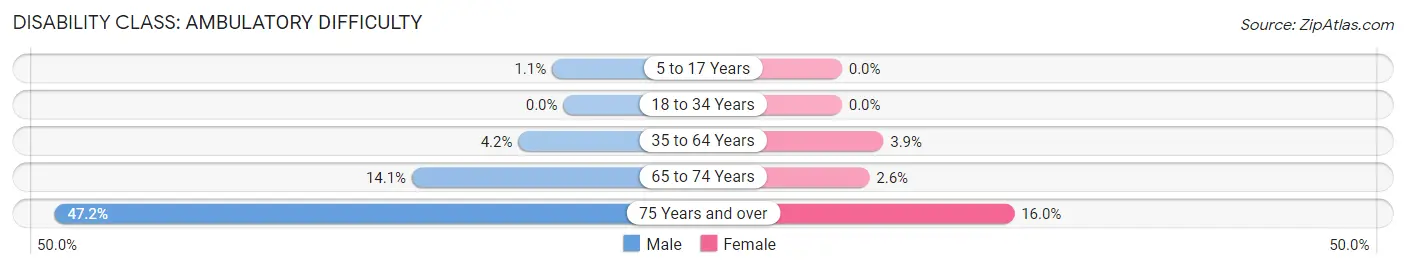
| Age Bracket | Male | Female |
| 5 to 17 Years | 3 (1.1%) | 0 (0.0%) |
| 18 to 34 Years | 0 (0.0%) | 0 (0.0%) |
| 35 to 64 Years | 14 (4.2%) | 14 (3.8%) |
| 65 to 74 Years | 17 (14.1%) | 3 (2.6%) |
| 75 Years and over | 17 (47.2%) | 8 (16.0%) |
Disability Class: Self-Care Difficulty
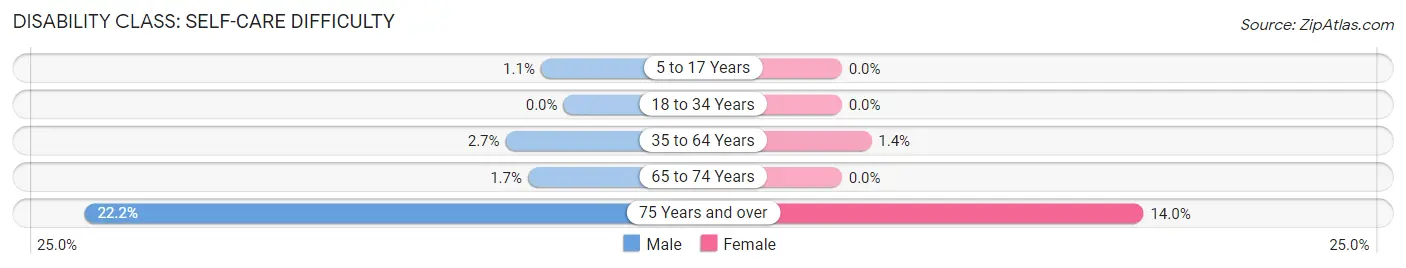
| Age Bracket | Male | Female |
| 5 to 17 Years | 3 (1.1%) | 0 (0.0%) |
| 18 to 34 Years | 0 (0.0%) | 0 (0.0%) |
| 35 to 64 Years | 9 (2.7%) | 5 (1.4%) |
| 65 to 74 Years | 2 (1.7%) | 0 (0.0%) |
| 75 Years and over | 8 (22.2%) | 7 (14.0%) |
Technology Access in Lakeside town Tarrant County
Computing Device Access in Lakeside town Tarrant County
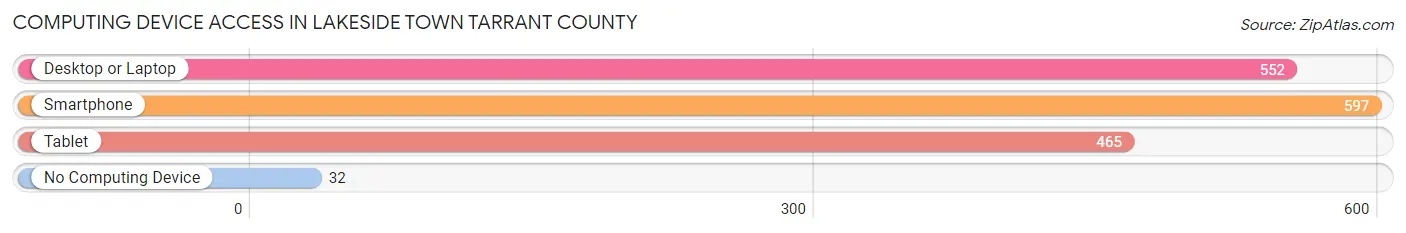
| Device Type | # Households | % Households |
| Desktop or Laptop | 552 | 83.5% |
| Smartphone | 597 | 90.3% |
| Tablet | 465 | 70.4% |
| No Computing Device | 32 | 4.8% |
| Total | 661 | 100.0% |
Internet Access in Lakeside town Tarrant County
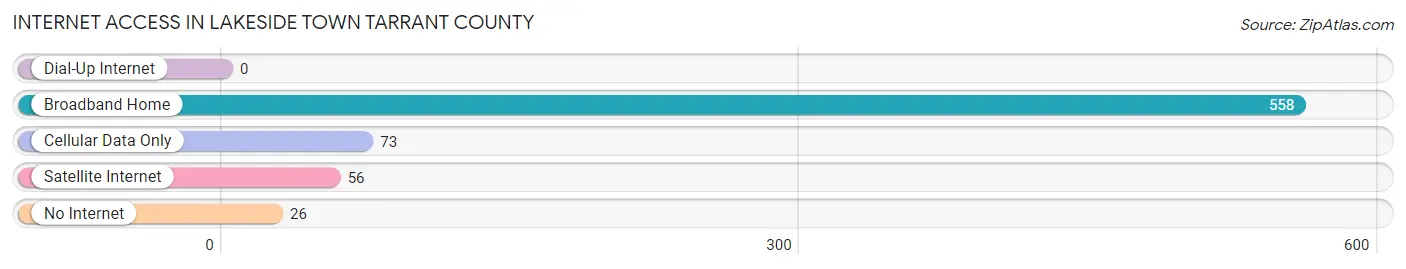
| Internet Type | # Households | % Households |
| Dial-Up Internet | 0 | 0.0% |
| Broadband Home | 558 | 84.4% |
| Cellular Data Only | 73 | 11.0% |
| Satellite Internet | 56 | 8.5% |
| No Internet | 26 | 3.9% |
| Total | 661 | 100.0% |
Lakeside town Tarrant County Summary
Tarrant County, Texas is located in the north-central part of the state and is part of the Dallas-Fort Worth-Arlington metropolitan area. It is the third-most populous county in Texas, with a population of 2,054,475 as of the 2020 census. The county seat is Fort Worth, and the largest city is Arlington.
Geography
Tarrant County is located in the north-central part of Texas, and is bordered by Denton County to the north, Johnson County to the east, Parker County to the south, and Wise County to the west. The county covers an area of 890 square miles, with the Trinity River forming its northern boundary. The county is part of the Dallas-Fort Worth-Arlington metropolitan area, and is home to several cities and towns, including Fort Worth, Arlington, Mansfield, Grand Prairie, Hurst, Euless, Bedford, and Keller.
History
Tarrant County was established in 1849, and was named after Edward H. Tarrant, a prominent figure in the Texas Revolution. The county was originally part of Navarro County, and was later divided into two parts, with the western portion becoming Tarrant County. The county was initially sparsely populated, but began to grow rapidly in the late 19th century with the arrival of the railroad. The population continued to grow throughout the 20th century, and by the 2020 census, the county had a population of over 2 million.
Economy
Tarrant County has a diverse economy, with a variety of industries providing employment opportunities. The county is home to several major corporations, including American Airlines, Lockheed Martin, and Bell Helicopter. The county is also home to several military bases, including Naval Air Station Joint Reserve Base Fort Worth, and the Army's Fort Worth Army Airfield. The county is also home to several universities, including the University of Texas at Arlington, Texas Christian University, and Texas Wesleyan University.
The county's economy is largely driven by the service sector, with healthcare, retail, and education being the largest employers. The county is also home to several major manufacturing companies, including General Motors, Lockheed Martin, and Bell Helicopter. The county is also home to several major oil and gas companies, including ExxonMobil, Chevron, and ConocoPhillips.
Demographics
As of the 2020 census, Tarrant County had a population of 2,054,475, making it the third-most populous county in Texas. The population is racially and ethnically diverse, with the largest racial group being White (54.3%), followed by Hispanic or Latino (30.2%), Black or African American (11.2%), and Asian (3.2%). The median household income is $63,845, and the median home value is $213,400.
Lakeside Town
Lakeside Town is a small town located in Tarrant County, Texas. The town is located on the shores of Lake Arlington, and is home to a population of approximately 1,500 people. The town is known for its small-town charm, and is home to several parks, restaurants, and shops. The town is also home to several schools, including Lakeside Elementary School, Lakeside Middle School, and Lakeside High School. The town is also home to several churches, including Lakeside Baptist Church, Lakeside United Methodist Church, and Lakeside Presbyterian Church.
Common Questions
What is the Total Population of Lakeside town Tarrant County?
Total Population of Lakeside town Tarrant County is 1,898.
What is the Total Male Population of Lakeside town Tarrant County?
Total Male Population of Lakeside town Tarrant County is 932.
What is the Total Female Population of Lakeside town Tarrant County?
Total Female Population of Lakeside town Tarrant County is 966.
What is the Ratio of Males per 100 Females in Lakeside town Tarrant County?
There are 96.48 Males per 100 Females in Lakeside town Tarrant County.
What is the Ratio of Females per 100 Males in Lakeside town Tarrant County?
There are 103.65 Females per 100 Males in Lakeside town Tarrant County.
What is the Median Population Age in Lakeside town Tarrant County?
Median Population Age in Lakeside town Tarrant County is 39.1 Years.
What is the Average Family Size in Lakeside town Tarrant County
Average Family Size in Lakeside town Tarrant County is 3.2 People.
What is the Average Household Size in Lakeside town Tarrant County
Average Household Size in Lakeside town Tarrant County is 2.9 People.
What is Per Capita Income in Lakeside town Tarrant County?
Per Capita income in Lakeside town Tarrant County is $43,214.
What is the Median Family Income in Lakeside town Tarrant County?
Median Family Income in Lakeside town Tarrant County is $114,412.
What is the Median Household income in Lakeside town Tarrant County?
Median Household Income in Lakeside town Tarrant County is $94,375.
What is Income or Wage Gap in Lakeside town Tarrant County?
Income or Wage Gap in Lakeside town Tarrant County is 56.9%.
Women in Lakeside town Tarrant County earn 43.1 cents for every dollar earned by a man.
What is Inequality or Gini Index in Lakeside town Tarrant County?
Inequality or Gini Index in Lakeside town Tarrant County is 0.42.
How Large is the Labor Force in Lakeside town Tarrant County?
There are 981 People in the Labor Forcein in Lakeside town Tarrant County.
What is the Percentage of People in the Labor Force in Lakeside town Tarrant County?
67.3% of People are in the Labor Force in Lakeside town Tarrant County.
What is the Unemployment Rate in Lakeside town Tarrant County?
Unemployment Rate in Lakeside town Tarrant County is 2.4%.