Westwood Shores, TX
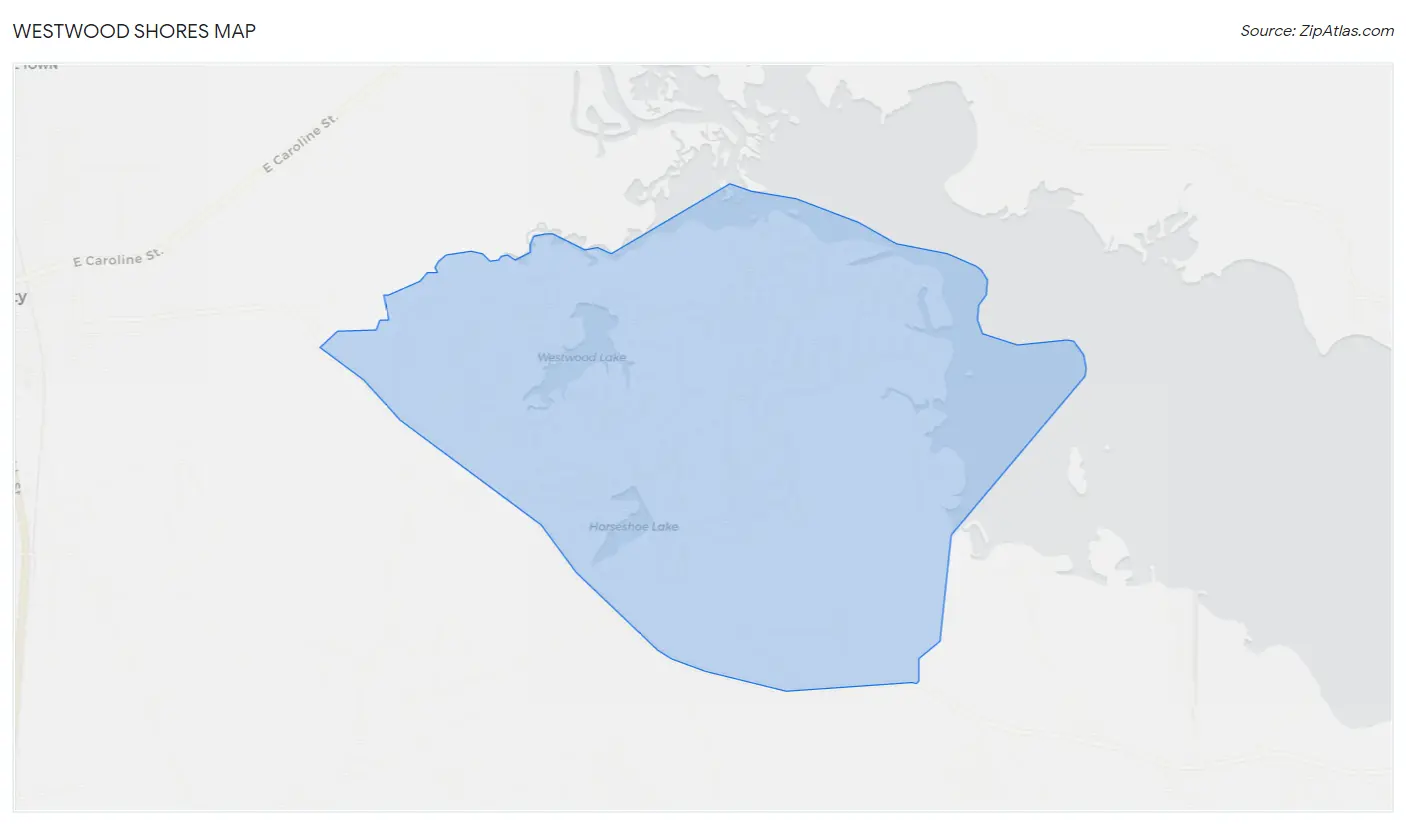
Westwood Shores Map
Westwood Shores Overview
1,534
TOTAL POPULATION
790
MALE POPULATION
744
FEMALE POPULATION
106.18
MALES / 100 FEMALES
94.18
FEMALES / 100 MALES
60.4
MEDIAN AGE
2.5
AVG FAMILY SIZE
2.2
AVG HOUSEHOLD SIZE
$41,758
PER CAPITA INCOME
$82,115
AVG FAMILY INCOME
$65,714
AVG HOUSEHOLD INCOME
3.3%
WAGE / INCOME GAP [ % ]
96.7¢/ $1
WAGE / INCOME GAP [ $ ]
0.47
INEQUALITY / GINI INDEX
453
LABOR FORCE [ PEOPLE ]
34.1%
PERCENT IN LABOR FORCE
7.7%
UNEMPLOYMENT RATE
Race in Westwood Shores
The most populous races in Westwood Shores are White / Caucasian (1,514 | 98.7%), Hispanic or Latino (29 | 1.9%), and Two or more Races (20 | 1.3%).
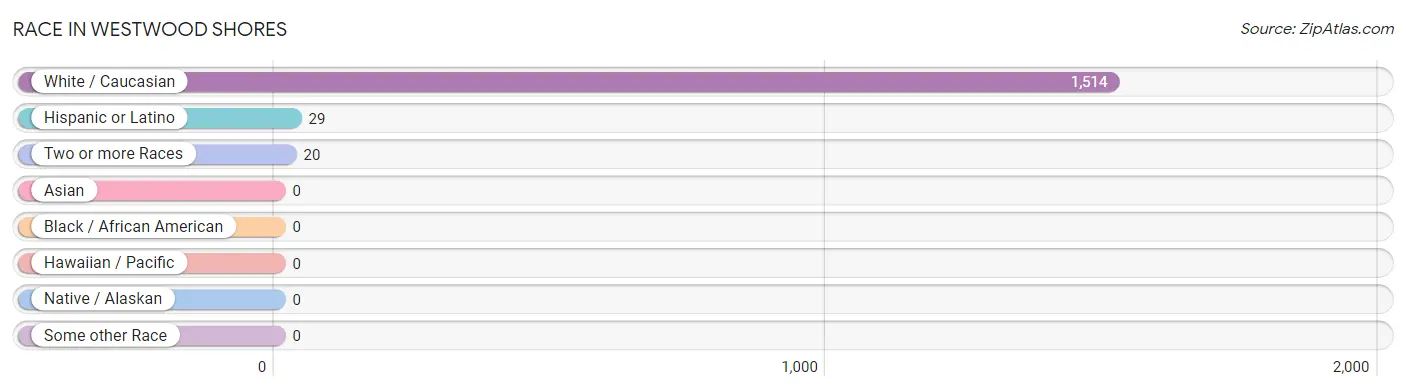
| Race | # Population | % Population |
| Asian | 0 | 0.0% |
| Black / African American | 0 | 0.0% |
| Hawaiian / Pacific | 0 | 0.0% |
| Hispanic or Latino | 29 | 1.9% |
| Native / Alaskan | 0 | 0.0% |
| White / Caucasian | 1,514 | 98.7% |
| Two or more Races | 20 | 1.3% |
| Some other Race | 0 | 0.0% |
| Total | 1,534 | 100.0% |
Ancestry in Westwood Shores
The most populous ancestries reported in Westwood Shores are English (343 | 22.4%), German (338 | 22.0%), Irish (136 | 8.9%), American (119 | 7.8%), and French (101 | 6.6%), together accounting for 67.6% of all Westwood Shores residents.
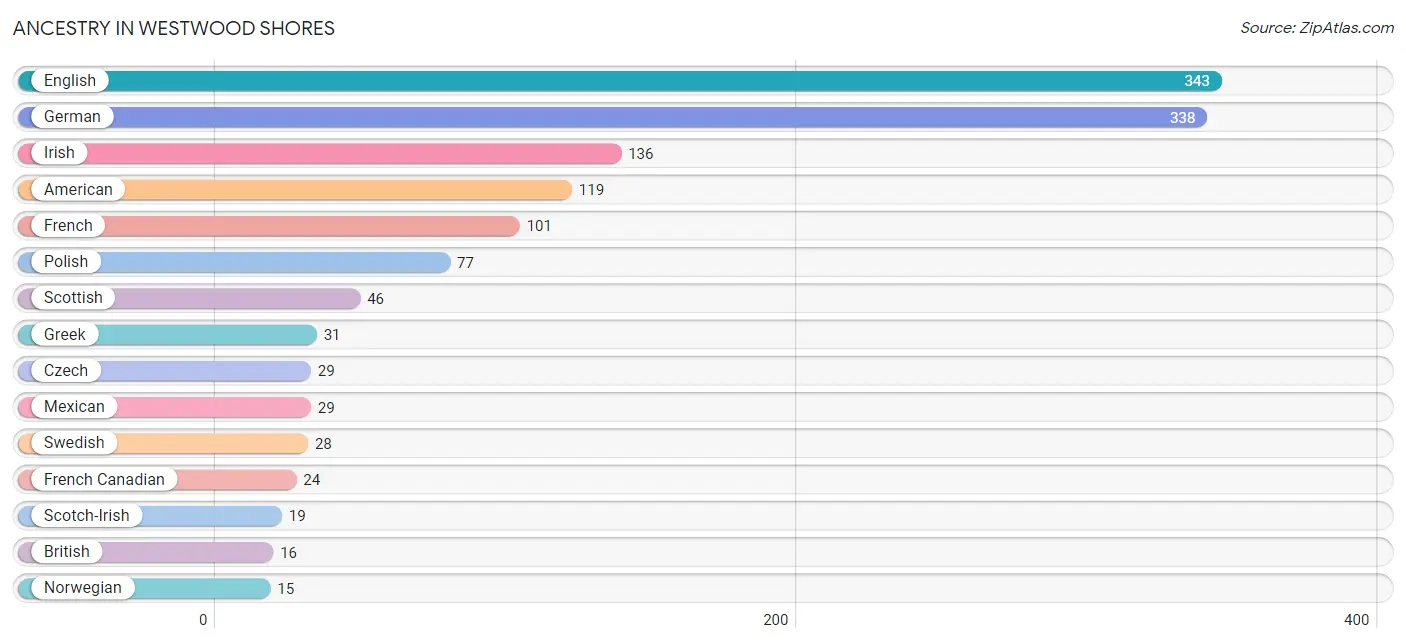
| Ancestry | # Population | % Population |
| American | 119 | 7.8% |
| British | 16 | 1.0% |
| Czech | 29 | 1.9% |
| English | 343 | 22.4% |
| French | 101 | 6.6% |
| French Canadian | 24 | 1.6% |
| German | 338 | 22.0% |
| Greek | 31 | 2.0% |
| Irish | 136 | 8.9% |
| Italian | 9 | 0.6% |
| Mexican | 29 | 1.9% |
| Norwegian | 15 | 1.0% |
| Polish | 77 | 5.0% |
| Scotch-Irish | 19 | 1.2% |
| Scottish | 46 | 3.0% |
| Swedish | 28 | 1.8% | View All 16 Rows |
Immigrants in Westwood Shores

| Immigration Origin | # Population | % Population | View All 0 Rows |
Sex and Age in Westwood Shores
Sex and Age in Westwood Shores
The most populous age groups in Westwood Shores are 75 to 79 Years (154 | 19.5%) for men and 75 to 79 Years (108 | 14.5%) for women.
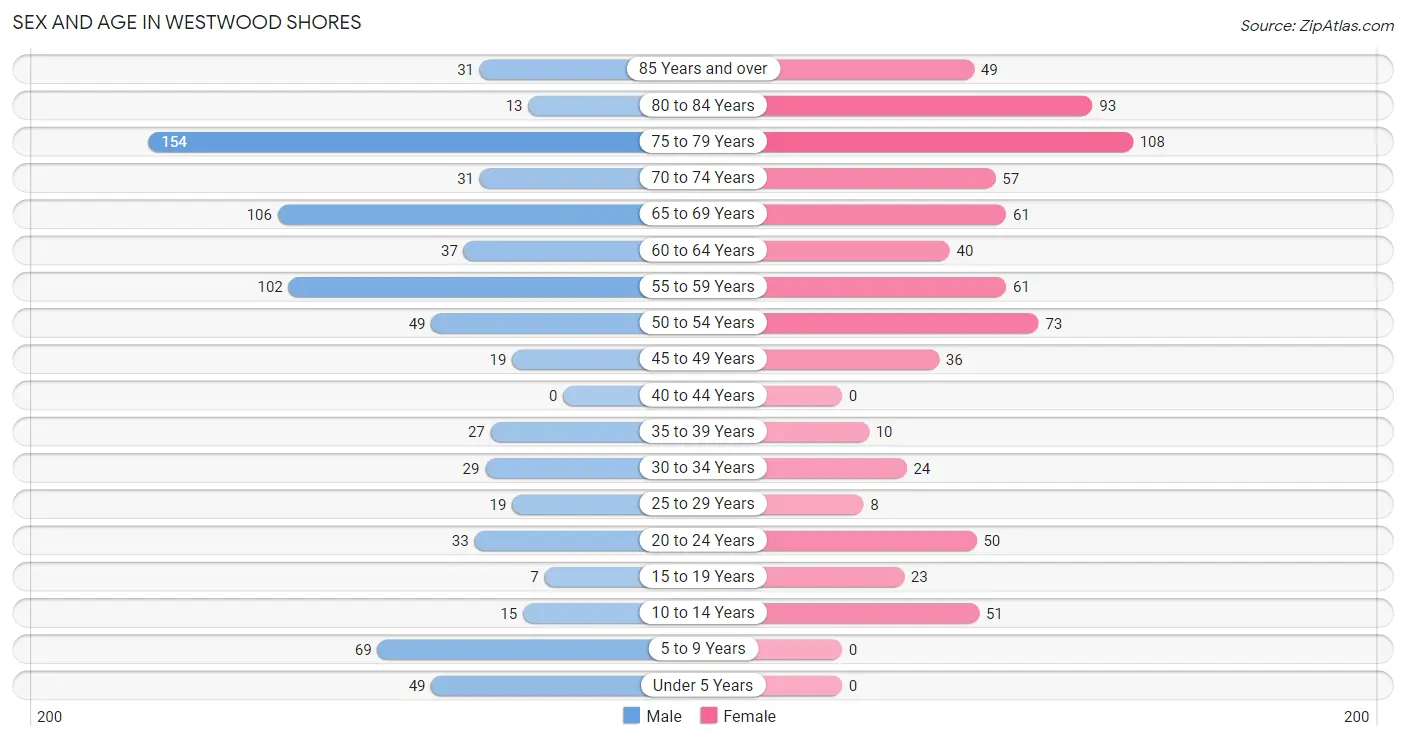
| Age Bracket | Male | Female |
| Under 5 Years | 49 (6.2%) | 0 (0.0%) |
| 5 to 9 Years | 69 (8.7%) | 0 (0.0%) |
| 10 to 14 Years | 15 (1.9%) | 51 (6.9%) |
| 15 to 19 Years | 7 (0.9%) | 23 (3.1%) |
| 20 to 24 Years | 33 (4.2%) | 50 (6.7%) |
| 25 to 29 Years | 19 (2.4%) | 8 (1.1%) |
| 30 to 34 Years | 29 (3.7%) | 24 (3.2%) |
| 35 to 39 Years | 27 (3.4%) | 10 (1.3%) |
| 40 to 44 Years | 0 (0.0%) | 0 (0.0%) |
| 45 to 49 Years | 19 (2.4%) | 36 (4.8%) |
| 50 to 54 Years | 49 (6.2%) | 73 (9.8%) |
| 55 to 59 Years | 102 (12.9%) | 61 (8.2%) |
| 60 to 64 Years | 37 (4.7%) | 40 (5.4%) |
| 65 to 69 Years | 106 (13.4%) | 61 (8.2%) |
| 70 to 74 Years | 31 (3.9%) | 57 (7.7%) |
| 75 to 79 Years | 154 (19.5%) | 108 (14.5%) |
| 80 to 84 Years | 13 (1.7%) | 93 (12.5%) |
| 85 Years and over | 31 (3.9%) | 49 (6.6%) |
| Total | 790 (100.0%) | 744 (100.0%) |
Families and Households in Westwood Shores
Median Family Size in Westwood Shores
The median family size in Westwood Shores is 2.52 persons per family, with single male/father families (40 | 7.6%) accounting for the largest median family size of 4.53 persons per family. On the other hand, married-couple families (450 | 85.9%) represent the smallest median family size with 2.34 persons per family.
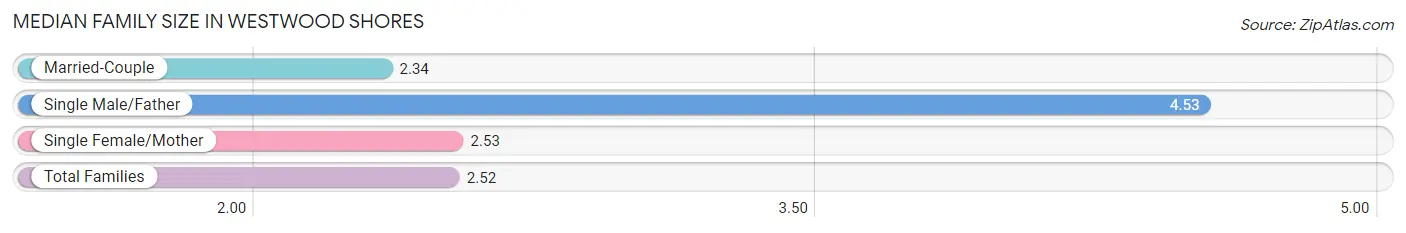
| Family Type | # Families | Family Size |
| Married-Couple | 450 (85.9%) | 2.34 |
| Single Male/Father | 40 (7.6%) | 4.53 |
| Single Female/Mother | 34 (6.5%) | 2.53 |
| Total Families | 524 (100.0%) | 2.52 |
Median Household Size in Westwood Shores
The median household size in Westwood Shores is 2.20 persons per household, with single male/father households (40 | 5.7%) accounting for the largest median household size of 4.53 persons per household. non-family households (174 | 24.9%) represent the smallest median household size with 1.24 persons per household.
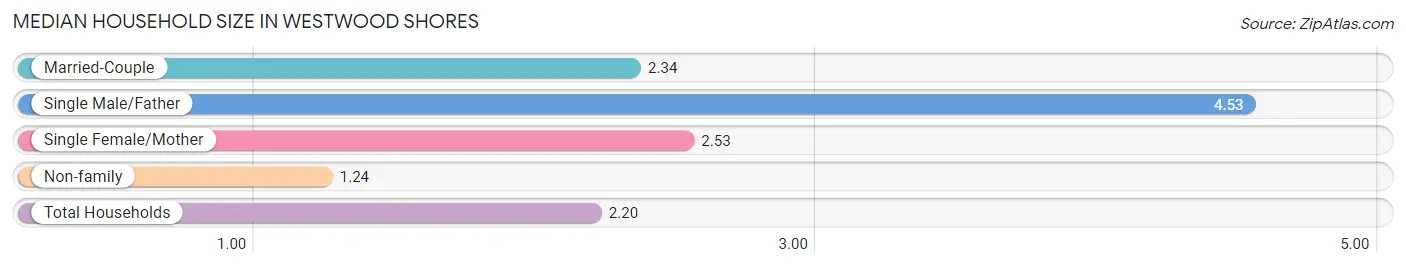
| Household Type | # Households | Household Size |
| Married-Couple | 450 (64.5%) | 2.34 |
| Single Male/Father | 40 (5.7%) | 4.53 |
| Single Female/Mother | 34 (4.9%) | 2.53 |
| Non-family | 174 (24.9%) | 1.24 |
| Total Households | 698 (100.0%) | 2.20 |
Household Size by Marriage Status in Westwood Shores
Out of a total of 698 households in Westwood Shores, 524 (75.1%) are family households, while 174 (24.9%) are nonfamily households. The most numerous type of family households are 2-person households, comprising 403, and the most common type of nonfamily households are 1-person households, comprising 151.
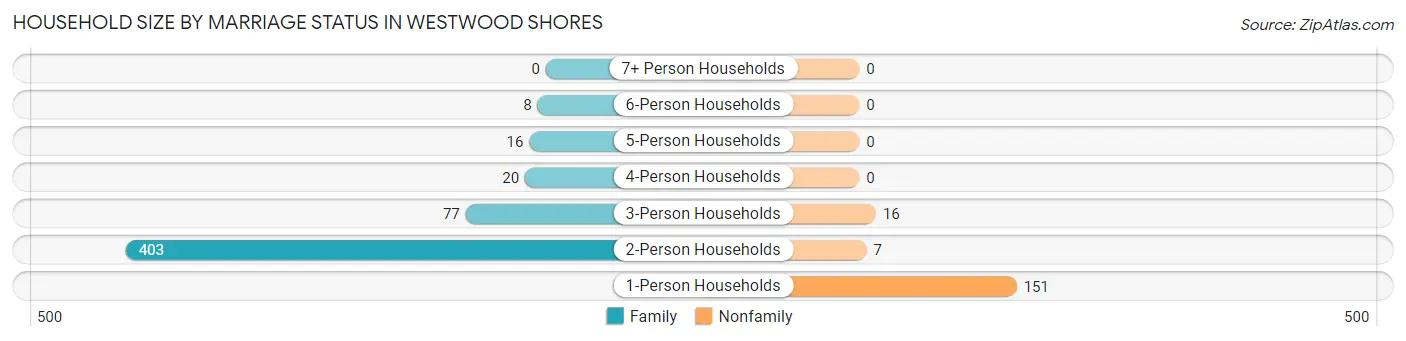
| Household Size | Family Households | Nonfamily Households |
| 1-Person Households | - | 151 (21.6%) |
| 2-Person Households | 403 (57.7%) | 7 (1.0%) |
| 3-Person Households | 77 (11.0%) | 16 (2.3%) |
| 4-Person Households | 20 (2.9%) | 0 (0.0%) |
| 5-Person Households | 16 (2.3%) | 0 (0.0%) |
| 6-Person Households | 8 (1.1%) | 0 (0.0%) |
| 7+ Person Households | 0 (0.0%) | 0 (0.0%) |
| Total | 524 (75.1%) | 174 (24.9%) |
Female Fertility in Westwood Shores
Fertility by Age in Westwood Shores
| Age Bracket | Women with Births | Births / 1,000 Women |
| 15 to 19 years | 0 (0.0%) | 0.0 |
| 20 to 34 years | 0 (0.0%) | 0.0 |
| 35 to 50 years | 0 (0.0%) | 0.0 |
| Total | 0 (0.0%) | 0.0 |
Fertility by Age by Marriage Status in Westwood Shores
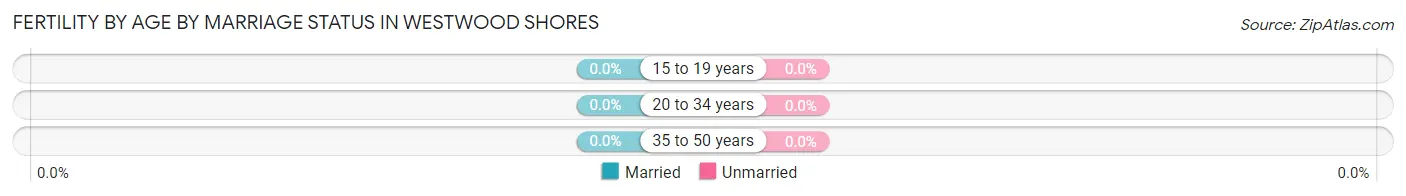
| Age Bracket | Married | Unmarried |
| 15 to 19 years | 0 (0.0%) | 0 (0.0%) |
| 20 to 34 years | 0 (0.0%) | 0 (0.0%) |
| 35 to 50 years | 0 (0.0%) | 0 (0.0%) |
| Total | 0 (0.0%) | 0 (0.0%) |
Fertility by Education in Westwood Shores
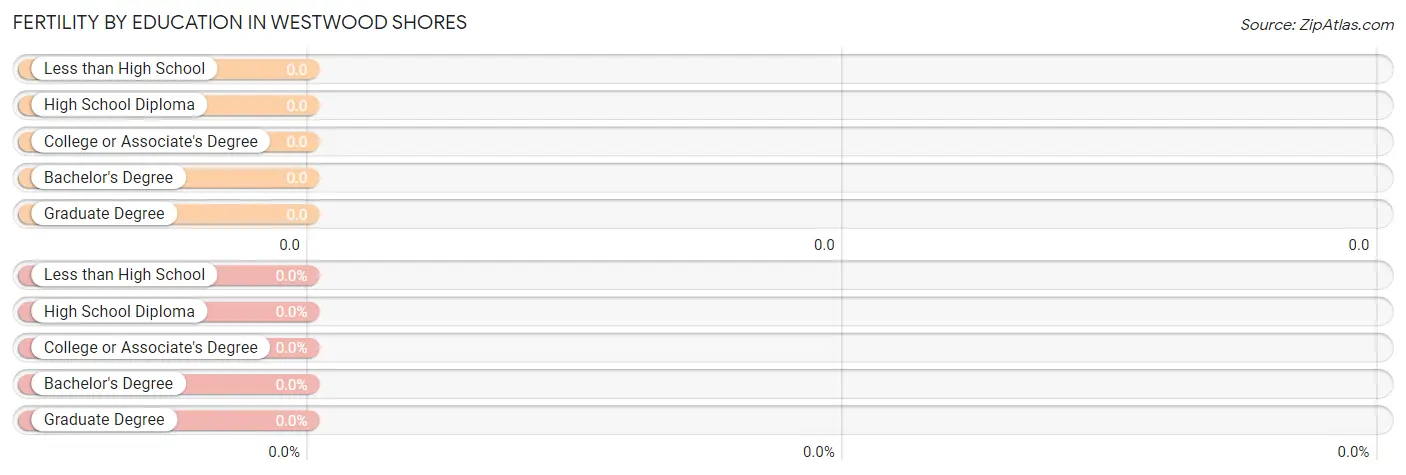
| Educational Attainment | Women with Births | Births / 1,000 Women |
| Less than High School | 0 (0.0%) | 0.0 |
| High School Diploma | 0 (0.0%) | 0.0 |
| College or Associate's Degree | 0 (0.0%) | 0.0 |
| Bachelor's Degree | 0 (0.0%) | 0.0 |
| Graduate Degree | 0 (0.0%) | 0.0 |
| Total | 0 (0.0%) | 0.0 |
Fertility by Education by Marriage Status in Westwood Shores
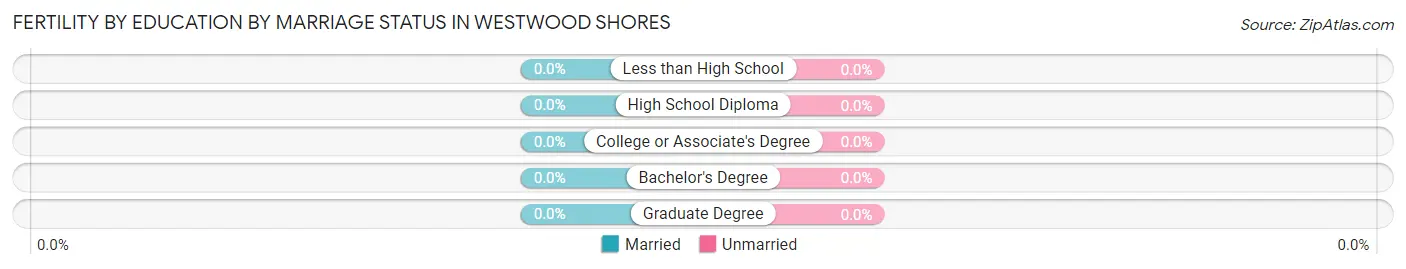
| Educational Attainment | Married | Unmarried |
| Less than High School | 0 (0.0%) | 0 (0.0%) |
| High School Diploma | 0 (0.0%) | 0 (0.0%) |
| College or Associate's Degree | 0 (0.0%) | 0 (0.0%) |
| Bachelor's Degree | 0 (0.0%) | 0 (0.0%) |
| Graduate Degree | 0 (0.0%) | 0 (0.0%) |
| Total | 0 (0.0%) | 0 (0.0%) |
Income in Westwood Shores
Income Overview in Westwood Shores
Per Capita Income in Westwood Shores is $41,758, while median incomes of families and households are $82,115 and $65,714 respectively.
| Characteristic | Number | Measure |
| Per Capita Income | 1,534 | $41,758 |
| Median Family Income | 524 | $82,115 |
| Mean Family Income | 524 | $111,211 |
| Median Household Income | 698 | $65,714 |
| Mean Household Income | 698 | $94,145 |
| Income Deficit | 524 | $0 |
| Wage / Income Gap (%) | 1,534 | 3.26% |
| Wage / Income Gap ($) | 1,534 | 96.74¢ per $1 |
| Gini / Inequality Index | 1,534 | 0.47 |
Earnings by Sex in Westwood Shores
Average Earnings in Westwood Shores are $38,990, $38,393 for men and $39,688 for women, a difference of 3.3%.
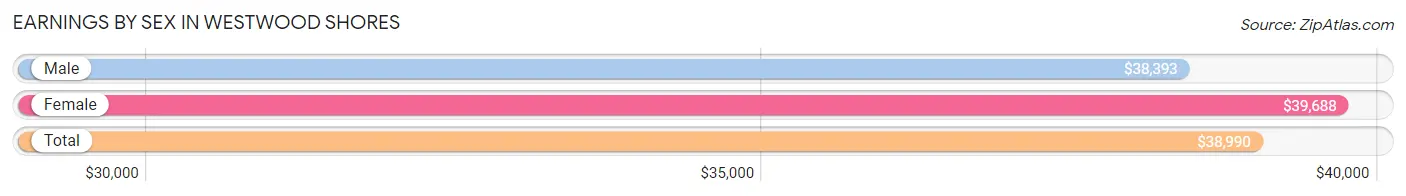
| Sex | Number | Average Earnings |
| Male | 294 (53.7%) | $38,393 |
| Female | 253 (46.3%) | $39,688 |
| Total | 547 (100.0%) | $38,990 |
Earnings by Sex by Income Bracket in Westwood Shores
The most common earnings brackets in Westwood Shores are $100,000+ for men (83 | 28.2%) and $75,000 to $99,999 for women (76 | 30.0%).
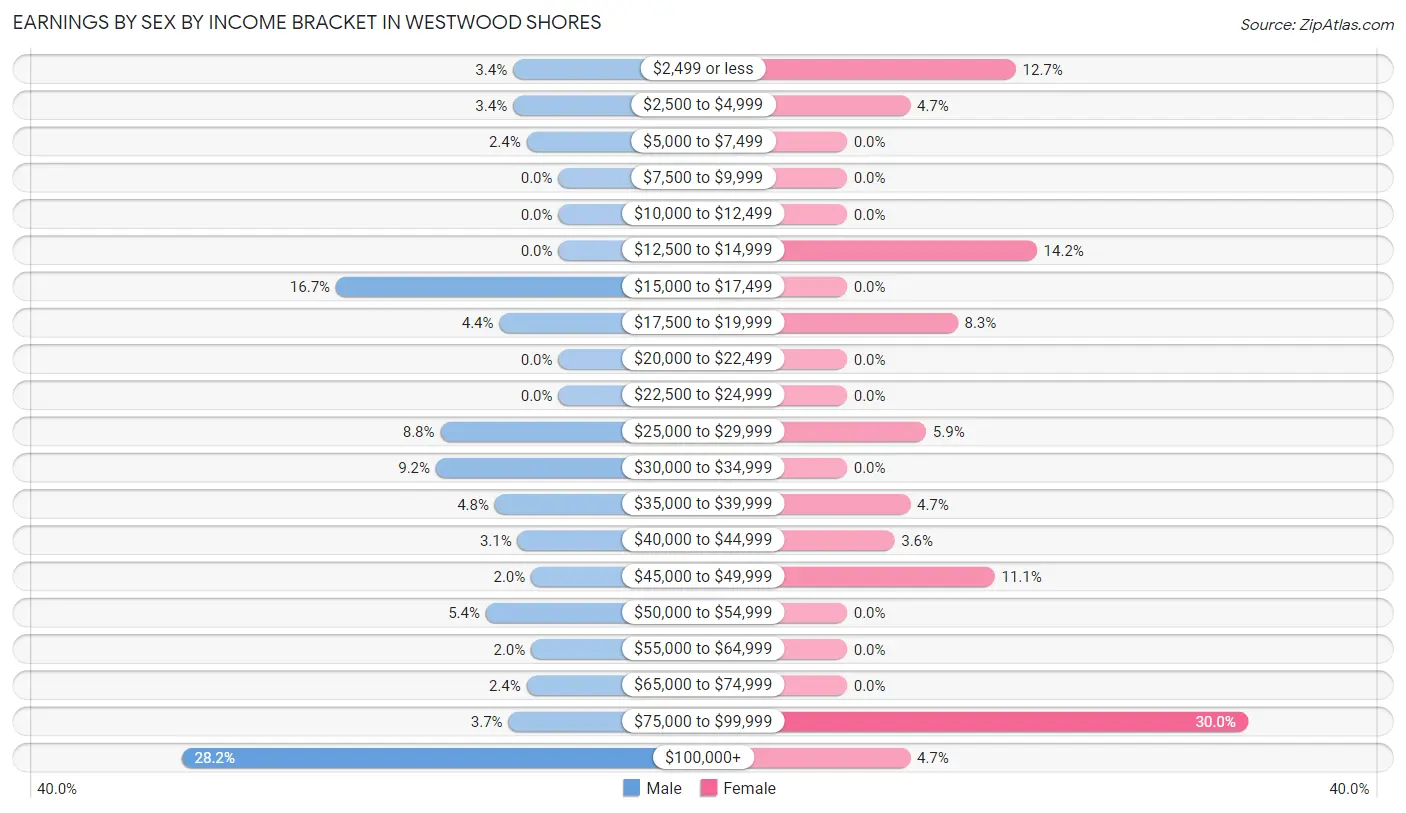
| Income | Male | Female |
| $2,499 or less | 10 (3.4%) | 32 (12.7%) |
| $2,500 to $4,999 | 10 (3.4%) | 12 (4.7%) |
| $5,000 to $7,499 | 7 (2.4%) | 0 (0.0%) |
| $7,500 to $9,999 | 0 (0.0%) | 0 (0.0%) |
| $10,000 to $12,499 | 0 (0.0%) | 0 (0.0%) |
| $12,500 to $14,999 | 0 (0.0%) | 36 (14.2%) |
| $15,000 to $17,499 | 49 (16.7%) | 0 (0.0%) |
| $17,500 to $19,999 | 13 (4.4%) | 21 (8.3%) |
| $20,000 to $22,499 | 0 (0.0%) | 0 (0.0%) |
| $22,500 to $24,999 | 0 (0.0%) | 0 (0.0%) |
| $25,000 to $29,999 | 26 (8.8%) | 15 (5.9%) |
| $30,000 to $34,999 | 27 (9.2%) | 0 (0.0%) |
| $35,000 to $39,999 | 14 (4.8%) | 12 (4.7%) |
| $40,000 to $44,999 | 9 (3.1%) | 9 (3.6%) |
| $45,000 to $49,999 | 6 (2.0%) | 28 (11.1%) |
| $50,000 to $54,999 | 16 (5.4%) | 0 (0.0%) |
| $55,000 to $64,999 | 6 (2.0%) | 0 (0.0%) |
| $65,000 to $74,999 | 7 (2.4%) | 0 (0.0%) |
| $75,000 to $99,999 | 11 (3.7%) | 76 (30.0%) |
| $100,000+ | 83 (28.2%) | 12 (4.7%) |
| Total | 294 (100.0%) | 253 (100.0%) |
Earnings by Sex by Educational Attainment in Westwood Shores
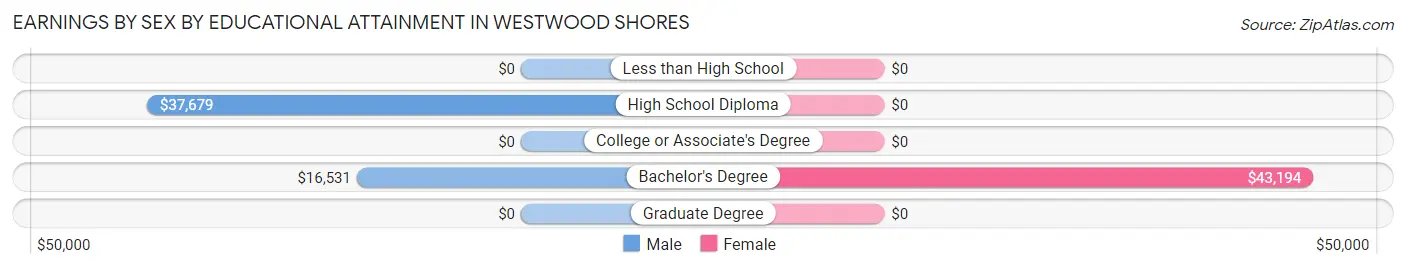
| Educational Attainment | Male Income | Female Income |
| Less than High School | - | - |
| High School Diploma | $37,679 | $0 |
| College or Associate's Degree | - | - |
| Bachelor's Degree | $16,531 | $43,194 |
| Graduate Degree | - | - |
| Total | - | - |
Family Income in Westwood Shores
Family Income Brackets in Westwood Shores
According to the Westwood Shores family income data, there are 130 families falling into the $35,000 to $49,999 income range, which is the most common income bracket and makes up 24.8% of all families.
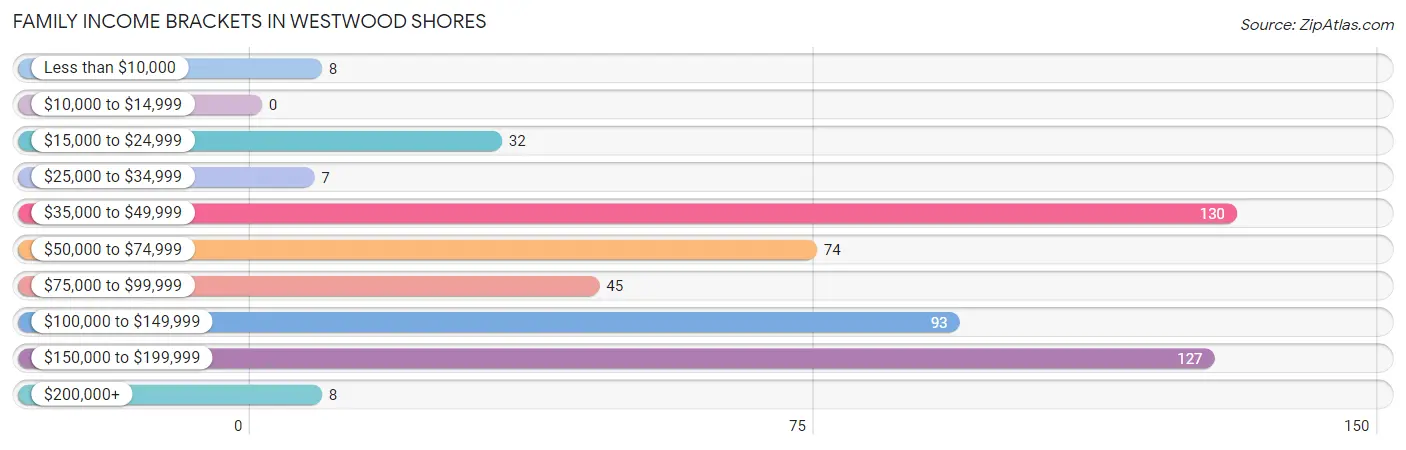
| Income Bracket | # Families | % Families |
| Less than $10,000 | 8 | 1.5% |
| $10,000 to $14,999 | 0 | 0.0% |
| $15,000 to $24,999 | 32 | 6.1% |
| $25,000 to $34,999 | 7 | 1.3% |
| $35,000 to $49,999 | 130 | 24.8% |
| $50,000 to $74,999 | 74 | 14.1% |
| $75,000 to $99,999 | 45 | 8.6% |
| $100,000 to $149,999 | 93 | 17.7% |
| $150,000 to $199,999 | 127 | 24.2% |
| $200,000+ | 8 | 1.5% |
Family Income by Famaliy Size in Westwood Shores
2-person families (403 | 76.9%) account for the highest median family income in Westwood Shores with $65,625 per family, while 2-person families (403 | 76.9%) have the highest median income of $32,812 per family member.
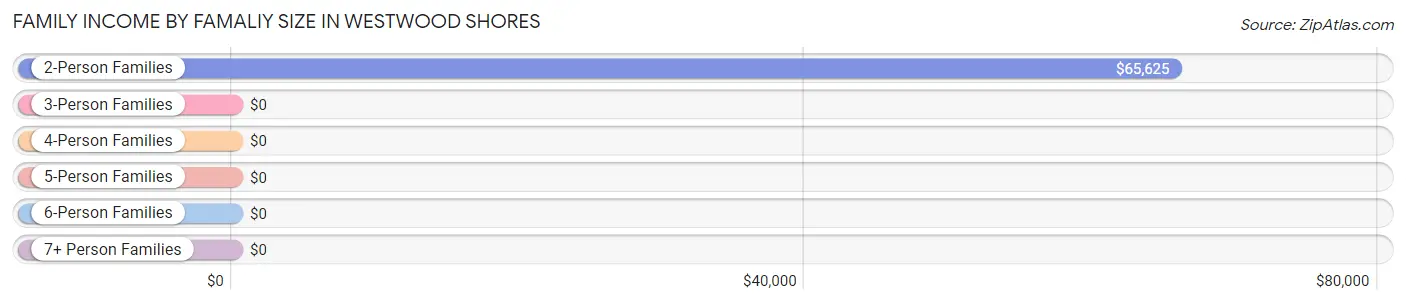
| Income Bracket | # Families | Median Income |
| 2-Person Families | 403 (76.9%) | $65,625 |
| 3-Person Families | 77 (14.7%) | $0 |
| 4-Person Families | 20 (3.8%) | $0 |
| 5-Person Families | 16 (3.0%) | $0 |
| 6-Person Families | 8 (1.5%) | $0 |
| 7+ Person Families | 0 (0.0%) | $0 |
| Total | 524 (100.0%) | $82,115 |
Family Income by Number of Earners in Westwood Shores
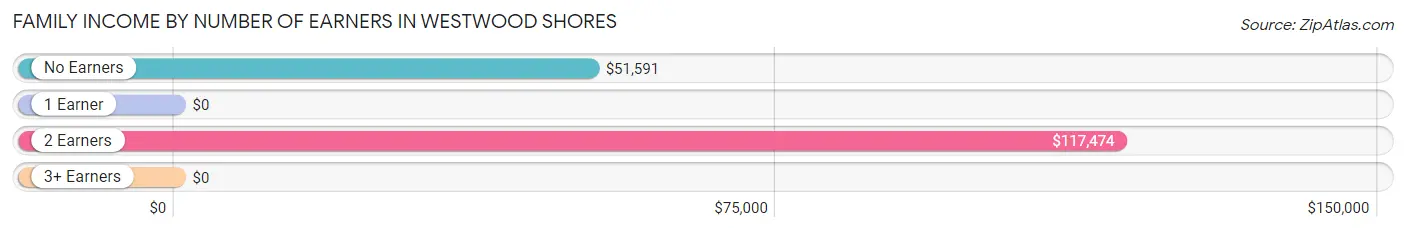
| Number of Earners | # Families | Median Income |
| No Earners | 208 (39.7%) | $51,591 |
| 1 Earner | 197 (37.6%) | $0 |
| 2 Earners | 113 (21.6%) | $117,474 |
| 3+ Earners | 6 (1.1%) | $0 |
| Total | 524 (100.0%) | $82,115 |
Household Income in Westwood Shores
Household Income Brackets in Westwood Shores
With 168 households falling in the category, the $35,000 to $49,999 income range is the most frequent in Westwood Shores, accounting for 24.1% of all households.
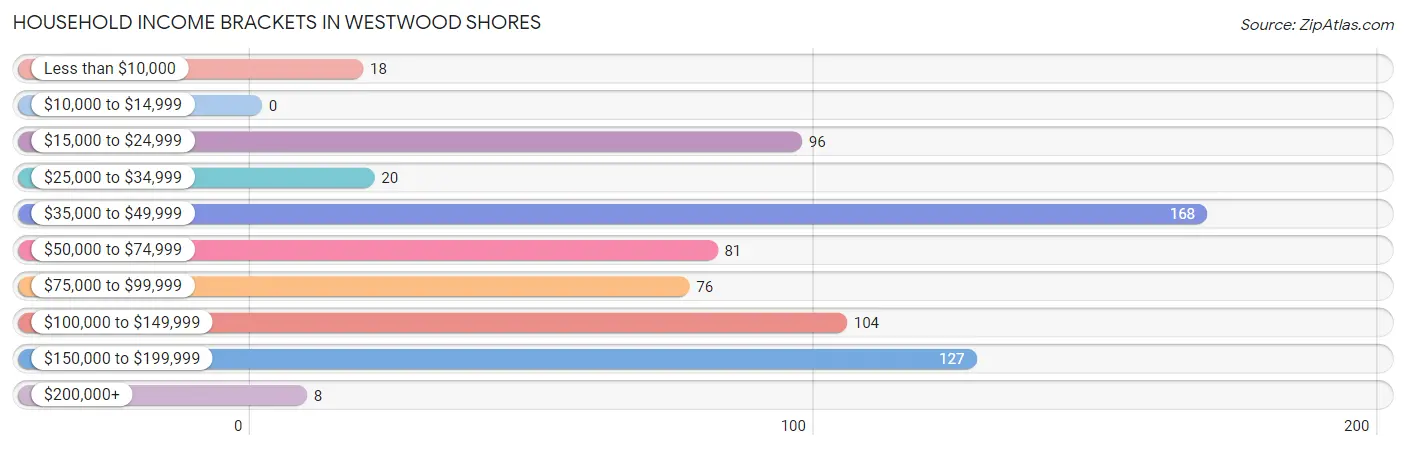
| Income Bracket | # Households | % Households |
| Less than $10,000 | 18 | 2.6% |
| $10,000 to $14,999 | 0 | 0.0% |
| $15,000 to $24,999 | 96 | 13.8% |
| $25,000 to $34,999 | 20 | 2.9% |
| $35,000 to $49,999 | 168 | 24.1% |
| $50,000 to $74,999 | 81 | 11.6% |
| $75,000 to $99,999 | 76 | 10.9% |
| $100,000 to $149,999 | 104 | 14.9% |
| $150,000 to $199,999 | 127 | 18.2% |
| $200,000+ | 8 | 1.1% |
Household Income by Householder Age in Westwood Shores
The median household income in Westwood Shores is $65,714, with the highest median household income of $116,531 found in the 45 to 64 years age bracket for the primary householder. A total of 266 households (38.1%) fall into this category. Meanwhile, the 15 to 24 years age bracket for the primary householder has the lowest median household income of $0, with 16 households (2.3%) in this group.
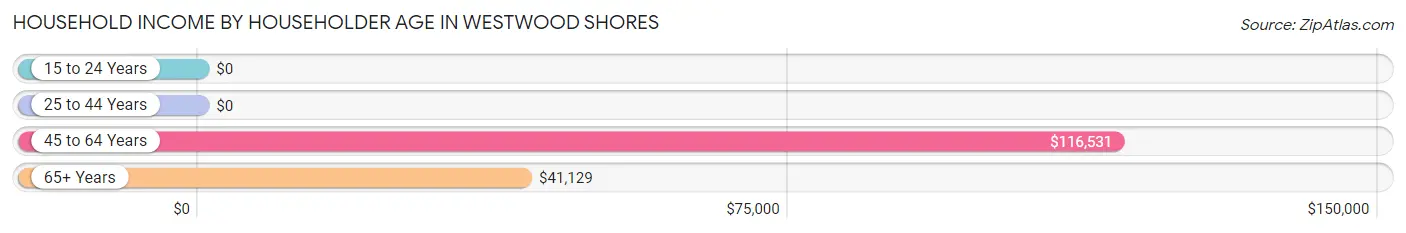
| Income Bracket | # Households | Median Income |
| 15 to 24 Years | 16 (2.3%) | $0 |
| 25 to 44 Years | 38 (5.4%) | $0 |
| 45 to 64 Years | 266 (38.1%) | $116,531 |
| 65+ Years | 378 (54.1%) | $41,129 |
| Total | 698 (100.0%) | $65,714 |
Poverty in Westwood Shores
Income Below Poverty by Sex and Age in Westwood Shores
With 3.2% poverty level for males and 1.2% for females among the residents of Westwood Shores, 16 and 17 year old males and 55 to 64 year old females are the most vulnerable to poverty, with 7 males (100.0%) and 9 females (8.9%) in their respective age groups living below the poverty level.
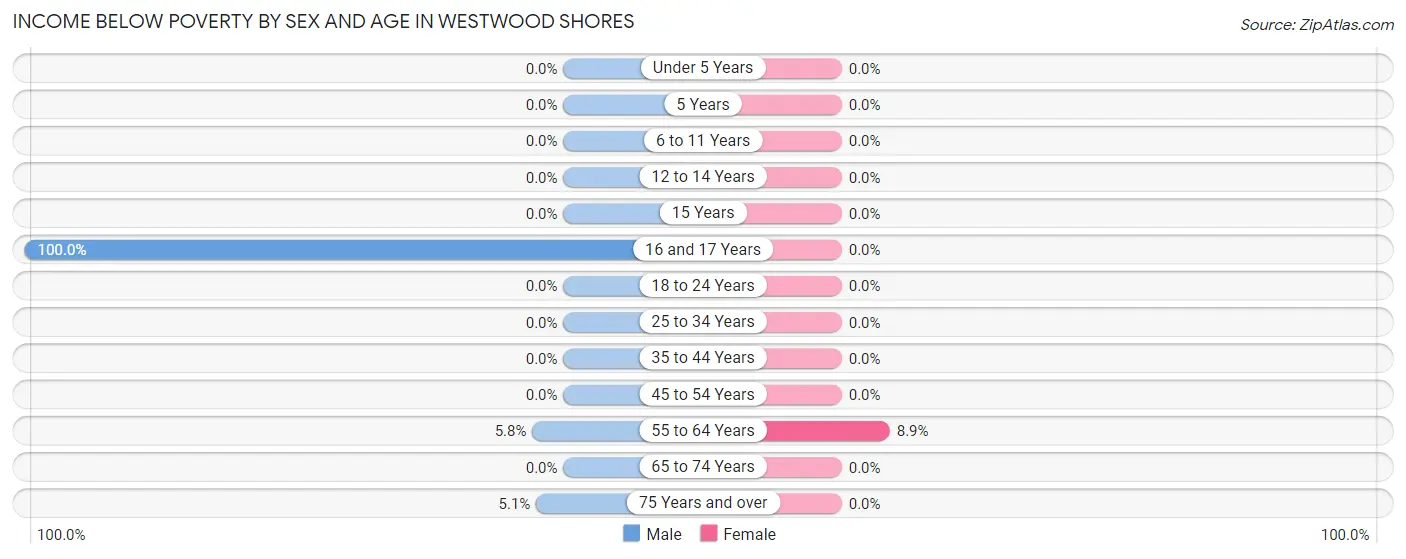
| Age Bracket | Male | Female |
| Under 5 Years | 0 (0.0%) | 0 (0.0%) |
| 5 Years | 0 (0.0%) | 0 (0.0%) |
| 6 to 11 Years | 0 (0.0%) | 0 (0.0%) |
| 12 to 14 Years | 0 (0.0%) | 0 (0.0%) |
| 15 Years | 0 (0.0%) | 0 (0.0%) |
| 16 and 17 Years | 7 (100.0%) | 0 (0.0%) |
| 18 to 24 Years | 0 (0.0%) | 0 (0.0%) |
| 25 to 34 Years | 0 (0.0%) | 0 (0.0%) |
| 35 to 44 Years | 0 (0.0%) | 0 (0.0%) |
| 45 to 54 Years | 0 (0.0%) | 0 (0.0%) |
| 55 to 64 Years | 8 (5.8%) | 9 (8.9%) |
| 65 to 74 Years | 0 (0.0%) | 0 (0.0%) |
| 75 Years and over | 10 (5.1%) | 0 (0.0%) |
| Total | 25 (3.2%) | 9 (1.2%) |
Income Above Poverty by Sex and Age in Westwood Shores
According to the poverty statistics in Westwood Shores, males aged under 5 years and females aged 6 to 11 years are the age groups that are most secure financially, with 100.0% of males and 100.0% of females in these age groups living above the poverty line.
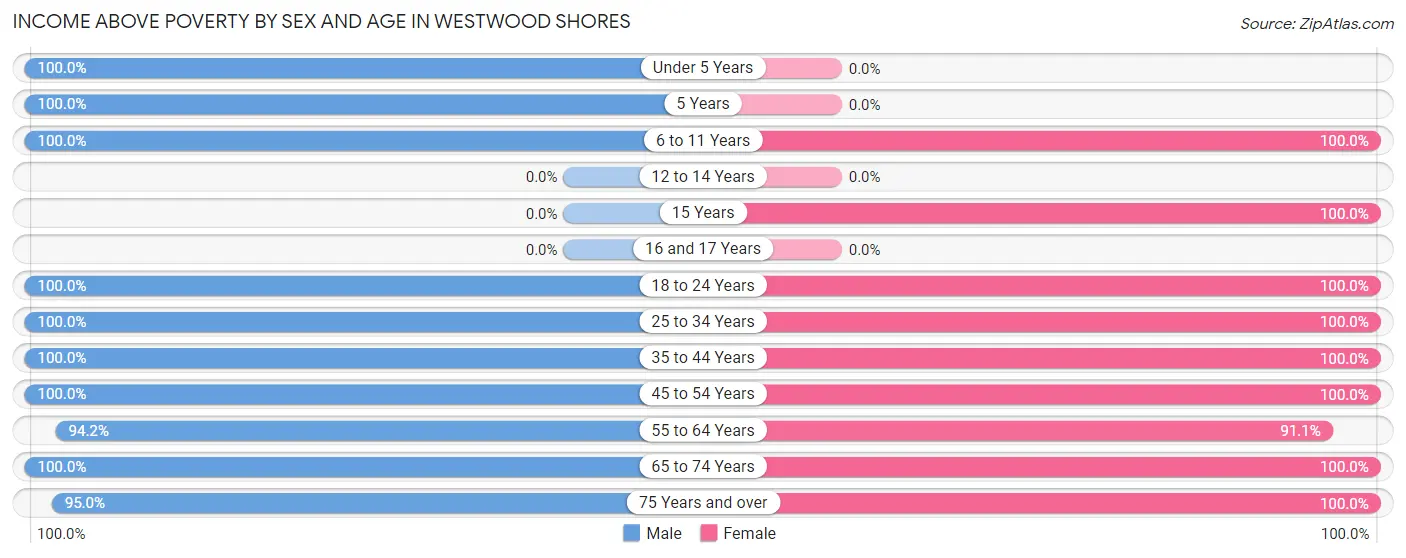
| Age Bracket | Male | Female |
| Under 5 Years | 49 (100.0%) | 0 (0.0%) |
| 5 Years | 30 (100.0%) | 0 (0.0%) |
| 6 to 11 Years | 54 (100.0%) | 51 (100.0%) |
| 12 to 14 Years | 0 (0.0%) | 0 (0.0%) |
| 15 Years | 0 (0.0%) | 23 (100.0%) |
| 16 and 17 Years | 0 (0.0%) | 0 (0.0%) |
| 18 to 24 Years | 33 (100.0%) | 50 (100.0%) |
| 25 to 34 Years | 48 (100.0%) | 32 (100.0%) |
| 35 to 44 Years | 27 (100.0%) | 10 (100.0%) |
| 45 to 54 Years | 68 (100.0%) | 109 (100.0%) |
| 55 to 64 Years | 131 (94.2%) | 92 (91.1%) |
| 65 to 74 Years | 137 (100.0%) | 118 (100.0%) |
| 75 Years and over | 188 (95.0%) | 250 (100.0%) |
| Total | 765 (96.8%) | 735 (98.8%) |
Income Below Poverty Among Married-Couple Families in Westwood Shores
The poverty statistics for married-couple families in Westwood Shores show that 1.8% or 8 of the total 450 families live below the poverty line. Families with no children have the highest poverty rate of 1.8%, comprising of 8 families. On the other hand, families with 3 or 4 children have the lowest poverty rate of 0.0%, which includes 0 families.
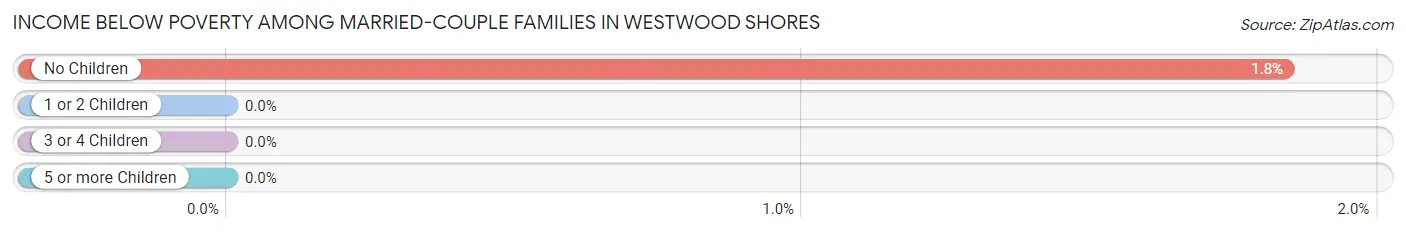
| Children | Above Poverty | Below Poverty |
| No Children | 426 (98.2%) | 8 (1.8%) |
| 1 or 2 Children | 0 (0.0%) | 0 (0.0%) |
| 3 or 4 Children | 16 (100.0%) | 0 (0.0%) |
| 5 or more Children | 0 (0.0%) | 0 (0.0%) |
| Total | 442 (98.2%) | 8 (1.8%) |
Income Below Poverty Among Single-Parent Households in Westwood Shores
| Children | Single Father | Single Mother |
| No Children | 0 (0.0%) | 0 (0.0%) |
| 1 or 2 Children | 0 (0.0%) | 0 (0.0%) |
| 3 or 4 Children | 0 (0.0%) | 0 (0.0%) |
| 5 or more Children | 0 (0.0%) | 0 (0.0%) |
| Total | 0 (0.0%) | 0 (0.0%) |
Income Below Poverty Among Married-Couple vs Single-Parent Households in Westwood Shores
| Children | Married-Couple Families | Single-Parent Households |
| No Children | 8 (1.8%) | 0 (0.0%) |
| 1 or 2 Children | 0 (0.0%) | 0 (0.0%) |
| 3 or 4 Children | 0 (0.0%) | 0 (0.0%) |
| 5 or more Children | 0 (0.0%) | 0 (0.0%) |
| Total | 8 (1.8%) | 0 (0.0%) |
Employment Characteristics in Westwood Shores
Employment by Class of Employer in Westwood Shores
Among the 417 employed individuals in Westwood Shores, private company employees (304 | 72.9%), state government employees (49 | 11.7%), and local government employees (42 | 10.1%) make up the most common classes of employment.
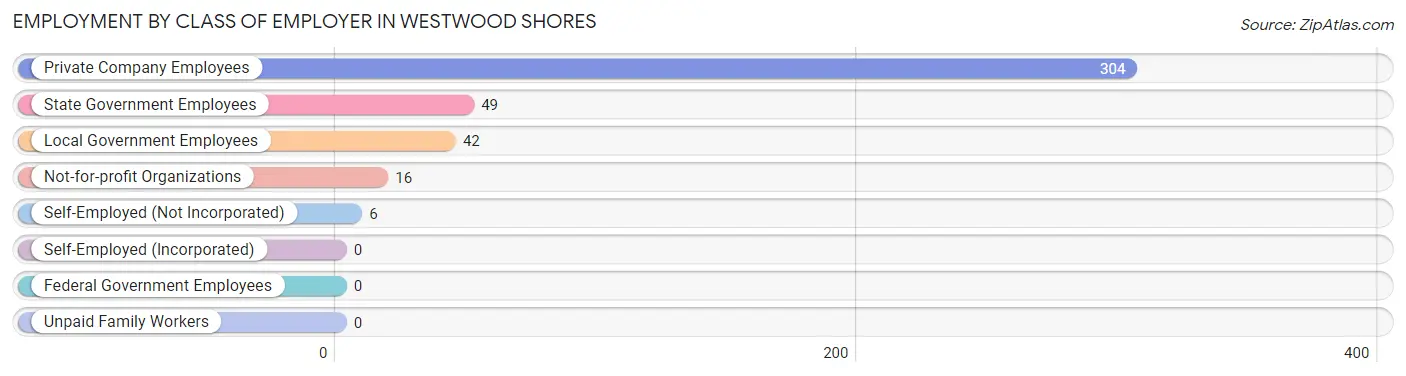
| Employer Class | # Employees | % Employees |
| Private Company Employees | 304 | 72.9% |
| Self-Employed (Incorporated) | 0 | 0.0% |
| Self-Employed (Not Incorporated) | 6 | 1.4% |
| Not-for-profit Organizations | 16 | 3.8% |
| Local Government Employees | 42 | 10.1% |
| State Government Employees | 49 | 11.7% |
| Federal Government Employees | 0 | 0.0% |
| Unpaid Family Workers | 0 | 0.0% |
| Total | 417 | 100.0% |
Employment Status by Age in Westwood Shores
According to the labor force statistics for Westwood Shores, out of the total population over 16 years of age (1,327), 34.1% or 453 individuals are in the labor force, with 7.7% or 35 of them unemployed. The age group with the highest labor force participation rate is 16 to 19 years, with 100.0% or 7 individuals in the labor force. Within the labor force, the 65 to 74 years age range has the highest percentage of unemployed individuals, with 37.5% or 18 of them being unemployed.
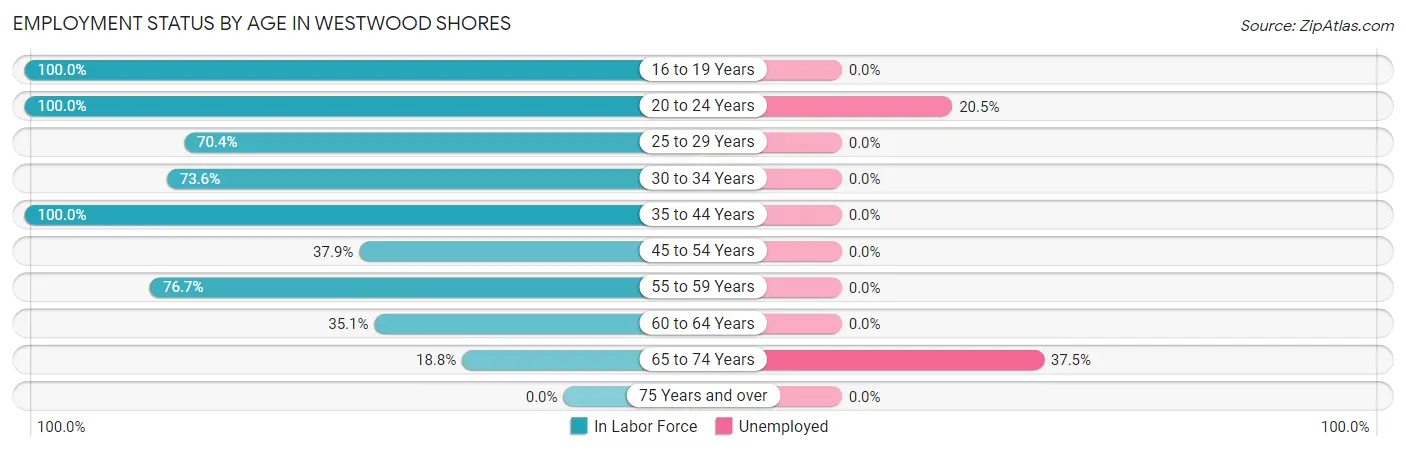
| Age Bracket | In Labor Force | Unemployed |
| 16 to 19 Years | 7 (100.0%) | 0 (0.0%) |
| 20 to 24 Years | 83 (100.0%) | 17 (20.5%) |
| 25 to 29 Years | 19 (70.4%) | 0 (0.0%) |
| 30 to 34 Years | 39 (73.6%) | 0 (0.0%) |
| 35 to 44 Years | 37 (100.0%) | 0 (0.0%) |
| 45 to 54 Years | 67 (37.9%) | 0 (0.0%) |
| 55 to 59 Years | 125 (76.7%) | 0 (0.0%) |
| 60 to 64 Years | 27 (35.1%) | 0 (0.0%) |
| 65 to 74 Years | 48 (18.8%) | 18 (37.5%) |
| 75 Years and over | 0 (0.0%) | 0 (0.0%) |
| Total | 453 (34.1%) | 35 (7.7%) |
Employment Status by Educational Attainment in Westwood Shores
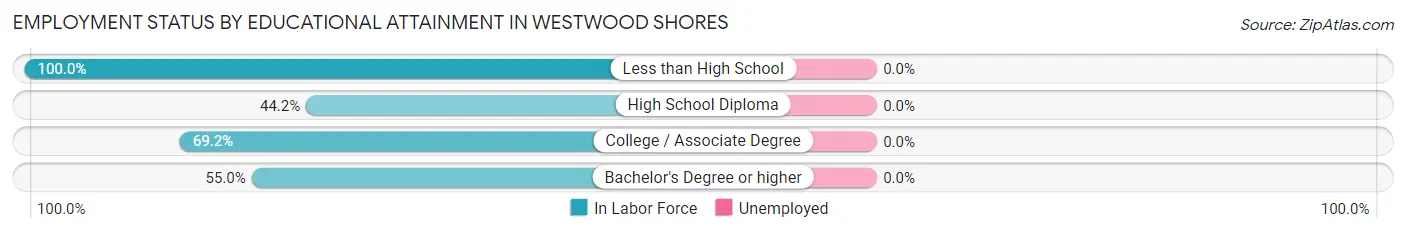
| Educational Attainment | In Labor Force | Unemployed |
| Less than High School | 7 (100.0%) | 0 (0.0%) |
| High School Diploma | 69 (44.2%) | 0 (0.0%) |
| College / Associate Degree | 166 (69.2%) | 0 (0.0%) |
| Bachelor's Degree or higher | 72 (55.0%) | 0 (0.0%) |
| Total | 314 (58.8%) | 0 (0.0%) |
Employment Occupations by Sex in Westwood Shores
Management, Business, Science and Arts Occupations
The most common Management, Business, Science and Arts occupations in Westwood Shores are Management (74 | 17.7%), Business & Financial (70 | 16.8%), Computers, Engineering & Science (40 | 9.6%), Community & Social Service (37 | 8.9%), and Education Instruction & Library (37 | 8.9%).
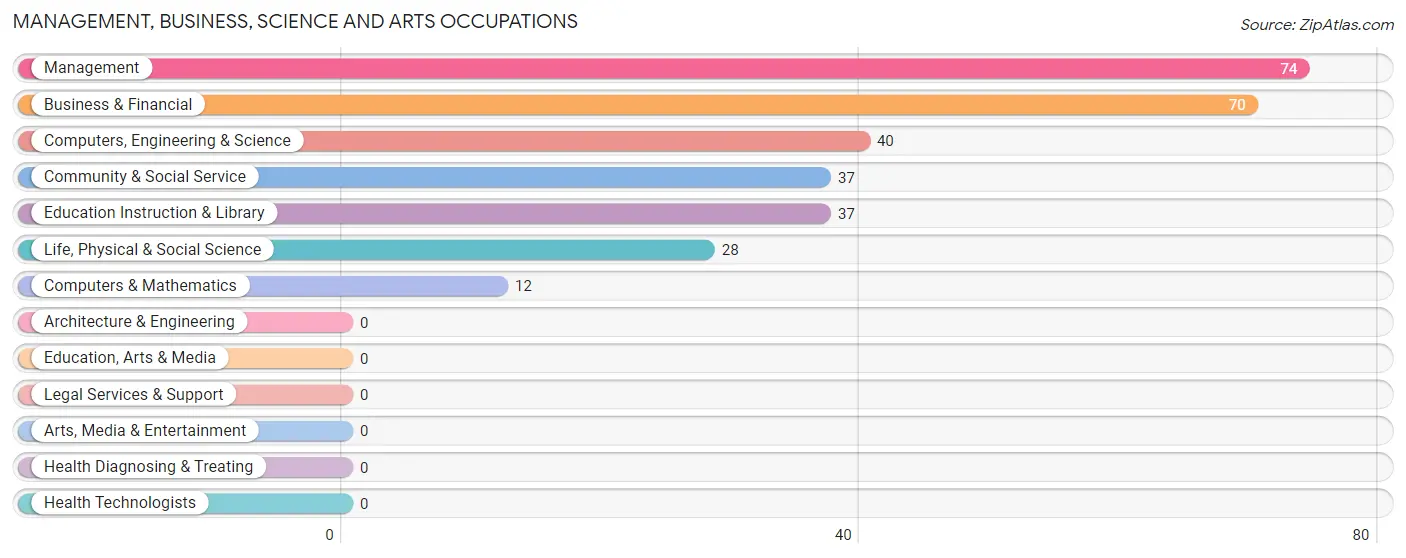
Management, Business, Science and Arts Occupations by Sex
Within the Management, Business, Science and Arts occupations in Westwood Shores, the most male-oriented occupations are Business & Financial (91.4%), and Management (48.6%), while the most female-oriented occupations are Computers, Engineering & Science (100.0%), Computers & Mathematics (100.0%), and Life, Physical & Social Science (100.0%).
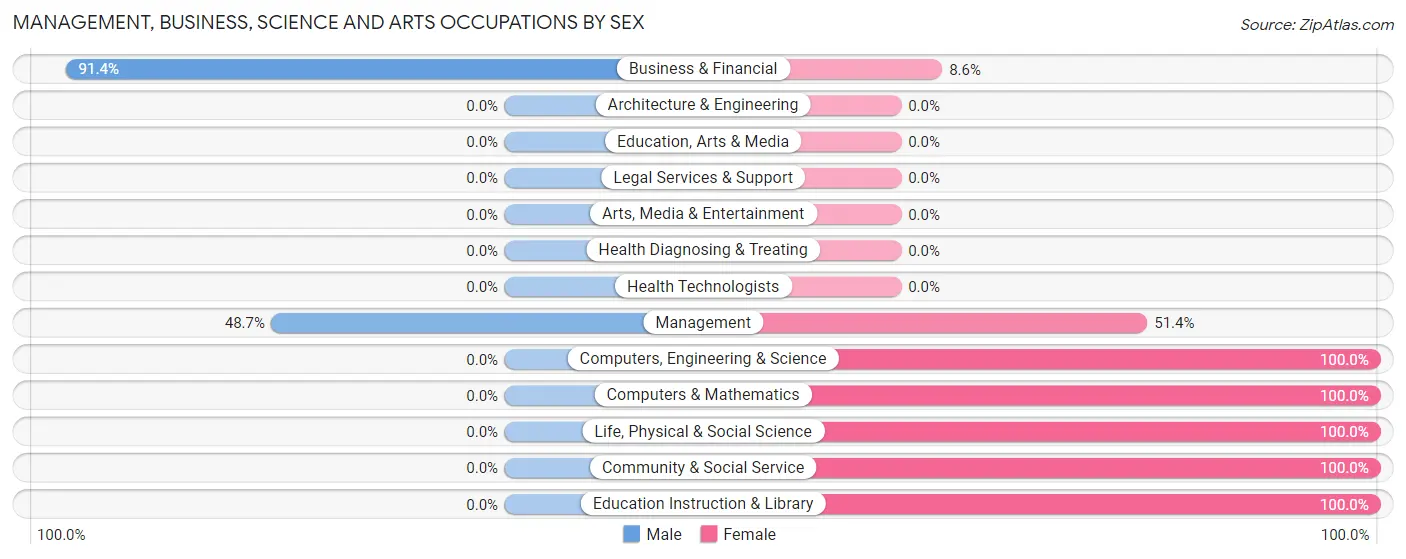
| Occupation | Male | Female |
| Management | 36 (48.6%) | 38 (51.3%) |
| Business & Financial | 64 (91.4%) | 6 (8.6%) |
| Computers, Engineering & Science | 0 (0.0%) | 40 (100.0%) |
| Computers & Mathematics | 0 (0.0%) | 12 (100.0%) |
| Architecture & Engineering | 0 (0.0%) | 0 (0.0%) |
| Life, Physical & Social Science | 0 (0.0%) | 28 (100.0%) |
| Community & Social Service | 0 (0.0%) | 37 (100.0%) |
| Education, Arts & Media | 0 (0.0%) | 0 (0.0%) |
| Legal Services & Support | 0 (0.0%) | 0 (0.0%) |
| Education Instruction & Library | 0 (0.0%) | 37 (100.0%) |
| Arts, Media & Entertainment | 0 (0.0%) | 0 (0.0%) |
| Health Diagnosing & Treating | 0 (0.0%) | 0 (0.0%) |
| Health Technologists | 0 (0.0%) | 0 (0.0%) |
| Total (Category) | 100 (45.3%) | 121 (54.7%) |
| Total (Overall) | 202 (48.4%) | 215 (51.6%) |
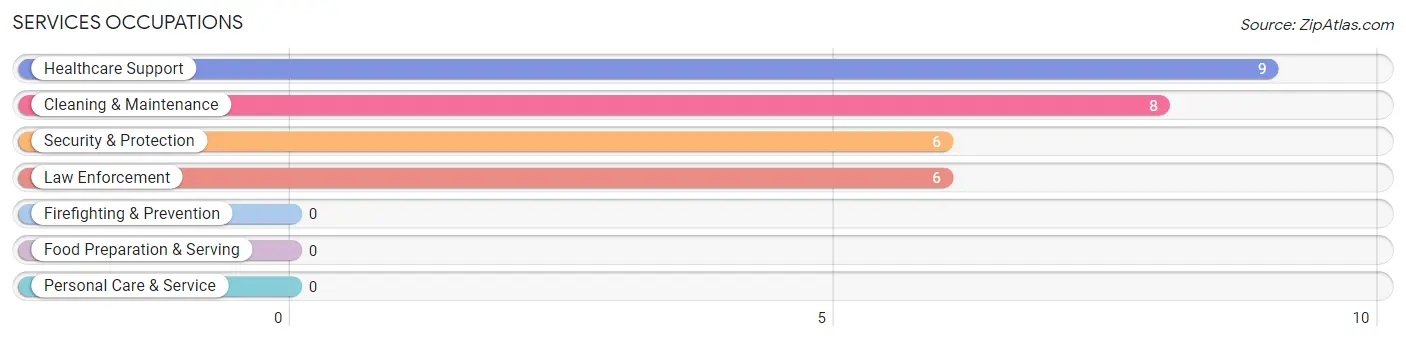
Services Occupations
The most common Services occupations in Westwood Shores are Healthcare Support (9 | 2.2%), Cleaning & Maintenance (8 | 1.9%), Security & Protection (6 | 1.4%), and Law Enforcement (6 | 1.4%).
Services Occupations by Sex
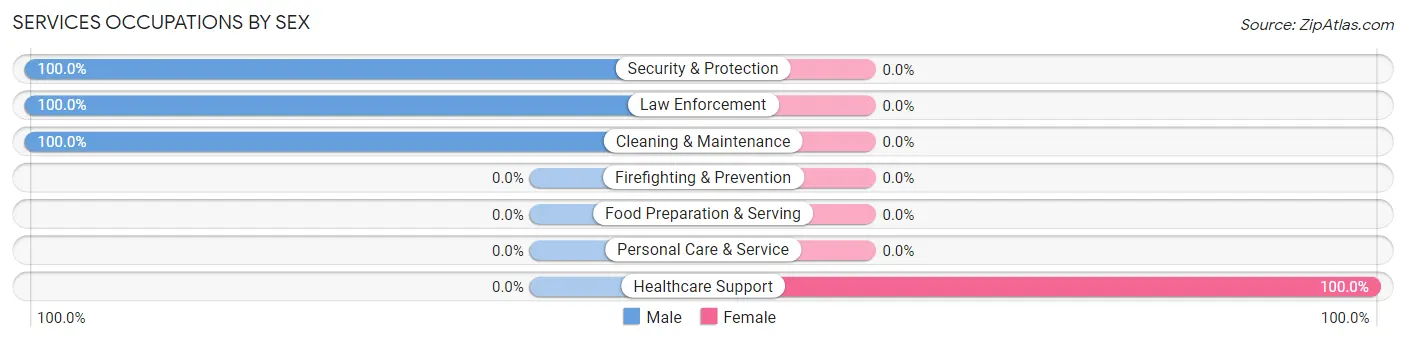
| Occupation | Male | Female |
| Healthcare Support | 0 (0.0%) | 9 (100.0%) |
| Security & Protection | 6 (100.0%) | 0 (0.0%) |
| Firefighting & Prevention | 0 (0.0%) | 0 (0.0%) |
| Law Enforcement | 6 (100.0%) | 0 (0.0%) |
| Food Preparation & Serving | 0 (0.0%) | 0 (0.0%) |
| Cleaning & Maintenance | 8 (100.0%) | 0 (0.0%) |
| Personal Care & Service | 0 (0.0%) | 0 (0.0%) |
| Total (Category) | 14 (60.9%) | 9 (39.1%) |
| Total (Overall) | 202 (48.4%) | 215 (51.6%) |
Sales and Office Occupations
The most common Sales and Office occupations in Westwood Shores are Office & Administration (62 | 14.9%), and Sales & Related (36 | 8.6%).
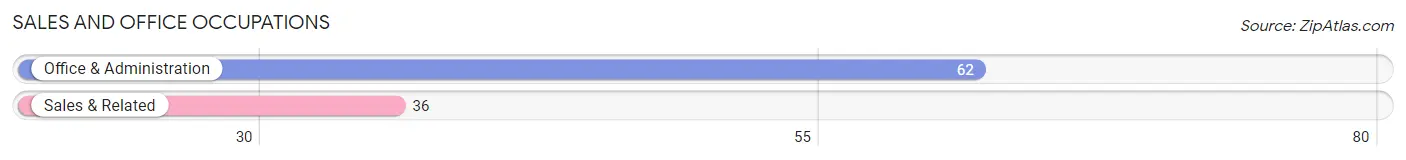
Sales and Office Occupations by Sex
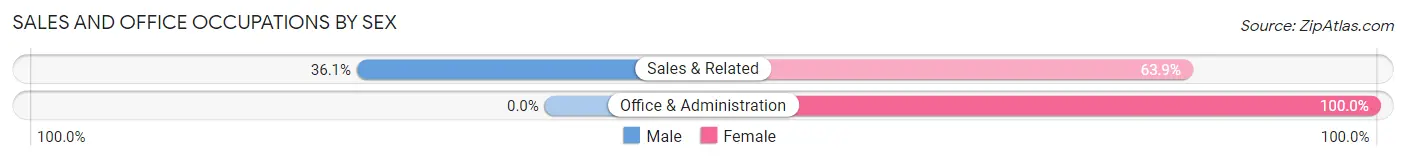
| Occupation | Male | Female |
| Sales & Related | 13 (36.1%) | 23 (63.9%) |
| Office & Administration | 0 (0.0%) | 62 (100.0%) |
| Total (Category) | 13 (13.3%) | 85 (86.7%) |
| Total (Overall) | 202 (48.4%) | 215 (51.6%) |
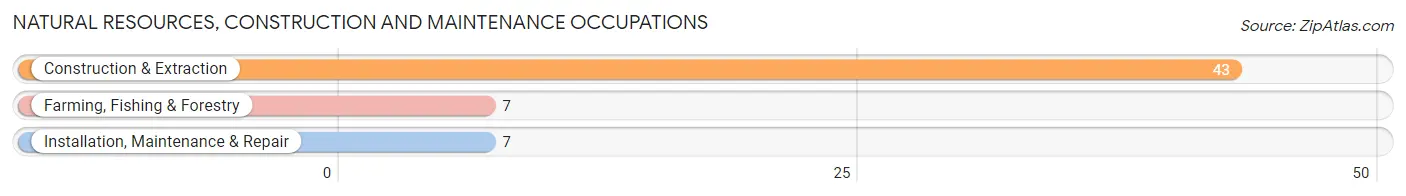
Natural Resources, Construction and Maintenance Occupations
The most common Natural Resources, Construction and Maintenance occupations in Westwood Shores are Construction & Extraction (43 | 10.3%), Farming, Fishing & Forestry (7 | 1.7%), and Installation, Maintenance & Repair (7 | 1.7%).
Natural Resources, Construction and Maintenance Occupations by Sex
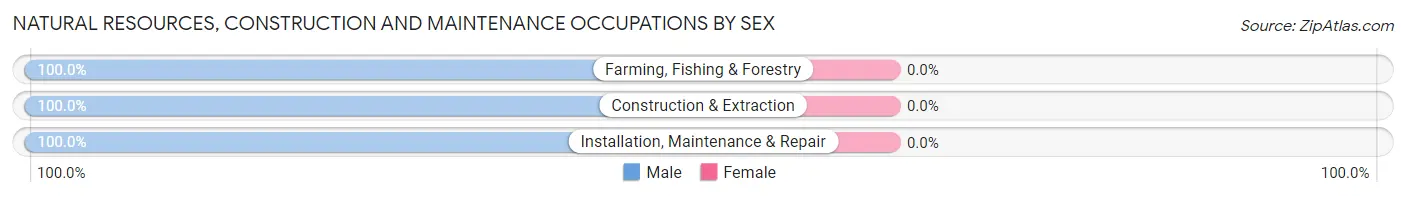
| Occupation | Male | Female |
| Farming, Fishing & Forestry | 7 (100.0%) | 0 (0.0%) |
| Construction & Extraction | 43 (100.0%) | 0 (0.0%) |
| Installation, Maintenance & Repair | 7 (100.0%) | 0 (0.0%) |
| Total (Category) | 57 (100.0%) | 0 (0.0%) |
| Total (Overall) | 202 (48.4%) | 215 (51.6%) |
Production, Transportation and Moving Occupations
The most common Production, Transportation and Moving occupations in Westwood Shores are , and Transportation (18 | 4.3%).
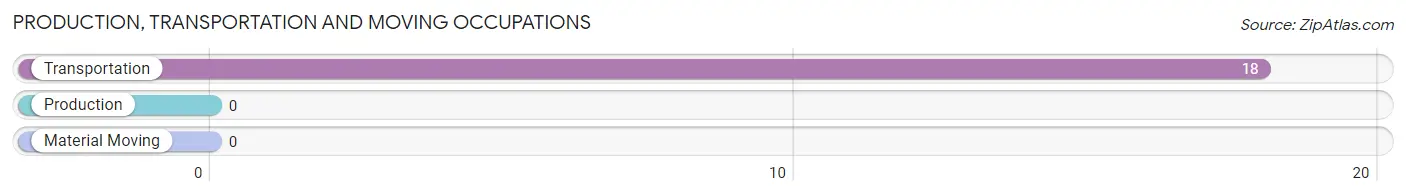
Production, Transportation and Moving Occupations by Sex
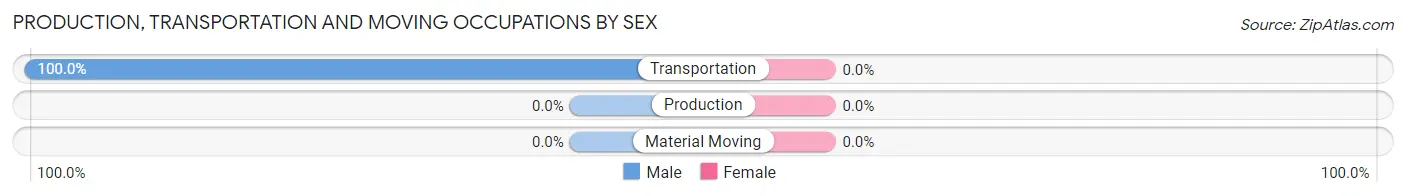
| Occupation | Male | Female |
| Production | 0 (0.0%) | 0 (0.0%) |
| Transportation | 18 (100.0%) | 0 (0.0%) |
| Material Moving | 0 (0.0%) | 0 (0.0%) |
| Total (Category) | 18 (100.0%) | 0 (0.0%) |
| Total (Overall) | 202 (48.4%) | 215 (51.6%) |
Employment Industries by Sex in Westwood Shores
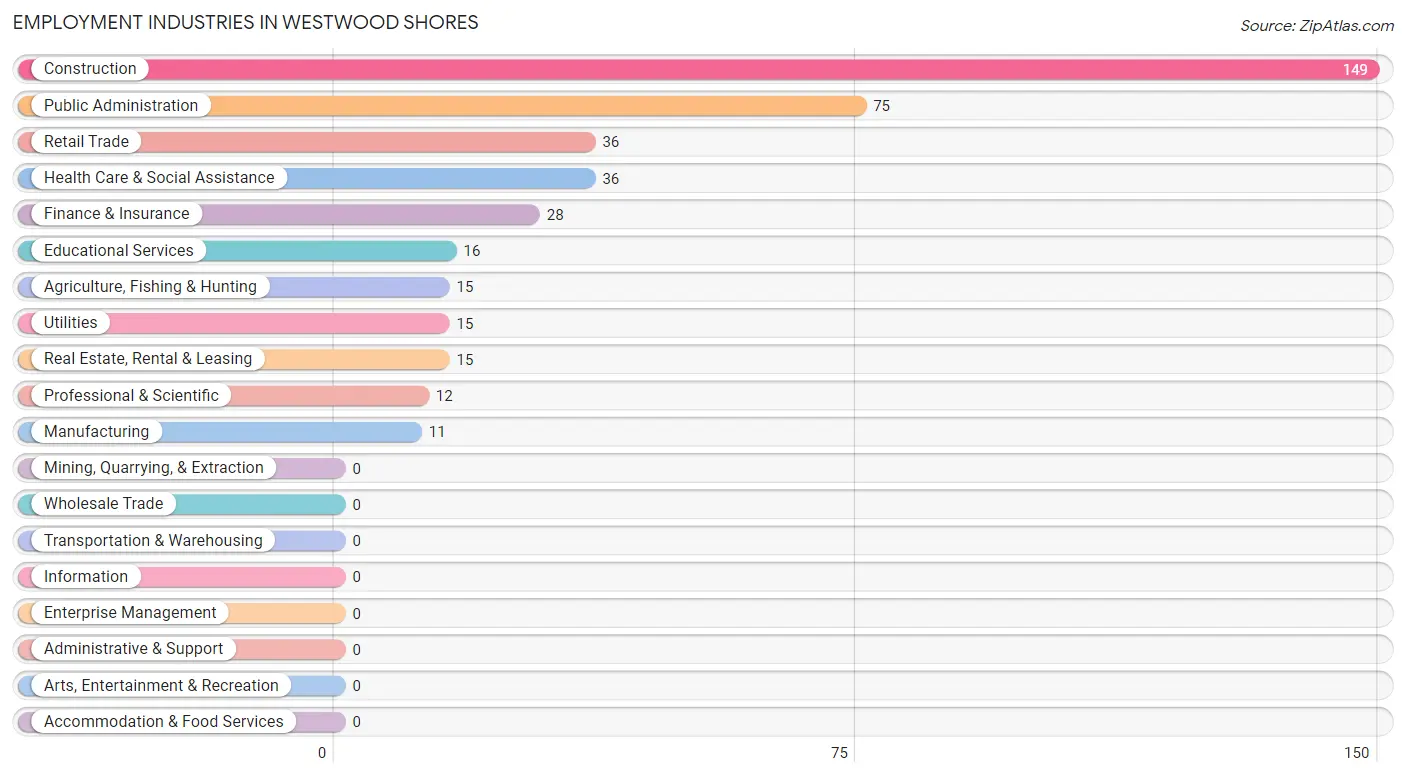
Employment Industries in Westwood Shores
The major employment industries in Westwood Shores include Construction (149 | 35.7%), Public Administration (75 | 18.0%), Retail Trade (36 | 8.6%), Health Care & Social Assistance (36 | 8.6%), and Finance & Insurance (28 | 6.7%).
Employment Industries by Sex in Westwood Shores
The Westwood Shores industries that see more men than women are Agriculture, Fishing & Hunting (100.0%), Manufacturing (100.0%), and Real Estate, Rental & Leasing (100.0%), whereas the industries that tend to have a higher number of women are Finance & Insurance (100.0%), Professional & Scientific (100.0%), and Educational Services (100.0%).
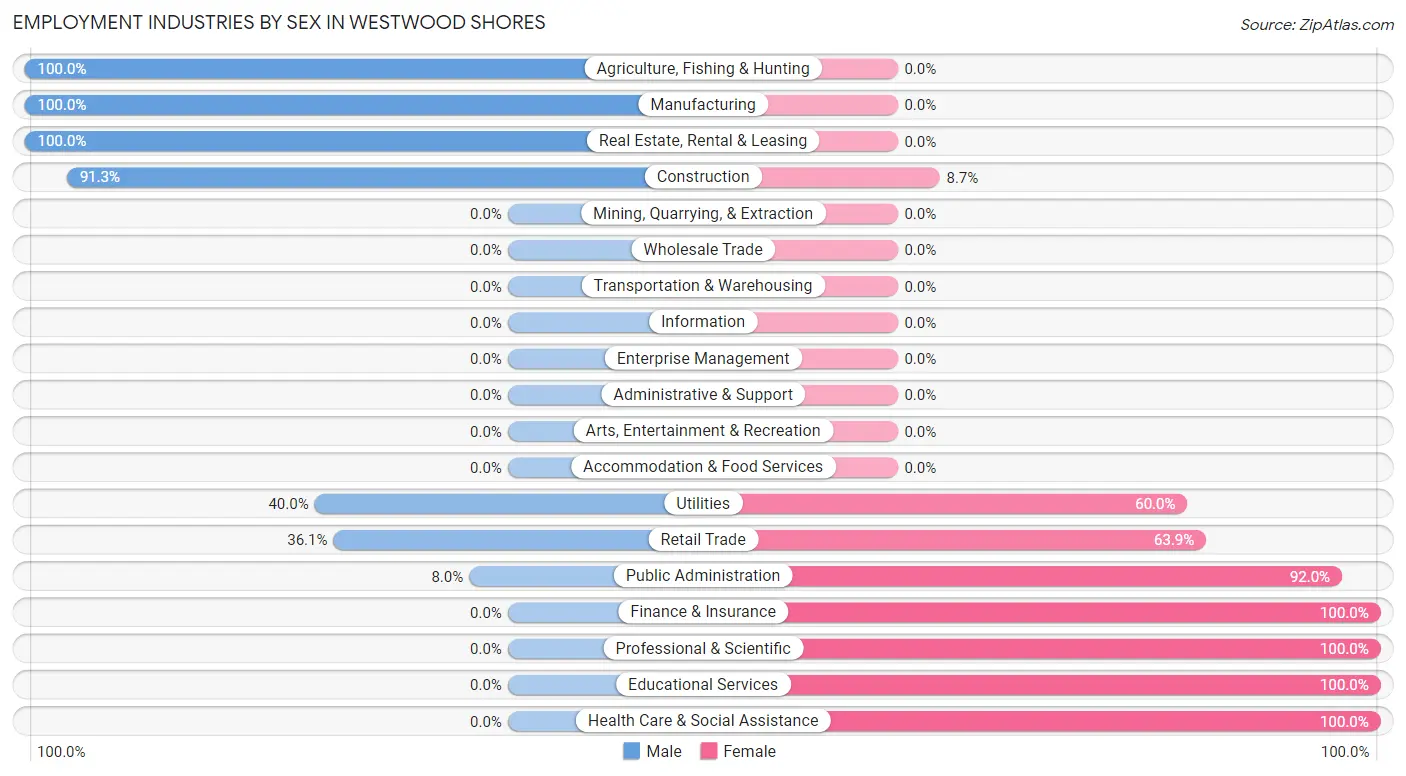
| Industry | Male | Female |
| Agriculture, Fishing & Hunting | 15 (100.0%) | 0 (0.0%) |
| Mining, Quarrying, & Extraction | 0 (0.0%) | 0 (0.0%) |
| Construction | 136 (91.3%) | 13 (8.7%) |
| Manufacturing | 11 (100.0%) | 0 (0.0%) |
| Wholesale Trade | 0 (0.0%) | 0 (0.0%) |
| Retail Trade | 13 (36.1%) | 23 (63.9%) |
| Transportation & Warehousing | 0 (0.0%) | 0 (0.0%) |
| Utilities | 6 (40.0%) | 9 (60.0%) |
| Information | 0 (0.0%) | 0 (0.0%) |
| Finance & Insurance | 0 (0.0%) | 28 (100.0%) |
| Real Estate, Rental & Leasing | 15 (100.0%) | 0 (0.0%) |
| Professional & Scientific | 0 (0.0%) | 12 (100.0%) |
| Enterprise Management | 0 (0.0%) | 0 (0.0%) |
| Administrative & Support | 0 (0.0%) | 0 (0.0%) |
| Educational Services | 0 (0.0%) | 16 (100.0%) |
| Health Care & Social Assistance | 0 (0.0%) | 36 (100.0%) |
| Arts, Entertainment & Recreation | 0 (0.0%) | 0 (0.0%) |
| Accommodation & Food Services | 0 (0.0%) | 0 (0.0%) |
| Public Administration | 6 (8.0%) | 69 (92.0%) |
| Total | 202 (48.4%) | 215 (51.6%) |
Education in Westwood Shores
School Enrollment in Westwood Shores
The most common levels of schooling among the 190 students in Westwood Shores are elementary school (58 | 30.5%), middle school (47 | 24.7%), and kindergarten (30 | 15.8%).
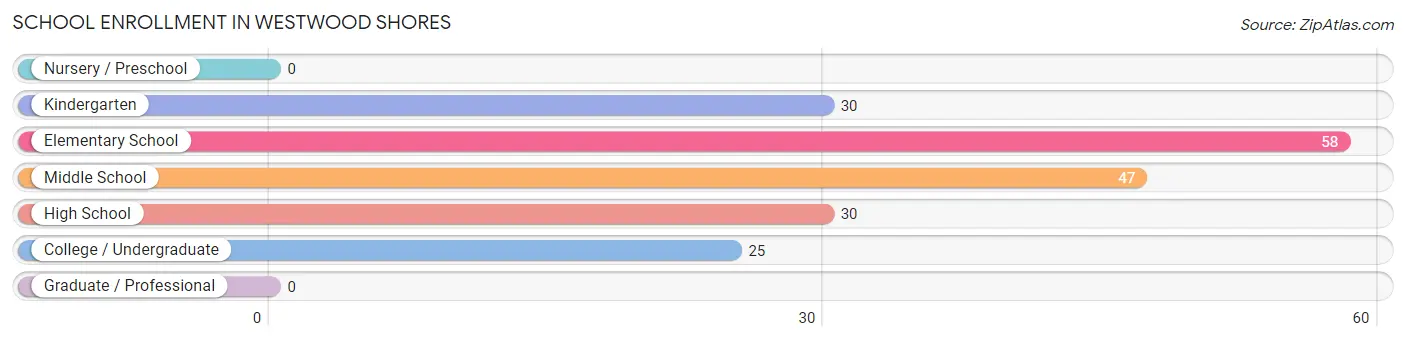
| School Level | # Students | % Students |
| Nursery / Preschool | 0 | 0.0% |
| Kindergarten | 30 | 15.8% |
| Elementary School | 58 | 30.5% |
| Middle School | 47 | 24.7% |
| High School | 30 | 15.8% |
| College / Undergraduate | 25 | 13.2% |
| Graduate / Professional | 0 | 0.0% |
| Total | 190 | 100.0% |
School Enrollment by Age by Funding Source in Westwood Shores
Out of a total of 190 students who are enrolled in schools in Westwood Shores, 32 (16.8%) attend a private institution, while the remaining 158 (83.2%) are enrolled in public schools. The age group of 35 years and over has the highest likelihood of being enrolled in private schools, with 6 (31.6% in the age bracket) enrolled. Conversely, the age group of 5 to 9 year old has the lowest likelihood of being enrolled in a private school, with 69 (100.0% in the age bracket) attending a public institution.
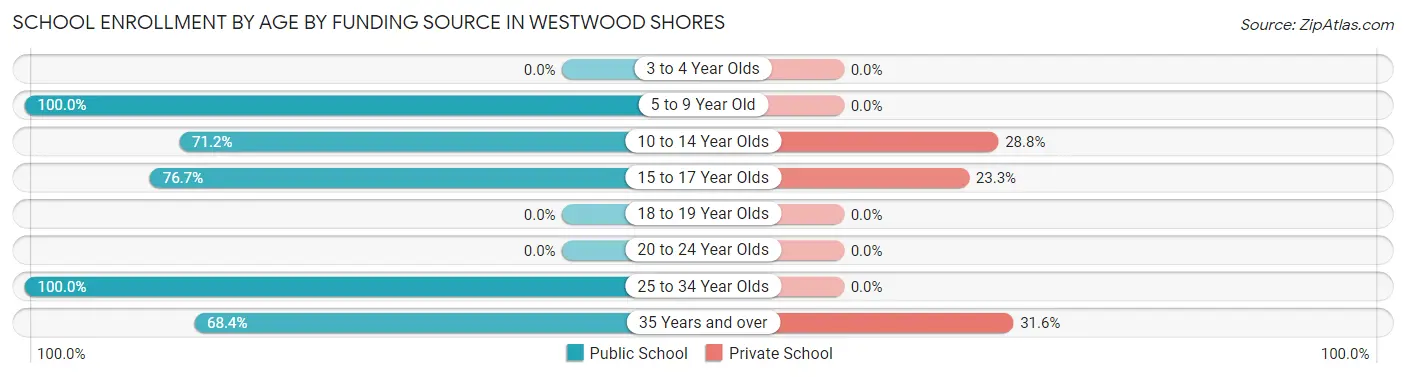
| Age Bracket | Public School | Private School |
| 3 to 4 Year Olds | 0 (0.0%) | 0 (0.0%) |
| 5 to 9 Year Old | 69 (100.0%) | 0 (0.0%) |
| 10 to 14 Year Olds | 47 (71.2%) | 19 (28.8%) |
| 15 to 17 Year Olds | 23 (76.7%) | 7 (23.3%) |
| 18 to 19 Year Olds | 0 (0.0%) | 0 (0.0%) |
| 20 to 24 Year Olds | 0 (0.0%) | 0 (0.0%) |
| 25 to 34 Year Olds | 6 (100.0%) | 0 (0.0%) |
| 35 Years and over | 13 (68.4%) | 6 (31.6%) |
| Total | 158 (83.2%) | 32 (16.8%) |
Educational Attainment by Field of Study in Westwood Shores
Business (100 | 29.8%), bio, nature & agricultural (58 | 17.3%), psychology (46 | 13.7%), education (43 | 12.8%), and arts & humanities (27 | 8.1%) are the most common fields of study among 335 individuals in Westwood Shores who have obtained a bachelor's degree or higher.
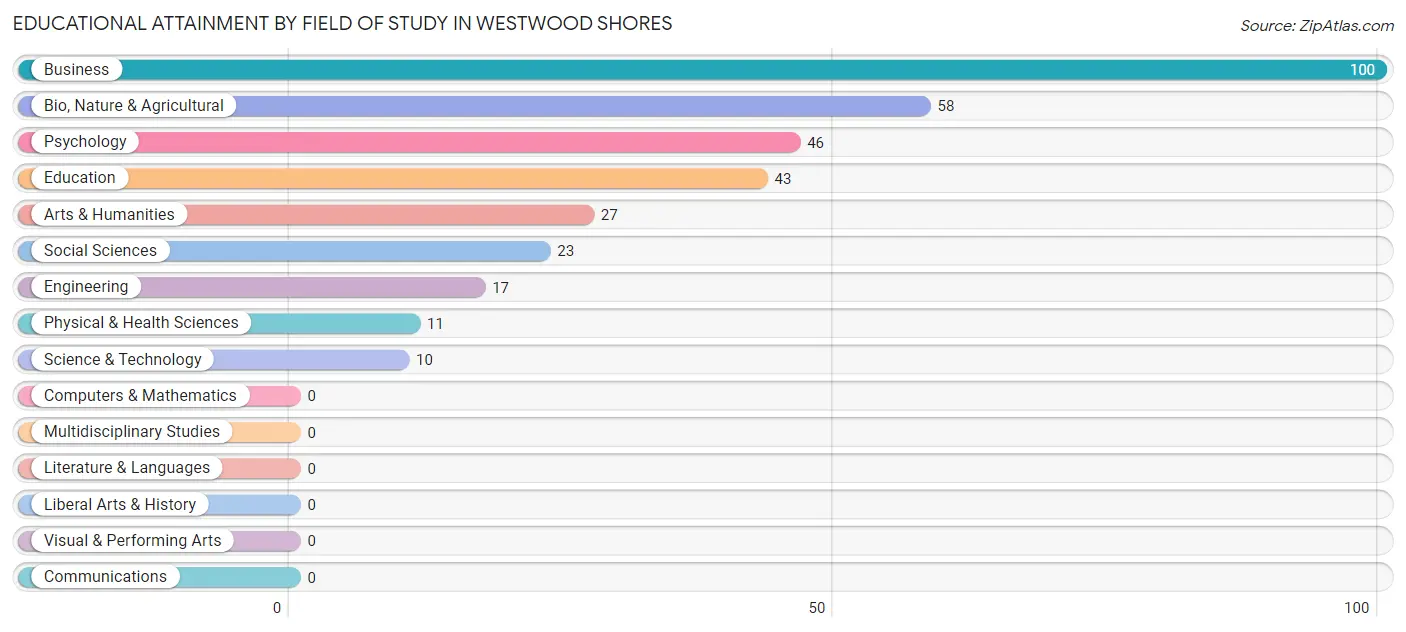
| Field of Study | # Graduates | % Graduates |
| Computers & Mathematics | 0 | 0.0% |
| Bio, Nature & Agricultural | 58 | 17.3% |
| Physical & Health Sciences | 11 | 3.3% |
| Psychology | 46 | 13.7% |
| Social Sciences | 23 | 6.9% |
| Engineering | 17 | 5.1% |
| Multidisciplinary Studies | 0 | 0.0% |
| Science & Technology | 10 | 3.0% |
| Business | 100 | 29.8% |
| Education | 43 | 12.8% |
| Literature & Languages | 0 | 0.0% |
| Liberal Arts & History | 0 | 0.0% |
| Visual & Performing Arts | 0 | 0.0% |
| Communications | 0 | 0.0% |
| Arts & Humanities | 27 | 8.1% |
| Total | 335 | 100.0% |
Transportation & Commute in Westwood Shores
Vehicle Availability by Sex in Westwood Shores
The most prevalent vehicle ownership categories in Westwood Shores are males with 2 vehicles (155, accounting for 76.7%) and females with 2 vehicles (108, making up 72.1%).
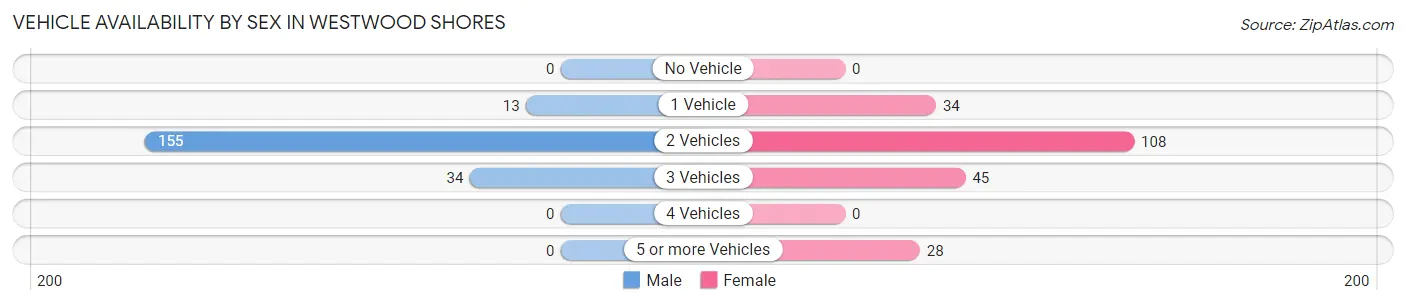
| Vehicles Available | Male | Female |
| No Vehicle | 0 (0.0%) | 0 (0.0%) |
| 1 Vehicle | 13 (6.4%) | 34 (15.8%) |
| 2 Vehicles | 155 (76.7%) | 108 (50.2%) |
| 3 Vehicles | 34 (16.8%) | 45 (20.9%) |
| 4 Vehicles | 0 (0.0%) | 0 (0.0%) |
| 5 or more Vehicles | 0 (0.0%) | 28 (13.0%) |
| Total | 202 (100.0%) | 215 (100.0%) |
Commute Time in Westwood Shores
The most frequently occuring commute durations in Westwood Shores are 30 to 34 minutes (110 commuters, 29.6%), 90 or more minutes (86 commuters, 23.1%), and 40 to 44 minutes (85 commuters, 22.9%).
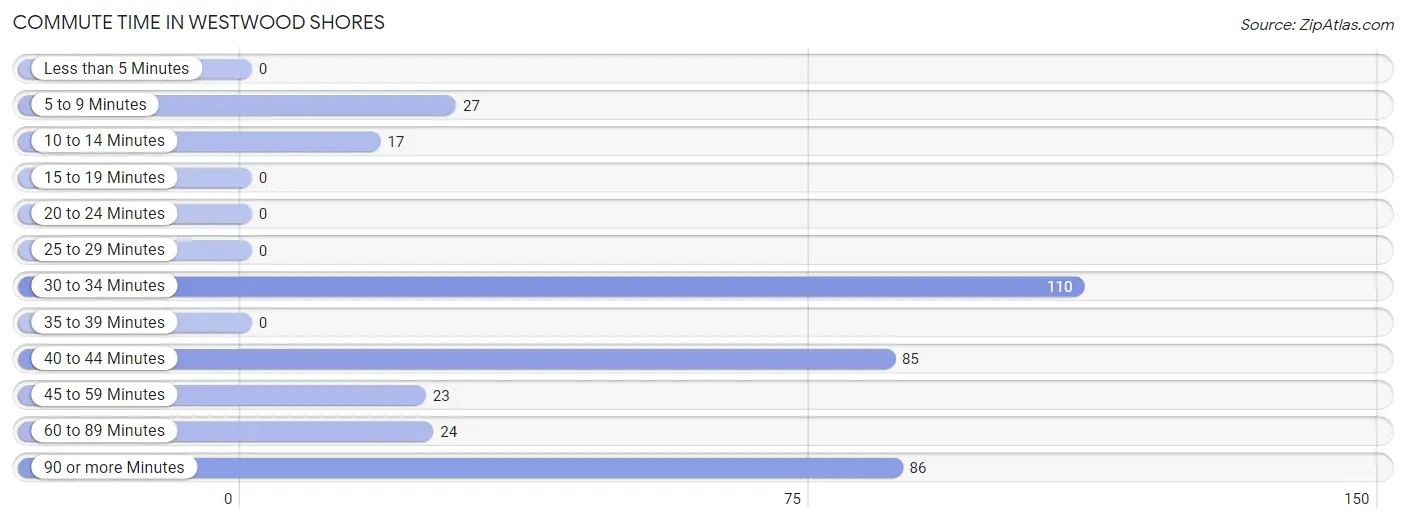
| Commute Time | # Commuters | % Commuters |
| Less than 5 Minutes | 0 | 0.0% |
| 5 to 9 Minutes | 27 | 7.3% |
| 10 to 14 Minutes | 17 | 4.6% |
| 15 to 19 Minutes | 0 | 0.0% |
| 20 to 24 Minutes | 0 | 0.0% |
| 25 to 29 Minutes | 0 | 0.0% |
| 30 to 34 Minutes | 110 | 29.6% |
| 35 to 39 Minutes | 0 | 0.0% |
| 40 to 44 Minutes | 85 | 22.9% |
| 45 to 59 Minutes | 23 | 6.2% |
| 60 to 89 Minutes | 24 | 6.5% |
| 90 or more Minutes | 86 | 23.1% |
Commute Time by Sex in Westwood Shores
The most common commute times in Westwood Shores are 90 or more minutes (86 commuters, 43.9%) for males and 40 to 44 minutes (62 commuters, 35.2%) for females.
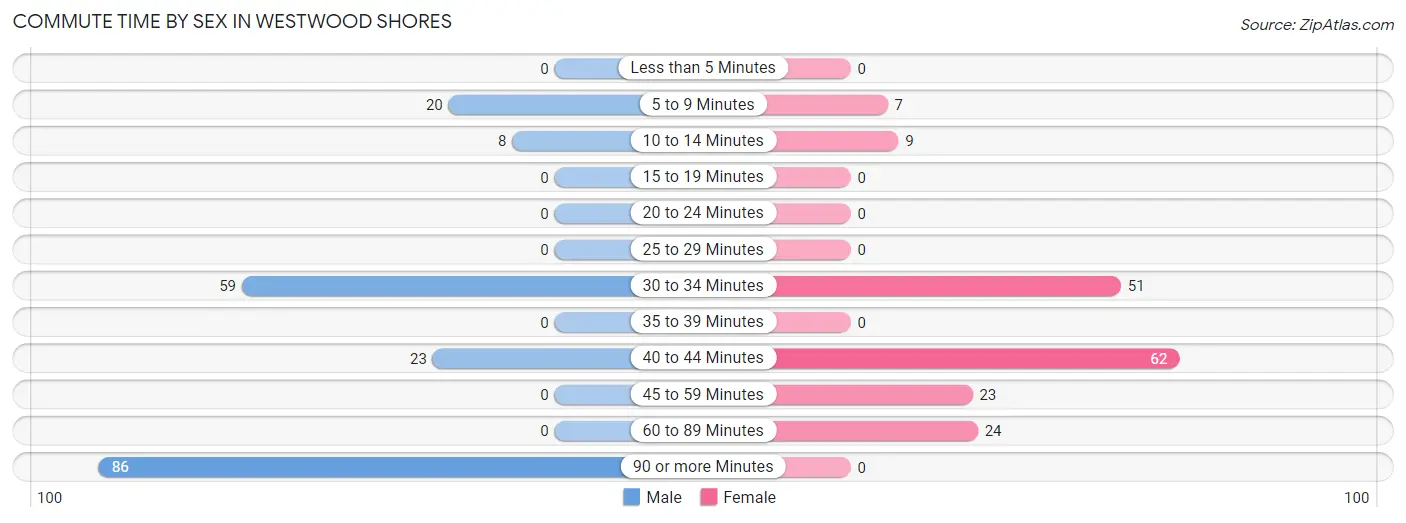
| Commute Time | Male | Female |
| Less than 5 Minutes | 0 (0.0%) | 0 (0.0%) |
| 5 to 9 Minutes | 20 (10.2%) | 7 (4.0%) |
| 10 to 14 Minutes | 8 (4.1%) | 9 (5.1%) |
| 15 to 19 Minutes | 0 (0.0%) | 0 (0.0%) |
| 20 to 24 Minutes | 0 (0.0%) | 0 (0.0%) |
| 25 to 29 Minutes | 0 (0.0%) | 0 (0.0%) |
| 30 to 34 Minutes | 59 (30.1%) | 51 (29.0%) |
| 35 to 39 Minutes | 0 (0.0%) | 0 (0.0%) |
| 40 to 44 Minutes | 23 (11.7%) | 62 (35.2%) |
| 45 to 59 Minutes | 0 (0.0%) | 23 (13.1%) |
| 60 to 89 Minutes | 0 (0.0%) | 24 (13.6%) |
| 90 or more Minutes | 86 (43.9%) | 0 (0.0%) |
Time of Departure to Work by Sex in Westwood Shores
The most frequent times of departure to work in Westwood Shores are 5:30 AM to 5:59 AM (64, 32.7%) for males and 6:00 AM to 6:29 AM (62, 35.2%) for females.
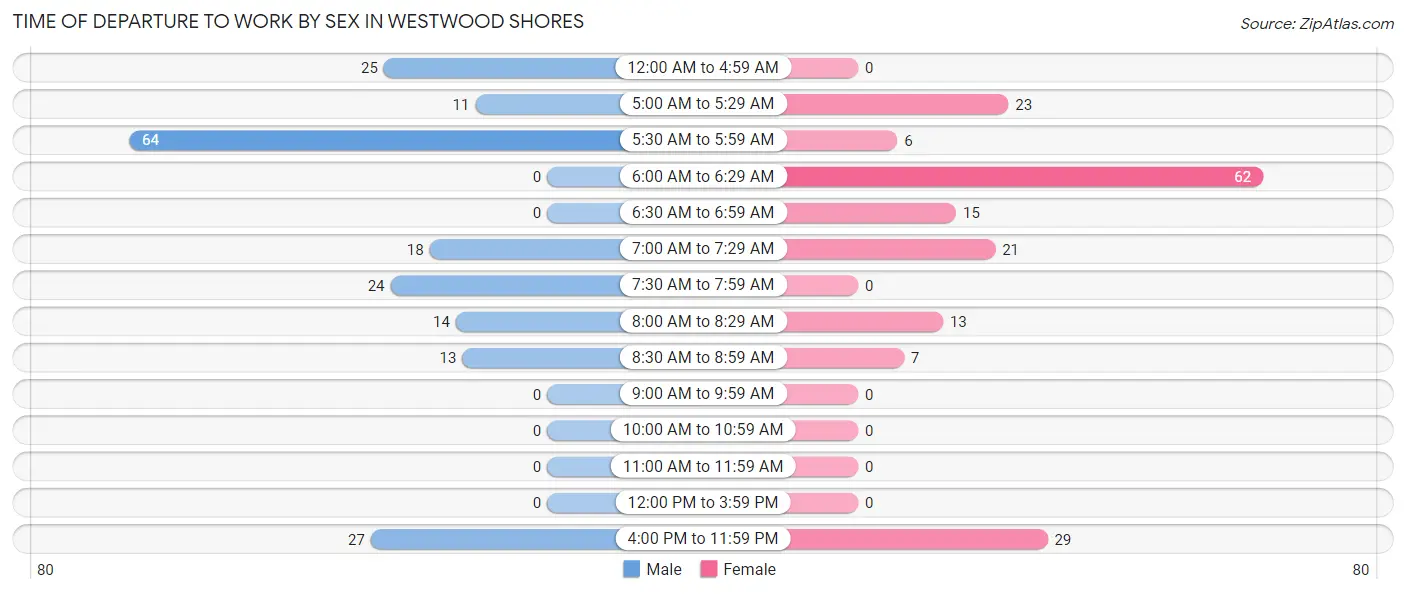
| Time of Departure | Male | Female |
| 12:00 AM to 4:59 AM | 25 (12.8%) | 0 (0.0%) |
| 5:00 AM to 5:29 AM | 11 (5.6%) | 23 (13.1%) |
| 5:30 AM to 5:59 AM | 64 (32.7%) | 6 (3.4%) |
| 6:00 AM to 6:29 AM | 0 (0.0%) | 62 (35.2%) |
| 6:30 AM to 6:59 AM | 0 (0.0%) | 15 (8.5%) |
| 7:00 AM to 7:29 AM | 18 (9.2%) | 21 (11.9%) |
| 7:30 AM to 7:59 AM | 24 (12.2%) | 0 (0.0%) |
| 8:00 AM to 8:29 AM | 14 (7.1%) | 13 (7.4%) |
| 8:30 AM to 8:59 AM | 13 (6.6%) | 7 (4.0%) |
| 9:00 AM to 9:59 AM | 0 (0.0%) | 0 (0.0%) |
| 10:00 AM to 10:59 AM | 0 (0.0%) | 0 (0.0%) |
| 11:00 AM to 11:59 AM | 0 (0.0%) | 0 (0.0%) |
| 12:00 PM to 3:59 PM | 0 (0.0%) | 0 (0.0%) |
| 4:00 PM to 11:59 PM | 27 (13.8%) | 29 (16.5%) |
| Total | 196 (100.0%) | 176 (100.0%) |
Housing Occupancy in Westwood Shores
Occupancy by Ownership in Westwood Shores
Of the total 698 dwellings in Westwood Shores, owner-occupied units account for 608 (87.1%), while renter-occupied units make up 90 (12.9%).
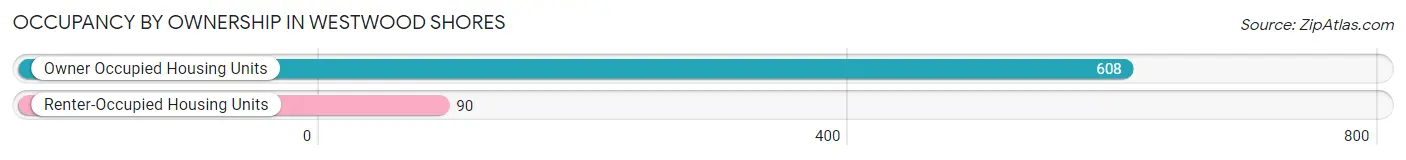
| Occupancy | # Housing Units | % Housing Units |
| Owner Occupied Housing Units | 608 | 87.1% |
| Renter-Occupied Housing Units | 90 | 12.9% |
| Total Occupied Housing Units | 698 | 100.0% |
Occupancy by Household Size in Westwood Shores
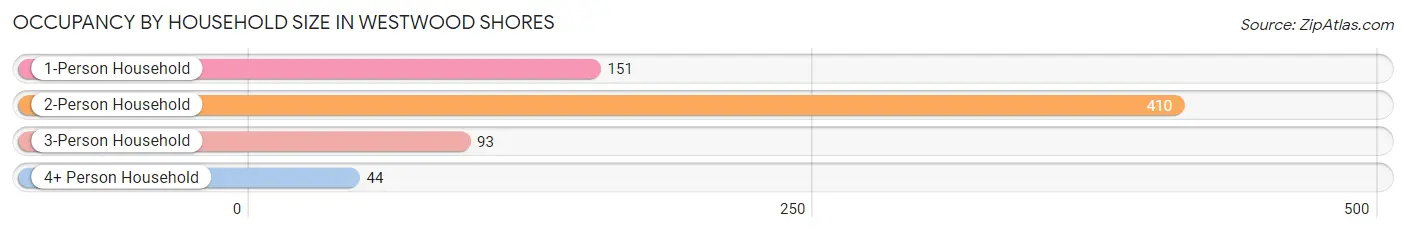
| Household Size | # Housing Units | % Housing Units |
| 1-Person Household | 151 | 21.6% |
| 2-Person Household | 410 | 58.7% |
| 3-Person Household | 93 | 13.3% |
| 4+ Person Household | 44 | 6.3% |
| Total Housing Units | 698 | 100.0% |
Occupancy by Ownership by Household Size in Westwood Shores
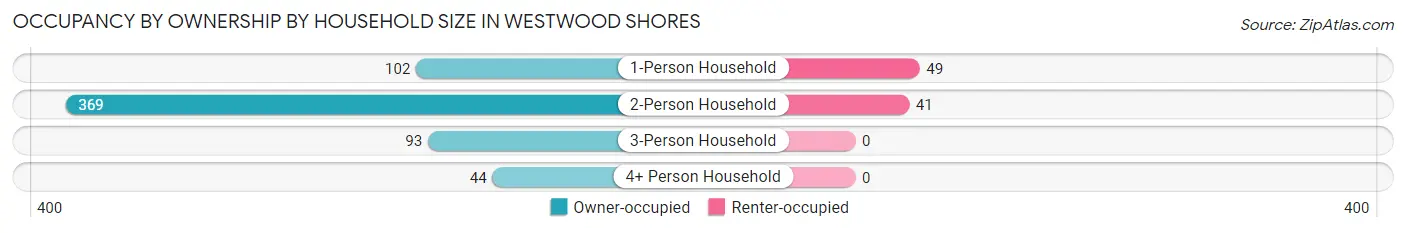
| Household Size | Owner-occupied | Renter-occupied |
| 1-Person Household | 102 (67.5%) | 49 (32.5%) |
| 2-Person Household | 369 (90.0%) | 41 (10.0%) |
| 3-Person Household | 93 (100.0%) | 0 (0.0%) |
| 4+ Person Household | 44 (100.0%) | 0 (0.0%) |
| Total Housing Units | 608 (87.1%) | 90 (12.9%) |
Occupancy by Educational Attainment in Westwood Shores
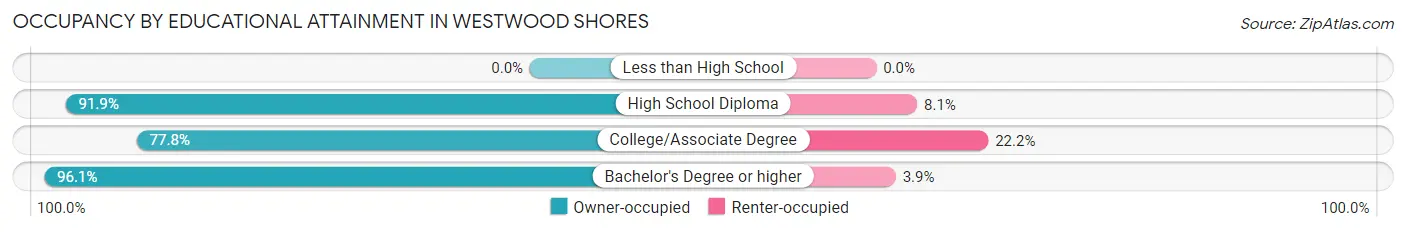
| Household Size | Owner-occupied | Renter-occupied |
| Less than High School | 0 (0.0%) | 0 (0.0%) |
| High School Diploma | 147 (91.9%) | 13 (8.1%) |
| College/Associate Degree | 238 (77.8%) | 68 (22.2%) |
| Bachelor's Degree or higher | 223 (96.1%) | 9 (3.9%) |
Occupancy by Age of Householder in Westwood Shores
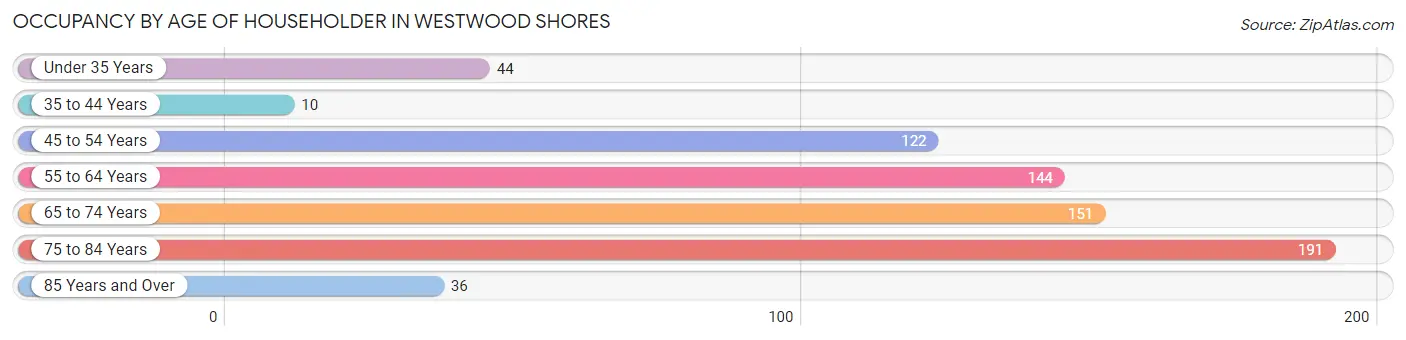
| Age Bracket | # Households | % Households |
| Under 35 Years | 44 | 6.3% |
| 35 to 44 Years | 10 | 1.4% |
| 45 to 54 Years | 122 | 17.5% |
| 55 to 64 Years | 144 | 20.6% |
| 65 to 74 Years | 151 | 21.6% |
| 75 to 84 Years | 191 | 27.4% |
| 85 Years and Over | 36 | 5.2% |
| Total | 698 | 100.0% |
Housing Finances in Westwood Shores
Median Income by Occupancy in Westwood Shores
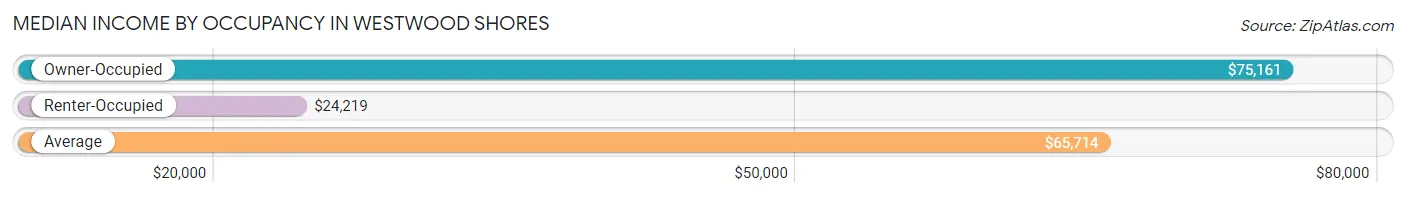
| Occupancy Type | # Households | Median Income |
| Owner-Occupied | 608 (87.1%) | $75,161 |
| Renter-Occupied | 90 (12.9%) | $24,219 |
| Average | 698 (100.0%) | $65,714 |
Occupancy by Householder Income Bracket in Westwood Shores
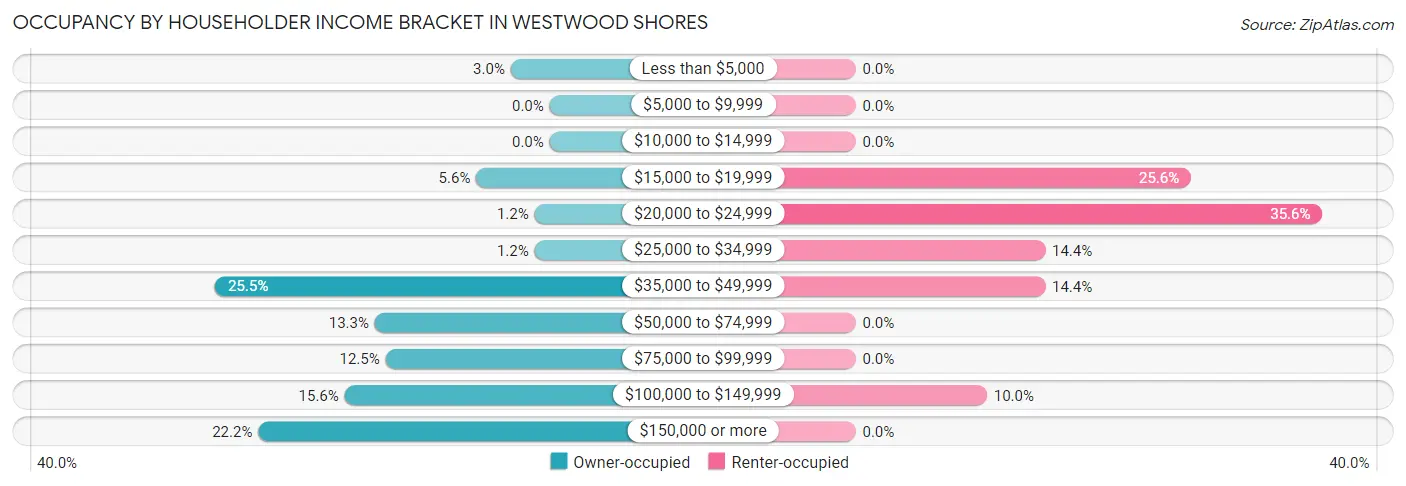
| Income Bracket | Owner-occupied | Renter-occupied |
| Less than $5,000 | 18 (3.0%) | 0 (0.0%) |
| $5,000 to $9,999 | 0 (0.0%) | 0 (0.0%) |
| $10,000 to $14,999 | 0 (0.0%) | 0 (0.0%) |
| $15,000 to $19,999 | 34 (5.6%) | 23 (25.6%) |
| $20,000 to $24,999 | 7 (1.1%) | 32 (35.6%) |
| $25,000 to $34,999 | 7 (1.1%) | 13 (14.4%) |
| $35,000 to $49,999 | 155 (25.5%) | 13 (14.4%) |
| $50,000 to $74,999 | 81 (13.3%) | 0 (0.0%) |
| $75,000 to $99,999 | 76 (12.5%) | 0 (0.0%) |
| $100,000 to $149,999 | 95 (15.6%) | 9 (10.0%) |
| $150,000 or more | 135 (22.2%) | 0 (0.0%) |
| Total | 608 (100.0%) | 90 (100.0%) |
Monthly Housing Cost Tiers in Westwood Shores
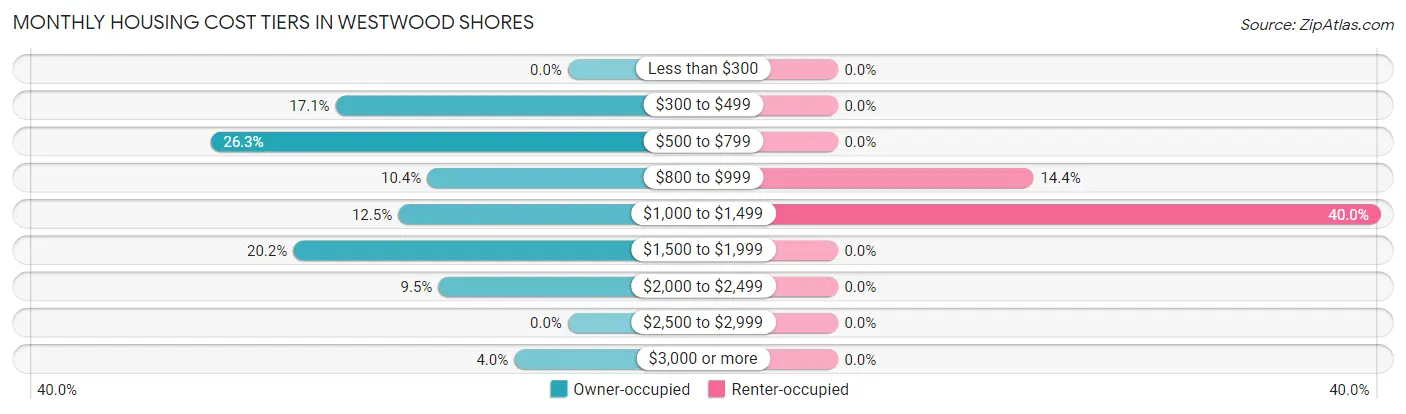
| Monthly Cost | Owner-occupied | Renter-occupied |
| Less than $300 | 0 (0.0%) | 0 (0.0%) |
| $300 to $499 | 104 (17.1%) | 0 (0.0%) |
| $500 to $799 | 160 (26.3%) | 0 (0.0%) |
| $800 to $999 | 63 (10.4%) | 13 (14.4%) |
| $1,000 to $1,499 | 76 (12.5%) | 36 (40.0%) |
| $1,500 to $1,999 | 123 (20.2%) | 0 (0.0%) |
| $2,000 to $2,499 | 58 (9.5%) | 0 (0.0%) |
| $2,500 to $2,999 | 0 (0.0%) | 0 (0.0%) |
| $3,000 or more | 24 (4.0%) | 0 (0.0%) |
| Total | 608 (100.0%) | 90 (100.0%) |
Physical Housing Characteristics in Westwood Shores
Housing Structures in Westwood Shores
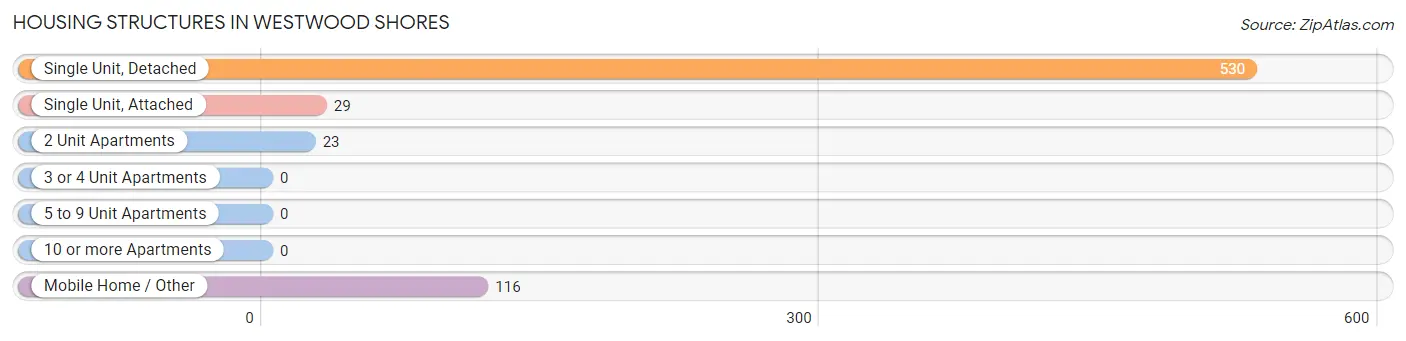
| Structure Type | # Housing Units | % Housing Units |
| Single Unit, Detached | 530 | 75.9% |
| Single Unit, Attached | 29 | 4.2% |
| 2 Unit Apartments | 23 | 3.3% |
| 3 or 4 Unit Apartments | 0 | 0.0% |
| 5 to 9 Unit Apartments | 0 | 0.0% |
| 10 or more Apartments | 0 | 0.0% |
| Mobile Home / Other | 116 | 16.6% |
| Total | 698 | 100.0% |
Housing Structures by Occupancy in Westwood Shores
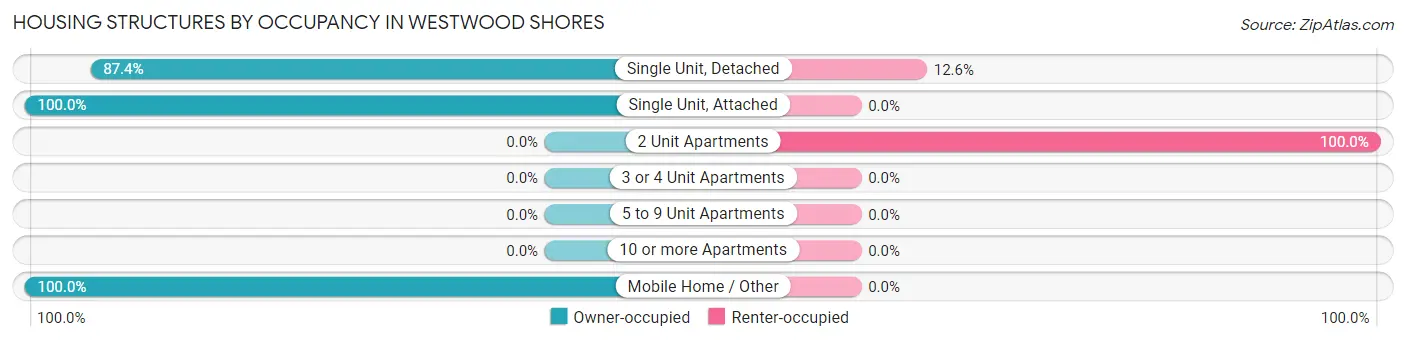
| Structure Type | Owner-occupied | Renter-occupied |
| Single Unit, Detached | 463 (87.4%) | 67 (12.6%) |
| Single Unit, Attached | 29 (100.0%) | 0 (0.0%) |
| 2 Unit Apartments | 0 (0.0%) | 23 (100.0%) |
| 3 or 4 Unit Apartments | 0 (0.0%) | 0 (0.0%) |
| 5 to 9 Unit Apartments | 0 (0.0%) | 0 (0.0%) |
| 10 or more Apartments | 0 (0.0%) | 0 (0.0%) |
| Mobile Home / Other | 116 (100.0%) | 0 (0.0%) |
| Total | 608 (87.1%) | 90 (12.9%) |
Housing Structures by Number of Rooms in Westwood Shores
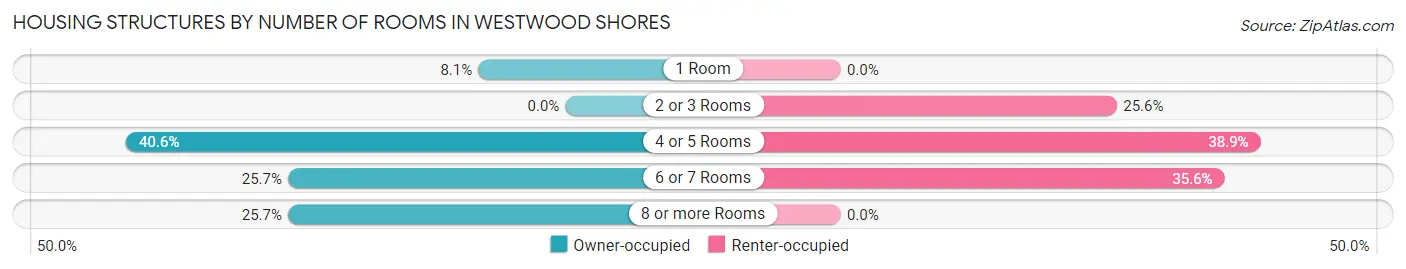
| Number of Rooms | Owner-occupied | Renter-occupied |
| 1 Room | 49 (8.1%) | 0 (0.0%) |
| 2 or 3 Rooms | 0 (0.0%) | 23 (25.6%) |
| 4 or 5 Rooms | 247 (40.6%) | 35 (38.9%) |
| 6 or 7 Rooms | 156 (25.7%) | 32 (35.6%) |
| 8 or more Rooms | 156 (25.7%) | 0 (0.0%) |
| Total | 608 (100.0%) | 90 (100.0%) |
Housing Structure by Heating Type in Westwood Shores
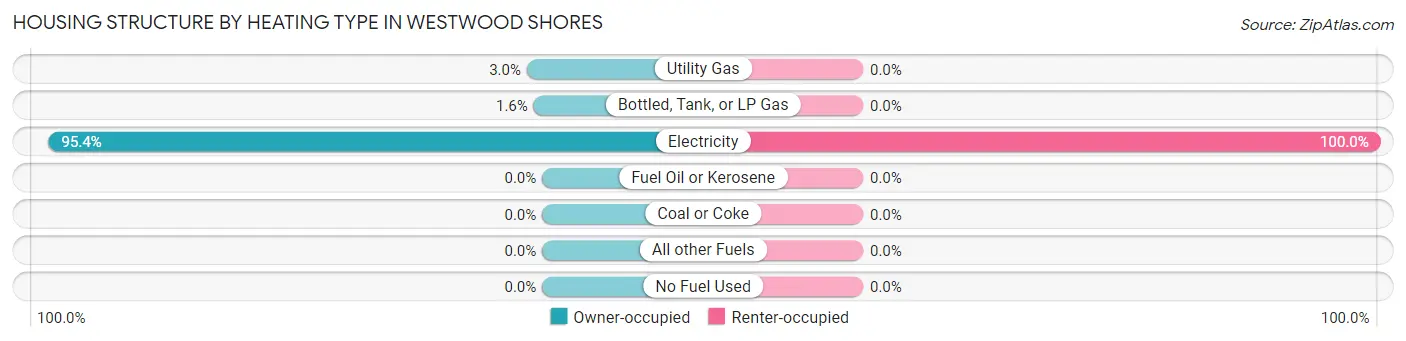
| Heating Type | Owner-occupied | Renter-occupied |
| Utility Gas | 18 (3.0%) | 0 (0.0%) |
| Bottled, Tank, or LP Gas | 10 (1.6%) | 0 (0.0%) |
| Electricity | 580 (95.4%) | 90 (100.0%) |
| Fuel Oil or Kerosene | 0 (0.0%) | 0 (0.0%) |
| Coal or Coke | 0 (0.0%) | 0 (0.0%) |
| All other Fuels | 0 (0.0%) | 0 (0.0%) |
| No Fuel Used | 0 (0.0%) | 0 (0.0%) |
| Total | 608 (100.0%) | 90 (100.0%) |
Household Vehicle Usage in Westwood Shores
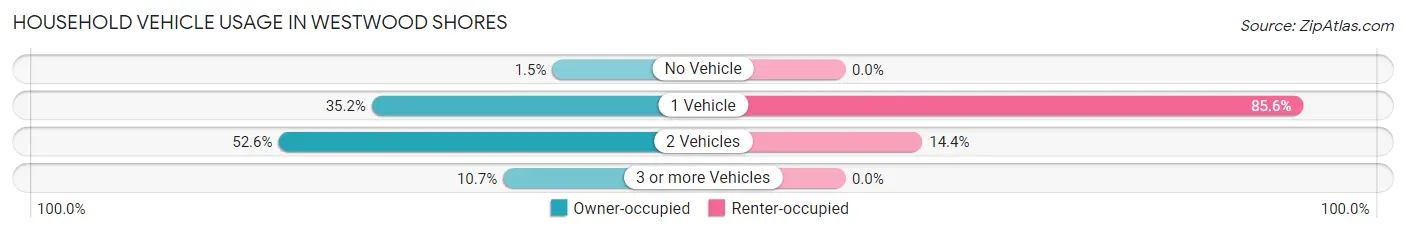
| Vehicles per Household | Owner-occupied | Renter-occupied |
| No Vehicle | 9 (1.5%) | 0 (0.0%) |
| 1 Vehicle | 214 (35.2%) | 77 (85.6%) |
| 2 Vehicles | 320 (52.6%) | 13 (14.4%) |
| 3 or more Vehicles | 65 (10.7%) | 0 (0.0%) |
| Total | 608 (100.0%) | 90 (100.0%) |
Real Estate & Mortgages in Westwood Shores
Real Estate and Mortgage Overview in Westwood Shores
| Characteristic | Without Mortgage | With Mortgage |
| Housing Units | 322 | 286 |
| Median Property Value | $141,800 | $164,600 |
| Median Household Income | $42,685 | $126 |
| Monthly Housing Costs | $566 | $24 |
| Real Estate Taxes | $3,376 | $6 |
Property Value by Mortgage Status in Westwood Shores
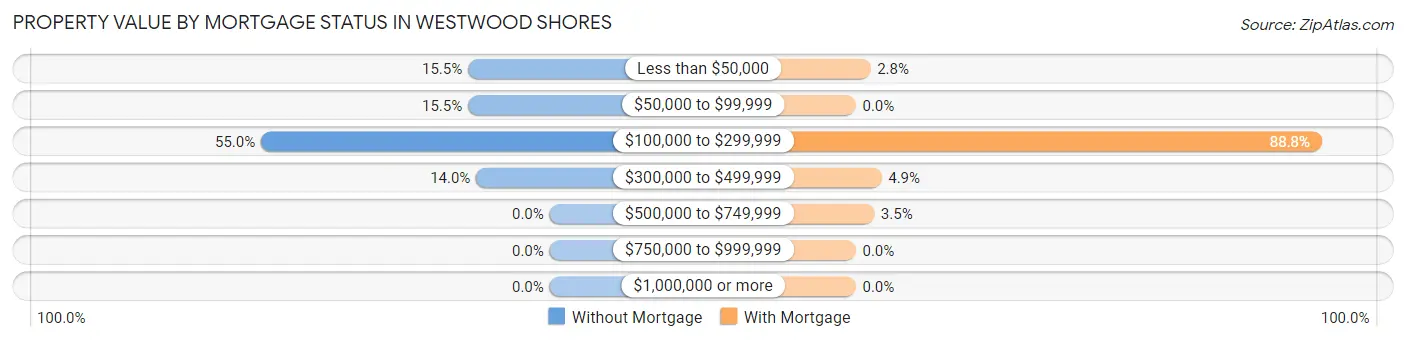
| Property Value | Without Mortgage | With Mortgage |
| Less than $50,000 | 50 (15.5%) | 8 (2.8%) |
| $50,000 to $99,999 | 50 (15.5%) | 0 (0.0%) |
| $100,000 to $299,999 | 177 (55.0%) | 254 (88.8%) |
| $300,000 to $499,999 | 45 (14.0%) | 14 (4.9%) |
| $500,000 to $749,999 | 0 (0.0%) | 10 (3.5%) |
| $750,000 to $999,999 | 0 (0.0%) | 0 (0.0%) |
| $1,000,000 or more | 0 (0.0%) | 0 (0.0%) |
| Total | 322 (100.0%) | 286 (100.0%) |
Household Income by Mortgage Status in Westwood Shores
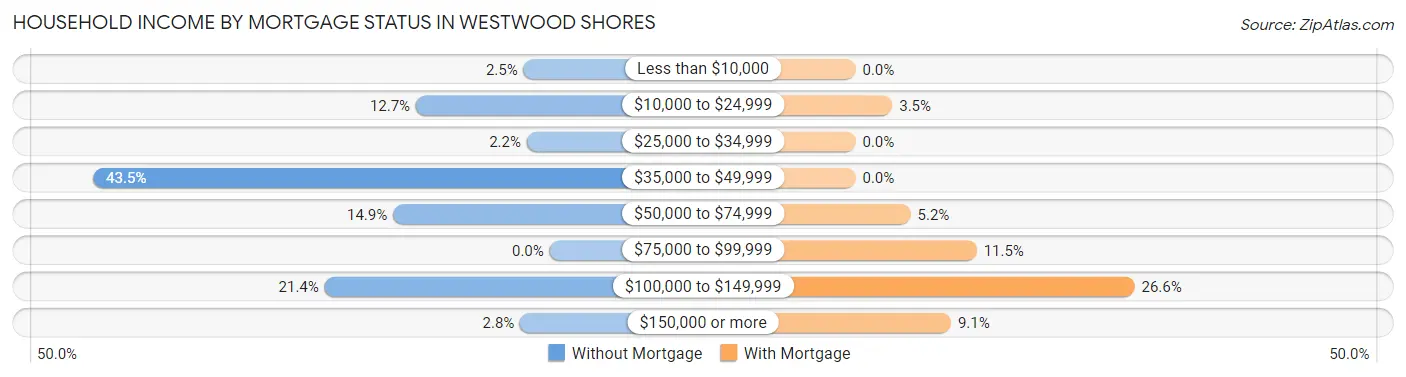
| Household Income | Without Mortgage | With Mortgage |
| Less than $10,000 | 8 (2.5%) | 0 (0.0%) |
| $10,000 to $24,999 | 41 (12.7%) | 10 (3.5%) |
| $25,000 to $34,999 | 7 (2.2%) | 0 (0.0%) |
| $35,000 to $49,999 | 140 (43.5%) | 0 (0.0%) |
| $50,000 to $74,999 | 48 (14.9%) | 15 (5.2%) |
| $75,000 to $99,999 | 0 (0.0%) | 33 (11.5%) |
| $100,000 to $149,999 | 69 (21.4%) | 76 (26.6%) |
| $150,000 or more | 9 (2.8%) | 26 (9.1%) |
| Total | 322 (100.0%) | 286 (100.0%) |
Property Value to Household Income Ratio in Westwood Shores
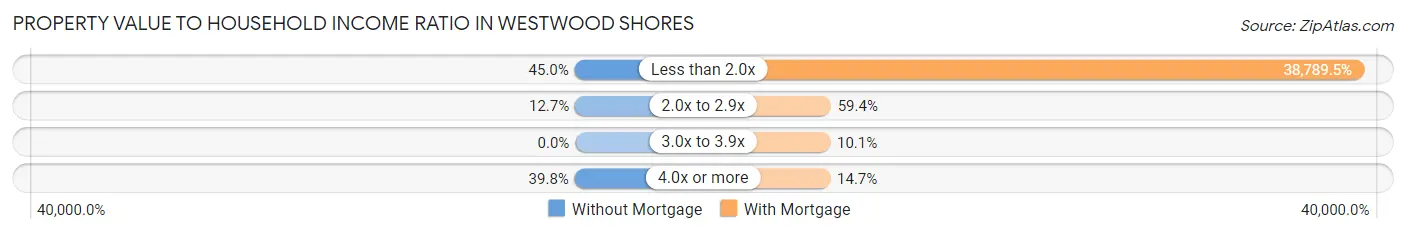
| Value-to-Income Ratio | Without Mortgage | With Mortgage |
| Less than 2.0x | 145 (45.0%) | 110,938 (38,789.5%) |
| 2.0x to 2.9x | 41 (12.7%) | 170 (59.4%) |
| 3.0x to 3.9x | 0 (0.0%) | 29 (10.1%) |
| 4.0x or more | 128 (39.8%) | 42 (14.7%) |
| Total | 322 (100.0%) | 286 (100.0%) |
Real Estate Taxes by Mortgage Status in Westwood Shores
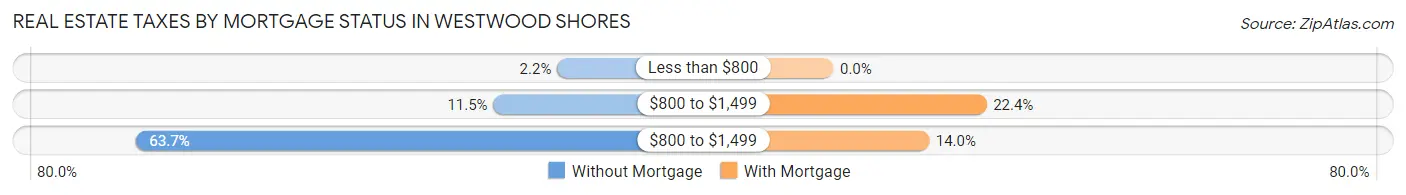
| Property Taxes | Without Mortgage | With Mortgage |
| Less than $800 | 7 (2.2%) | 0 (0.0%) |
| $800 to $1,499 | 37 (11.5%) | 64 (22.4%) |
| $800 to $1,499 | 205 (63.7%) | 40 (14.0%) |
| Total | 322 (100.0%) | 286 (100.0%) |
Health & Disability in Westwood Shores
Health Insurance Coverage by Age in Westwood Shores
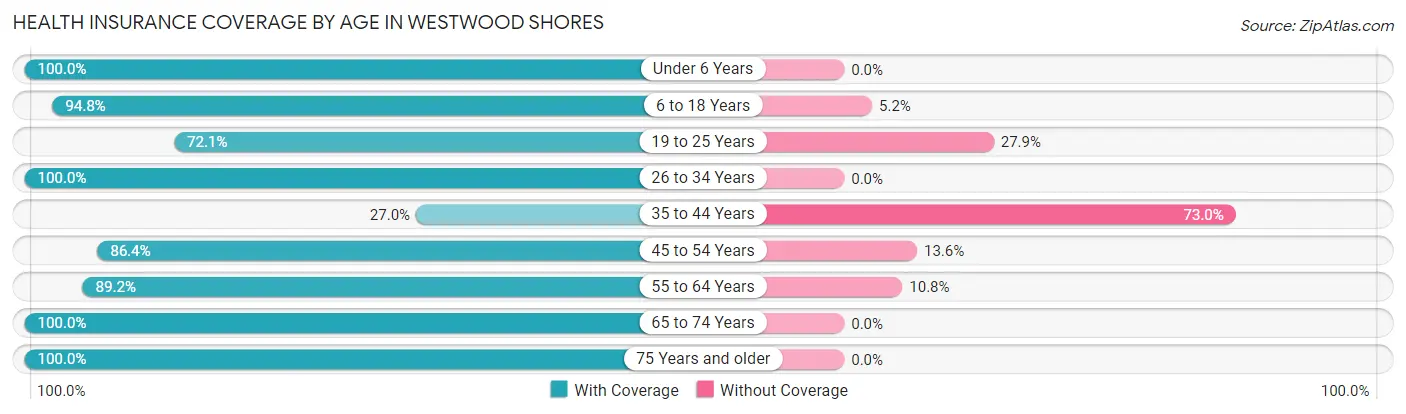
| Age Bracket | With Coverage | Without Coverage |
| Under 6 Years | 79 (100.0%) | 0 (0.0%) |
| 6 to 18 Years | 128 (94.8%) | 7 (5.2%) |
| 19 to 25 Years | 75 (72.1%) | 29 (27.9%) |
| 26 to 34 Years | 59 (100.0%) | 0 (0.0%) |
| 35 to 44 Years | 10 (27.0%) | 27 (73.0%) |
| 45 to 54 Years | 153 (86.4%) | 24 (13.6%) |
| 55 to 64 Years | 214 (89.2%) | 26 (10.8%) |
| 65 to 74 Years | 255 (100.0%) | 0 (0.0%) |
| 75 Years and older | 448 (100.0%) | 0 (0.0%) |
| Total | 1,421 (92.6%) | 113 (7.4%) |
Health Insurance Coverage by Citizenship Status in Westwood Shores
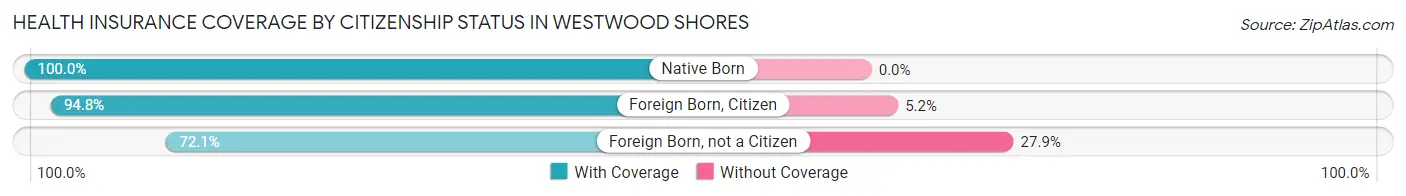
| Citizenship Status | With Coverage | Without Coverage |
| Native Born | 79 (100.0%) | 0 (0.0%) |
| Foreign Born, Citizen | 128 (94.8%) | 7 (5.2%) |
| Foreign Born, not a Citizen | 75 (72.1%) | 29 (27.9%) |
Health Insurance Coverage by Household Income in Westwood Shores
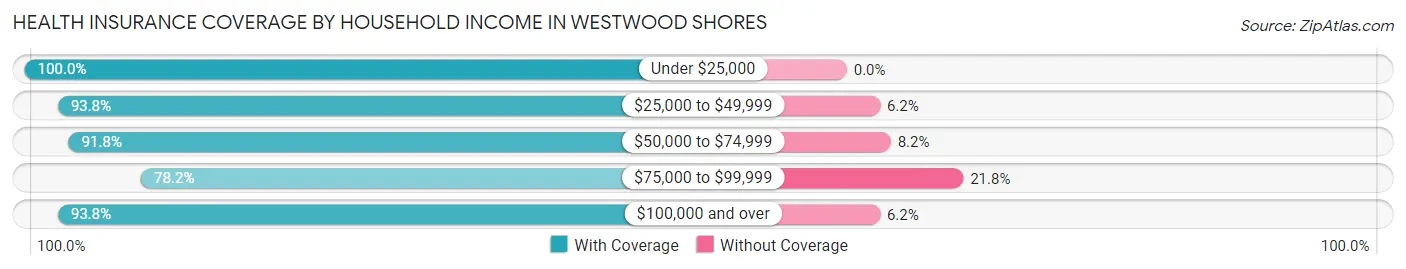
| Household Income | With Coverage | Without Coverage |
| Under $25,000 | 181 (100.0%) | 0 (0.0%) |
| $25,000 to $49,999 | 393 (93.8%) | 26 (6.2%) |
| $50,000 to $74,999 | 145 (91.8%) | 13 (8.2%) |
| $75,000 to $99,999 | 129 (78.2%) | 36 (21.8%) |
| $100,000 and over | 573 (93.8%) | 38 (6.2%) |
Public vs Private Health Insurance Coverage by Age in Westwood Shores
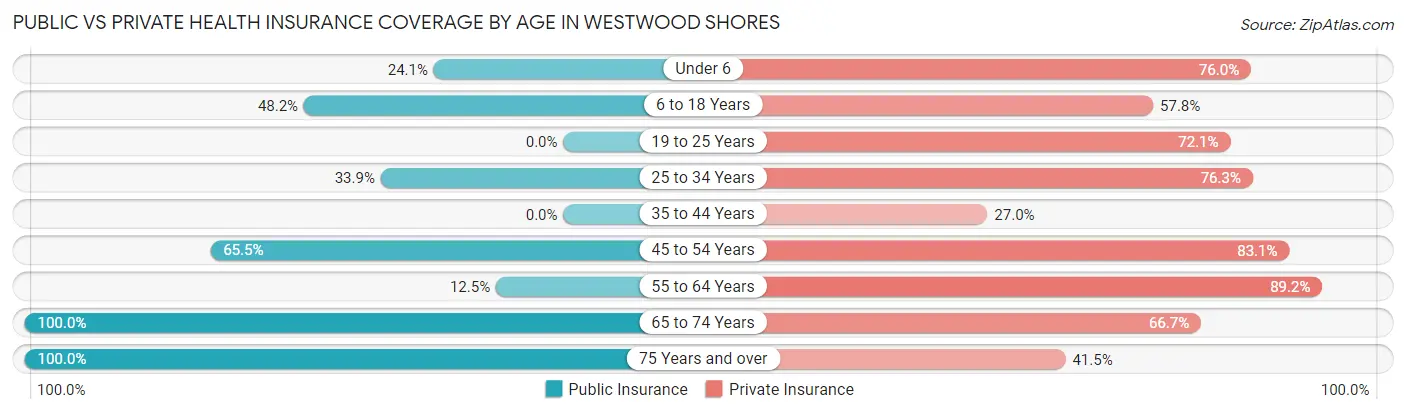
| Age Bracket | Public Insurance | Private Insurance |
| Under 6 | 19 (24.0%) | 60 (75.9%) |
| 6 to 18 Years | 65 (48.1%) | 78 (57.8%) |
| 19 to 25 Years | 0 (0.0%) | 75 (72.1%) |
| 25 to 34 Years | 20 (33.9%) | 45 (76.3%) |
| 35 to 44 Years | 0 (0.0%) | 10 (27.0%) |
| 45 to 54 Years | 116 (65.5%) | 147 (83.1%) |
| 55 to 64 Years | 30 (12.5%) | 214 (89.2%) |
| 65 to 74 Years | 255 (100.0%) | 170 (66.7%) |
| 75 Years and over | 448 (100.0%) | 186 (41.5%) |
| Total | 953 (62.1%) | 985 (64.2%) |
Disability Status by Sex by Age in Westwood Shores
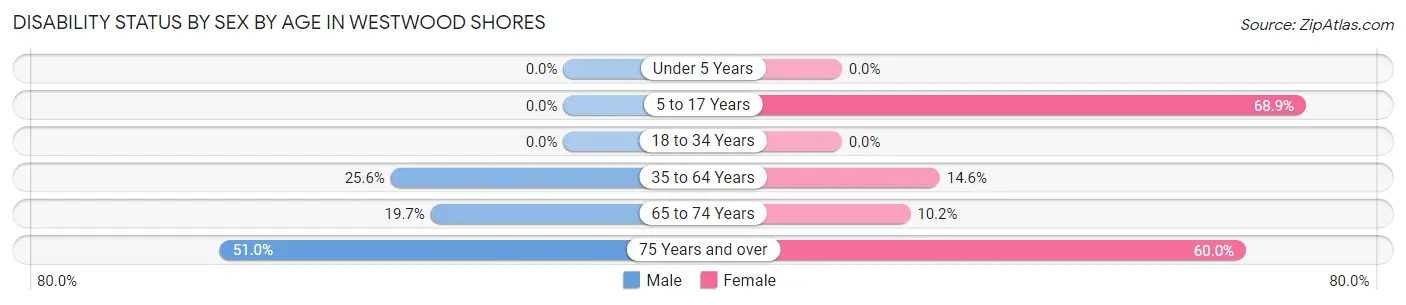
| Age Bracket | Male | Female |
| Under 5 Years | 0 (0.0%) | 0 (0.0%) |
| 5 to 17 Years | 0 (0.0%) | 51 (68.9%) |
| 18 to 34 Years | 0 (0.0%) | 0 (0.0%) |
| 35 to 64 Years | 60 (25.6%) | 32 (14.5%) |
| 65 to 74 Years | 27 (19.7%) | 12 (10.2%) |
| 75 Years and over | 101 (51.0%) | 150 (60.0%) |
Disability Class by Sex by Age in Westwood Shores
Disability Class: Hearing Difficulty
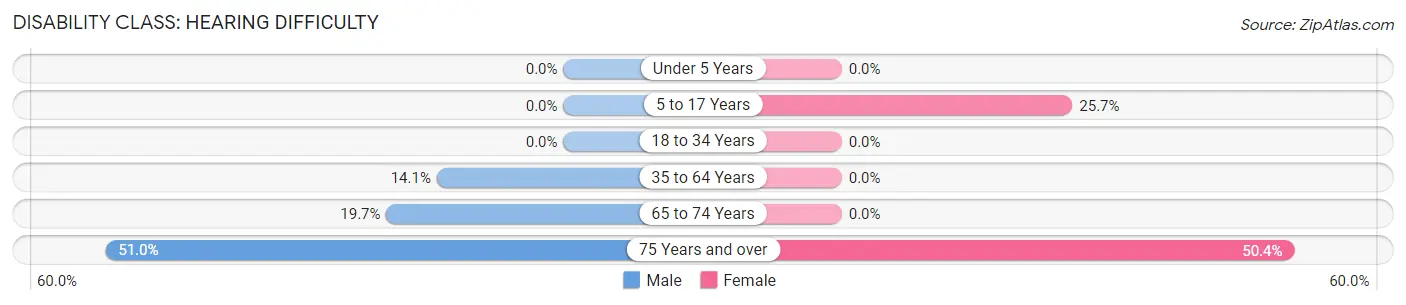
| Age Bracket | Male | Female |
| Under 5 Years | 0 (0.0%) | 0 (0.0%) |
| 5 to 17 Years | 0 (0.0%) | 19 (25.7%) |
| 18 to 34 Years | 0 (0.0%) | 0 (0.0%) |
| 35 to 64 Years | 33 (14.1%) | 0 (0.0%) |
| 65 to 74 Years | 27 (19.7%) | 0 (0.0%) |
| 75 Years and over | 101 (51.0%) | 126 (50.4%) |
Disability Class: Vision Difficulty
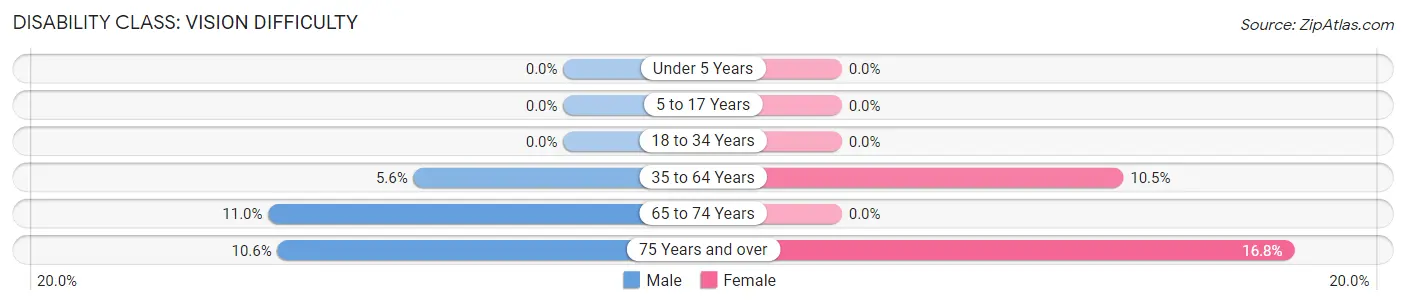
| Age Bracket | Male | Female |
| Under 5 Years | 0 (0.0%) | 0 (0.0%) |
| 5 to 17 Years | 0 (0.0%) | 0 (0.0%) |
| 18 to 34 Years | 0 (0.0%) | 0 (0.0%) |
| 35 to 64 Years | 13 (5.6%) | 23 (10.4%) |
| 65 to 74 Years | 15 (11.0%) | 0 (0.0%) |
| 75 Years and over | 21 (10.6%) | 42 (16.8%) |
Disability Class: Cognitive Difficulty
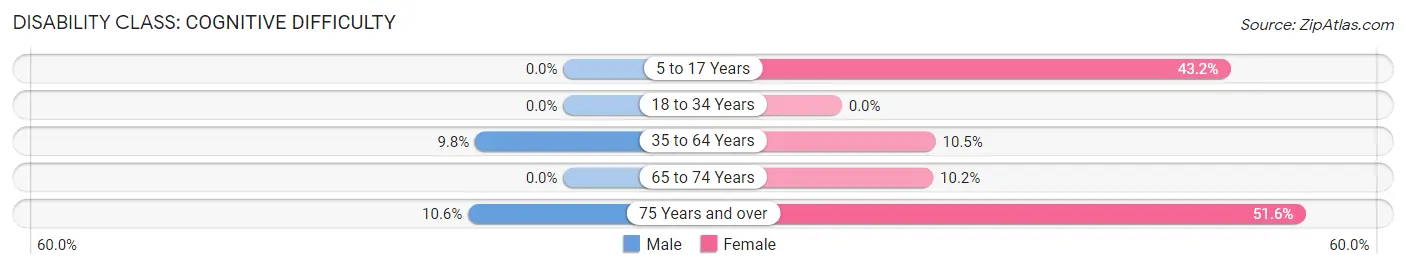
| Age Bracket | Male | Female |
| 5 to 17 Years | 0 (0.0%) | 32 (43.2%) |
| 18 to 34 Years | 0 (0.0%) | 0 (0.0%) |
| 35 to 64 Years | 23 (9.8%) | 23 (10.4%) |
| 65 to 74 Years | 0 (0.0%) | 12 (10.2%) |
| 75 Years and over | 21 (10.6%) | 129 (51.6%) |
Disability Class: Ambulatory Difficulty
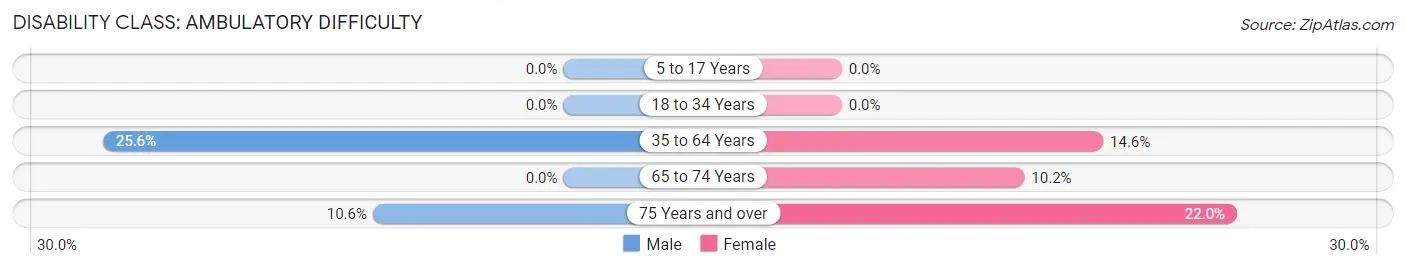
| Age Bracket | Male | Female |
| 5 to 17 Years | 0 (0.0%) | 0 (0.0%) |
| 18 to 34 Years | 0 (0.0%) | 0 (0.0%) |
| 35 to 64 Years | 60 (25.6%) | 32 (14.5%) |
| 65 to 74 Years | 0 (0.0%) | 12 (10.2%) |
| 75 Years and over | 21 (10.6%) | 55 (22.0%) |
Disability Class: Self-Care Difficulty
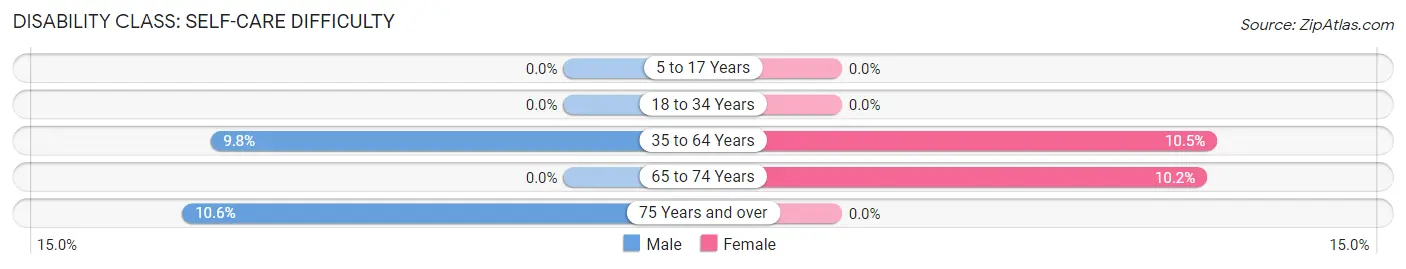
| Age Bracket | Male | Female |
| 5 to 17 Years | 0 (0.0%) | 0 (0.0%) |
| 18 to 34 Years | 0 (0.0%) | 0 (0.0%) |
| 35 to 64 Years | 23 (9.8%) | 23 (10.4%) |
| 65 to 74 Years | 0 (0.0%) | 12 (10.2%) |
| 75 Years and over | 21 (10.6%) | 0 (0.0%) |
Technology Access in Westwood Shores
Computing Device Access in Westwood Shores
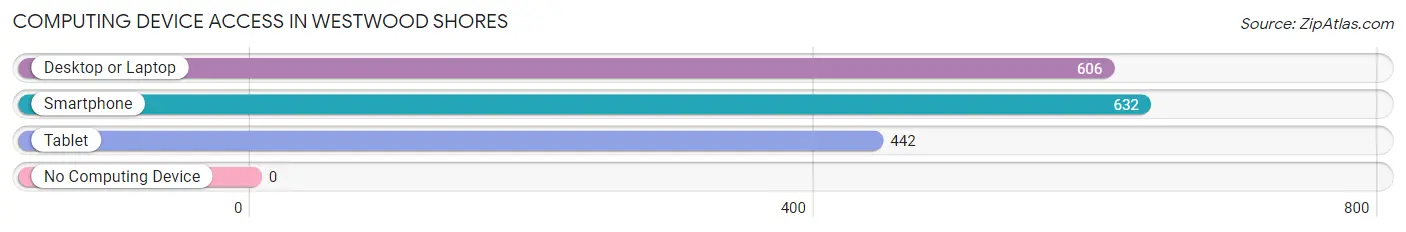
| Device Type | # Households | % Households |
| Desktop or Laptop | 606 | 86.8% |
| Smartphone | 632 | 90.5% |
| Tablet | 442 | 63.3% |
| No Computing Device | 0 | 0.0% |
| Total | 698 | 100.0% |
Internet Access in Westwood Shores
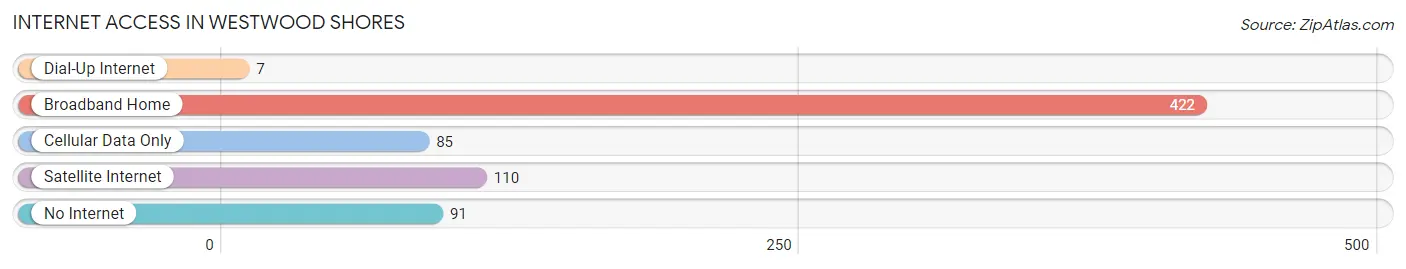
| Internet Type | # Households | % Households |
| Dial-Up Internet | 7 | 1.0% |
| Broadband Home | 422 | 60.5% |
| Cellular Data Only | 85 | 12.2% |
| Satellite Internet | 110 | 15.8% |
| No Internet | 91 | 13.0% |
| Total | 698 | 100.0% |
Westwood Shores Summary
Westwood Shores is a small city located in Galveston County, Texas. It is situated on the western shore of Galveston Bay, approximately 25 miles southeast of Houston. The city has a population of approximately 1,500 people and covers an area of 1.2 square miles.
History
Westwood Shores was founded in the late 1800s by a group of settlers from the nearby city of Galveston. The settlers were looking for a place to settle away from the hustle and bustle of the city. They chose the area because of its proximity to the bay and its abundance of natural resources. The settlers named the area Westwood Shores, after the nearby Westwood Bay.
The city was incorporated in the early 1900s and quickly grew in population. The city was home to a variety of businesses, including a sawmill, a brickyard, and a cannery. The city also had a thriving fishing industry, with many of the residents making their living from the bay.
In the 1950s, the city began to experience a decline in population as many of the residents moved away to larger cities. The city was also hit hard by Hurricane Carla in 1961, which caused extensive damage to the city.
Geography
Westwood Shores is located on the western shore of Galveston Bay, approximately 25 miles southeast of Houston. The city is situated on a peninsula, with the bay to the east and the Gulf of Mexico to the south. The city is bordered by the cities of Galveston and Texas City to the north and east, respectively.
The city has a humid subtropical climate, with hot, humid summers and mild winters. The average temperature in the summer is around 80 degrees Fahrenheit, while the average temperature in the winter is around 60 degrees Fahrenheit.
Economy
The economy of Westwood Shores is largely based on tourism and fishing. The city is home to several marinas, which attract visitors from all over the world. The city also has a thriving fishing industry, with many of the residents making their living from the bay.
The city is also home to several small businesses, including restaurants, retail stores, and other services. The city is also home to a number of manufacturing companies, including a boat manufacturer and a seafood processing plant.
Demographics
As of the 2010 census, the population of Westwood Shores was 1,500. The racial makeup of the city was 79.2% White, 14.7% African American, 0.7% Native American, 0.7% Asian, and 4.7% from other races. The median household income was $45,000, and the median family income was $50,000.
The city is home to a variety of religious denominations, including Baptist, Catholic, Methodist, and Presbyterian. The city is also home to a variety of cultural and recreational activities, including festivals, concerts, and sporting events.
Conclusion
Westwood Shores is a small city located in Galveston County, Texas. It is situated on the western shore of Galveston Bay, approximately 25 miles southeast of Houston. The city has a population of approximately 1,500 people and covers an area of 1.2 square miles. The economy of Westwood Shores is largely based on tourism and fishing, and the city is home to a variety of religious denominations, cultural and recreational activities.
Common Questions
What is the Total Population of Westwood Shores?
Total Population of Westwood Shores is 1,534.
What is the Total Male Population of Westwood Shores?
Total Male Population of Westwood Shores is 790.
What is the Total Female Population of Westwood Shores?
Total Female Population of Westwood Shores is 744.
What is the Ratio of Males per 100 Females in Westwood Shores?
There are 106.18 Males per 100 Females in Westwood Shores.
What is the Ratio of Females per 100 Males in Westwood Shores?
There are 94.18 Females per 100 Males in Westwood Shores.
What is the Median Population Age in Westwood Shores?
Median Population Age in Westwood Shores is 60.4 Years.
What is the Average Family Size in Westwood Shores
Average Family Size in Westwood Shores is 2.5 People.
What is the Average Household Size in Westwood Shores
Average Household Size in Westwood Shores is 2.2 People.
What is Per Capita Income in Westwood Shores?
Per Capita income in Westwood Shores is $41,758.
What is the Median Family Income in Westwood Shores?
Median Family Income in Westwood Shores is $82,115.
What is the Median Household income in Westwood Shores?
Median Household Income in Westwood Shores is $65,714.
What is Income or Wage Gap in Westwood Shores?
Income or Wage Gap in Westwood Shores is 3.3%.
Women in Westwood Shores earn 96.7 cents for every dollar earned by a man.
What is Inequality or Gini Index in Westwood Shores?
Inequality or Gini Index in Westwood Shores is 0.47.
How Large is the Labor Force in Westwood Shores?
There are 453 People in the Labor Forcein in Westwood Shores.
What is the Percentage of People in the Labor Force in Westwood Shores?
34.1% of People are in the Labor Force in Westwood Shores.
What is the Unemployment Rate in Westwood Shores?
Unemployment Rate in Westwood Shores is 7.7%.