Hallsville, TX
Hallsville Map
Hallsville Overview
4,359
TOTAL POPULATION
2,695
MALE POPULATION
1,664
FEMALE POPULATION
161.96
MALES / 100 FEMALES
61.74
FEMALES / 100 MALES
34.3
MEDIAN AGE
3.0
AVG FAMILY SIZE
2.7
AVG HOUSEHOLD SIZE
$38,749
PER CAPITA INCOME
$91,720
AVG FAMILY INCOME
$86,757
AVG HOUSEHOLD INCOME
40.9%
WAGE / INCOME GAP [ % ]
59.1¢/ $1
WAGE / INCOME GAP [ $ ]
0.35
INEQUALITY / GINI INDEX
2,542
LABOR FORCE [ PEOPLE ]
73.1%
PERCENT IN LABOR FORCE
1.5%
UNEMPLOYMENT RATE
Hallsville Zip Codes
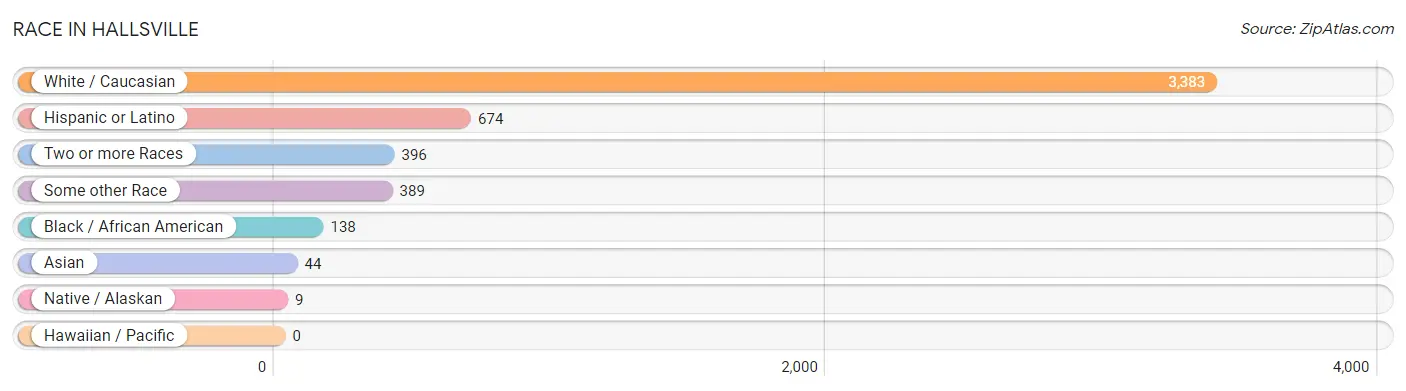
Race in Hallsville
The most populous races in Hallsville are White / Caucasian (3,383 | 77.6%), Hispanic or Latino (674 | 15.5%), and Two or more Races (396 | 9.1%).
| Race | # Population | % Population |
| Asian | 44 | 1.0% |
| Black / African American | 138 | 3.2% |
| Hawaiian / Pacific | 0 | 0.0% |
| Hispanic or Latino | 674 | 15.5% |
| Native / Alaskan | 9 | 0.2% |
| White / Caucasian | 3,383 | 77.6% |
| Two or more Races | 396 | 9.1% |
| Some other Race | 389 | 8.9% |
| Total | 4,359 | 100.0% |
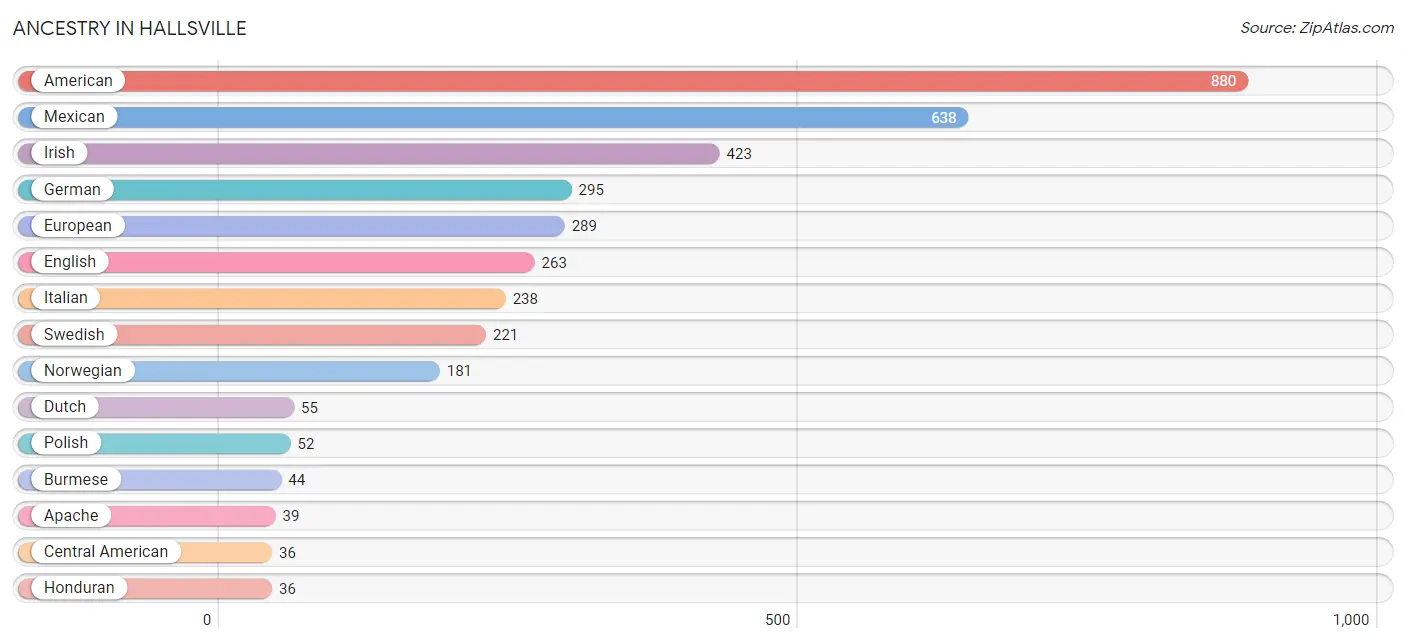
Ancestry in Hallsville
The most populous ancestries reported in Hallsville are American (880 | 20.2%), Mexican (638 | 14.6%), Irish (423 | 9.7%), German (295 | 6.8%), and European (289 | 6.6%), together accounting for 57.9% of all Hallsville residents.
| Ancestry | # Population | % Population |
| American | 880 | 20.2% |
| Apache | 39 | 0.9% |
| Burmese | 44 | 1.0% |
| Central American | 36 | 0.8% |
| Czech | 24 | 0.5% |
| Dutch | 55 | 1.3% |
| English | 263 | 6.0% |
| European | 289 | 6.6% |
| French | 32 | 0.7% |
| German | 295 | 6.8% |
| Honduran | 36 | 0.8% |
| Iranian | 11 | 0.3% |
| Irish | 423 | 9.7% |
| Italian | 238 | 5.5% |
| Mexican | 638 | 14.6% |
| Norwegian | 181 | 4.2% |
| Polish | 52 | 1.2% |
| Scandinavian | 26 | 0.6% |
| Scotch-Irish | 29 | 0.7% |
| Swedish | 221 | 5.1% | View All 20 Rows |
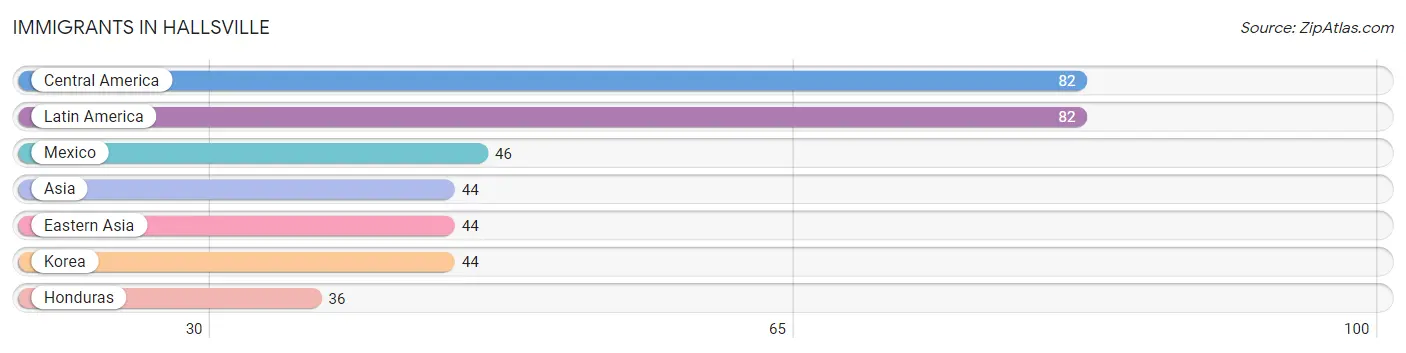
Immigrants in Hallsville
The most numerous immigrant groups reported in Hallsville came from Central America (82 | 1.9%), Latin America (82 | 1.9%), Mexico (46 | 1.1%), Asia (44 | 1.0%), and Eastern Asia (44 | 1.0%), together accounting for 6.8% of all Hallsville residents.
| Immigration Origin | # Population | % Population |
| Asia | 44 | 1.0% |
| Central America | 82 | 1.9% |
| Eastern Asia | 44 | 1.0% |
| Honduras | 36 | 0.8% |
| Korea | 44 | 1.0% |
| Latin America | 82 | 1.9% |
| Mexico | 46 | 1.1% | View All 7 Rows |
Sex and Age in Hallsville
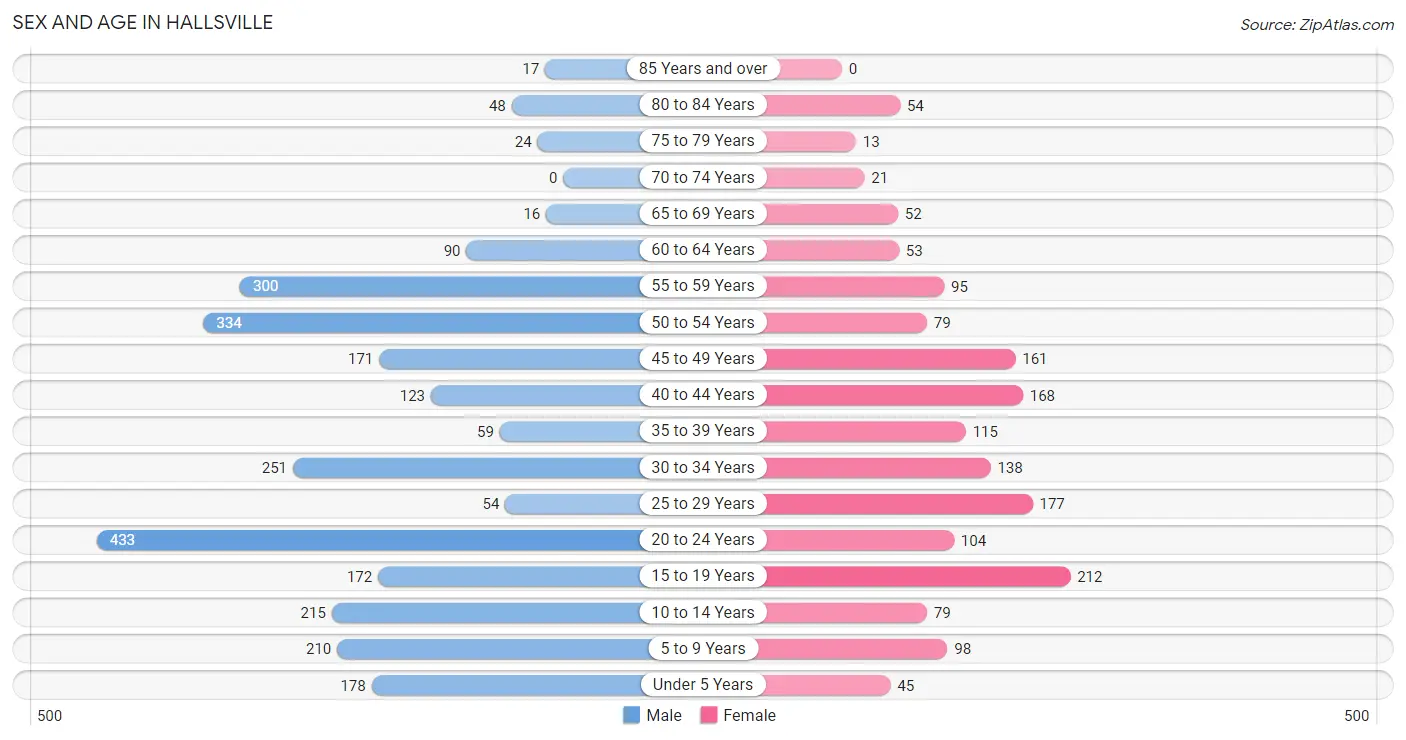
Sex and Age in Hallsville
The most populous age groups in Hallsville are 20 to 24 Years (433 | 16.1%) for men and 15 to 19 Years (212 | 12.7%) for women.
| Age Bracket | Male | Female |
| Under 5 Years | 178 (6.6%) | 45 (2.7%) |
| 5 to 9 Years | 210 (7.8%) | 98 (5.9%) |
| 10 to 14 Years | 215 (8.0%) | 79 (4.8%) |
| 15 to 19 Years | 172 (6.4%) | 212 (12.7%) |
| 20 to 24 Years | 433 (16.1%) | 104 (6.2%) |
| 25 to 29 Years | 54 (2.0%) | 177 (10.6%) |
| 30 to 34 Years | 251 (9.3%) | 138 (8.3%) |
| 35 to 39 Years | 59 (2.2%) | 115 (6.9%) |
| 40 to 44 Years | 123 (4.6%) | 168 (10.1%) |
| 45 to 49 Years | 171 (6.4%) | 161 (9.7%) |
| 50 to 54 Years | 334 (12.4%) | 79 (4.8%) |
| 55 to 59 Years | 300 (11.1%) | 95 (5.7%) |
| 60 to 64 Years | 90 (3.3%) | 53 (3.2%) |
| 65 to 69 Years | 16 (0.6%) | 52 (3.1%) |
| 70 to 74 Years | 0 (0.0%) | 21 (1.3%) |
| 75 to 79 Years | 24 (0.9%) | 13 (0.8%) |
| 80 to 84 Years | 48 (1.8%) | 54 (3.3%) |
| 85 Years and over | 17 (0.6%) | 0 (0.0%) |
| Total | 2,695 (100.0%) | 1,664 (100.0%) |
Families and Households in Hallsville
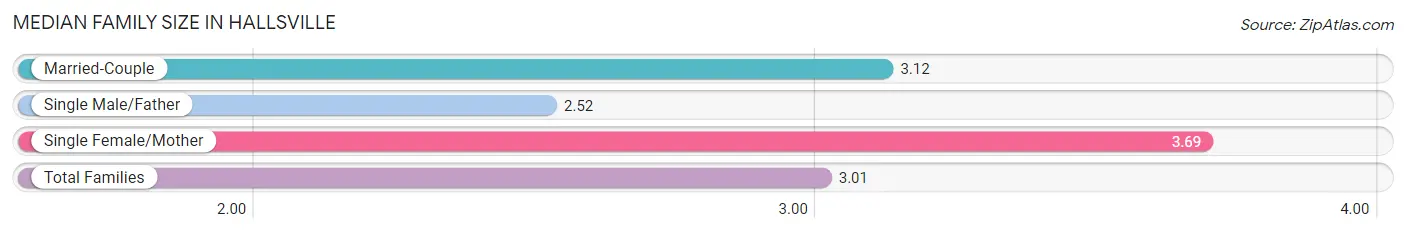
Median Family Size in Hallsville
The median family size in Hallsville is 3.01 persons per family, with single female/mother families (36 | 2.8%) accounting for the largest median family size of 3.69 persons per family. On the other hand, single male/father families (271 | 20.7%) represent the smallest median family size with 2.52 persons per family.
| Family Type | # Families | Family Size |
| Married-Couple | 1,004 (76.6%) | 3.12 |
| Single Male/Father | 271 (20.7%) | 2.52 |
| Single Female/Mother | 36 (2.8%) | 3.69 |
| Total Families | 1,311 (100.0%) | 3.01 |
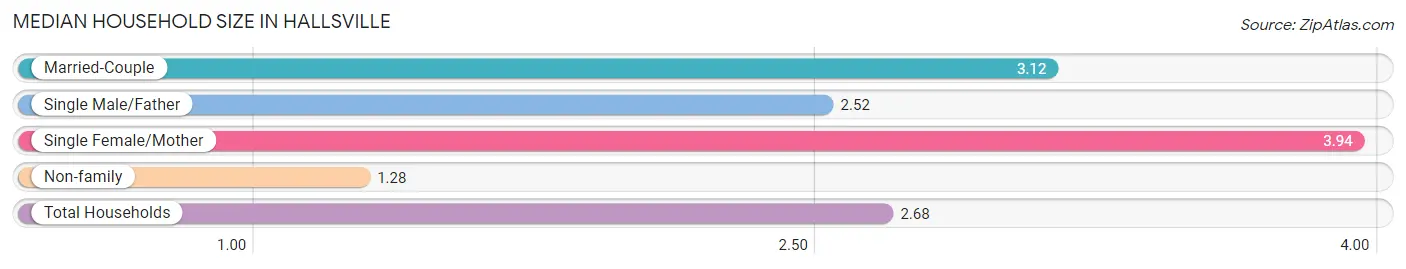
Median Household Size in Hallsville
The median household size in Hallsville is 2.68 persons per household, with single female/mother households (36 | 2.2%) accounting for the largest median household size of 3.94 persons per household. non-family households (317 | 19.5%) represent the smallest median household size with 1.28 persons per household.
| Household Type | # Households | Household Size |
| Married-Couple | 1,004 (61.7%) | 3.12 |
| Single Male/Father | 271 (16.7%) | 2.52 |
| Single Female/Mother | 36 (2.2%) | 3.94 |
| Non-family | 317 (19.5%) | 1.28 |
| Total Households | 1,628 (100.0%) | 2.68 |
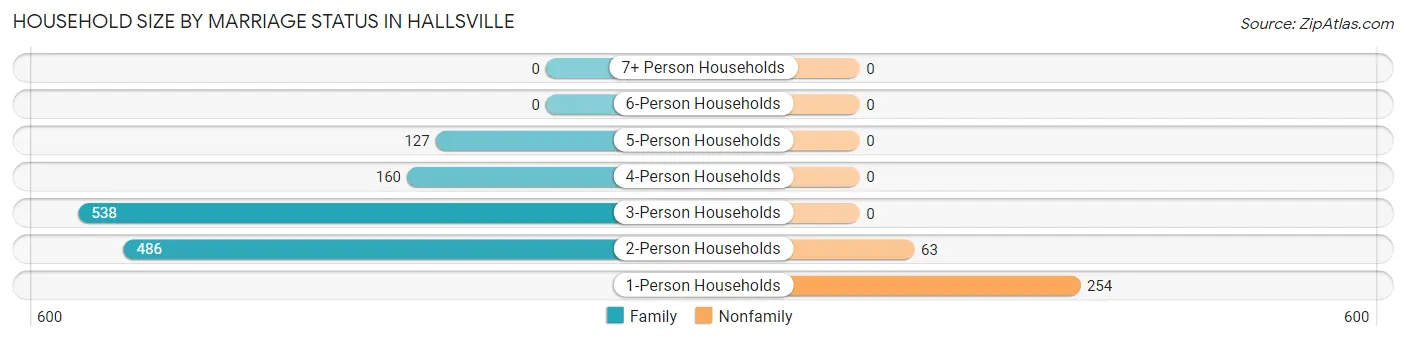
Household Size by Marriage Status in Hallsville
Out of a total of 1,628 households in Hallsville, 1,311 (80.5%) are family households, while 317 (19.5%) are nonfamily households. The most numerous type of family households are 3-person households, comprising 538, and the most common type of nonfamily households are 1-person households, comprising 254.
| Household Size | Family Households | Nonfamily Households |
| 1-Person Households | - | 254 (15.6%) |
| 2-Person Households | 486 (29.8%) | 63 (3.9%) |
| 3-Person Households | 538 (33.1%) | 0 (0.0%) |
| 4-Person Households | 160 (9.8%) | 0 (0.0%) |
| 5-Person Households | 127 (7.8%) | 0 (0.0%) |
| 6-Person Households | 0 (0.0%) | 0 (0.0%) |
| 7+ Person Households | 0 (0.0%) | 0 (0.0%) |
| Total | 1,311 (80.5%) | 317 (19.5%) |
Female Fertility in Hallsville
Fertility by Age in Hallsville
Average fertility rate in Hallsville is 21.0 births per 1,000 women. Women in the age bracket of 20 to 34 years have the highest fertility rate with 55.0 births per 1,000 women. Women in the age bracket of 20 to 34 years acount for 100.0% of all women with births.
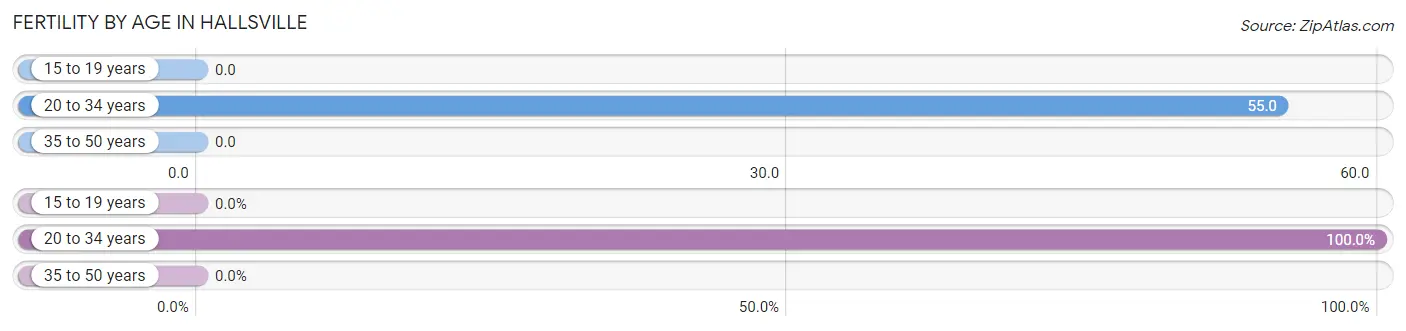
| Age Bracket | Women with Births | Births / 1,000 Women |
| 15 to 19 years | 0 (0.0%) | 0.0 |
| 20 to 34 years | 23 (100.0%) | 55.0 |
| 35 to 50 years | 0 (0.0%) | 0.0 |
| Total | 23 (100.0%) | 21.0 |
Fertility by Age by Marriage Status in Hallsville
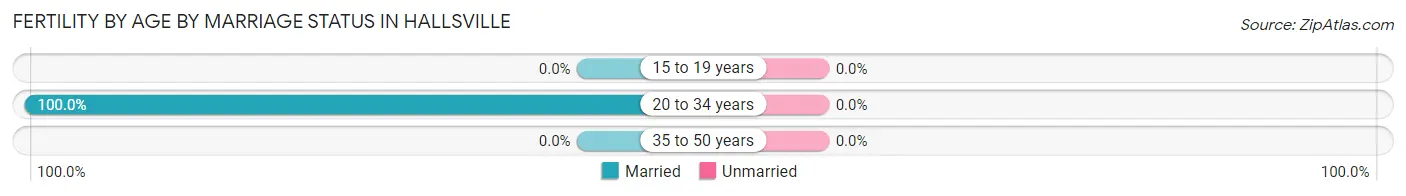
| Age Bracket | Married | Unmarried |
| 15 to 19 years | 0 (0.0%) | 0 (0.0%) |
| 20 to 34 years | 23 (100.0%) | 0 (0.0%) |
| 35 to 50 years | 0 (0.0%) | 0 (0.0%) |
| Total | 23 (100.0%) | 0 (0.0%) |
Fertility by Education in Hallsville
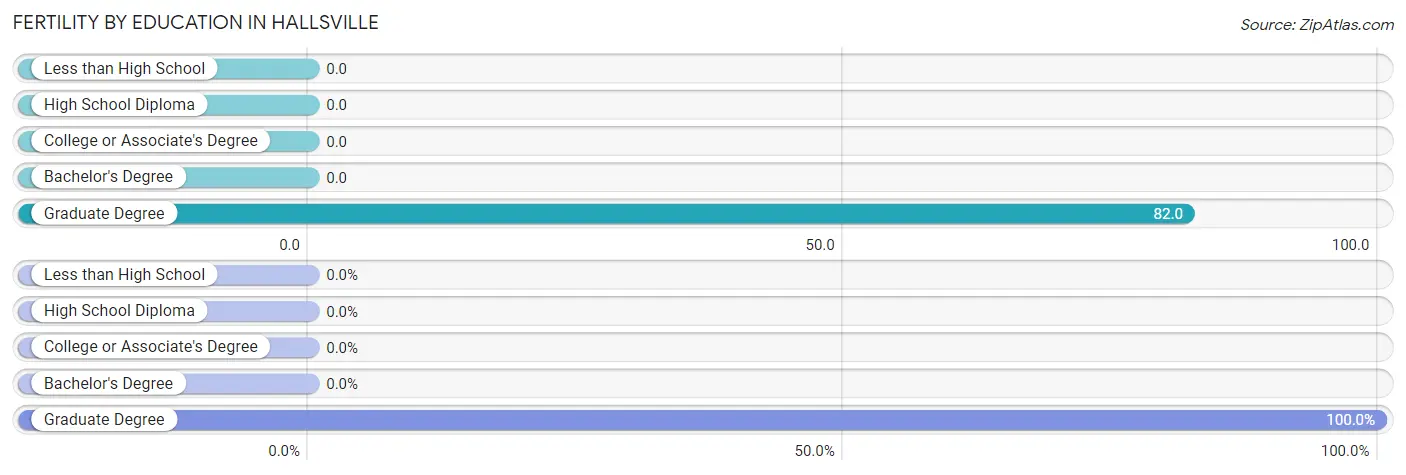
| Educational Attainment | Women with Births | Births / 1,000 Women |
| Less than High School | 0 (0.0%) | 0.0 |
| High School Diploma | 0 (0.0%) | 0.0 |
| College or Associate's Degree | 0 (0.0%) | 0.0 |
| Bachelor's Degree | 0 (0.0%) | 0.0 |
| Graduate Degree | 23 (100.0%) | 82.0 |
| Total | 23 (100.0%) | 21.0 |
Fertility by Education by Marriage Status in Hallsville
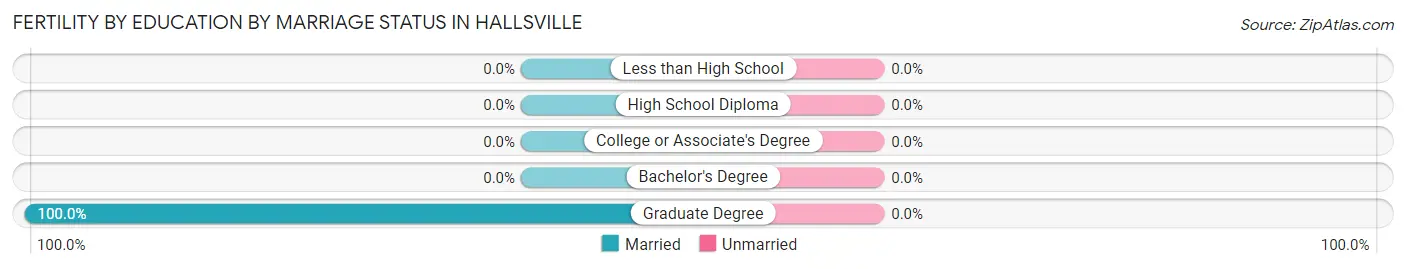
| Educational Attainment | Married | Unmarried |
| Less than High School | 0 (0.0%) | 0 (0.0%) |
| High School Diploma | 0 (0.0%) | 0 (0.0%) |
| College or Associate's Degree | 0 (0.0%) | 0 (0.0%) |
| Bachelor's Degree | 0 (0.0%) | 0 (0.0%) |
| Graduate Degree | 23 (100.0%) | 0 (0.0%) |
| Total | 23 (100.0%) | 0 (0.0%) |
Income in Hallsville
Income Overview in Hallsville
Per Capita Income in Hallsville is $38,749, while median incomes of families and households are $91,720 and $86,757 respectively.
| Characteristic | Number | Measure |
| Per Capita Income | 4,359 | $38,749 |
| Median Family Income | 1,311 | $91,720 |
| Mean Family Income | 1,311 | $110,554 |
| Median Household Income | 1,628 | $86,757 |
| Mean Household Income | 1,628 | $102,070 |
| Income Deficit | 1,311 | $0 |
| Wage / Income Gap (%) | 4,359 | 40.90% |
| Wage / Income Gap ($) | 4,359 | 59.10¢ per $1 |
| Gini / Inequality Index | 4,359 | 0.35 |
Earnings by Sex in Hallsville
Average Earnings in Hallsville are $50,440, $58,362 for men and $34,492 for women, a difference of 40.9%.
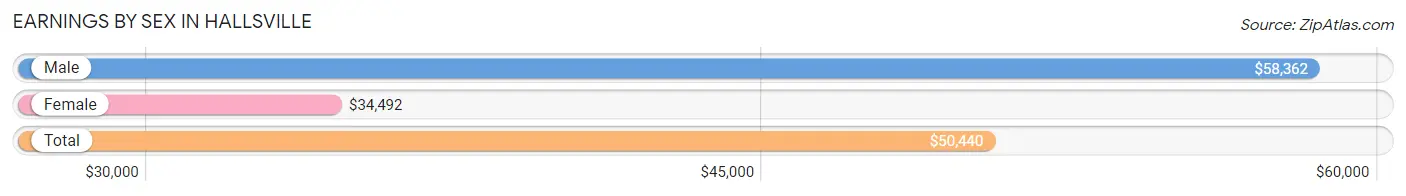
| Sex | Number | Average Earnings |
| Male | 1,666 (61.6%) | $58,362 |
| Female | 1,038 (38.4%) | $34,492 |
| Total | 2,704 (100.0%) | $50,440 |
Earnings by Sex by Income Bracket in Hallsville
The most common earnings brackets in Hallsville are $100,000+ for men (373 | 22.4%) and $55,000 to $64,999 for women (169 | 16.3%).
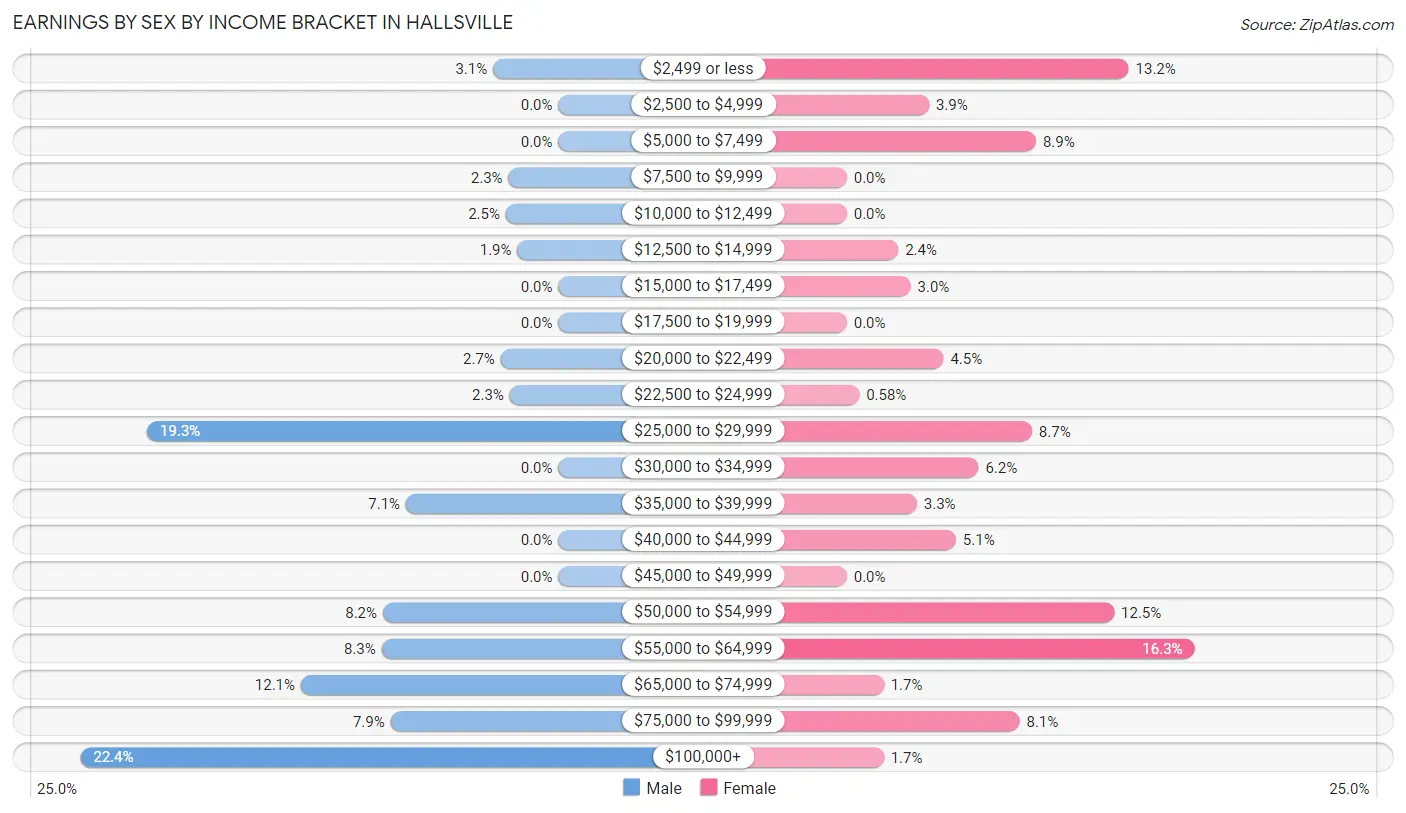
| Income | Male | Female |
| $2,499 or less | 51 (3.1%) | 137 (13.2%) |
| $2,500 to $4,999 | 0 (0.0%) | 40 (3.8%) |
| $5,000 to $7,499 | 0 (0.0%) | 92 (8.9%) |
| $7,500 to $9,999 | 39 (2.3%) | 0 (0.0%) |
| $10,000 to $12,499 | 41 (2.5%) | 0 (0.0%) |
| $12,500 to $14,999 | 32 (1.9%) | 25 (2.4%) |
| $15,000 to $17,499 | 0 (0.0%) | 31 (3.0%) |
| $17,500 to $19,999 | 0 (0.0%) | 0 (0.0%) |
| $20,000 to $22,499 | 45 (2.7%) | 47 (4.5%) |
| $22,500 to $24,999 | 38 (2.3%) | 6 (0.6%) |
| $25,000 to $29,999 | 321 (19.3%) | 90 (8.7%) |
| $30,000 to $34,999 | 0 (0.0%) | 64 (6.2%) |
| $35,000 to $39,999 | 119 (7.1%) | 34 (3.3%) |
| $40,000 to $44,999 | 0 (0.0%) | 53 (5.1%) |
| $45,000 to $49,999 | 0 (0.0%) | 0 (0.0%) |
| $50,000 to $54,999 | 137 (8.2%) | 130 (12.5%) |
| $55,000 to $64,999 | 138 (8.3%) | 169 (16.3%) |
| $65,000 to $74,999 | 201 (12.1%) | 18 (1.7%) |
| $75,000 to $99,999 | 131 (7.9%) | 84 (8.1%) |
| $100,000+ | 373 (22.4%) | 18 (1.7%) |
| Total | 1,666 (100.0%) | 1,038 (100.0%) |
Earnings by Sex by Educational Attainment in Hallsville
Average earnings in Hallsville are $65,684 for men and $50,500 for women, a difference of 23.1%. Men with an educational attainment of graduate degree enjoy the highest average annual earnings of $115,859, while those with bachelor's degree education earn the least with $64,518. Women with an educational attainment of bachelor's degree earn the most with the average annual earnings of $59,750, while those with college or associate's degree education have the smallest earnings of $33,081.
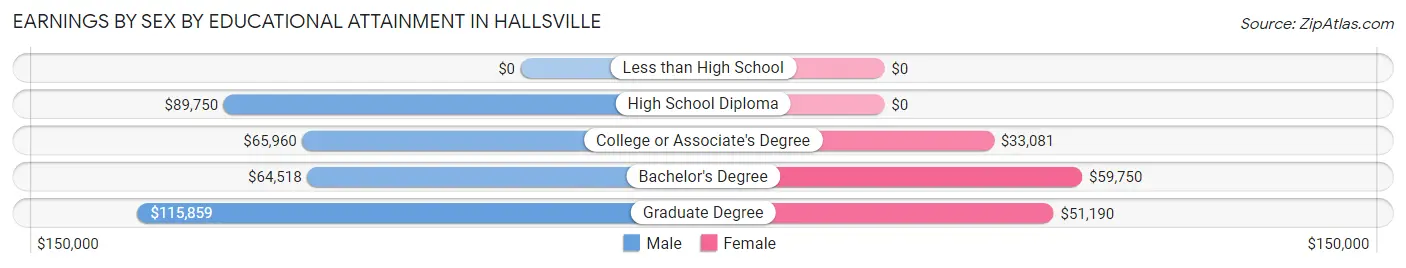
| Educational Attainment | Male Income | Female Income |
| Less than High School | - | - |
| High School Diploma | $89,750 | $0 |
| College or Associate's Degree | $65,960 | $33,081 |
| Bachelor's Degree | $64,518 | $59,750 |
| Graduate Degree | $115,859 | $51,190 |
| Total | $65,684 | $50,500 |
Family Income in Hallsville
Family Income Brackets in Hallsville
According to the Hallsville family income data, there are 298 families falling into the $100,000 to $149,999 income range, which is the most common income bracket and makes up 22.7% of all families.
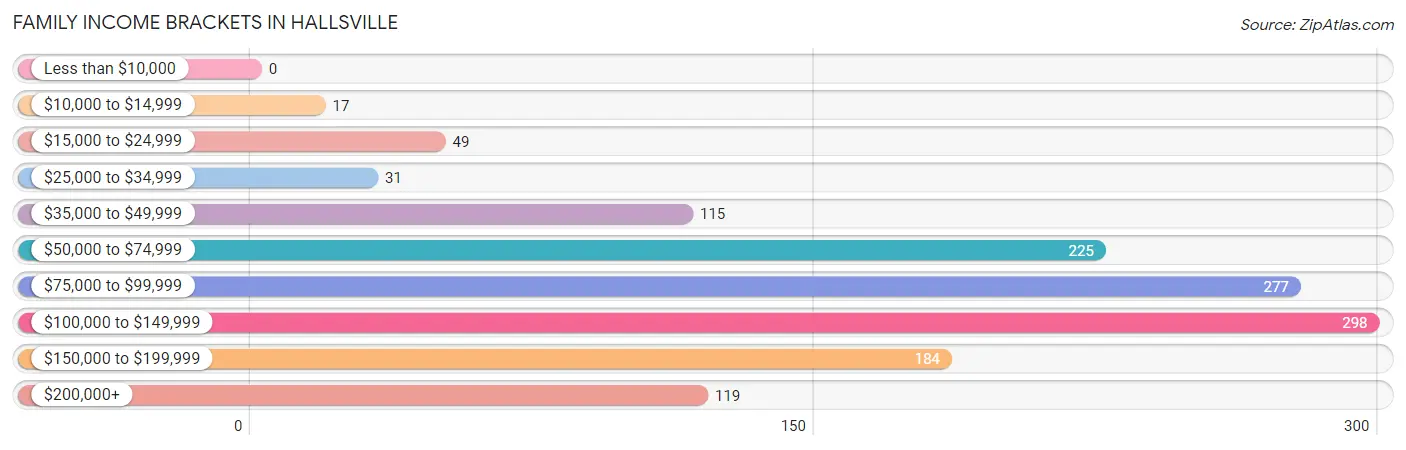
| Income Bracket | # Families | % Families |
| Less than $10,000 | 0 | 0.0% |
| $10,000 to $14,999 | 17 | 1.3% |
| $15,000 to $24,999 | 49 | 3.7% |
| $25,000 to $34,999 | 31 | 2.4% |
| $35,000 to $49,999 | 115 | 8.8% |
| $50,000 to $74,999 | 225 | 17.2% |
| $75,000 to $99,999 | 277 | 21.1% |
| $100,000 to $149,999 | 298 | 22.7% |
| $150,000 to $199,999 | 184 | 14.0% |
| $200,000+ | 119 | 9.1% |
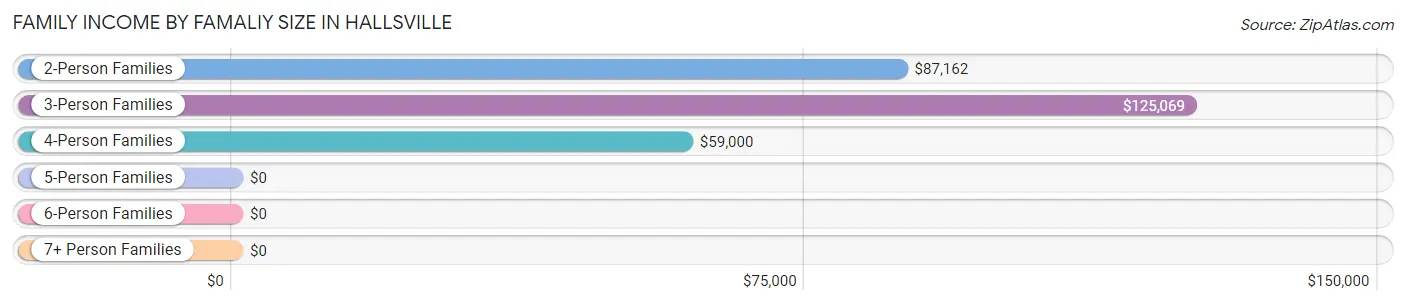
Family Income by Famaliy Size in Hallsville
3-person families (520 | 39.7%) account for the highest median family income in Hallsville with $125,069 per family, while 2-person families (504 | 38.4%) have the highest median income of $43,581 per family member.
| Income Bracket | # Families | Median Income |
| 2-Person Families | 504 (38.4%) | $87,162 |
| 3-Person Families | 520 (39.7%) | $125,069 |
| 4-Person Families | 160 (12.2%) | $59,000 |
| 5-Person Families | 127 (9.7%) | $0 |
| 6-Person Families | 0 (0.0%) | $0 |
| 7+ Person Families | 0 (0.0%) | $0 |
| Total | 1,311 (100.0%) | $91,720 |
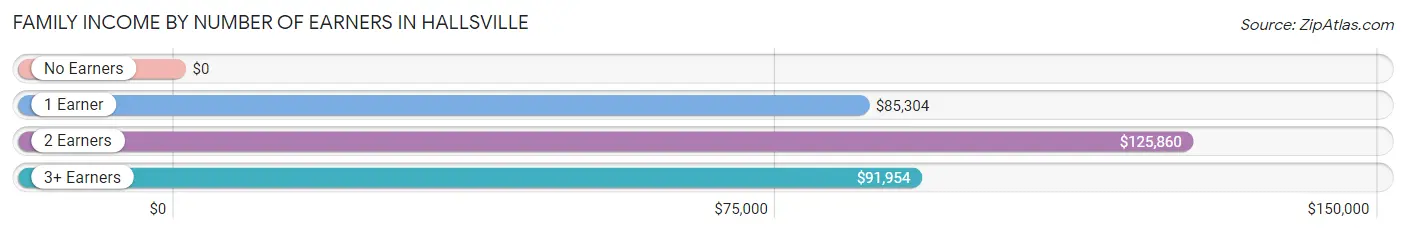
Family Income by Number of Earners in Hallsville
| Number of Earners | # Families | Median Income |
| No Earners | 140 (10.7%) | $0 |
| 1 Earner | 289 (22.0%) | $85,304 |
| 2 Earners | 599 (45.7%) | $125,860 |
| 3+ Earners | 283 (21.6%) | $91,954 |
| Total | 1,311 (100.0%) | $91,720 |
Household Income in Hallsville
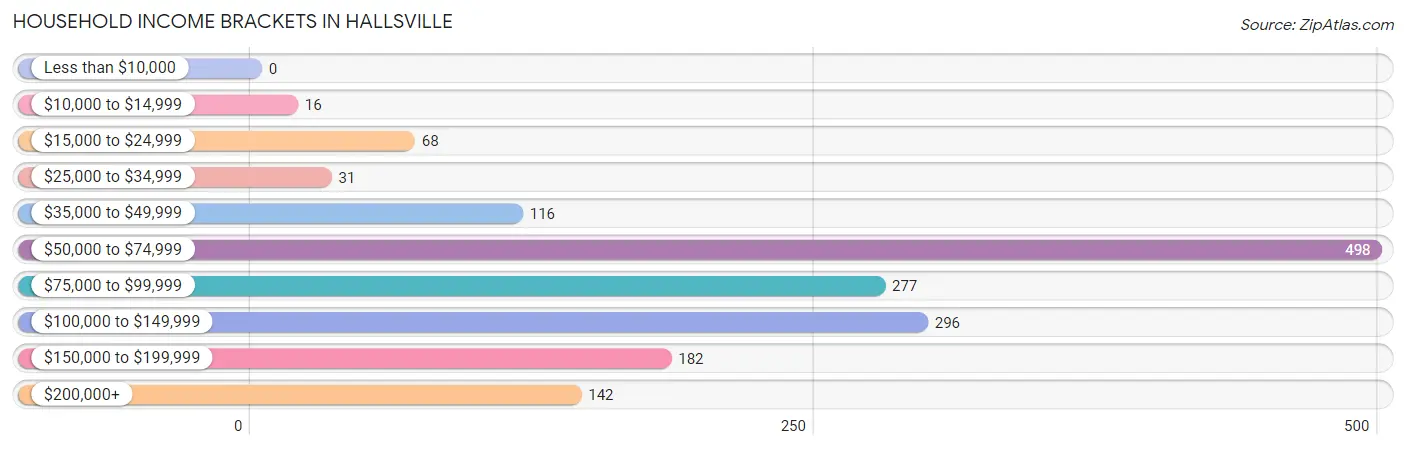
Household Income Brackets in Hallsville
With 498 households falling in the category, the $50,000 to $74,999 income range is the most frequent in Hallsville, accounting for 30.6% of all households.
| Income Bracket | # Households | % Households |
| Less than $10,000 | 0 | 0.0% |
| $10,000 to $14,999 | 16 | 1.0% |
| $15,000 to $24,999 | 68 | 4.2% |
| $25,000 to $34,999 | 31 | 1.9% |
| $35,000 to $49,999 | 116 | 7.1% |
| $50,000 to $74,999 | 498 | 30.6% |
| $75,000 to $99,999 | 277 | 17.0% |
| $100,000 to $149,999 | 296 | 18.2% |
| $150,000 to $199,999 | 182 | 11.2% |
| $200,000+ | 142 | 8.7% |
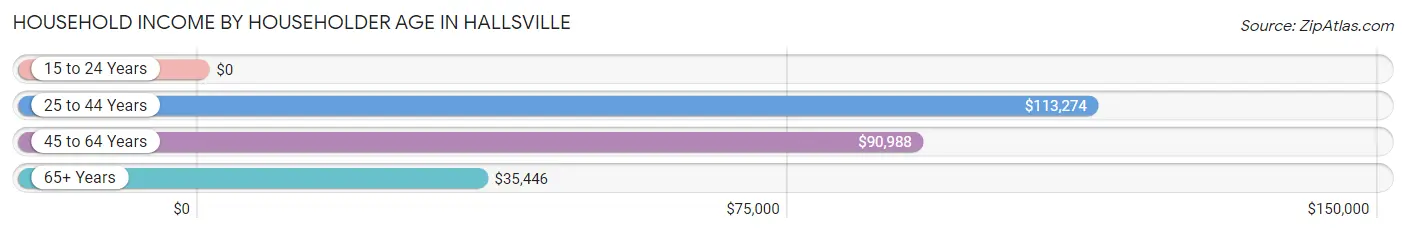
Household Income by Householder Age in Hallsville
The median household income in Hallsville is $86,757, with the highest median household income of $113,274 found in the 25 to 44 years age bracket for the primary householder. A total of 603 households (37.0%) fall into this category. Meanwhile, the 15 to 24 years age bracket for the primary householder has the lowest median household income of $0, with 96 households (5.9%) in this group.
| Income Bracket | # Households | Median Income |
| 15 to 24 Years | 96 (5.9%) | $0 |
| 25 to 44 Years | 603 (37.0%) | $113,274 |
| 45 to 64 Years | 791 (48.6%) | $90,988 |
| 65+ Years | 138 (8.5%) | $35,446 |
| Total | 1,628 (100.0%) | $86,757 |
Poverty in Hallsville
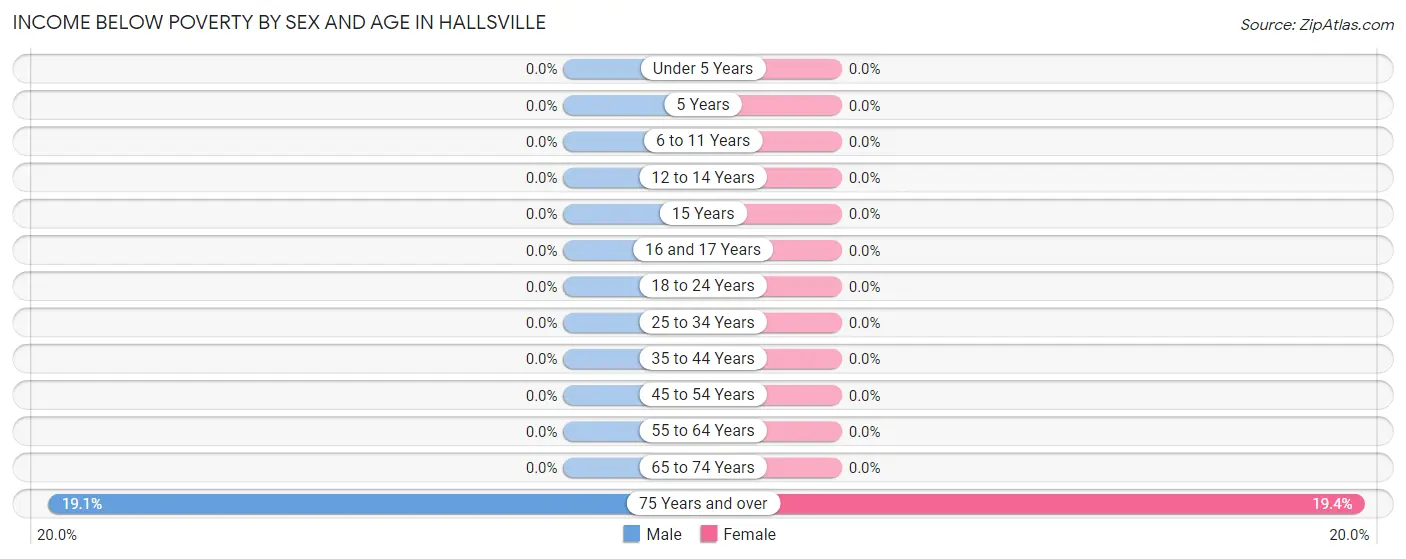
Income Below Poverty by Sex and Age in Hallsville
With 0.6% poverty level for males and 0.8% for females among the residents of Hallsville, 75 year old and over males and 75 year old and over females are the most vulnerable to poverty, with 17 males (19.1%) and 13 females (19.4%) in their respective age groups living below the poverty level.
| Age Bracket | Male | Female |
| Under 5 Years | 0 (0.0%) | 0 (0.0%) |
| 5 Years | 0 (0.0%) | 0 (0.0%) |
| 6 to 11 Years | 0 (0.0%) | 0 (0.0%) |
| 12 to 14 Years | 0 (0.0%) | 0 (0.0%) |
| 15 Years | 0 (0.0%) | 0 (0.0%) |
| 16 and 17 Years | 0 (0.0%) | 0 (0.0%) |
| 18 to 24 Years | 0 (0.0%) | 0 (0.0%) |
| 25 to 34 Years | 0 (0.0%) | 0 (0.0%) |
| 35 to 44 Years | 0 (0.0%) | 0 (0.0%) |
| 45 to 54 Years | 0 (0.0%) | 0 (0.0%) |
| 55 to 64 Years | 0 (0.0%) | 0 (0.0%) |
| 65 to 74 Years | 0 (0.0%) | 0 (0.0%) |
| 75 Years and over | 17 (19.1%) | 13 (19.4%) |
| Total | 17 (0.6%) | 13 (0.8%) |
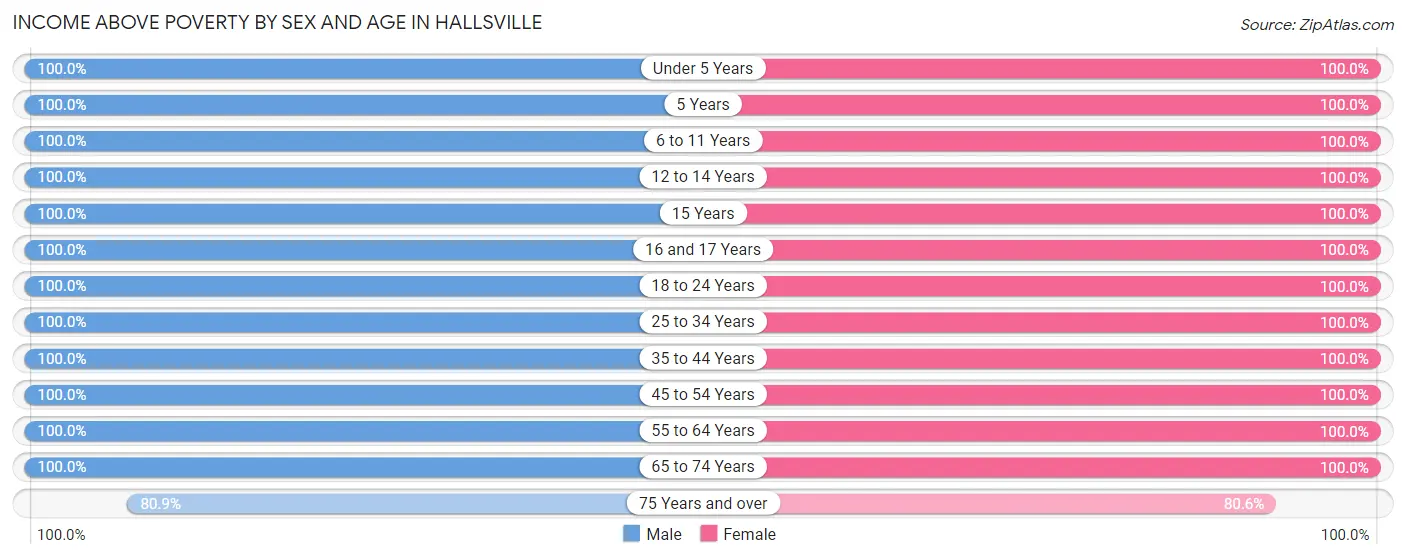
Income Above Poverty by Sex and Age in Hallsville
According to the poverty statistics in Hallsville, males aged under 5 years and females aged under 5 years are the age groups that are most secure financially, with 100.0% of males and 100.0% of females in these age groups living above the poverty line.
| Age Bracket | Male | Female |
| Under 5 Years | 178 (100.0%) | 45 (100.0%) |
| 5 Years | 21 (100.0%) | 59 (100.0%) |
| 6 to 11 Years | 189 (100.0%) | 92 (100.0%) |
| 12 to 14 Years | 215 (100.0%) | 26 (100.0%) |
| 15 Years | 32 (100.0%) | 24 (100.0%) |
| 16 and 17 Years | 101 (100.0%) | 188 (100.0%) |
| 18 to 24 Years | 472 (100.0%) | 104 (100.0%) |
| 25 to 34 Years | 305 (100.0%) | 315 (100.0%) |
| 35 to 44 Years | 182 (100.0%) | 283 (100.0%) |
| 45 to 54 Years | 505 (100.0%) | 240 (100.0%) |
| 55 to 64 Years | 390 (100.0%) | 148 (100.0%) |
| 65 to 74 Years | 16 (100.0%) | 73 (100.0%) |
| 75 Years and over | 72 (80.9%) | 54 (80.6%) |
| Total | 2,678 (99.4%) | 1,651 (99.2%) |
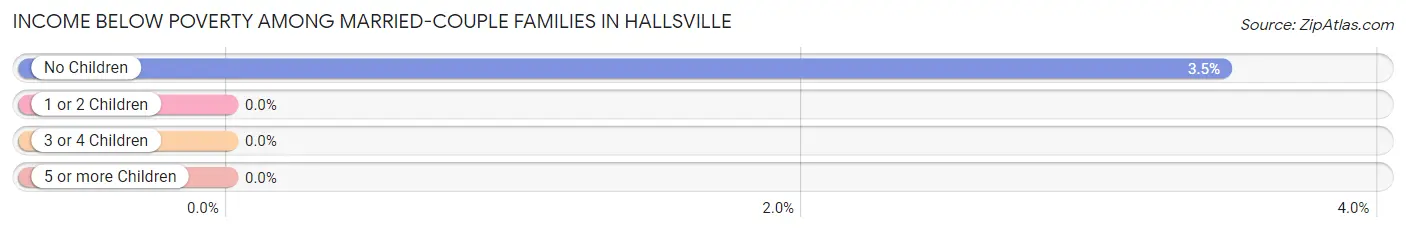
Income Below Poverty Among Married-Couple Families in Hallsville
The poverty statistics for married-couple families in Hallsville show that 1.7% or 17 of the total 1,004 families live below the poverty line. Families with no children have the highest poverty rate of 3.5%, comprising of 17 families. On the other hand, families with 1 or 2 children have the lowest poverty rate of 0.0%, which includes 0 families.
| Children | Above Poverty | Below Poverty |
| No Children | 475 (96.5%) | 17 (3.5%) |
| 1 or 2 Children | 411 (100.0%) | 0 (0.0%) |
| 3 or 4 Children | 101 (100.0%) | 0 (0.0%) |
| 5 or more Children | 0 (0.0%) | 0 (0.0%) |
| Total | 987 (98.3%) | 17 (1.7%) |
Income Below Poverty Among Single-Parent Households in Hallsville
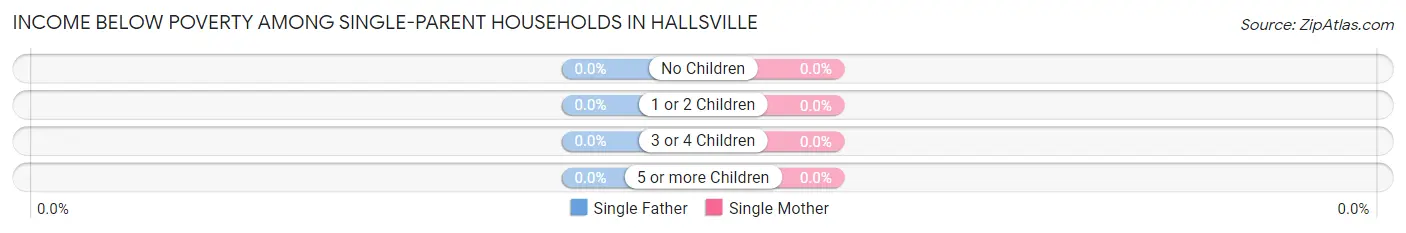
| Children | Single Father | Single Mother |
| No Children | 0 (0.0%) | 0 (0.0%) |
| 1 or 2 Children | 0 (0.0%) | 0 (0.0%) |
| 3 or 4 Children | 0 (0.0%) | 0 (0.0%) |
| 5 or more Children | 0 (0.0%) | 0 (0.0%) |
| Total | 0 (0.0%) | 0 (0.0%) |
Income Below Poverty Among Married-Couple vs Single-Parent Households in Hallsville
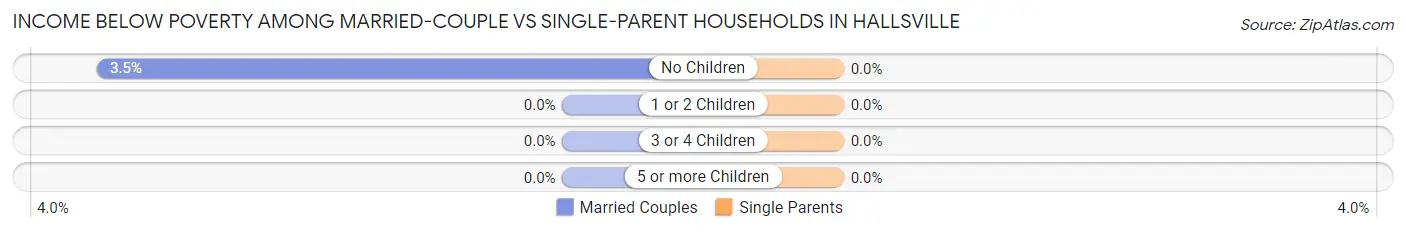
| Children | Married-Couple Families | Single-Parent Households |
| No Children | 17 (3.5%) | 0 (0.0%) |
| 1 or 2 Children | 0 (0.0%) | 0 (0.0%) |
| 3 or 4 Children | 0 (0.0%) | 0 (0.0%) |
| 5 or more Children | 0 (0.0%) | 0 (0.0%) |
| Total | 17 (1.7%) | 0 (0.0%) |
Employment Characteristics in Hallsville
Employment by Class of Employer in Hallsville
Among the 2,502 employed individuals in Hallsville, private company employees (1,734 | 69.3%), local government employees (357 | 14.3%), and not-for-profit organizations (159 | 6.4%) make up the most common classes of employment.
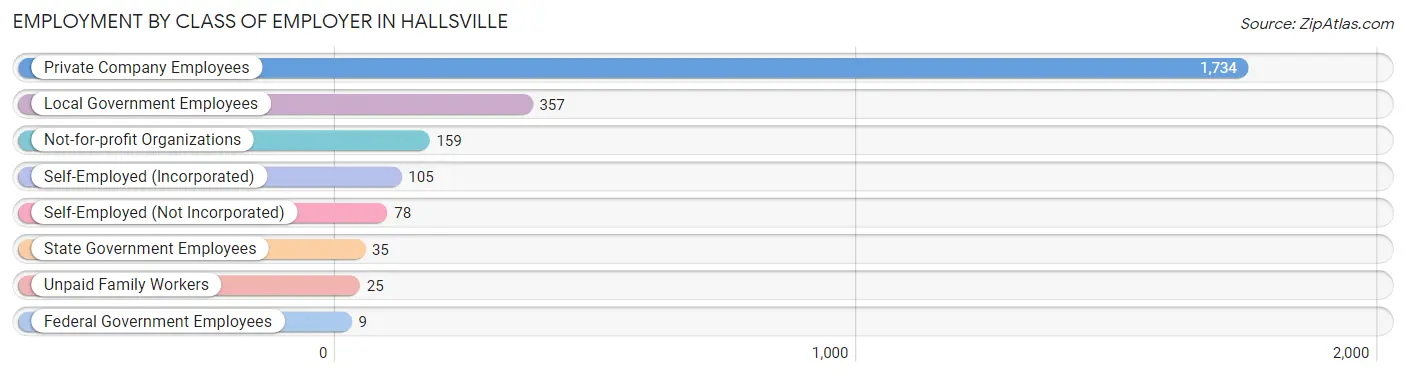
| Employer Class | # Employees | % Employees |
| Private Company Employees | 1,734 | 69.3% |
| Self-Employed (Incorporated) | 105 | 4.2% |
| Self-Employed (Not Incorporated) | 78 | 3.1% |
| Not-for-profit Organizations | 159 | 6.4% |
| Local Government Employees | 357 | 14.3% |
| State Government Employees | 35 | 1.4% |
| Federal Government Employees | 9 | 0.4% |
| Unpaid Family Workers | 25 | 1.0% |
| Total | 2,502 | 100.0% |
Employment Status by Age in Hallsville
According to the labor force statistics for Hallsville, out of the total population over 16 years of age (3,478), 73.1% or 2,542 individuals are in the labor force, with 1.5% or 38 of them unemployed. The age group with the highest labor force participation rate is 25 to 29 years, with 100.0% or 231 individuals in the labor force. Within the labor force, the 45 to 54 years age range has the highest percentage of unemployed individuals, with 5.3% or 39 of them being unemployed.
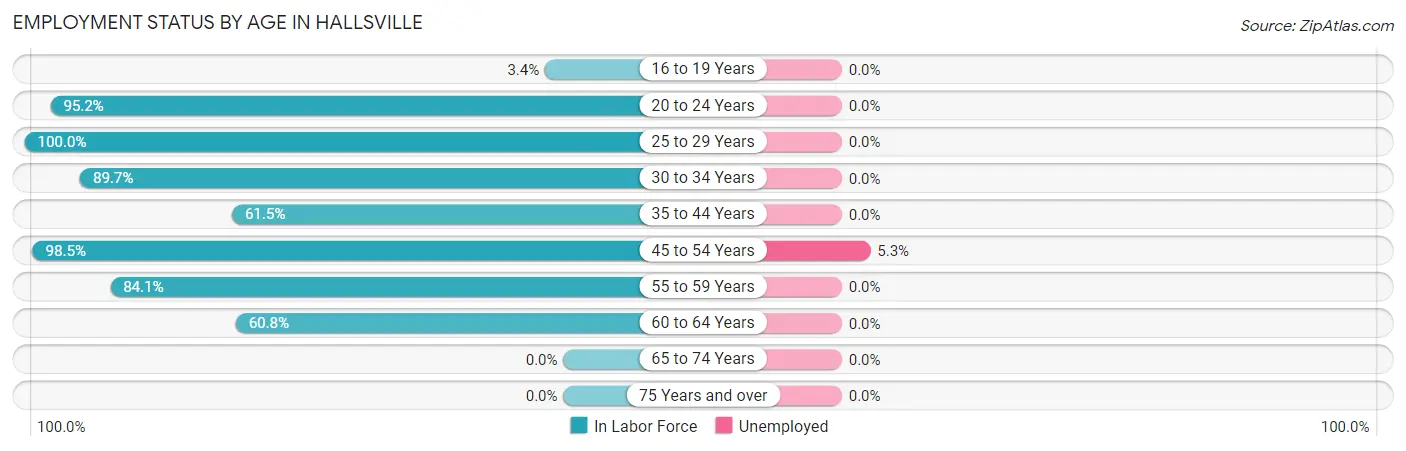
| Age Bracket | In Labor Force | Unemployed |
| 16 to 19 Years | 11 (3.4%) | 0 (0.0%) |
| 20 to 24 Years | 511 (95.2%) | 0 (0.0%) |
| 25 to 29 Years | 231 (100.0%) | 0 (0.0%) |
| 30 to 34 Years | 349 (89.7%) | 0 (0.0%) |
| 35 to 44 Years | 286 (61.5%) | 0 (0.0%) |
| 45 to 54 Years | 734 (98.5%) | 39 (5.3%) |
| 55 to 59 Years | 332 (84.1%) | 0 (0.0%) |
| 60 to 64 Years | 87 (60.8%) | 0 (0.0%) |
| 65 to 74 Years | 0 (0.0%) | 0 (0.0%) |
| 75 Years and over | 0 (0.0%) | 0 (0.0%) |
| Total | 2,542 (73.1%) | 38 (1.5%) |
Employment Status by Educational Attainment in Hallsville
According to labor force statistics for Hallsville, 85.3% of individuals (2,020) out of the total population between 25 and 64 years of age (2,368) are in the labor force, with 1.9% or 38 of them being unemployed. The group with the highest labor force participation rate are those with the educational attainment of less than high school, with 100.0% or 165 individuals in the labor force. Within the labor force, individuals with college / associate degree education have the highest percentage of unemployment, with 4.4% or 39 of them being unemployed.
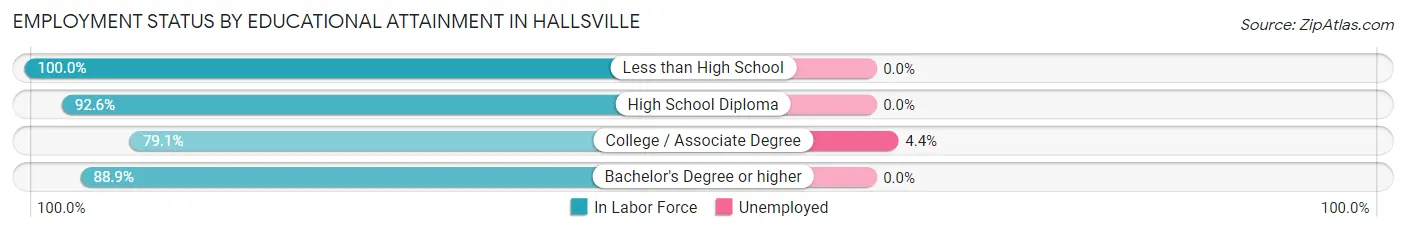
| Educational Attainment | In Labor Force | Unemployed |
| Less than High School | 165 (100.0%) | 0 (0.0%) |
| High School Diploma | 137 (92.6%) | 0 (0.0%) |
| College / Associate Degree | 889 (79.1%) | 49 (4.4%) |
| Bachelor's Degree or higher | 828 (88.9%) | 0 (0.0%) |
| Total | 2,020 (85.3%) | 45 (1.9%) |
Employment Occupations by Sex in Hallsville
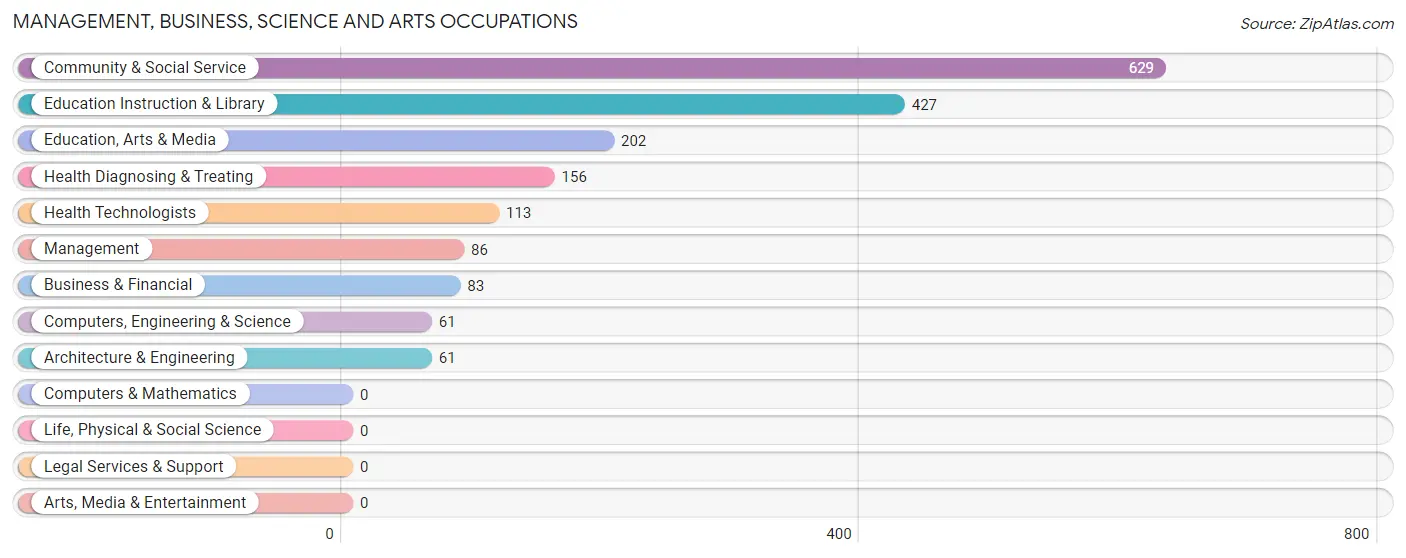
Management, Business, Science and Arts Occupations
The most common Management, Business, Science and Arts occupations in Hallsville are Community & Social Service (629 | 25.1%), Education Instruction & Library (427 | 17.1%), Education, Arts & Media (202 | 8.1%), Health Diagnosing & Treating (156 | 6.2%), and Health Technologists (113 | 4.5%).
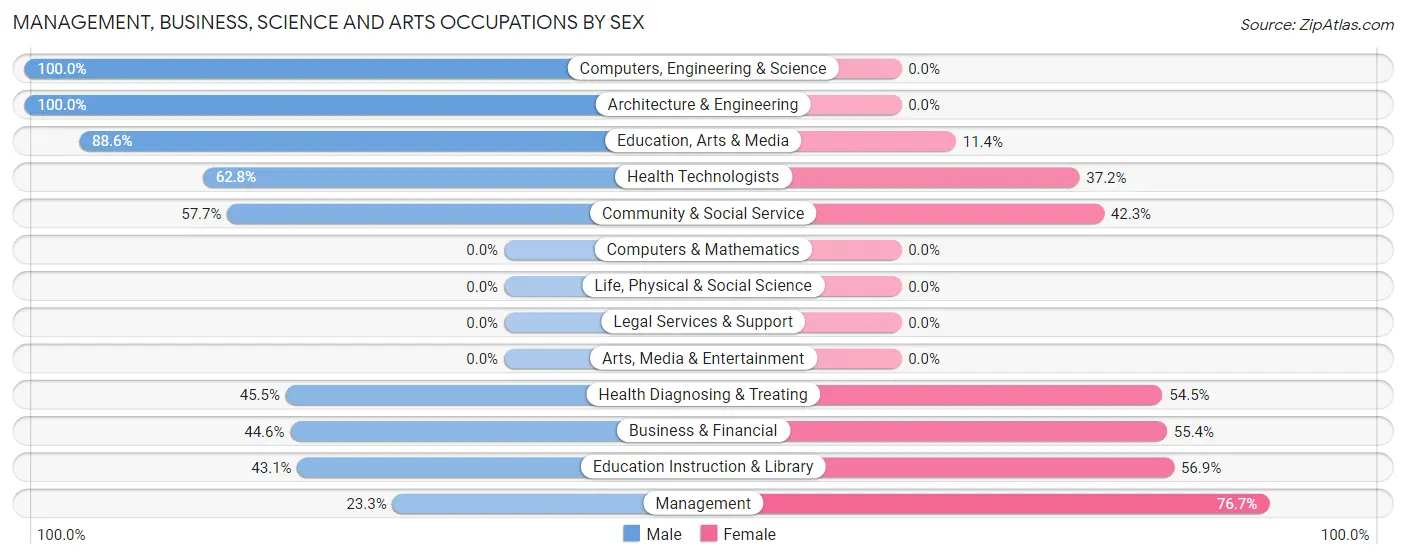
Management, Business, Science and Arts Occupations by Sex
Within the Management, Business, Science and Arts occupations in Hallsville, the most male-oriented occupations are Computers, Engineering & Science (100.0%), Architecture & Engineering (100.0%), and Education, Arts & Media (88.6%), while the most female-oriented occupations are Management (76.7%), Education Instruction & Library (56.9%), and Business & Financial (55.4%).
| Occupation | Male | Female |
| Management | 20 (23.3%) | 66 (76.7%) |
| Business & Financial | 37 (44.6%) | 46 (55.4%) |
| Computers, Engineering & Science | 61 (100.0%) | 0 (0.0%) |
| Computers & Mathematics | 0 (0.0%) | 0 (0.0%) |
| Architecture & Engineering | 61 (100.0%) | 0 (0.0%) |
| Life, Physical & Social Science | 0 (0.0%) | 0 (0.0%) |
| Community & Social Service | 363 (57.7%) | 266 (42.3%) |
| Education, Arts & Media | 179 (88.6%) | 23 (11.4%) |
| Legal Services & Support | 0 (0.0%) | 0 (0.0%) |
| Education Instruction & Library | 184 (43.1%) | 243 (56.9%) |
| Arts, Media & Entertainment | 0 (0.0%) | 0 (0.0%) |
| Health Diagnosing & Treating | 71 (45.5%) | 85 (54.5%) |
| Health Technologists | 71 (62.8%) | 42 (37.2%) |
| Total (Category) | 552 (54.4%) | 463 (45.6%) |
| Total (Overall) | 1,601 (64.0%) | 901 (36.0%) |
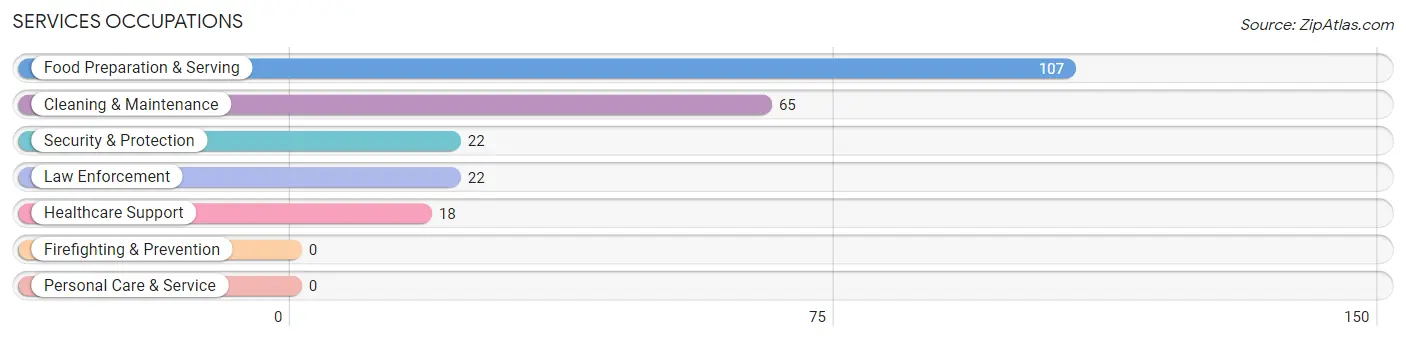
Services Occupations
The most common Services occupations in Hallsville are Food Preparation & Serving (107 | 4.3%), Cleaning & Maintenance (65 | 2.6%), Security & Protection (22 | 0.9%), Law Enforcement (22 | 0.9%), and Healthcare Support (18 | 0.7%).
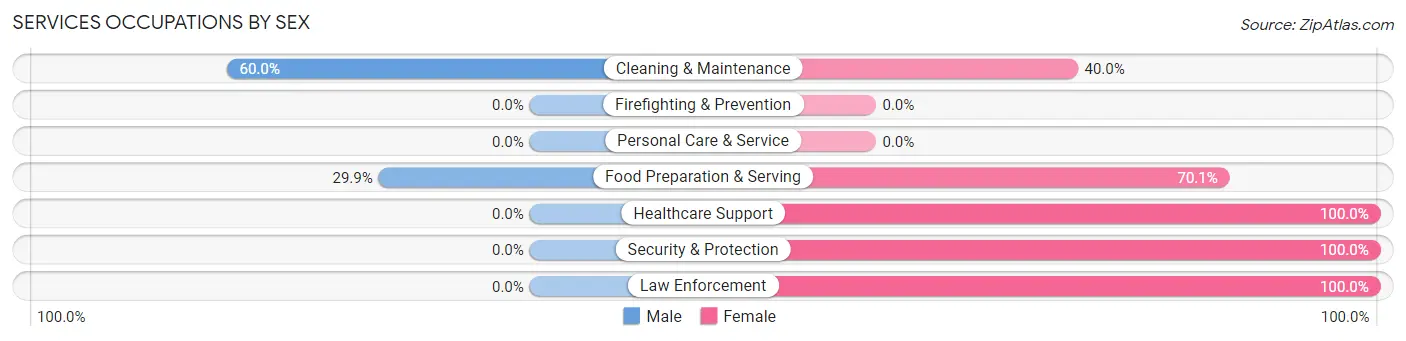
Services Occupations by Sex
Within the Services occupations in Hallsville, the most male-oriented occupations are Cleaning & Maintenance (60.0%), and Food Preparation & Serving (29.9%), while the most female-oriented occupations are Healthcare Support (100.0%), Security & Protection (100.0%), and Law Enforcement (100.0%).
| Occupation | Male | Female |
| Healthcare Support | 0 (0.0%) | 18 (100.0%) |
| Security & Protection | 0 (0.0%) | 22 (100.0%) |
| Firefighting & Prevention | 0 (0.0%) | 0 (0.0%) |
| Law Enforcement | 0 (0.0%) | 22 (100.0%) |
| Food Preparation & Serving | 32 (29.9%) | 75 (70.1%) |
| Cleaning & Maintenance | 39 (60.0%) | 26 (40.0%) |
| Personal Care & Service | 0 (0.0%) | 0 (0.0%) |
| Total (Category) | 71 (33.5%) | 141 (66.5%) |
| Total (Overall) | 1,601 (64.0%) | 901 (36.0%) |
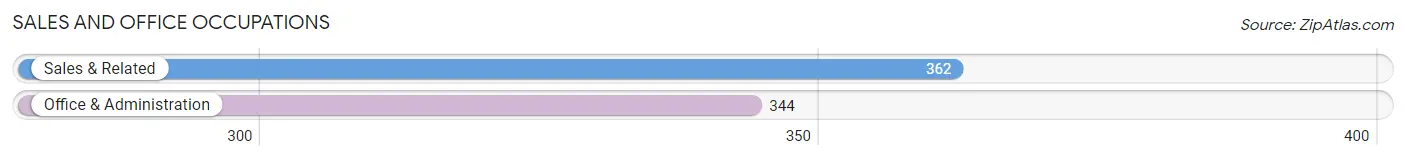
Sales and Office Occupations
The most common Sales and Office occupations in Hallsville are Sales & Related (362 | 14.5%), and Office & Administration (344 | 13.8%).
Sales and Office Occupations by Sex
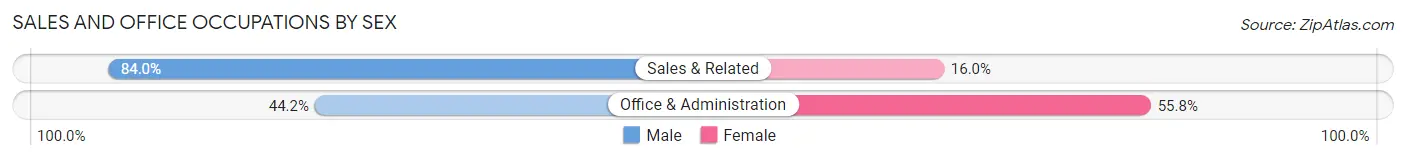
| Occupation | Male | Female |
| Sales & Related | 304 (84.0%) | 58 (16.0%) |
| Office & Administration | 152 (44.2%) | 192 (55.8%) |
| Total (Category) | 456 (64.6%) | 250 (35.4%) |
| Total (Overall) | 1,601 (64.0%) | 901 (36.0%) |
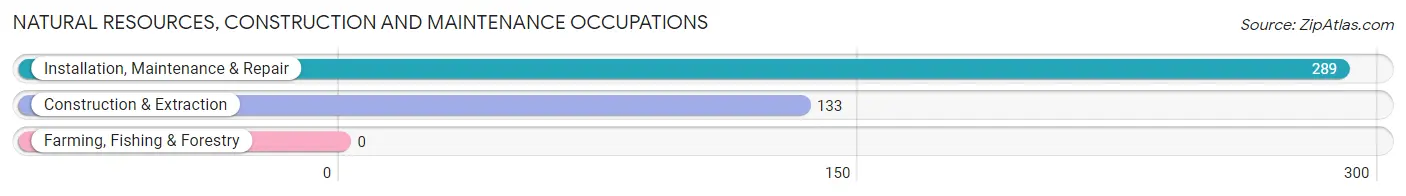
Natural Resources, Construction and Maintenance Occupations
The most common Natural Resources, Construction and Maintenance occupations in Hallsville are Installation, Maintenance & Repair (289 | 11.6%), and Construction & Extraction (133 | 5.3%).
Natural Resources, Construction and Maintenance Occupations by Sex
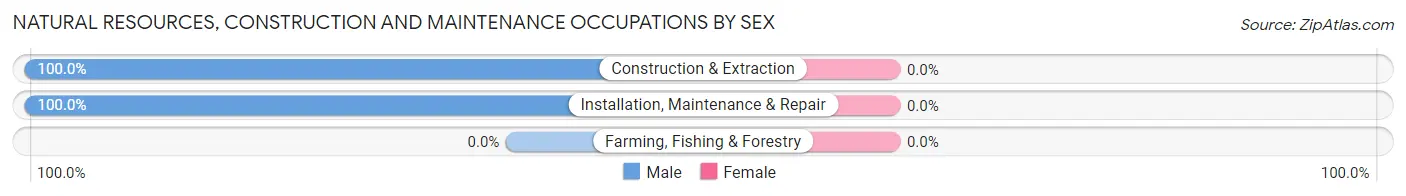
| Occupation | Male | Female |
| Farming, Fishing & Forestry | 0 (0.0%) | 0 (0.0%) |
| Construction & Extraction | 133 (100.0%) | 0 (0.0%) |
| Installation, Maintenance & Repair | 289 (100.0%) | 0 (0.0%) |
| Total (Category) | 422 (100.0%) | 0 (0.0%) |
| Total (Overall) | 1,601 (64.0%) | 901 (36.0%) |
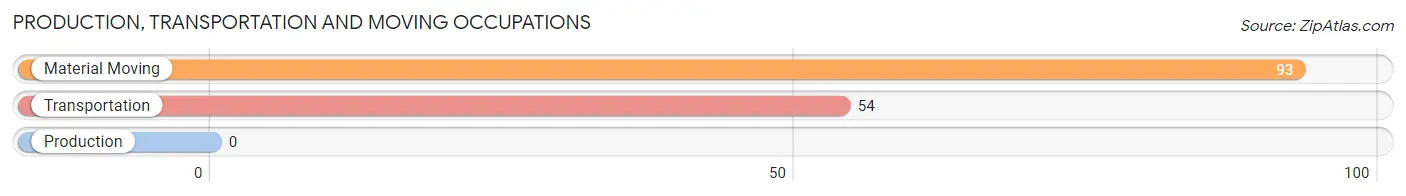
Production, Transportation and Moving Occupations
The most common Production, Transportation and Moving occupations in Hallsville are Material Moving (93 | 3.7%), and Transportation (54 | 2.2%).
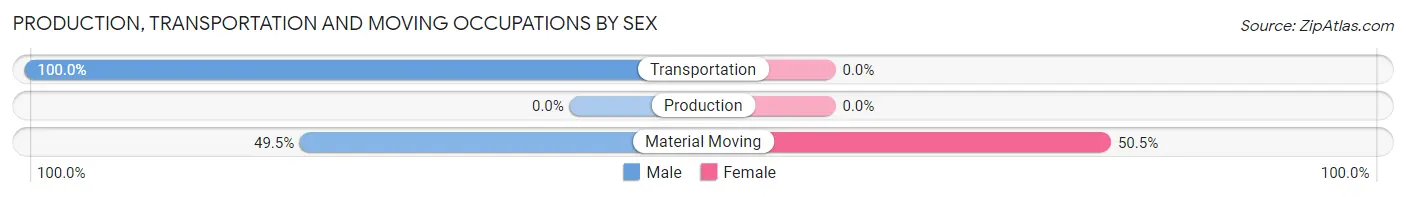
Production, Transportation and Moving Occupations by Sex
| Occupation | Male | Female |
| Production | 0 (0.0%) | 0 (0.0%) |
| Transportation | 54 (100.0%) | 0 (0.0%) |
| Material Moving | 46 (49.5%) | 47 (50.5%) |
| Total (Category) | 100 (68.0%) | 47 (32.0%) |
| Total (Overall) | 1,601 (64.0%) | 901 (36.0%) |
Employment Industries by Sex in Hallsville
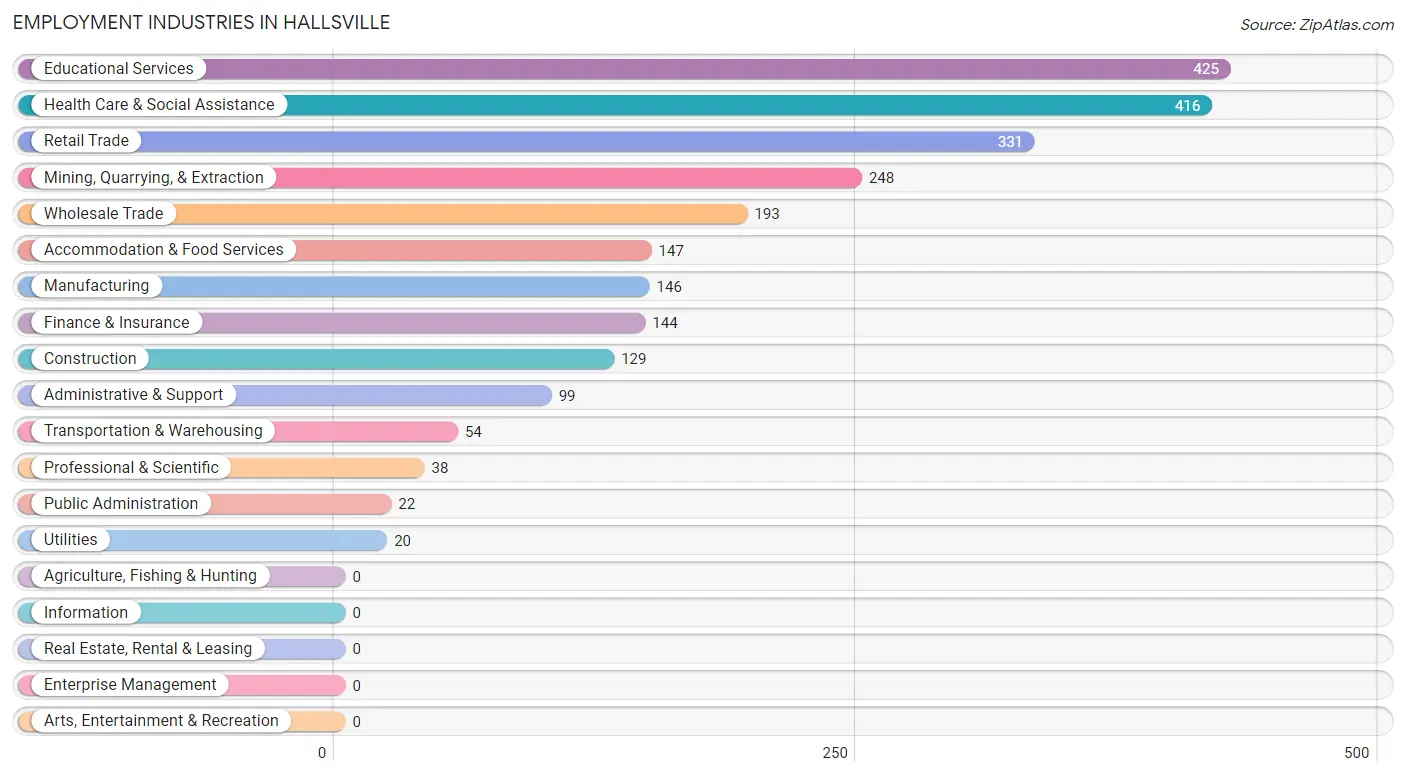
Employment Industries in Hallsville
The major employment industries in Hallsville include Educational Services (425 | 17.0%), Health Care & Social Assistance (416 | 16.6%), Retail Trade (331 | 13.2%), Mining, Quarrying, & Extraction (248 | 9.9%), and Wholesale Trade (193 | 7.7%).
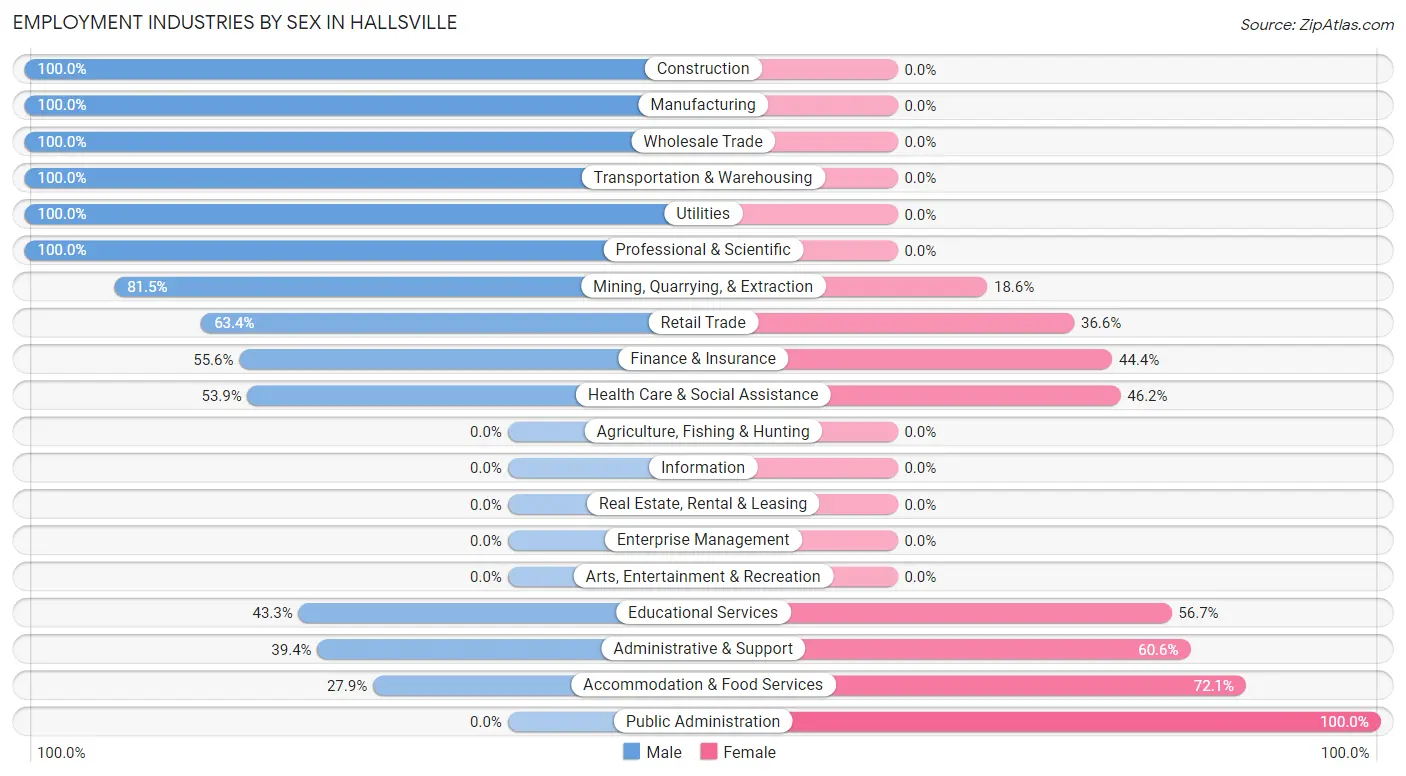
Employment Industries by Sex in Hallsville
The Hallsville industries that see more men than women are Construction (100.0%), Manufacturing (100.0%), and Wholesale Trade (100.0%), whereas the industries that tend to have a higher number of women are Public Administration (100.0%), Accommodation & Food Services (72.1%), and Administrative & Support (60.6%).
| Industry | Male | Female |
| Agriculture, Fishing & Hunting | 0 (0.0%) | 0 (0.0%) |
| Mining, Quarrying, & Extraction | 202 (81.5%) | 46 (18.5%) |
| Construction | 129 (100.0%) | 0 (0.0%) |
| Manufacturing | 146 (100.0%) | 0 (0.0%) |
| Wholesale Trade | 193 (100.0%) | 0 (0.0%) |
| Retail Trade | 210 (63.4%) | 121 (36.6%) |
| Transportation & Warehousing | 54 (100.0%) | 0 (0.0%) |
| Utilities | 20 (100.0%) | 0 (0.0%) |
| Information | 0 (0.0%) | 0 (0.0%) |
| Finance & Insurance | 80 (55.6%) | 64 (44.4%) |
| Real Estate, Rental & Leasing | 0 (0.0%) | 0 (0.0%) |
| Professional & Scientific | 38 (100.0%) | 0 (0.0%) |
| Enterprise Management | 0 (0.0%) | 0 (0.0%) |
| Administrative & Support | 39 (39.4%) | 60 (60.6%) |
| Educational Services | 184 (43.3%) | 241 (56.7%) |
| Health Care & Social Assistance | 224 (53.8%) | 192 (46.2%) |
| Arts, Entertainment & Recreation | 0 (0.0%) | 0 (0.0%) |
| Accommodation & Food Services | 41 (27.9%) | 106 (72.1%) |
| Public Administration | 0 (0.0%) | 22 (100.0%) |
| Total | 1,601 (64.0%) | 901 (36.0%) |
Education in Hallsville
School Enrollment in Hallsville
The most common levels of schooling among the 1,335 students in Hallsville are high school (384 | 28.8%), college / undergraduate (349 | 26.1%), and middle school (294 | 22.0%).
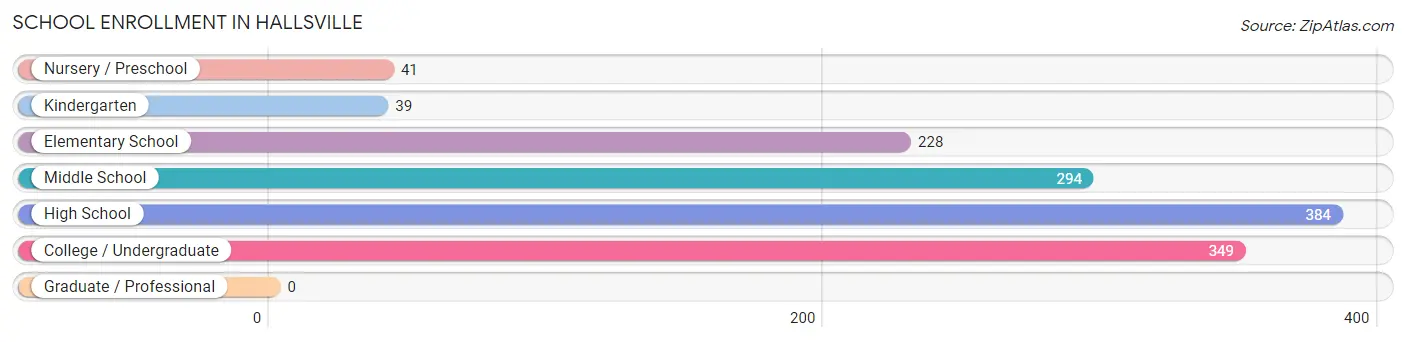
| School Level | # Students | % Students |
| Nursery / Preschool | 41 | 3.1% |
| Kindergarten | 39 | 2.9% |
| Elementary School | 228 | 17.1% |
| Middle School | 294 | 22.0% |
| High School | 384 | 28.8% |
| College / Undergraduate | 349 | 26.1% |
| Graduate / Professional | 0 | 0.0% |
| Total | 1,335 | 100.0% |
School Enrollment by Age by Funding Source in Hallsville
Out of a total of 1,335 students who are enrolled in schools in Hallsville, 174 (13.0%) attend a private institution, while the remaining 1,161 (87.0%) are enrolled in public schools. The age group of 35 years and over has the highest likelihood of being enrolled in private schools, with 59 (100.0% in the age bracket) enrolled. Conversely, the age group of 5 to 9 year old has the lowest likelihood of being enrolled in a private school, with 308 (100.0% in the age bracket) attending a public institution.
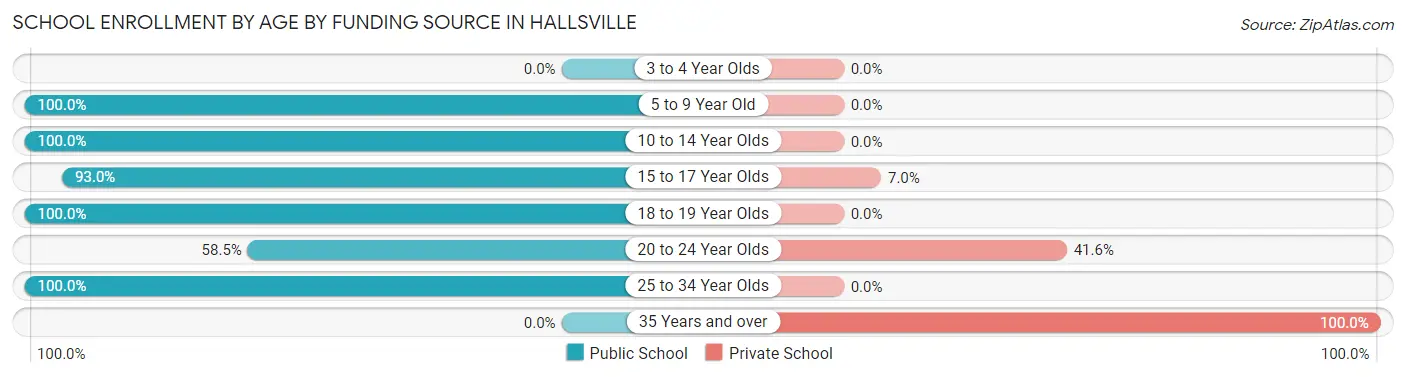
| Age Bracket | Public School | Private School |
| 3 to 4 Year Olds | 0 (0.0%) | 0 (0.0%) |
| 5 to 9 Year Old | 308 (100.0%) | 0 (0.0%) |
| 10 to 14 Year Olds | 294 (100.0%) | 0 (0.0%) |
| 15 to 17 Year Olds | 321 (93.0%) | 24 (7.0%) |
| 18 to 19 Year Olds | 39 (100.0%) | 0 (0.0%) |
| 20 to 24 Year Olds | 128 (58.5%) | 91 (41.5%) |
| 25 to 34 Year Olds | 71 (100.0%) | 0 (0.0%) |
| 35 Years and over | 0 (0.0%) | 59 (100.0%) |
| Total | 1,161 (87.0%) | 174 (13.0%) |
Educational Attainment by Field of Study in Hallsville
Business (232 | 21.6%), liberal arts & history (132 | 12.3%), education (110 | 10.2%), social sciences (109 | 10.1%), and science & technology (98 | 9.1%) are the most common fields of study among 1,076 individuals in Hallsville who have obtained a bachelor's degree or higher.
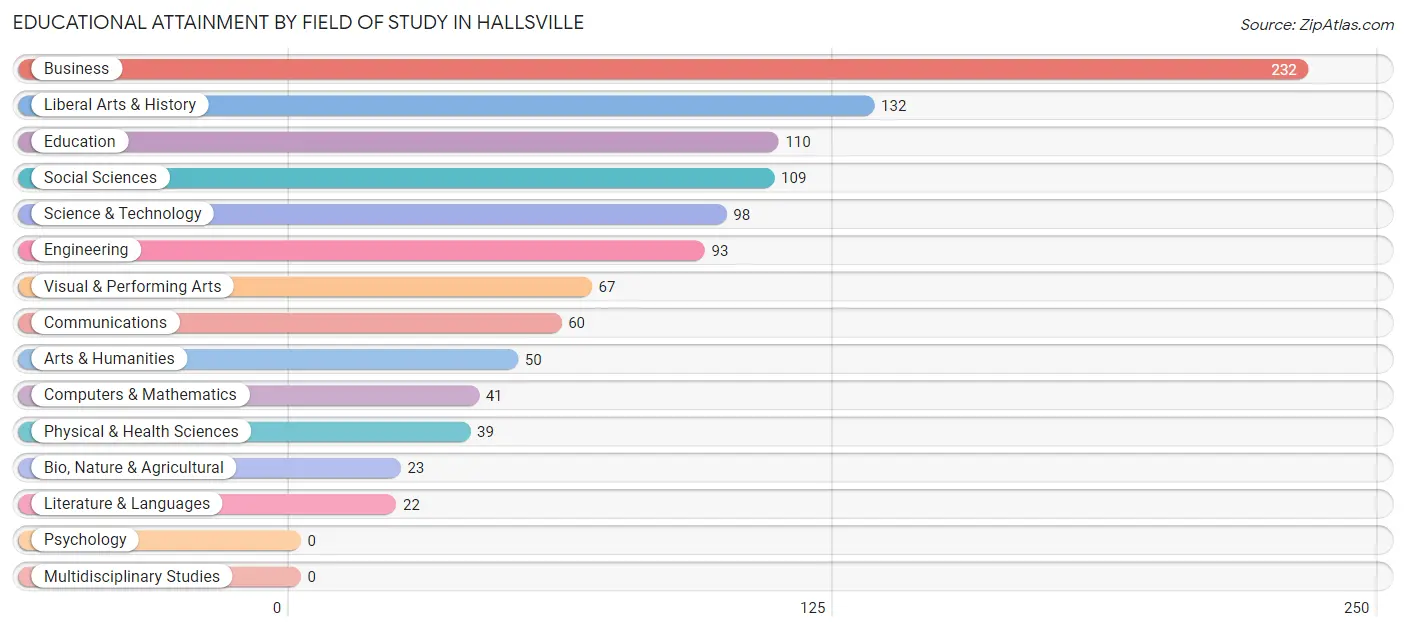
| Field of Study | # Graduates | % Graduates |
| Computers & Mathematics | 41 | 3.8% |
| Bio, Nature & Agricultural | 23 | 2.1% |
| Physical & Health Sciences | 39 | 3.6% |
| Psychology | 0 | 0.0% |
| Social Sciences | 109 | 10.1% |
| Engineering | 93 | 8.6% |
| Multidisciplinary Studies | 0 | 0.0% |
| Science & Technology | 98 | 9.1% |
| Business | 232 | 21.6% |
| Education | 110 | 10.2% |
| Literature & Languages | 22 | 2.0% |
| Liberal Arts & History | 132 | 12.3% |
| Visual & Performing Arts | 67 | 6.2% |
| Communications | 60 | 5.6% |
| Arts & Humanities | 50 | 4.6% |
| Total | 1,076 | 100.0% |
Transportation & Commute in Hallsville
Vehicle Availability by Sex in Hallsville
The most prevalent vehicle ownership categories in Hallsville are males with 2 vehicles (1,134, accounting for 70.8%) and females with 2 vehicles (509, making up 125.9%).
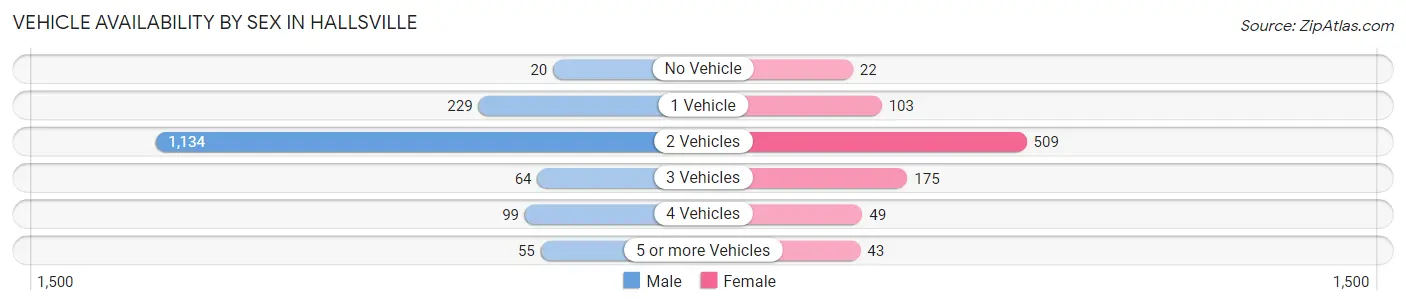
| Vehicles Available | Male | Female |
| No Vehicle | 20 (1.3%) | 22 (2.4%) |
| 1 Vehicle | 229 (14.3%) | 103 (11.4%) |
| 2 Vehicles | 1,134 (70.8%) | 509 (56.5%) |
| 3 Vehicles | 64 (4.0%) | 175 (19.4%) |
| 4 Vehicles | 99 (6.2%) | 49 (5.4%) |
| 5 or more Vehicles | 55 (3.4%) | 43 (4.8%) |
| Total | 1,601 (100.0%) | 901 (100.0%) |
Commute Time in Hallsville
The most frequently occuring commute durations in Hallsville are 15 to 19 minutes (737 commuters, 32.8%), 20 to 24 minutes (496 commuters, 22.1%), and 5 to 9 minutes (365 commuters, 16.2%).
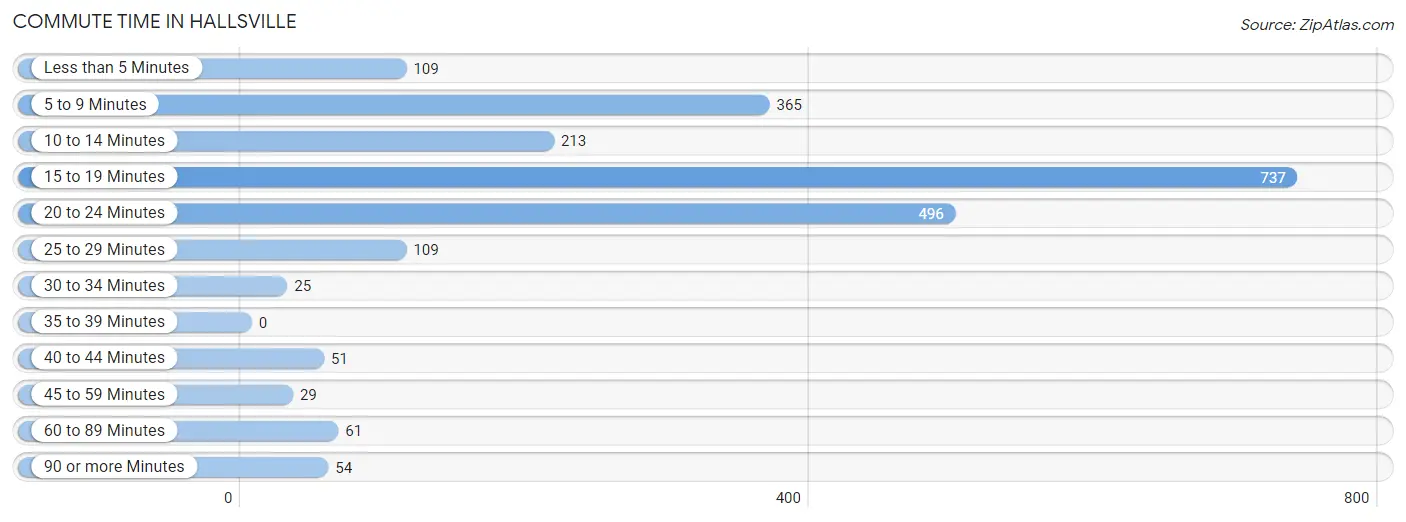
| Commute Time | # Commuters | % Commuters |
| Less than 5 Minutes | 109 | 4.9% |
| 5 to 9 Minutes | 365 | 16.2% |
| 10 to 14 Minutes | 213 | 9.5% |
| 15 to 19 Minutes | 737 | 32.8% |
| 20 to 24 Minutes | 496 | 22.1% |
| 25 to 29 Minutes | 109 | 4.9% |
| 30 to 34 Minutes | 25 | 1.1% |
| 35 to 39 Minutes | 0 | 0.0% |
| 40 to 44 Minutes | 51 | 2.3% |
| 45 to 59 Minutes | 29 | 1.3% |
| 60 to 89 Minutes | 61 | 2.7% |
| 90 or more Minutes | 54 | 2.4% |
Commute Time by Sex in Hallsville
The most common commute times in Hallsville are 15 to 19 minutes (568 commuters, 37.9%) for males and 20 to 24 minutes (220 commuters, 29.3%) for females.
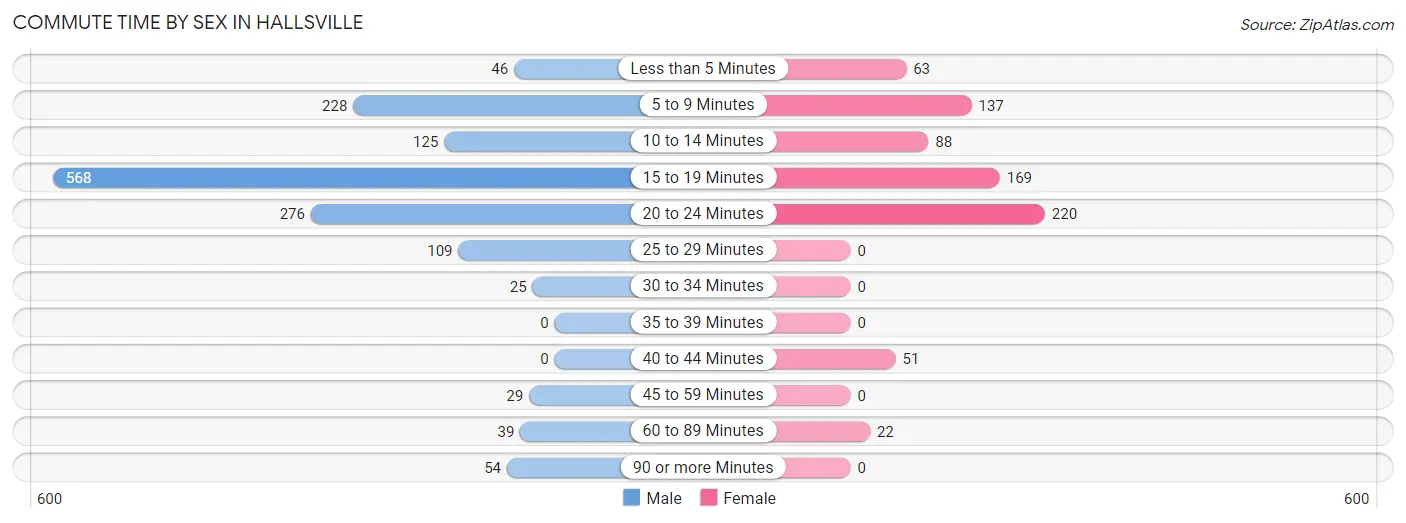
| Commute Time | Male | Female |
| Less than 5 Minutes | 46 (3.1%) | 63 (8.4%) |
| 5 to 9 Minutes | 228 (15.2%) | 137 (18.3%) |
| 10 to 14 Minutes | 125 (8.3%) | 88 (11.7%) |
| 15 to 19 Minutes | 568 (37.9%) | 169 (22.5%) |
| 20 to 24 Minutes | 276 (18.4%) | 220 (29.3%) |
| 25 to 29 Minutes | 109 (7.3%) | 0 (0.0%) |
| 30 to 34 Minutes | 25 (1.7%) | 0 (0.0%) |
| 35 to 39 Minutes | 0 (0.0%) | 0 (0.0%) |
| 40 to 44 Minutes | 0 (0.0%) | 51 (6.8%) |
| 45 to 59 Minutes | 29 (1.9%) | 0 (0.0%) |
| 60 to 89 Minutes | 39 (2.6%) | 22 (2.9%) |
| 90 or more Minutes | 54 (3.6%) | 0 (0.0%) |
Time of Departure to Work by Sex in Hallsville
The most frequent times of departure to work in Hallsville are 7:00 AM to 7:29 AM (422, 28.1%) for males and 7:00 AM to 7:29 AM (185, 24.7%) for females.
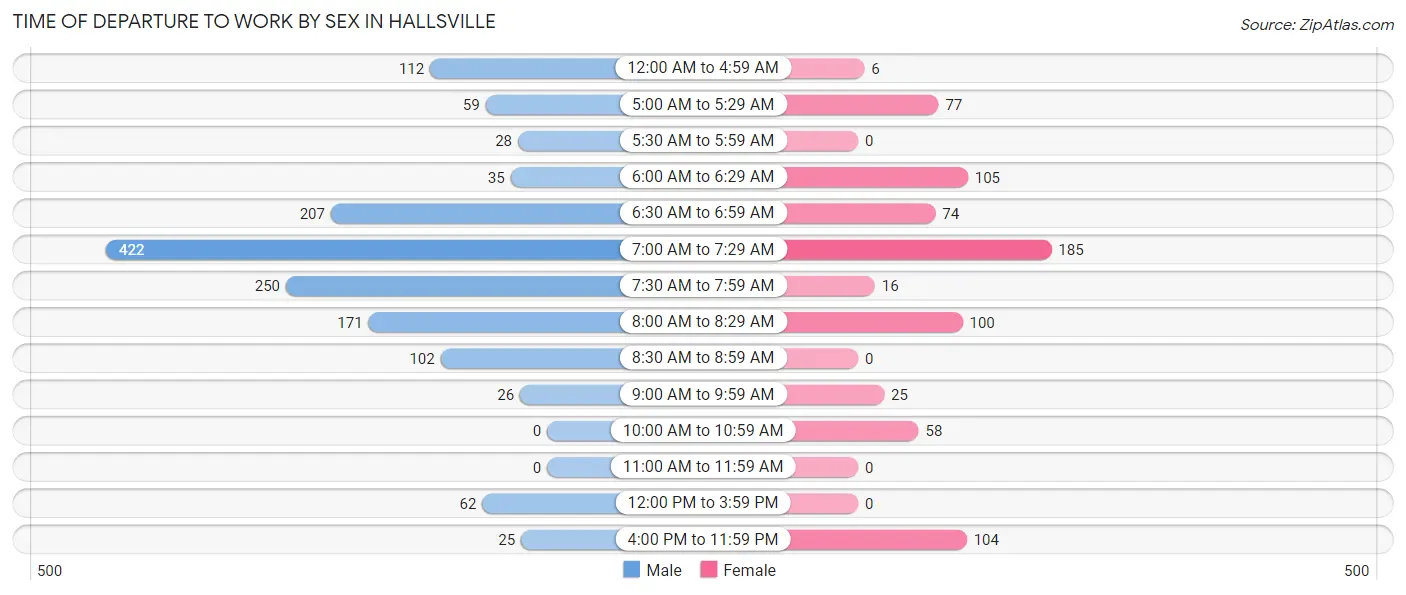
| Time of Departure | Male | Female |
| 12:00 AM to 4:59 AM | 112 (7.5%) | 6 (0.8%) |
| 5:00 AM to 5:29 AM | 59 (3.9%) | 77 (10.3%) |
| 5:30 AM to 5:59 AM | 28 (1.9%) | 0 (0.0%) |
| 6:00 AM to 6:29 AM | 35 (2.3%) | 105 (14.0%) |
| 6:30 AM to 6:59 AM | 207 (13.8%) | 74 (9.9%) |
| 7:00 AM to 7:29 AM | 422 (28.1%) | 185 (24.7%) |
| 7:30 AM to 7:59 AM | 250 (16.7%) | 16 (2.1%) |
| 8:00 AM to 8:29 AM | 171 (11.4%) | 100 (13.3%) |
| 8:30 AM to 8:59 AM | 102 (6.8%) | 0 (0.0%) |
| 9:00 AM to 9:59 AM | 26 (1.7%) | 25 (3.3%) |
| 10:00 AM to 10:59 AM | 0 (0.0%) | 58 (7.7%) |
| 11:00 AM to 11:59 AM | 0 (0.0%) | 0 (0.0%) |
| 12:00 PM to 3:59 PM | 62 (4.1%) | 0 (0.0%) |
| 4:00 PM to 11:59 PM | 25 (1.7%) | 104 (13.9%) |
| Total | 1,499 (100.0%) | 750 (100.0%) |
Housing Occupancy in Hallsville
Occupancy by Ownership in Hallsville
Of the total 1,628 dwellings in Hallsville, owner-occupied units account for 912 (56.0%), while renter-occupied units make up 716 (44.0%).
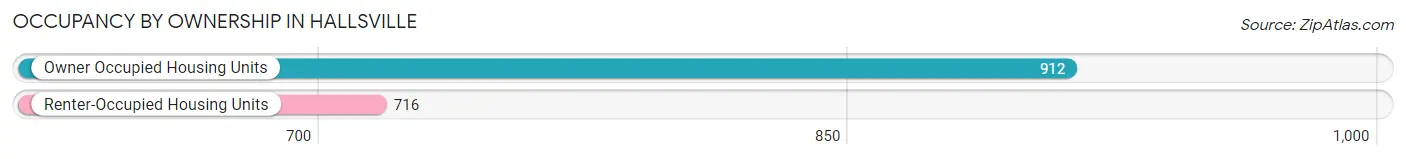
| Occupancy | # Housing Units | % Housing Units |
| Owner Occupied Housing Units | 912 | 56.0% |
| Renter-Occupied Housing Units | 716 | 44.0% |
| Total Occupied Housing Units | 1,628 | 100.0% |
Occupancy by Household Size in Hallsville
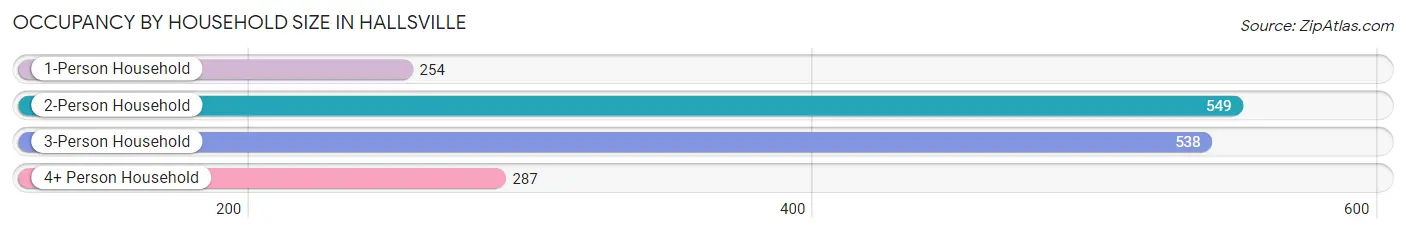
| Household Size | # Housing Units | % Housing Units |
| 1-Person Household | 254 | 15.6% |
| 2-Person Household | 549 | 33.7% |
| 3-Person Household | 538 | 33.1% |
| 4+ Person Household | 287 | 17.6% |
| Total Housing Units | 1,628 | 100.0% |
Occupancy by Ownership by Household Size in Hallsville
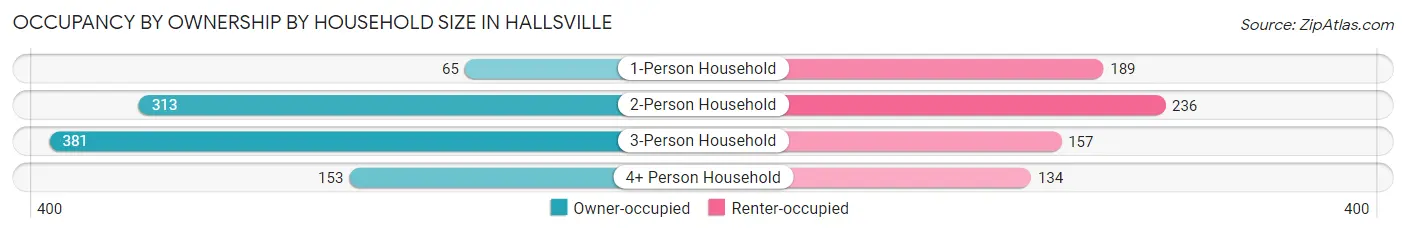
| Household Size | Owner-occupied | Renter-occupied |
| 1-Person Household | 65 (25.6%) | 189 (74.4%) |
| 2-Person Household | 313 (57.0%) | 236 (43.0%) |
| 3-Person Household | 381 (70.8%) | 157 (29.2%) |
| 4+ Person Household | 153 (53.3%) | 134 (46.7%) |
| Total Housing Units | 912 (56.0%) | 716 (44.0%) |
Occupancy by Educational Attainment in Hallsville
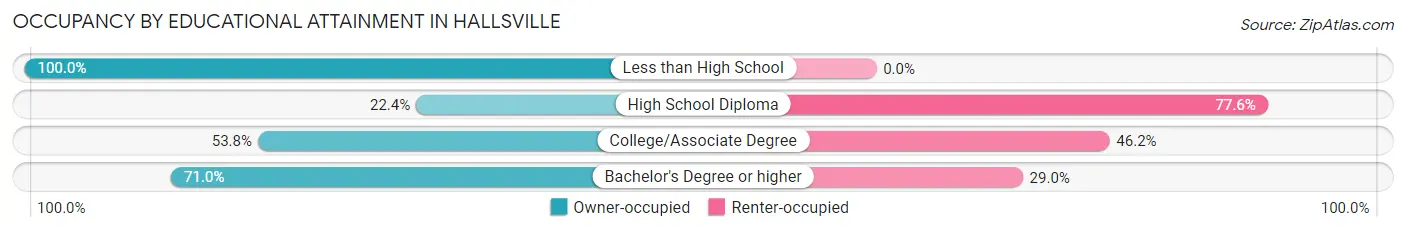
| Household Size | Owner-occupied | Renter-occupied |
| Less than High School | 53 (100.0%) | 0 (0.0%) |
| High School Diploma | 58 (22.4%) | 201 (77.6%) |
| College/Associate Degree | 415 (53.8%) | 357 (46.2%) |
| Bachelor's Degree or higher | 386 (71.0%) | 158 (29.0%) |
Occupancy by Age of Householder in Hallsville
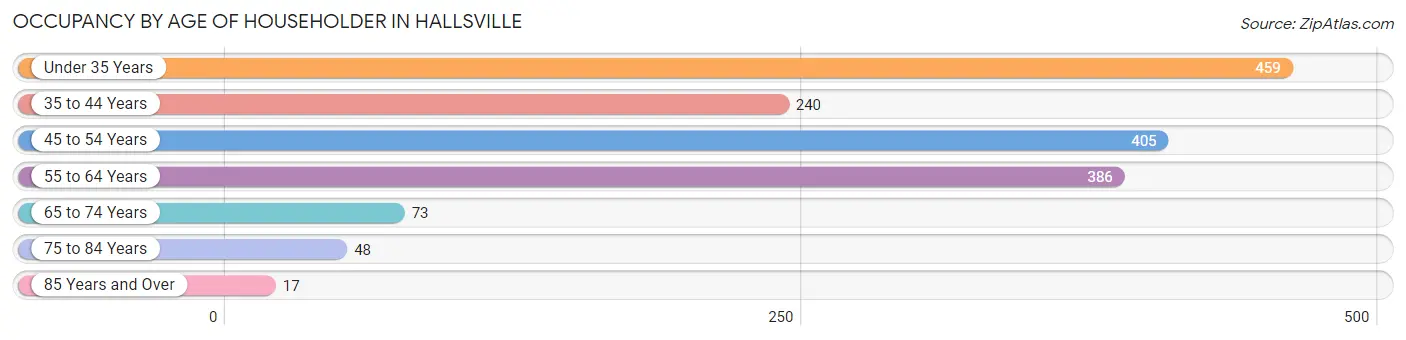
| Age Bracket | # Households | % Households |
| Under 35 Years | 459 | 28.2% |
| 35 to 44 Years | 240 | 14.7% |
| 45 to 54 Years | 405 | 24.9% |
| 55 to 64 Years | 386 | 23.7% |
| 65 to 74 Years | 73 | 4.5% |
| 75 to 84 Years | 48 | 2.9% |
| 85 Years and Over | 17 | 1.0% |
| Total | 1,628 | 100.0% |
Housing Finances in Hallsville
Median Income by Occupancy in Hallsville
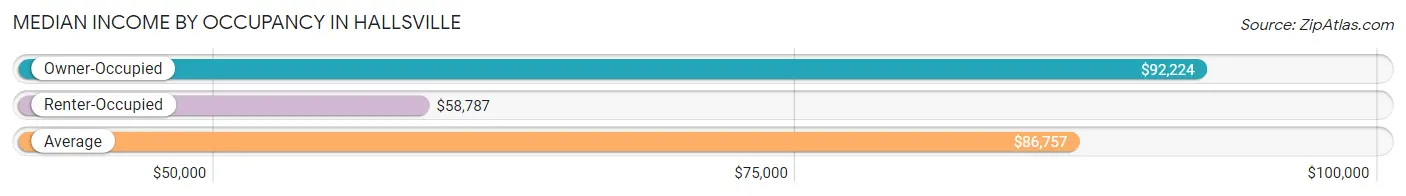
| Occupancy Type | # Households | Median Income |
| Owner-Occupied | 912 (56.0%) | $92,224 |
| Renter-Occupied | 716 (44.0%) | $58,787 |
| Average | 1,628 (100.0%) | $86,757 |
Occupancy by Householder Income Bracket in Hallsville
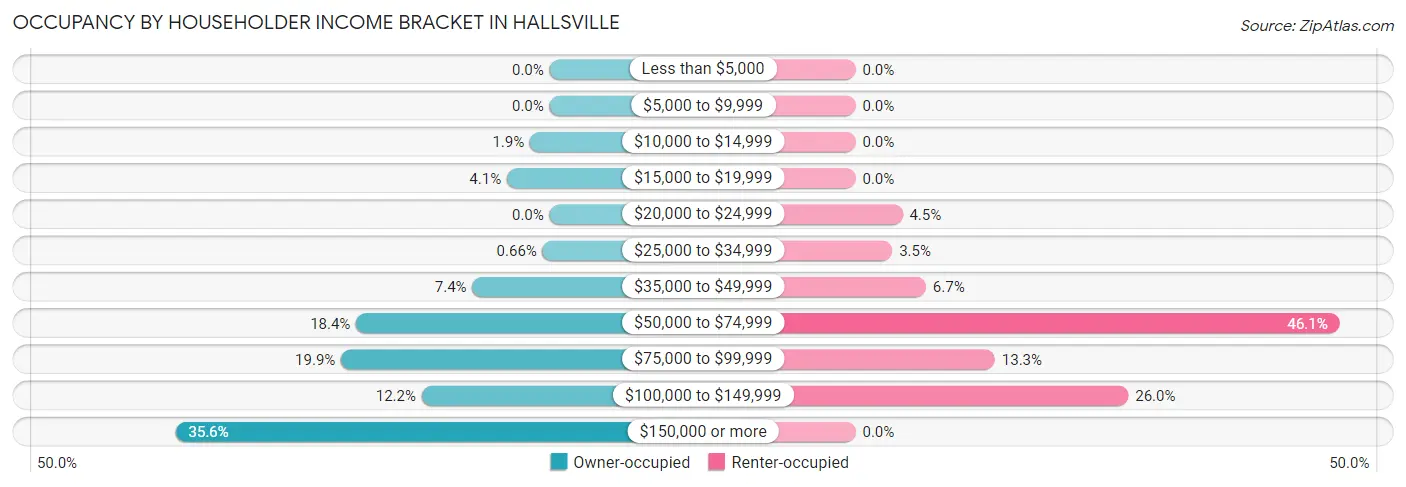
| Income Bracket | Owner-occupied | Renter-occupied |
| Less than $5,000 | 0 (0.0%) | 0 (0.0%) |
| $5,000 to $9,999 | 0 (0.0%) | 0 (0.0%) |
| $10,000 to $14,999 | 17 (1.9%) | 0 (0.0%) |
| $15,000 to $19,999 | 37 (4.1%) | 0 (0.0%) |
| $20,000 to $24,999 | 0 (0.0%) | 32 (4.5%) |
| $25,000 to $34,999 | 6 (0.7%) | 25 (3.5%) |
| $35,000 to $49,999 | 67 (7.3%) | 48 (6.7%) |
| $50,000 to $74,999 | 168 (18.4%) | 330 (46.1%) |
| $75,000 to $99,999 | 181 (19.9%) | 95 (13.3%) |
| $100,000 to $149,999 | 111 (12.2%) | 186 (26.0%) |
| $150,000 or more | 325 (35.6%) | 0 (0.0%) |
| Total | 912 (100.0%) | 716 (100.0%) |
Monthly Housing Cost Tiers in Hallsville
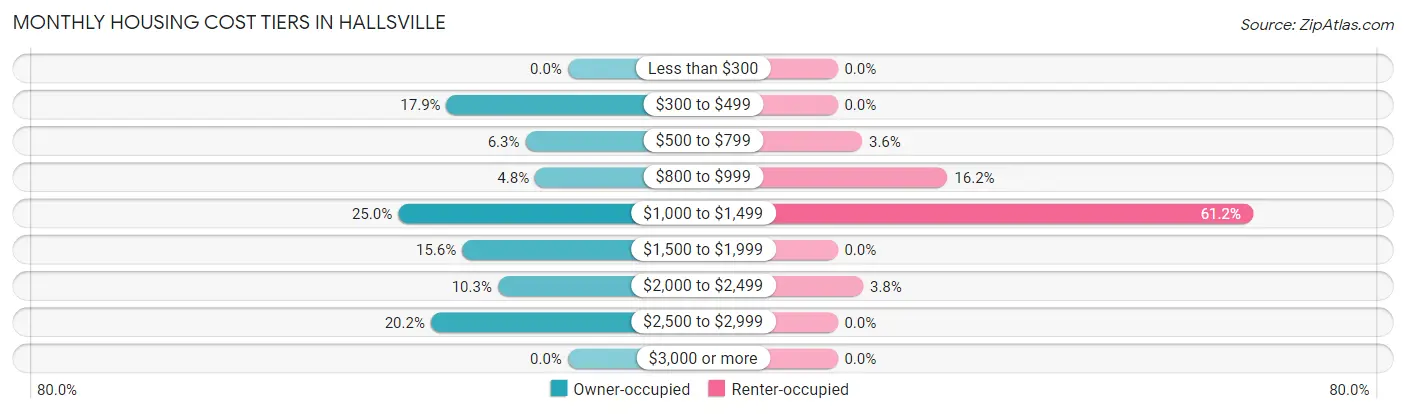
| Monthly Cost | Owner-occupied | Renter-occupied |
| Less than $300 | 0 (0.0%) | 0 (0.0%) |
| $300 to $499 | 163 (17.9%) | 0 (0.0%) |
| $500 to $799 | 57 (6.2%) | 26 (3.6%) |
| $800 to $999 | 44 (4.8%) | 116 (16.2%) |
| $1,000 to $1,499 | 228 (25.0%) | 438 (61.2%) |
| $1,500 to $1,999 | 142 (15.6%) | 0 (0.0%) |
| $2,000 to $2,499 | 94 (10.3%) | 27 (3.8%) |
| $2,500 to $2,999 | 184 (20.2%) | 0 (0.0%) |
| $3,000 or more | 0 (0.0%) | 0 (0.0%) |
| Total | 912 (100.0%) | 716 (100.0%) |
Physical Housing Characteristics in Hallsville
Housing Structures in Hallsville
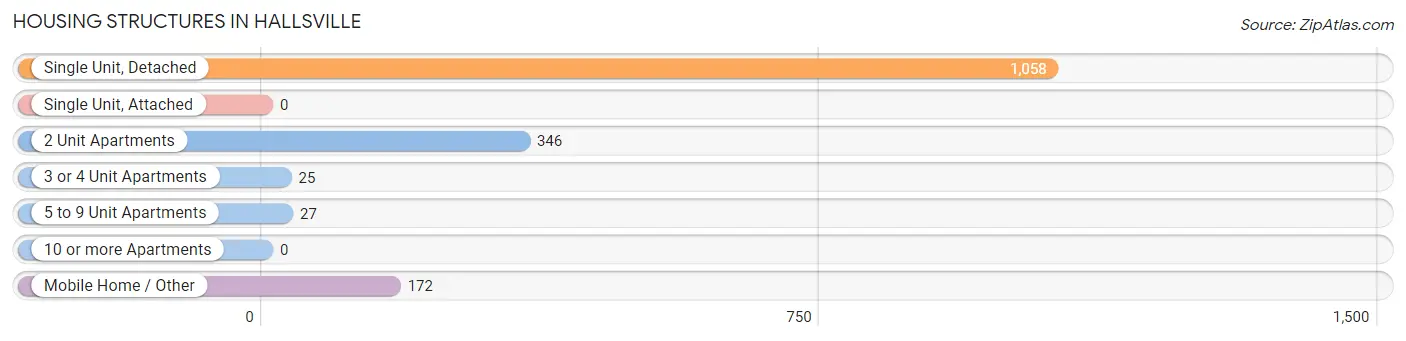
| Structure Type | # Housing Units | % Housing Units |
| Single Unit, Detached | 1,058 | 65.0% |
| Single Unit, Attached | 0 | 0.0% |
| 2 Unit Apartments | 346 | 21.2% |
| 3 or 4 Unit Apartments | 25 | 1.5% |
| 5 to 9 Unit Apartments | 27 | 1.7% |
| 10 or more Apartments | 0 | 0.0% |
| Mobile Home / Other | 172 | 10.6% |
| Total | 1,628 | 100.0% |
Housing Structures by Occupancy in Hallsville
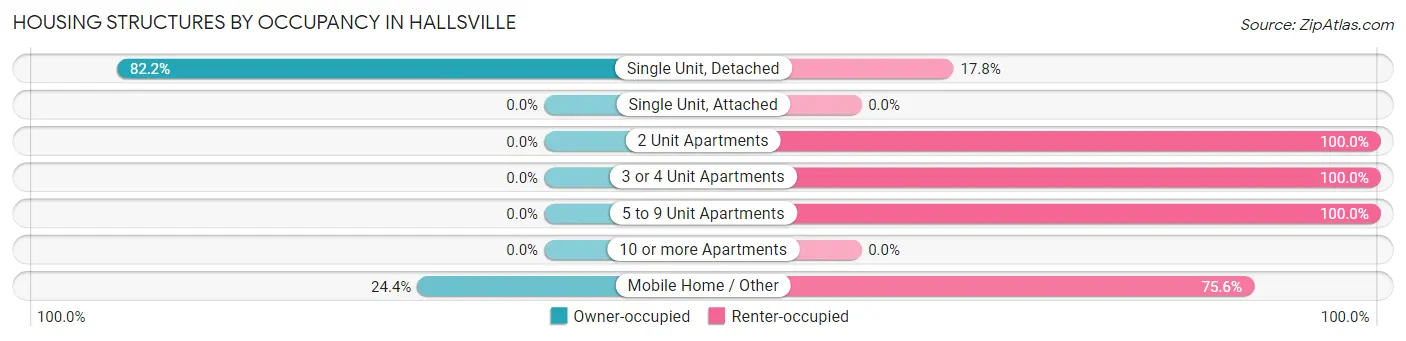
| Structure Type | Owner-occupied | Renter-occupied |
| Single Unit, Detached | 870 (82.2%) | 188 (17.8%) |
| Single Unit, Attached | 0 (0.0%) | 0 (0.0%) |
| 2 Unit Apartments | 0 (0.0%) | 346 (100.0%) |
| 3 or 4 Unit Apartments | 0 (0.0%) | 25 (100.0%) |
| 5 to 9 Unit Apartments | 0 (0.0%) | 27 (100.0%) |
| 10 or more Apartments | 0 (0.0%) | 0 (0.0%) |
| Mobile Home / Other | 42 (24.4%) | 130 (75.6%) |
| Total | 912 (56.0%) | 716 (44.0%) |
Housing Structures by Number of Rooms in Hallsville
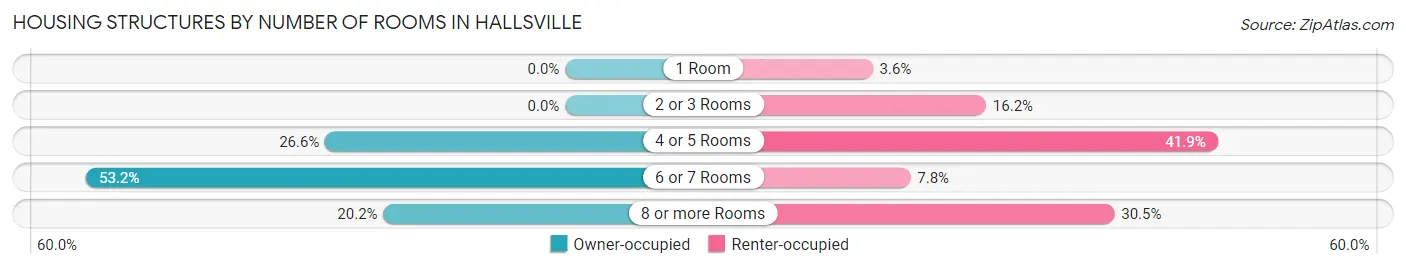
| Number of Rooms | Owner-occupied | Renter-occupied |
| 1 Room | 0 (0.0%) | 26 (3.6%) |
| 2 or 3 Rooms | 0 (0.0%) | 116 (16.2%) |
| 4 or 5 Rooms | 243 (26.6%) | 300 (41.9%) |
| 6 or 7 Rooms | 485 (53.2%) | 56 (7.8%) |
| 8 or more Rooms | 184 (20.2%) | 218 (30.4%) |
| Total | 912 (100.0%) | 716 (100.0%) |
Housing Structure by Heating Type in Hallsville
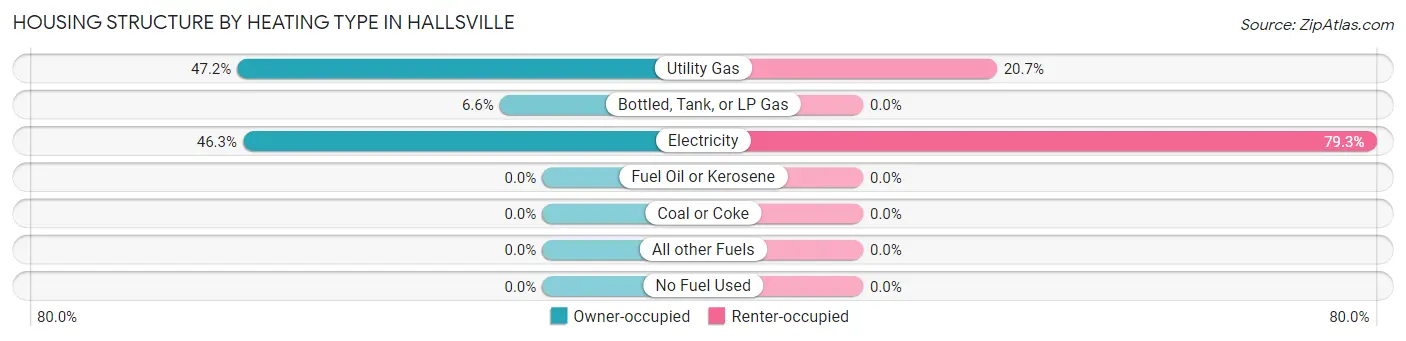
| Heating Type | Owner-occupied | Renter-occupied |
| Utility Gas | 430 (47.1%) | 148 (20.7%) |
| Bottled, Tank, or LP Gas | 60 (6.6%) | 0 (0.0%) |
| Electricity | 422 (46.3%) | 568 (79.3%) |
| Fuel Oil or Kerosene | 0 (0.0%) | 0 (0.0%) |
| Coal or Coke | 0 (0.0%) | 0 (0.0%) |
| All other Fuels | 0 (0.0%) | 0 (0.0%) |
| No Fuel Used | 0 (0.0%) | 0 (0.0%) |
| Total | 912 (100.0%) | 716 (100.0%) |
Household Vehicle Usage in Hallsville
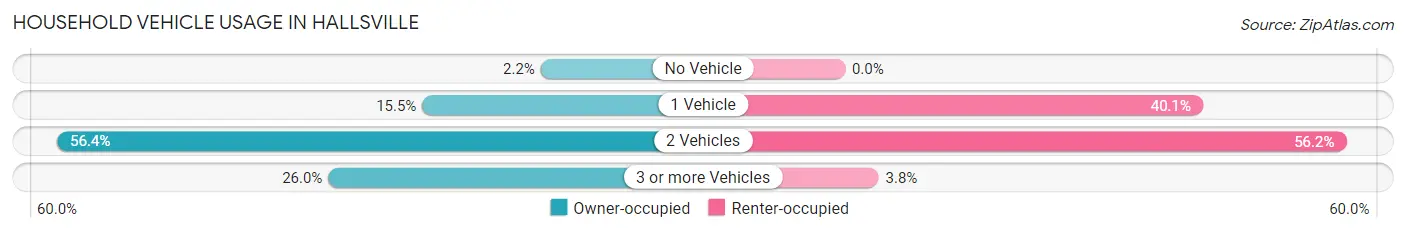
| Vehicles per Household | Owner-occupied | Renter-occupied |
| No Vehicle | 20 (2.2%) | 0 (0.0%) |
| 1 Vehicle | 141 (15.5%) | 287 (40.1%) |
| 2 Vehicles | 514 (56.4%) | 402 (56.1%) |
| 3 or more Vehicles | 237 (26.0%) | 27 (3.8%) |
| Total | 912 (100.0%) | 716 (100.0%) |
Real Estate & Mortgages in Hallsville
Real Estate and Mortgage Overview in Hallsville
| Characteristic | Without Mortgage | With Mortgage |
| Housing Units | 246 | 666 |
| Median Property Value | $161,100 | $215,300 |
| Median Household Income | $57,881 | $293 |
| Monthly Housing Costs | $464 | $0 |
| Real Estate Taxes | - | - |
Property Value by Mortgage Status in Hallsville
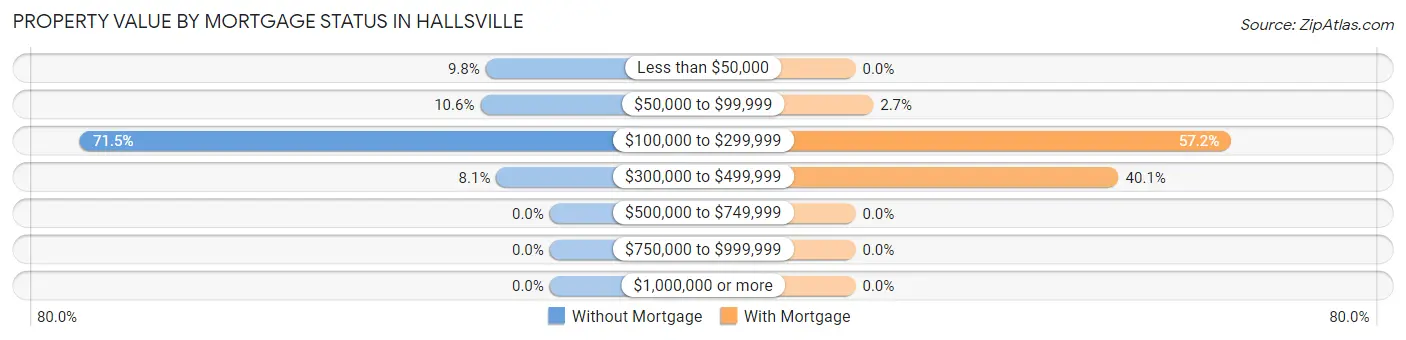
| Property Value | Without Mortgage | With Mortgage |
| Less than $50,000 | 24 (9.8%) | 0 (0.0%) |
| $50,000 to $99,999 | 26 (10.6%) | 18 (2.7%) |
| $100,000 to $299,999 | 176 (71.5%) | 381 (57.2%) |
| $300,000 to $499,999 | 20 (8.1%) | 267 (40.1%) |
| $500,000 to $749,999 | 0 (0.0%) | 0 (0.0%) |
| $750,000 to $999,999 | 0 (0.0%) | 0 (0.0%) |
| $1,000,000 or more | 0 (0.0%) | 0 (0.0%) |
| Total | 246 (100.0%) | 666 (100.0%) |
Household Income by Mortgage Status in Hallsville
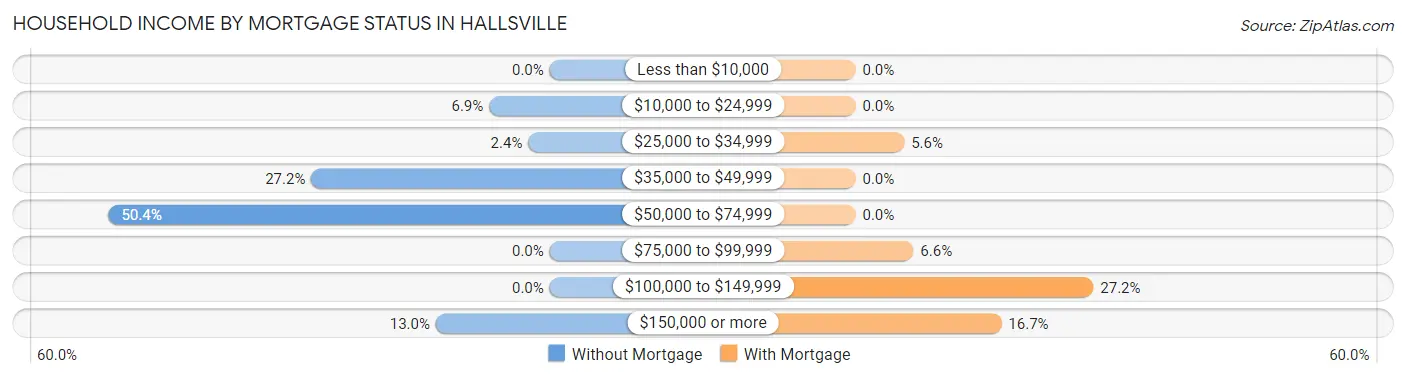
| Household Income | Without Mortgage | With Mortgage |
| Less than $10,000 | 0 (0.0%) | 0 (0.0%) |
| $10,000 to $24,999 | 17 (6.9%) | 0 (0.0%) |
| $25,000 to $34,999 | 6 (2.4%) | 37 (5.6%) |
| $35,000 to $49,999 | 67 (27.2%) | 0 (0.0%) |
| $50,000 to $74,999 | 124 (50.4%) | 0 (0.0%) |
| $75,000 to $99,999 | 0 (0.0%) | 44 (6.6%) |
| $100,000 to $149,999 | 0 (0.0%) | 181 (27.2%) |
| $150,000 or more | 32 (13.0%) | 111 (16.7%) |
| Total | 246 (100.0%) | 666 (100.0%) |
Property Value to Household Income Ratio in Hallsville
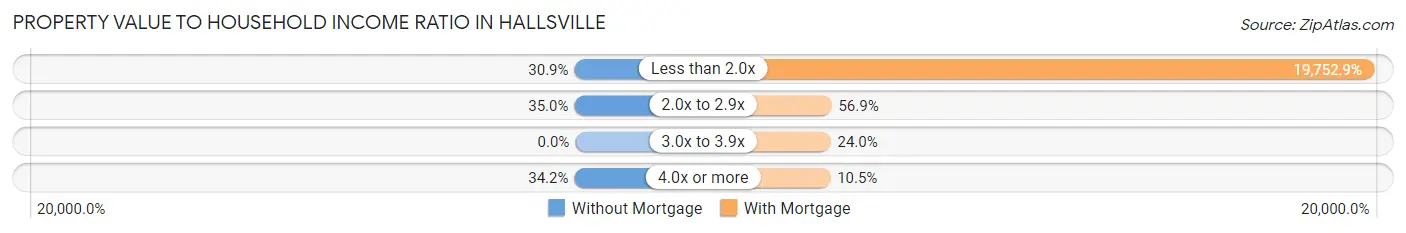
| Value-to-Income Ratio | Without Mortgage | With Mortgage |
| Less than 2.0x | 76 (30.9%) | 131,554 (19,752.9%) |
| 2.0x to 2.9x | 86 (35.0%) | 379 (56.9%) |
| 3.0x to 3.9x | 0 (0.0%) | 160 (24.0%) |
| 4.0x or more | 84 (34.2%) | 70 (10.5%) |
| Total | 246 (100.0%) | 666 (100.0%) |
Real Estate Taxes by Mortgage Status in Hallsville
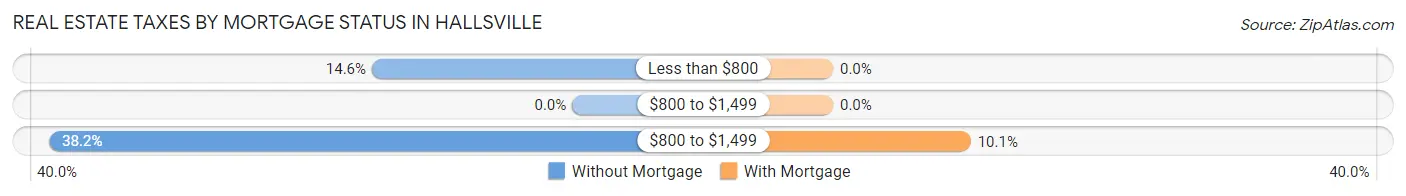
| Property Taxes | Without Mortgage | With Mortgage |
| Less than $800 | 36 (14.6%) | 0 (0.0%) |
| $800 to $1,499 | 0 (0.0%) | 0 (0.0%) |
| $800 to $1,499 | 94 (38.2%) | 67 (10.1%) |
| Total | 246 (100.0%) | 666 (100.0%) |
Health & Disability in Hallsville
Health Insurance Coverage by Age in Hallsville
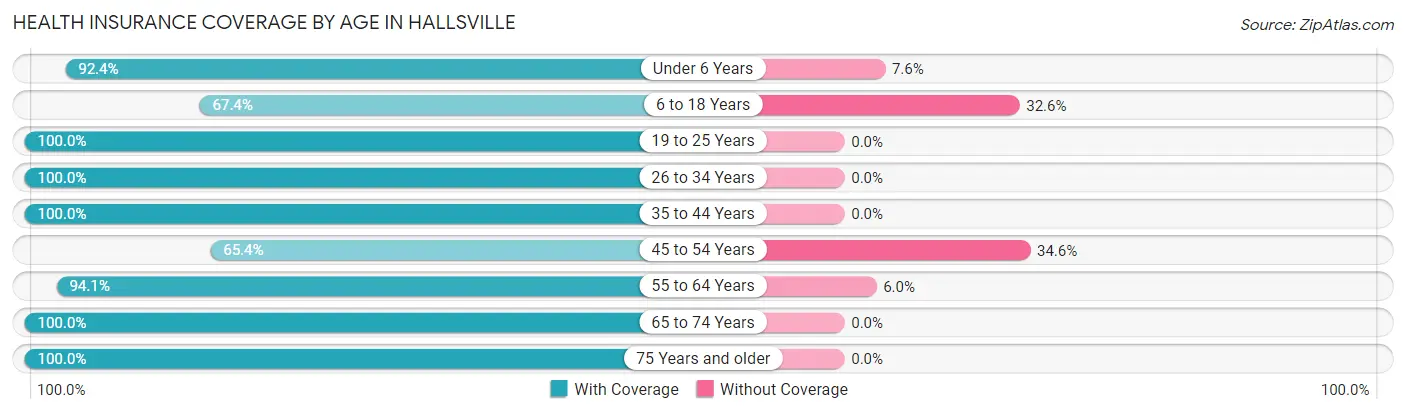
| Age Bracket | With Coverage | Without Coverage |
| Under 6 Years | 280 (92.4%) | 23 (7.6%) |
| 6 to 18 Years | 584 (67.4%) | 283 (32.6%) |
| 19 to 25 Years | 601 (100.0%) | 0 (0.0%) |
| 26 to 34 Years | 595 (100.0%) | 0 (0.0%) |
| 35 to 44 Years | 465 (100.0%) | 0 (0.0%) |
| 45 to 54 Years | 487 (65.4%) | 258 (34.6%) |
| 55 to 64 Years | 506 (94.1%) | 32 (5.9%) |
| 65 to 74 Years | 89 (100.0%) | 0 (0.0%) |
| 75 Years and older | 156 (100.0%) | 0 (0.0%) |
| Total | 3,763 (86.3%) | 596 (13.7%) |
Health Insurance Coverage by Citizenship Status in Hallsville
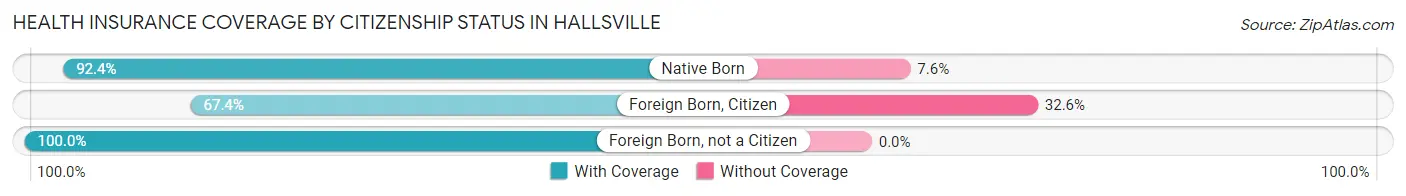
| Citizenship Status | With Coverage | Without Coverage |
| Native Born | 280 (92.4%) | 23 (7.6%) |
| Foreign Born, Citizen | 584 (67.4%) | 283 (32.6%) |
| Foreign Born, not a Citizen | 601 (100.0%) | 0 (0.0%) |
Health Insurance Coverage by Household Income in Hallsville
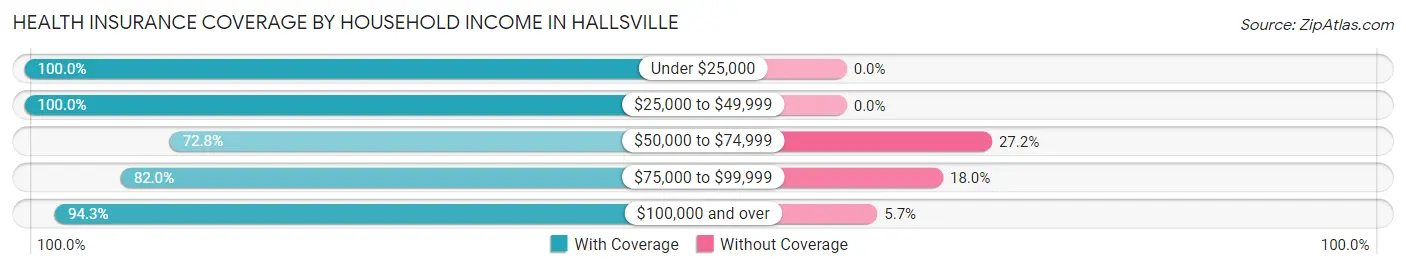
| Household Income | With Coverage | Without Coverage |
| Under $25,000 | 156 (100.0%) | 0 (0.0%) |
| $25,000 to $49,999 | 376 (100.0%) | 0 (0.0%) |
| $50,000 to $74,999 | 961 (72.8%) | 359 (27.2%) |
| $75,000 to $99,999 | 623 (82.0%) | 137 (18.0%) |
| $100,000 and over | 1,647 (94.3%) | 100 (5.7%) |
Public vs Private Health Insurance Coverage by Age in Hallsville
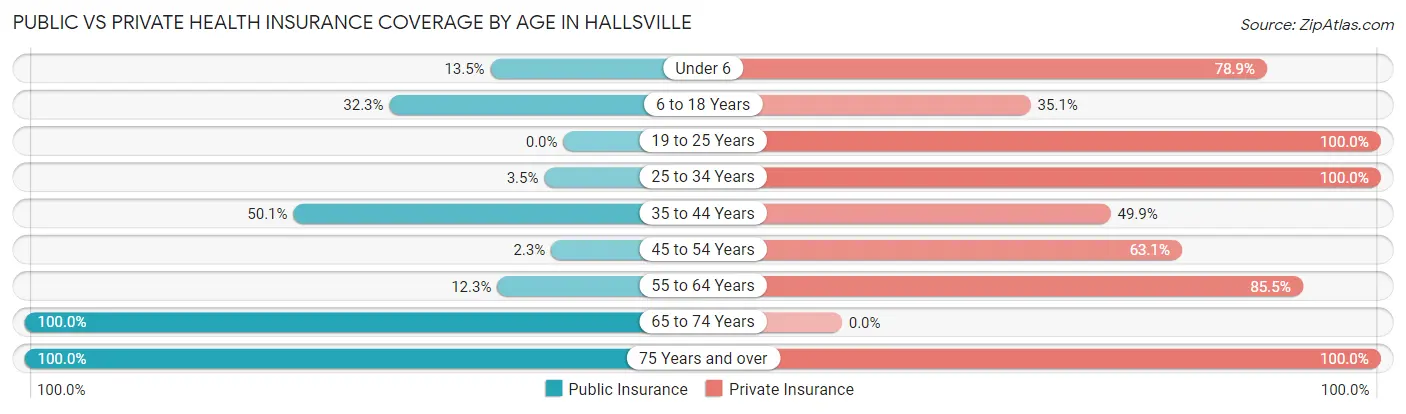
| Age Bracket | Public Insurance | Private Insurance |
| Under 6 | 41 (13.5%) | 239 (78.9%) |
| 6 to 18 Years | 280 (32.3%) | 304 (35.1%) |
| 19 to 25 Years | 0 (0.0%) | 601 (100.0%) |
| 25 to 34 Years | 21 (3.5%) | 595 (100.0%) |
| 35 to 44 Years | 233 (50.1%) | 232 (49.9%) |
| 45 to 54 Years | 17 (2.3%) | 470 (63.1%) |
| 55 to 64 Years | 66 (12.3%) | 460 (85.5%) |
| 65 to 74 Years | 89 (100.0%) | 0 (0.0%) |
| 75 Years and over | 156 (100.0%) | 156 (100.0%) |
| Total | 903 (20.7%) | 3,057 (70.1%) |
Disability Status by Sex by Age in Hallsville
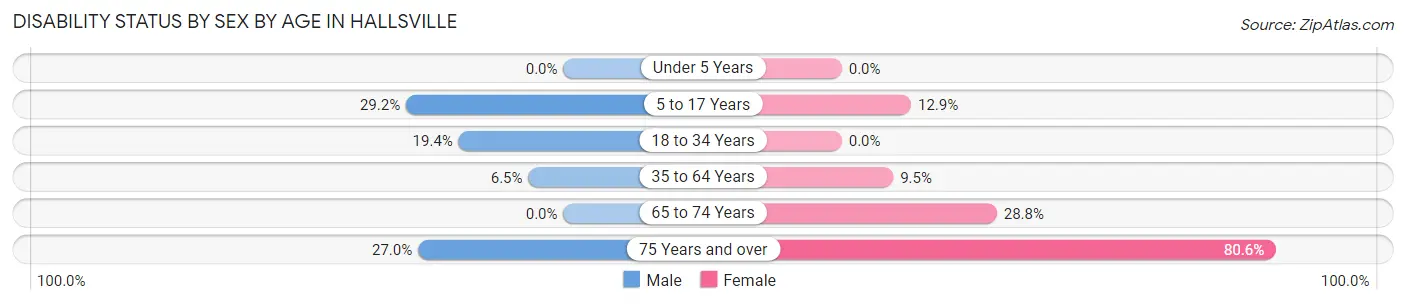
| Age Bracket | Male | Female |
| Under 5 Years | 0 (0.0%) | 0 (0.0%) |
| 5 to 17 Years | 163 (29.2%) | 50 (12.9%) |
| 18 to 34 Years | 151 (19.4%) | 0 (0.0%) |
| 35 to 64 Years | 70 (6.5%) | 64 (9.5%) |
| 65 to 74 Years | 0 (0.0%) | 21 (28.8%) |
| 75 Years and over | 24 (27.0%) | 54 (80.6%) |
Disability Class by Sex by Age in Hallsville
Disability Class: Hearing Difficulty
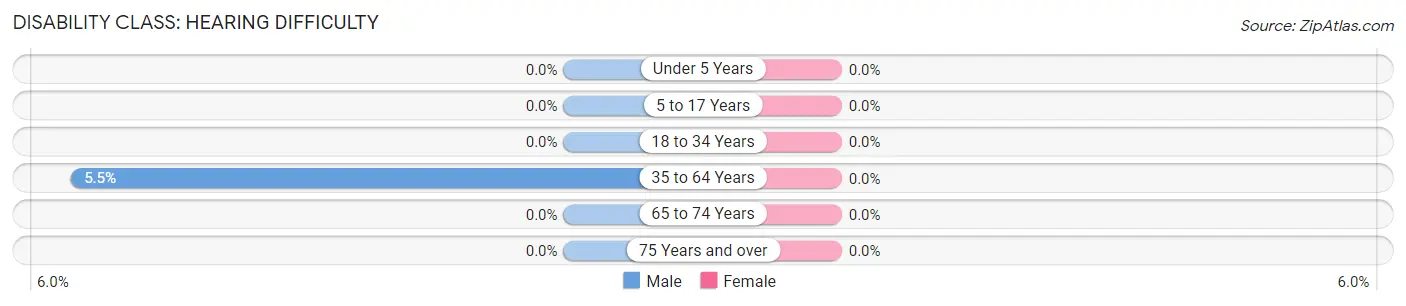
| Age Bracket | Male | Female |
| Under 5 Years | 0 (0.0%) | 0 (0.0%) |
| 5 to 17 Years | 0 (0.0%) | 0 (0.0%) |
| 18 to 34 Years | 0 (0.0%) | 0 (0.0%) |
| 35 to 64 Years | 59 (5.5%) | 0 (0.0%) |
| 65 to 74 Years | 0 (0.0%) | 0 (0.0%) |
| 75 Years and over | 0 (0.0%) | 0 (0.0%) |
Disability Class: Vision Difficulty
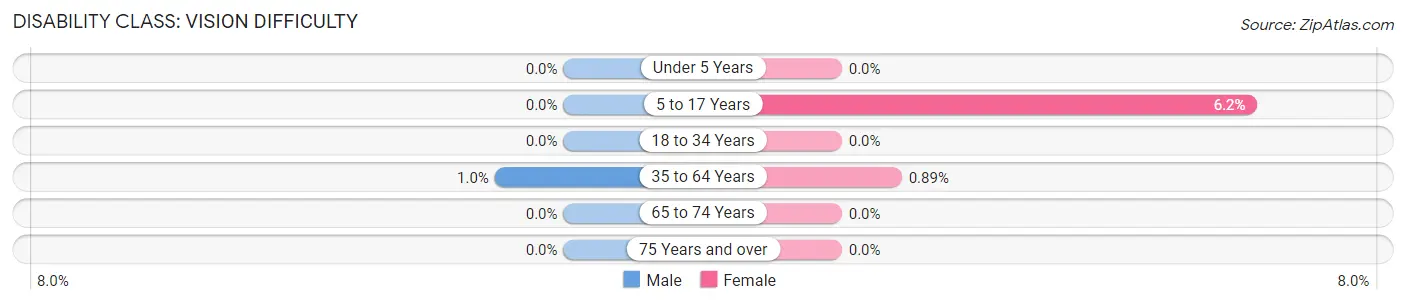
| Age Bracket | Male | Female |
| Under 5 Years | 0 (0.0%) | 0 (0.0%) |
| 5 to 17 Years | 0 (0.0%) | 24 (6.2%) |
| 18 to 34 Years | 0 (0.0%) | 0 (0.0%) |
| 35 to 64 Years | 11 (1.0%) | 6 (0.9%) |
| 65 to 74 Years | 0 (0.0%) | 0 (0.0%) |
| 75 Years and over | 0 (0.0%) | 0 (0.0%) |
Disability Class: Cognitive Difficulty
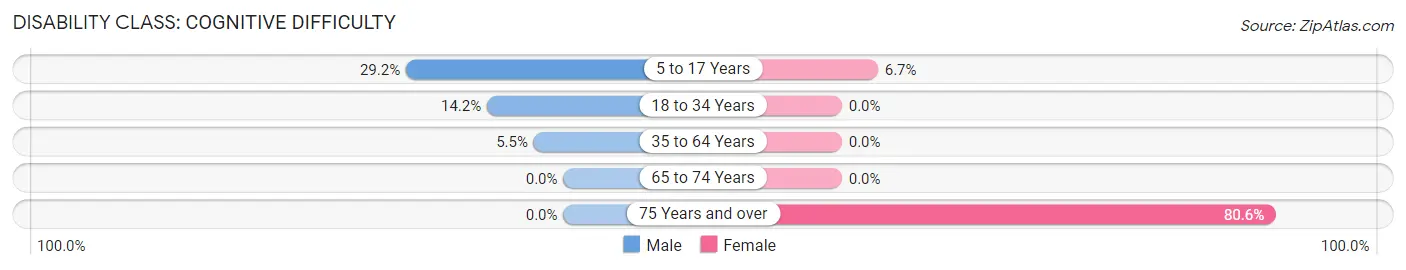
| Age Bracket | Male | Female |
| 5 to 17 Years | 163 (29.2%) | 26 (6.7%) |
| 18 to 34 Years | 110 (14.2%) | 0 (0.0%) |
| 35 to 64 Years | 59 (5.5%) | 0 (0.0%) |
| 65 to 74 Years | 0 (0.0%) | 0 (0.0%) |
| 75 Years and over | 0 (0.0%) | 54 (80.6%) |
Disability Class: Ambulatory Difficulty
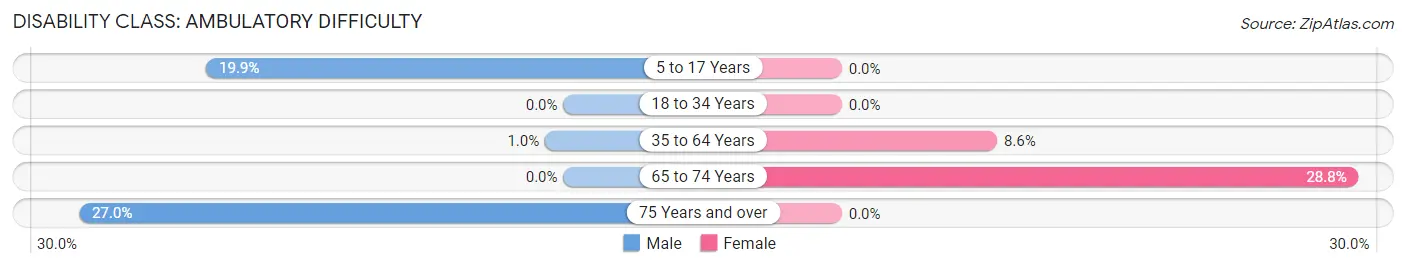
| Age Bracket | Male | Female |
| 5 to 17 Years | 111 (19.9%) | 0 (0.0%) |
| 18 to 34 Years | 0 (0.0%) | 0 (0.0%) |
| 35 to 64 Years | 11 (1.0%) | 58 (8.6%) |
| 65 to 74 Years | 0 (0.0%) | 21 (28.8%) |
| 75 Years and over | 24 (27.0%) | 0 (0.0%) |
Disability Class: Self-Care Difficulty
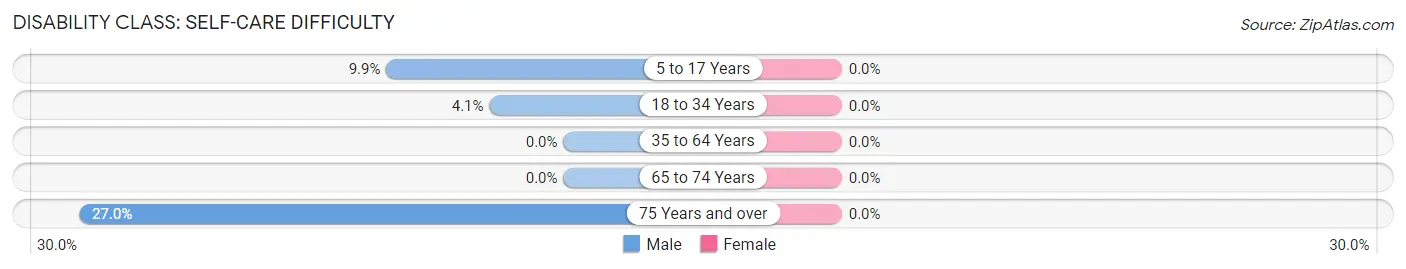
| Age Bracket | Male | Female |
| 5 to 17 Years | 55 (9.9%) | 0 (0.0%) |
| 18 to 34 Years | 32 (4.1%) | 0 (0.0%) |
| 35 to 64 Years | 0 (0.0%) | 0 (0.0%) |
| 65 to 74 Years | 0 (0.0%) | 0 (0.0%) |
| 75 Years and over | 24 (27.0%) | 0 (0.0%) |
Technology Access in Hallsville
Computing Device Access in Hallsville
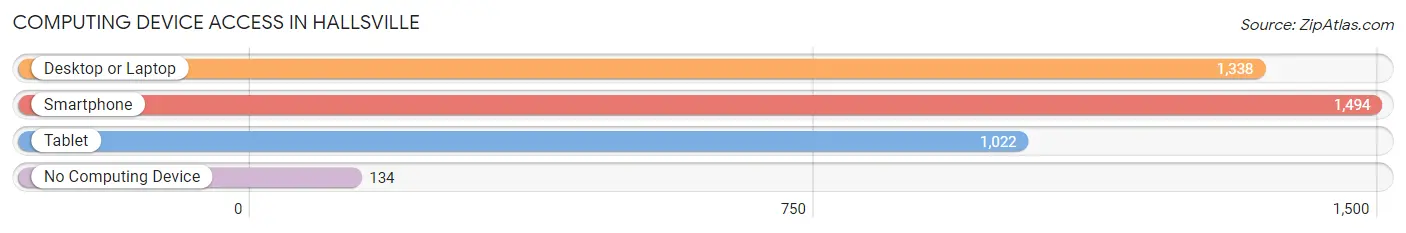
| Device Type | # Households | % Households |
| Desktop or Laptop | 1,338 | 82.2% |
| Smartphone | 1,494 | 91.8% |
| Tablet | 1,022 | 62.8% |
| No Computing Device | 134 | 8.2% |
| Total | 1,628 | 100.0% |
Internet Access in Hallsville
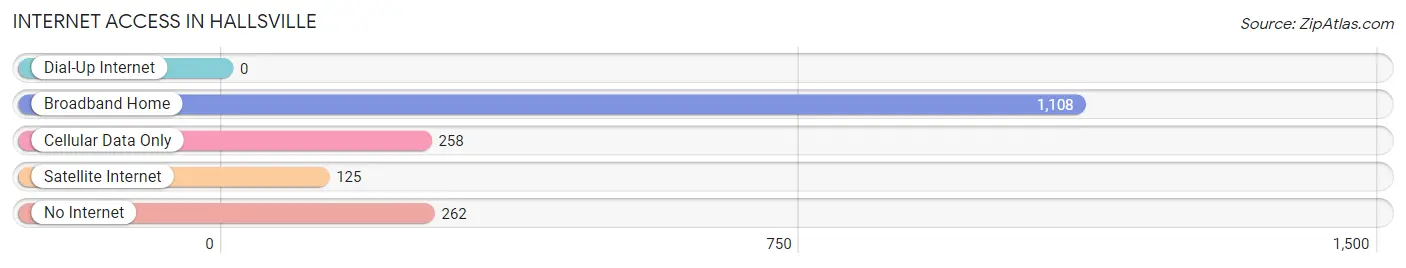
| Internet Type | # Households | % Households |
| Dial-Up Internet | 0 | 0.0% |
| Broadband Home | 1,108 | 68.1% |
| Cellular Data Only | 258 | 15.9% |
| Satellite Internet | 125 | 7.7% |
| No Internet | 262 | 16.1% |
| Total | 1,628 | 100.0% |
Hallsville Summary
Hallsville is a city located in Harrison County, Texas, United States. The population was 3,577 at the 2010 census. It is part of the Longview, Texas Metropolitan Statistical Area.
History
Hallsville was founded in 1871 by William Hall, a former Confederate soldier. Hall had purchased land in the area and began to develop it into a town. He named the town after himself and it quickly grew into a thriving community. The town was incorporated in 1873 and soon became a major center for cotton production.
In the early 1900s, Hallsville was a major stop on the St. Louis, Brownsville and Mexico Railway. This allowed the town to become a major shipping point for cotton and other goods. The town also had a number of stores, churches, and other businesses.
In the 1920s, the town began to decline as the railroad stopped running through the area. The Great Depression also had a major impact on the town, as many businesses closed and the population decreased.
In the 1950s, the town began to experience a resurgence as the oil industry began to boom in the area. This allowed the town to become a major center for oil production and related businesses.
Geography
Hallsville is located at 32°25'25" North, 94°37'45" West (32.423750, -94.629167). According to the United States Census Bureau, the city has a total area of 4.2 square miles (10.8 km2), all of it land.
Economy
Hallsville’s economy is largely based on the oil and gas industry. The town is home to several oil and gas companies, as well as related businesses such as drilling and production services. The town is also home to a number of manufacturing companies, including a plastics plant and a paper mill.
The town is also home to a number of retail stores, restaurants, and other businesses. The town is also home to a number of churches and other religious organizations.
Demographics
As of the census of 2000, there were 3,577 people, 1,323 households, and 945 families residing in the city. The population density was 854.3 people per square mile (330.2/km2). There were 1,521 housing units at an average density of 361.3 per square mile (139.7/km2). The racial makeup of the city was 79.17% White, 15.90% African American, 0.36% Native American, 0.17% Asian, 0.03% Pacific Islander, 2.90% from other races, and 1.47% from two or more races. Hispanic or Latino of any race were 5.45% of the population.
There were 1,323 households, out of which 33.7% had children under the age of 18 living with them, 51.2% were married couples living together, 14.3% had a female householder with no husband present, and 30.2% were non-families. 26.3% of all households were made up of individuals, and 13.2% had someone living alone who was 65 years of age or older. The average household size was 2.60 and the average family size was 3.14.
In the city, the population was spread out, with 27.2% under the age of 18, 8.7% from 18 to 24, 27.2% from 25 to 44, 21.2% from 45 to 64, and 15.7% who were 65 years of age or older. The median age was 36 years. For every 100 females, there were 91.2 males. For every 100 females age 18 and over, there were 86.2 males.
The median income for a household in the city was $30,938, and the median income for a family was $36,944. Males had a median income of $30,917 versus $20,938 for females. The per capita income for the city was $15,845. About 13.2% of families and 16.2% of the population were below the poverty line, including 22.2% of those under age 18 and 11.2% of those age 65 or over.
Common Questions
What is the Total Population of Hallsville?
Total Population of Hallsville is 4,359.
What is the Total Male Population of Hallsville?
Total Male Population of Hallsville is 2,695.
What is the Total Female Population of Hallsville?
Total Female Population of Hallsville is 1,664.
What is the Ratio of Males per 100 Females in Hallsville?
There are 161.96 Males per 100 Females in Hallsville.
What is the Ratio of Females per 100 Males in Hallsville?
There are 61.74 Females per 100 Males in Hallsville.
What is the Median Population Age in Hallsville?
Median Population Age in Hallsville is 34.3 Years.
What is the Average Family Size in Hallsville
Average Family Size in Hallsville is 3.0 People.
What is the Average Household Size in Hallsville
Average Household Size in Hallsville is 2.7 People.
What is Per Capita Income in Hallsville?
Per Capita income in Hallsville is $38,749.
What is the Median Family Income in Hallsville?
Median Family Income in Hallsville is $91,720.
What is the Median Household income in Hallsville?
Median Household Income in Hallsville is $86,757.
What is Income or Wage Gap in Hallsville?
Income or Wage Gap in Hallsville is 40.9%.
Women in Hallsville earn 59.1 cents for every dollar earned by a man.
What is Inequality or Gini Index in Hallsville?
Inequality or Gini Index in Hallsville is 0.35.
How Large is the Labor Force in Hallsville?
There are 2,542 People in the Labor Forcein in Hallsville.
What is the Percentage of People in the Labor Force in Hallsville?
73.1% of People are in the Labor Force in Hallsville.
What is the Unemployment Rate in Hallsville?
Unemployment Rate in Hallsville is 1.5%.