Copper Canyon, TX
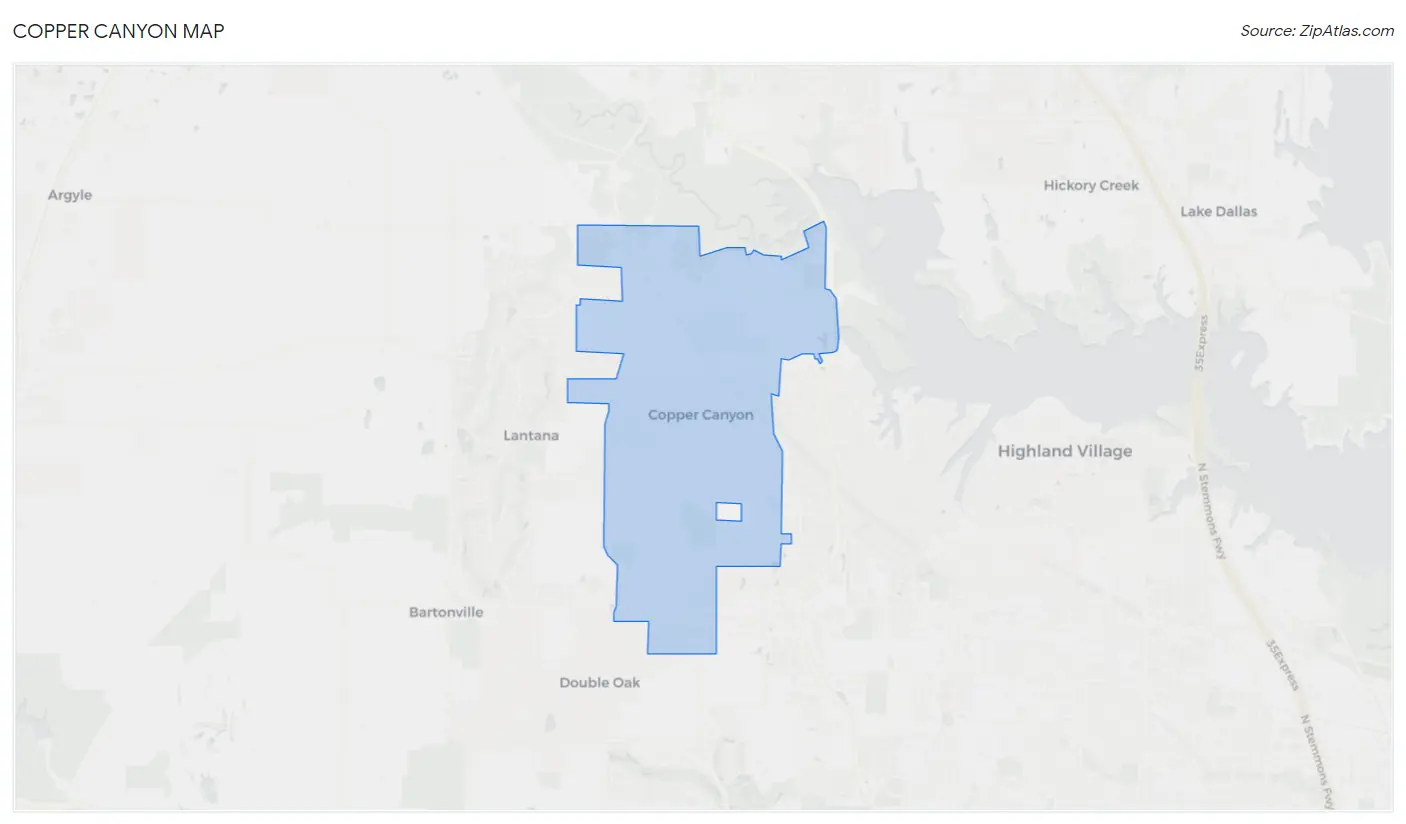
Copper Canyon Map
Copper Canyon Overview
2,125
TOTAL POPULATION
1,029
MALE POPULATION
1,096
FEMALE POPULATION
93.89
MALES / 100 FEMALES
106.51
FEMALES / 100 MALES
53.5
MEDIAN AGE
2.8
AVG FAMILY SIZE
2.6
AVG HOUSEHOLD SIZE
$74,669
PER CAPITA INCOME
$139,213
AVG FAMILY INCOME
$135,938
AVG HOUSEHOLD INCOME
34.6%
WAGE / INCOME GAP [ % ]
65.4¢/ $1
WAGE / INCOME GAP [ $ ]
0.42
INEQUALITY / GINI INDEX
1,113
LABOR FORCE [ PEOPLE ]
61.2%
PERCENT IN LABOR FORCE
6.3%
UNEMPLOYMENT RATE
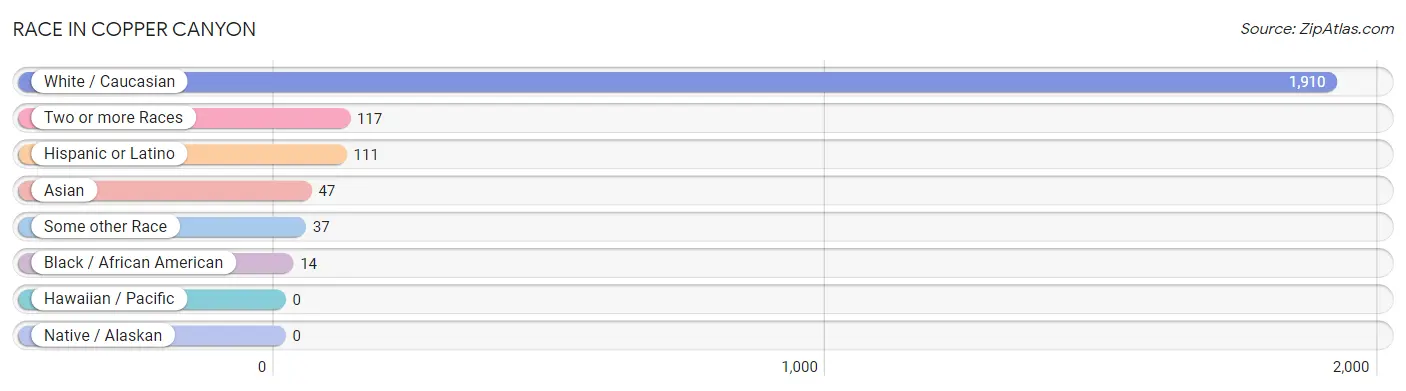
Race in Copper Canyon
The most populous races in Copper Canyon are White / Caucasian (1,910 | 89.9%), Two or more Races (117 | 5.5%), and Hispanic or Latino (111 | 5.2%).
| Race | # Population | % Population |
| Asian | 47 | 2.2% |
| Black / African American | 14 | 0.7% |
| Hawaiian / Pacific | 0 | 0.0% |
| Hispanic or Latino | 111 | 5.2% |
| Native / Alaskan | 0 | 0.0% |
| White / Caucasian | 1,910 | 89.9% |
| Two or more Races | 117 | 5.5% |
| Some other Race | 37 | 1.7% |
| Total | 2,125 | 100.0% |
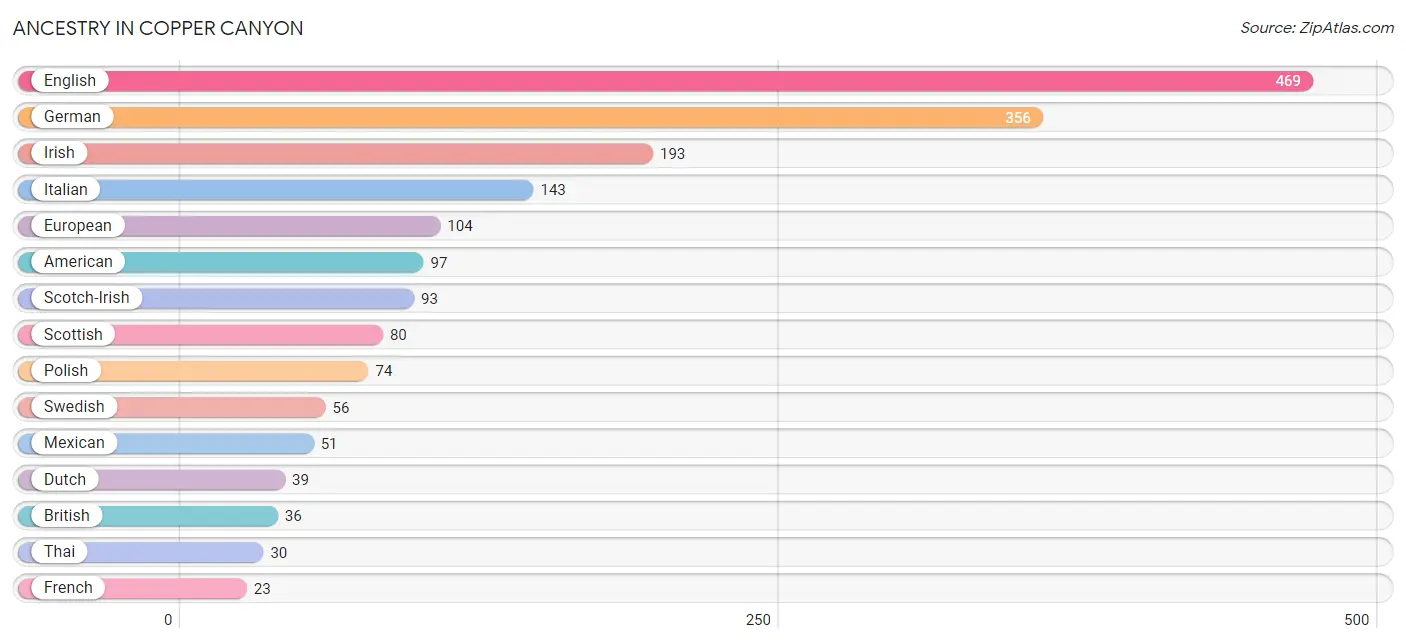
Ancestry in Copper Canyon
The most populous ancestries reported in Copper Canyon are English (469 | 22.1%), German (356 | 16.8%), Irish (193 | 9.1%), Italian (143 | 6.7%), and European (104 | 4.9%), together accounting for 59.5% of all Copper Canyon residents.
| Ancestry | # Population | % Population |
| African | 10 | 0.5% |
| American | 97 | 4.6% |
| Austrian | 4 | 0.2% |
| British | 36 | 1.7% |
| Cherokee | 10 | 0.5% |
| Choctaw | 2 | 0.1% |
| Colombian | 20 | 0.9% |
| Creek | 8 | 0.4% |
| Czech | 12 | 0.6% |
| Dutch | 39 | 1.8% |
| English | 469 | 22.1% |
| European | 104 | 4.9% |
| French | 23 | 1.1% |
| French Canadian | 4 | 0.2% |
| German | 356 | 16.8% |
| Greek | 12 | 0.6% |
| Hungarian | 23 | 1.1% |
| Irish | 193 | 9.1% |
| Italian | 143 | 6.7% |
| Korean | 9 | 0.4% |
| Lithuanian | 6 | 0.3% |
| Mexican | 51 | 2.4% |
| Norwegian | 20 | 0.9% |
| Okinawan | 17 | 0.8% |
| Polish | 74 | 3.5% |
| Puerto Rican | 23 | 1.1% |
| Russian | 17 | 0.8% |
| Scotch-Irish | 93 | 4.4% |
| Scottish | 80 | 3.8% |
| Slavic | 8 | 0.4% |
| South African | 10 | 0.5% |
| South American | 20 | 0.9% |
| Spanish | 4 | 0.2% |
| Subsaharan African | 20 | 0.9% |
| Swedish | 56 | 2.6% |
| Thai | 30 | 1.4% |
| Welsh | 3 | 0.1% | View All 37 Rows |
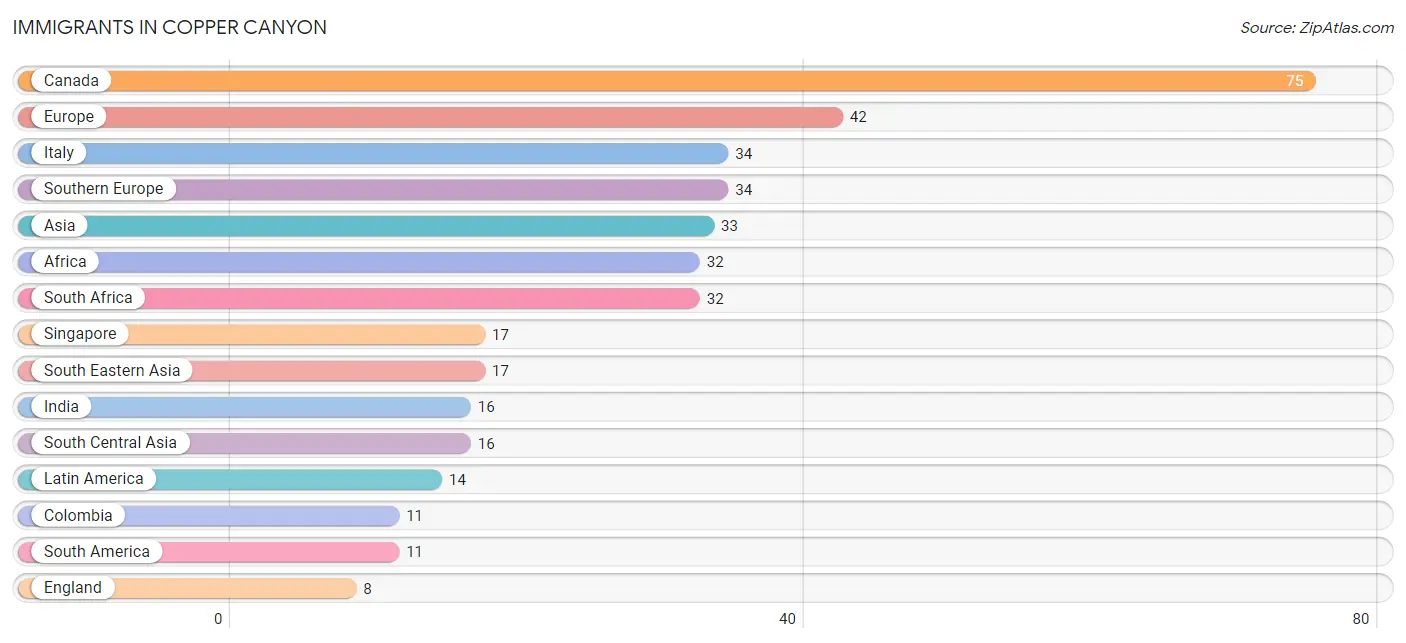
Immigrants in Copper Canyon
The most numerous immigrant groups reported in Copper Canyon came from Canada (75 | 3.5%), Europe (42 | 2.0%), Italy (34 | 1.6%), Southern Europe (34 | 1.6%), and Asia (33 | 1.5%), together accounting for 10.3% of all Copper Canyon residents.
| Immigration Origin | # Population | % Population |
| Africa | 32 | 1.5% |
| Asia | 33 | 1.5% |
| Canada | 75 | 3.5% |
| Central America | 3 | 0.1% |
| Colombia | 11 | 0.5% |
| England | 8 | 0.4% |
| Europe | 42 | 2.0% |
| India | 16 | 0.7% |
| Italy | 34 | 1.6% |
| Latin America | 14 | 0.7% |
| Mexico | 3 | 0.1% |
| Northern Europe | 8 | 0.4% |
| Singapore | 17 | 0.8% |
| South Africa | 32 | 1.5% |
| South America | 11 | 0.5% |
| South Central Asia | 16 | 0.7% |
| South Eastern Asia | 17 | 0.8% |
| Southern Europe | 34 | 1.6% | View All 18 Rows |
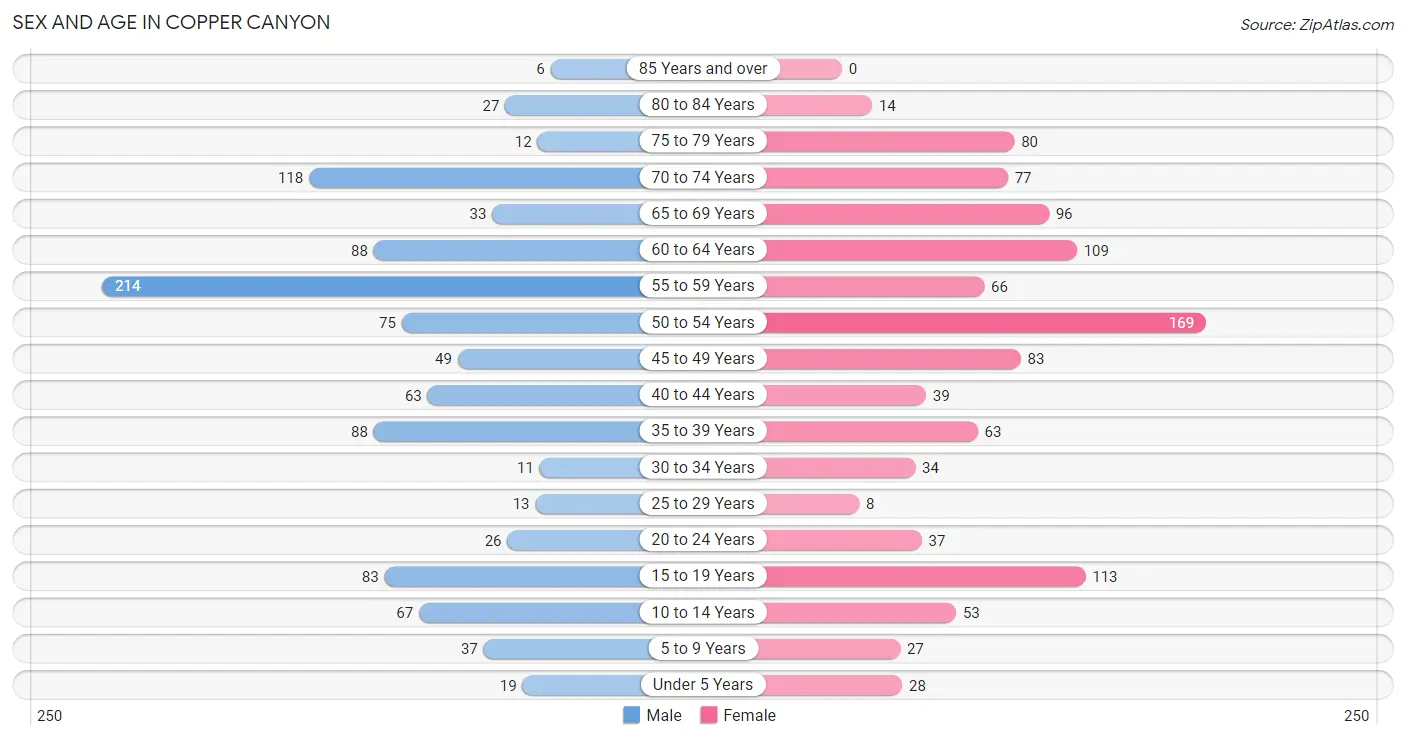
Sex and Age in Copper Canyon
Sex and Age in Copper Canyon
The most populous age groups in Copper Canyon are 55 to 59 Years (214 | 20.8%) for men and 50 to 54 Years (169 | 15.4%) for women.
| Age Bracket | Male | Female |
| Under 5 Years | 19 (1.8%) | 28 (2.5%) |
| 5 to 9 Years | 37 (3.6%) | 27 (2.5%) |
| 10 to 14 Years | 67 (6.5%) | 53 (4.8%) |
| 15 to 19 Years | 83 (8.1%) | 113 (10.3%) |
| 20 to 24 Years | 26 (2.5%) | 37 (3.4%) |
| 25 to 29 Years | 13 (1.3%) | 8 (0.7%) |
| 30 to 34 Years | 11 (1.1%) | 34 (3.1%) |
| 35 to 39 Years | 88 (8.6%) | 63 (5.8%) |
| 40 to 44 Years | 63 (6.1%) | 39 (3.6%) |
| 45 to 49 Years | 49 (4.8%) | 83 (7.6%) |
| 50 to 54 Years | 75 (7.3%) | 169 (15.4%) |
| 55 to 59 Years | 214 (20.8%) | 66 (6.0%) |
| 60 to 64 Years | 88 (8.6%) | 109 (10.0%) |
| 65 to 69 Years | 33 (3.2%) | 96 (8.8%) |
| 70 to 74 Years | 118 (11.5%) | 77 (7.0%) |
| 75 to 79 Years | 12 (1.2%) | 80 (7.3%) |
| 80 to 84 Years | 27 (2.6%) | 14 (1.3%) |
| 85 Years and over | 6 (0.6%) | 0 (0.0%) |
| Total | 1,029 (100.0%) | 1,096 (100.0%) |
Families and Households in Copper Canyon
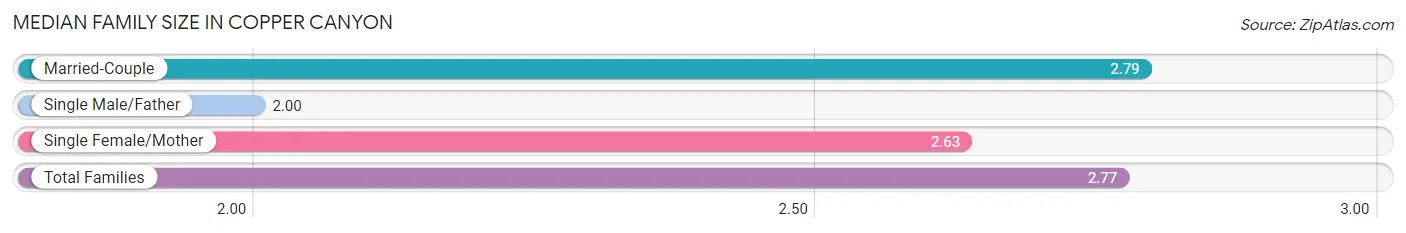
Median Family Size in Copper Canyon
The median family size in Copper Canyon is 2.77 persons per family, with married-couple families (690 | 92.9%) accounting for the largest median family size of 2.79 persons per family. On the other hand, single male/father families (4 | 0.5%) represent the smallest median family size with 2.00 persons per family.
| Family Type | # Families | Family Size |
| Married-Couple | 690 (92.9%) | 2.79 |
| Single Male/Father | 4 (0.5%) | 2.00 |
| Single Female/Mother | 49 (6.6%) | 2.63 |
| Total Families | 743 (100.0%) | 2.77 |
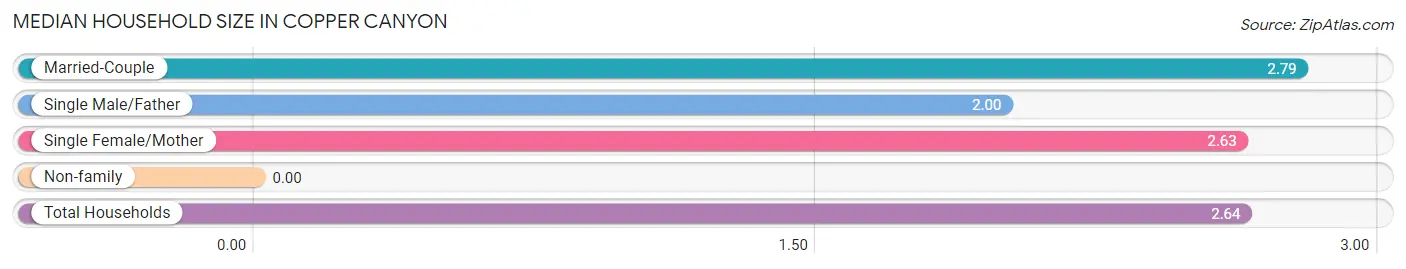
Median Household Size in Copper Canyon
| Household Type | # Households | Household Size |
| Married-Couple | 690 (85.7%) | 2.79 |
| Single Male/Father | 4 (0.5%) | 2.00 |
| Single Female/Mother | 49 (6.1%) | 2.63 |
| Non-family | 62 (7.7%) | - |
| Total Households | 805 (100.0%) | 2.64 |
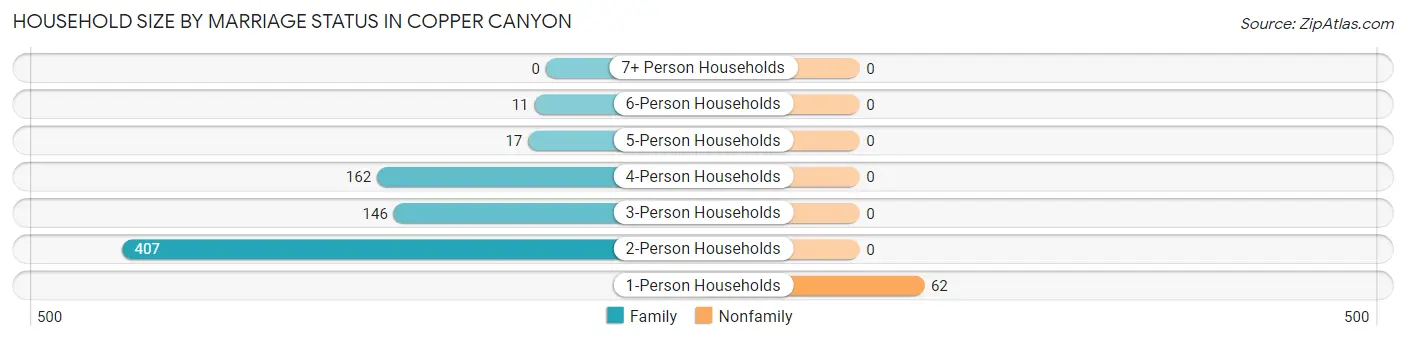
Household Size by Marriage Status in Copper Canyon
Out of a total of 805 households in Copper Canyon, 743 (92.3%) are family households, while 62 (7.7%) are nonfamily households. The most numerous type of family households are 2-person households, comprising 407, and the most common type of nonfamily households are 1-person households, comprising 62.
| Household Size | Family Households | Nonfamily Households |
| 1-Person Households | - | 62 (7.7%) |
| 2-Person Households | 407 (50.6%) | 0 (0.0%) |
| 3-Person Households | 146 (18.1%) | 0 (0.0%) |
| 4-Person Households | 162 (20.1%) | 0 (0.0%) |
| 5-Person Households | 17 (2.1%) | 0 (0.0%) |
| 6-Person Households | 11 (1.4%) | 0 (0.0%) |
| 7+ Person Households | 0 (0.0%) | 0 (0.0%) |
| Total | 743 (92.3%) | 62 (7.7%) |
Female Fertility in Copper Canyon
Fertility by Age in Copper Canyon
Average fertility rate in Copper Canyon is 79.0 births per 1,000 women. Women in the age bracket of 35 to 50 years have the highest fertility rate with 161.0 births per 1,000 women. Women in the age bracket of 35 to 50 years acount for 100.0% of all women with births.
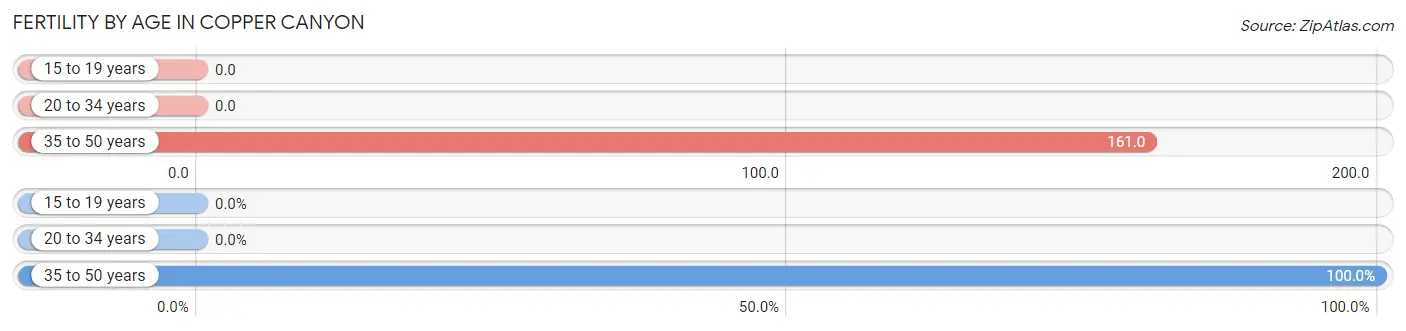
| Age Bracket | Women with Births | Births / 1,000 Women |
| 15 to 19 years | 0 (0.0%) | 0.0 |
| 20 to 34 years | 0 (0.0%) | 0.0 |
| 35 to 50 years | 30 (100.0%) | 161.0 |
| Total | 30 (100.0%) | 79.0 |
Fertility by Age by Marriage Status in Copper Canyon
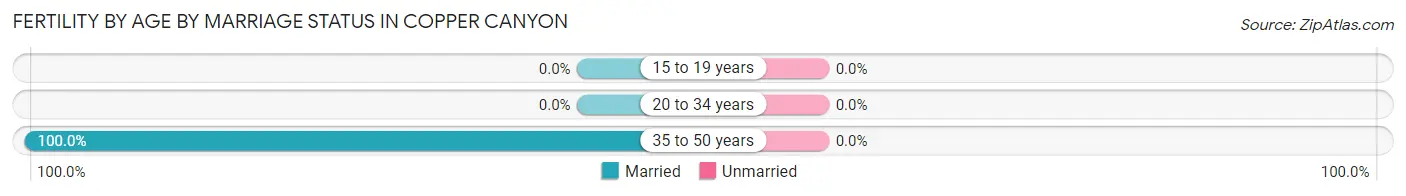
| Age Bracket | Married | Unmarried |
| 15 to 19 years | 0 (0.0%) | 0 (0.0%) |
| 20 to 34 years | 0 (0.0%) | 0 (0.0%) |
| 35 to 50 years | 30 (100.0%) | 0 (0.0%) |
| Total | 30 (100.0%) | 0 (0.0%) |
Fertility by Education in Copper Canyon
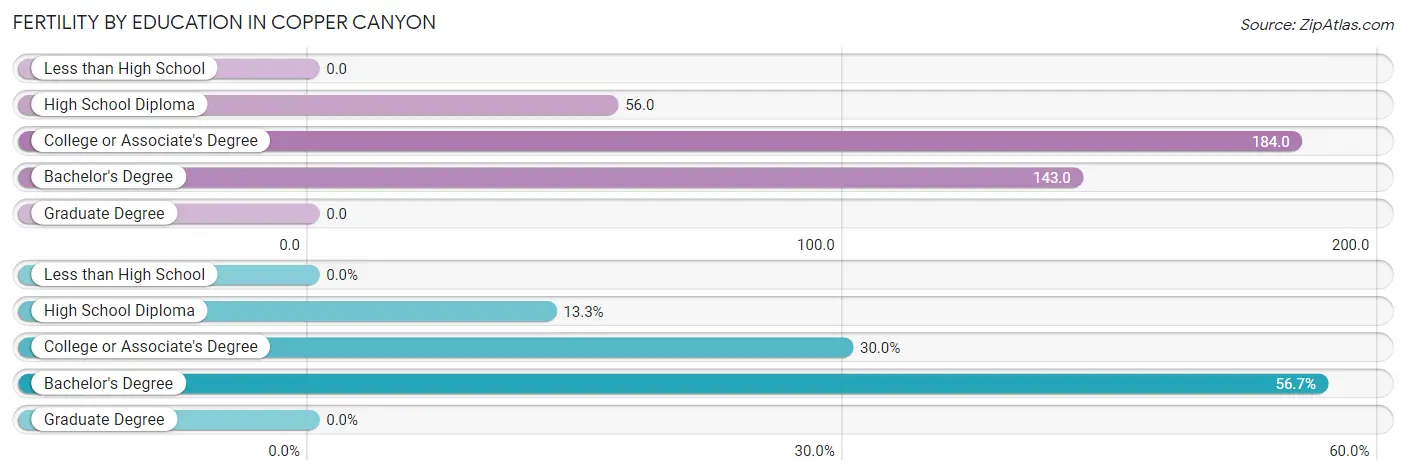
| Educational Attainment | Women with Births | Births / 1,000 Women |
| Less than High School | 0 (0.0%) | 0.0 |
| High School Diploma | 4 (13.3%) | 56.0 |
| College or Associate's Degree | 9 (30.0%) | 184.0 |
| Bachelor's Degree | 17 (56.7%) | 143.0 |
| Graduate Degree | 0 (0.0%) | 0.0 |
| Total | 30 (100.0%) | 79.0 |
Fertility by Education by Marriage Status in Copper Canyon
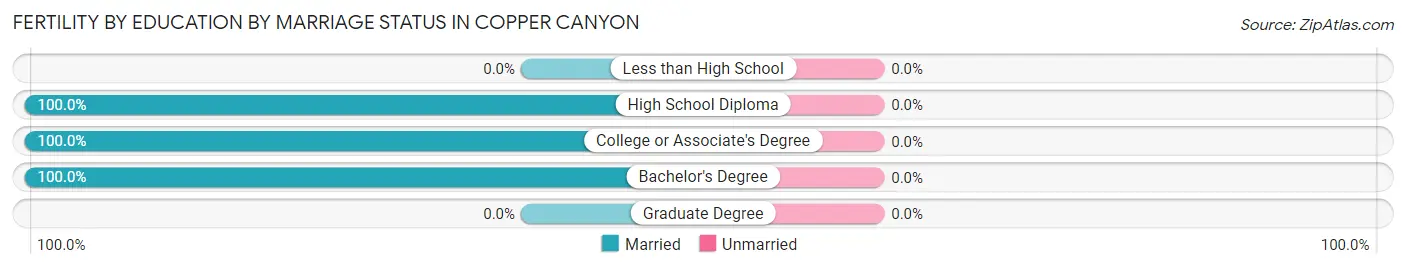
| Educational Attainment | Married | Unmarried |
| Less than High School | 0 (0.0%) | 0 (0.0%) |
| High School Diploma | 4 (100.0%) | 0 (0.0%) |
| College or Associate's Degree | 9 (100.0%) | 0 (0.0%) |
| Bachelor's Degree | 17 (100.0%) | 0 (0.0%) |
| Graduate Degree | 0 (0.0%) | 0 (0.0%) |
| Total | 30 (100.0%) | 0 (0.0%) |
Income in Copper Canyon
Income Overview in Copper Canyon
Per Capita Income in Copper Canyon is $74,669, while median incomes of families and households are $139,213 and $135,938 respectively.
| Characteristic | Number | Measure |
| Per Capita Income | 2,125 | $74,669 |
| Median Family Income | 743 | $139,213 |
| Mean Family Income | 743 | $192,821 |
| Median Household Income | 805 | $135,938 |
| Mean Household Income | 805 | $191,888 |
| Income Deficit | 743 | $0 |
| Wage / Income Gap (%) | 2,125 | 34.62% |
| Wage / Income Gap ($) | 2,125 | 65.38¢ per $1 |
| Gini / Inequality Index | 2,125 | 0.42 |
Earnings by Sex in Copper Canyon
Average Earnings in Copper Canyon are $75,729, $97,500 for men and $63,750 for women, a difference of 34.6%.
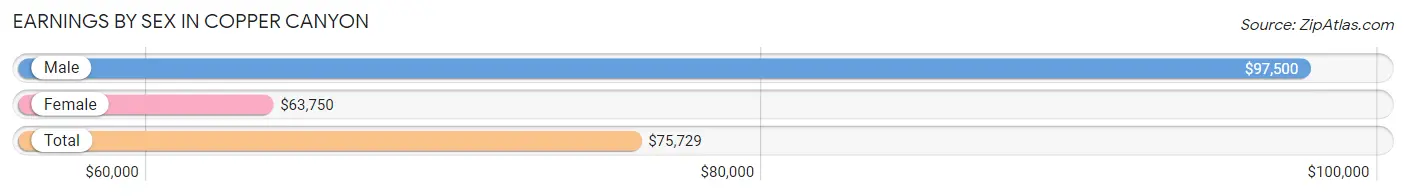
| Sex | Number | Average Earnings |
| Male | 680 (59.0%) | $97,500 |
| Female | 473 (41.0%) | $63,750 |
| Total | 1,153 (100.0%) | $75,729 |
Earnings by Sex by Income Bracket in Copper Canyon
The most common earnings brackets in Copper Canyon are $100,000+ for men (335 | 49.3%) and $100,000+ for women (132 | 27.9%).
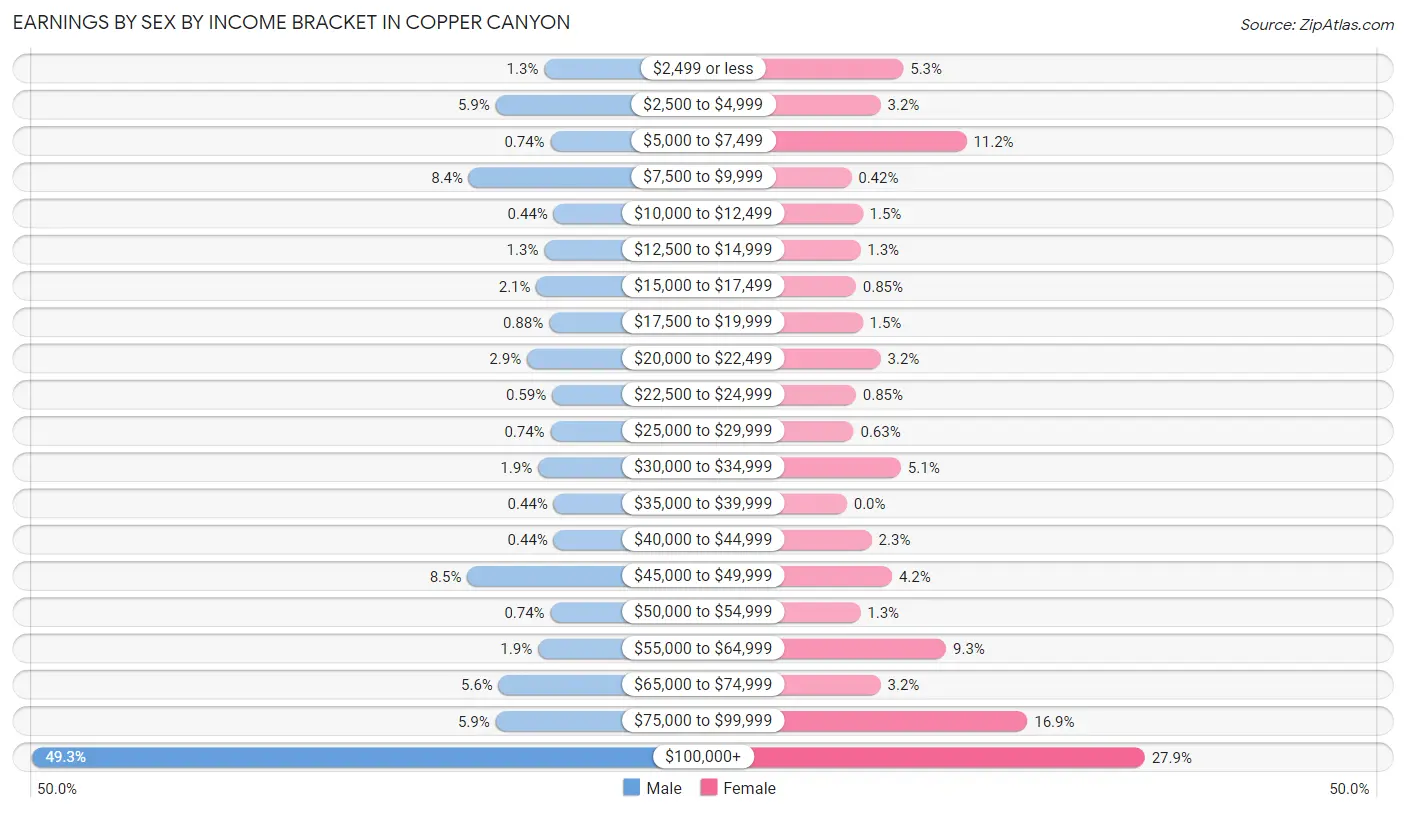
| Income | Male | Female |
| $2,499 or less | 9 (1.3%) | 25 (5.3%) |
| $2,500 to $4,999 | 40 (5.9%) | 15 (3.2%) |
| $5,000 to $7,499 | 5 (0.7%) | 53 (11.2%) |
| $7,500 to $9,999 | 57 (8.4%) | 2 (0.4%) |
| $10,000 to $12,499 | 3 (0.4%) | 7 (1.5%) |
| $12,500 to $14,999 | 9 (1.3%) | 6 (1.3%) |
| $15,000 to $17,499 | 14 (2.1%) | 4 (0.9%) |
| $17,500 to $19,999 | 6 (0.9%) | 7 (1.5%) |
| $20,000 to $22,499 | 20 (2.9%) | 15 (3.2%) |
| $22,500 to $24,999 | 4 (0.6%) | 4 (0.9%) |
| $25,000 to $29,999 | 5 (0.7%) | 3 (0.6%) |
| $30,000 to $34,999 | 13 (1.9%) | 24 (5.1%) |
| $35,000 to $39,999 | 3 (0.4%) | 0 (0.0%) |
| $40,000 to $44,999 | 3 (0.4%) | 11 (2.3%) |
| $45,000 to $49,999 | 58 (8.5%) | 20 (4.2%) |
| $50,000 to $54,999 | 5 (0.7%) | 6 (1.3%) |
| $55,000 to $64,999 | 13 (1.9%) | 44 (9.3%) |
| $65,000 to $74,999 | 38 (5.6%) | 15 (3.2%) |
| $75,000 to $99,999 | 40 (5.9%) | 80 (16.9%) |
| $100,000+ | 335 (49.3%) | 132 (27.9%) |
| Total | 680 (100.0%) | 473 (100.0%) |
Earnings by Sex by Educational Attainment in Copper Canyon
Average earnings in Copper Canyon are $106,250 for men and $75,188 for women, a difference of 29.2%. Men with an educational attainment of college or associate's degree enjoy the highest average annual earnings of $115,616, while those with high school diploma education earn the least with $68,750. Women with an educational attainment of graduate degree earn the most with the average annual earnings of $104,167, while those with bachelor's degree education have the smallest earnings of $63,684.
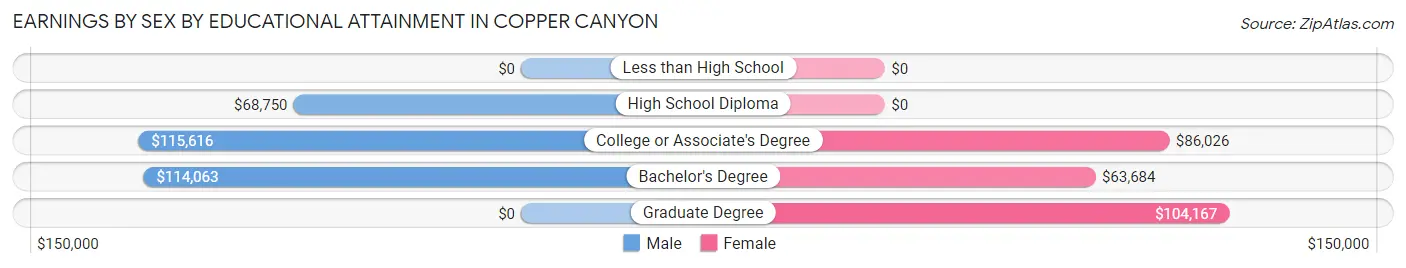
| Educational Attainment | Male Income | Female Income |
| Less than High School | - | - |
| High School Diploma | $68,750 | $0 |
| College or Associate's Degree | $115,616 | $86,026 |
| Bachelor's Degree | $114,063 | $63,684 |
| Graduate Degree | - | - |
| Total | $106,250 | $75,188 |
Family Income in Copper Canyon
Family Income Brackets in Copper Canyon
According to the Copper Canyon family income data, there are 252 families falling into the $200,000+ income range, which is the most common income bracket and makes up 33.9% of all families.
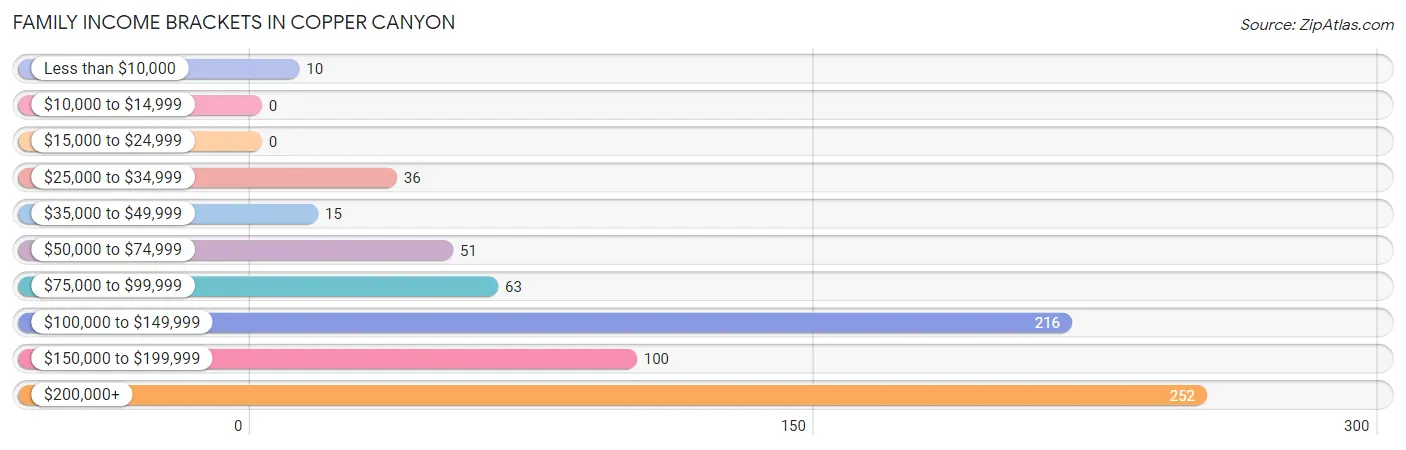
| Income Bracket | # Families | % Families |
| Less than $10,000 | 10 | 1.3% |
| $10,000 to $14,999 | 0 | 0.0% |
| $15,000 to $24,999 | 0 | 0.0% |
| $25,000 to $34,999 | 36 | 4.8% |
| $35,000 to $49,999 | 15 | 2.0% |
| $50,000 to $74,999 | 51 | 6.9% |
| $75,000 to $99,999 | 63 | 8.5% |
| $100,000 to $149,999 | 216 | 29.1% |
| $150,000 to $199,999 | 100 | 13.5% |
| $200,000+ | 252 | 33.9% |
Family Income by Famaliy Size in Copper Canyon
3-person families (149 | 20.1%) account for the highest median family income in Copper Canyon with $250,001 per family, while 3-person families (149 | 20.1%) have the highest median income of $83,334 per family member.
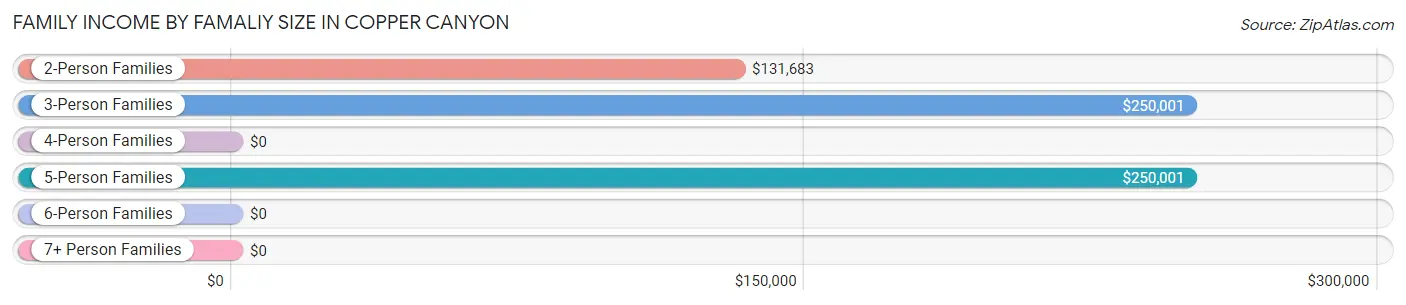
| Income Bracket | # Families | Median Income |
| 2-Person Families | 407 (54.8%) | $131,683 |
| 3-Person Families | 149 (20.1%) | $250,001 |
| 4-Person Families | 159 (21.4%) | $0 |
| 5-Person Families | 17 (2.3%) | $250,001 |
| 6-Person Families | 11 (1.5%) | $0 |
| 7+ Person Families | 0 (0.0%) | $0 |
| Total | 743 (100.0%) | $139,213 |
Family Income by Number of Earners in Copper Canyon
The median family income in Copper Canyon is $139,213, with families comprising 3+ earners (58) having the highest median family income of $250,001, while families with no earners (87) have the lowest median family income of $111,563, accounting for 7.8% and 11.7% of families, respectively.
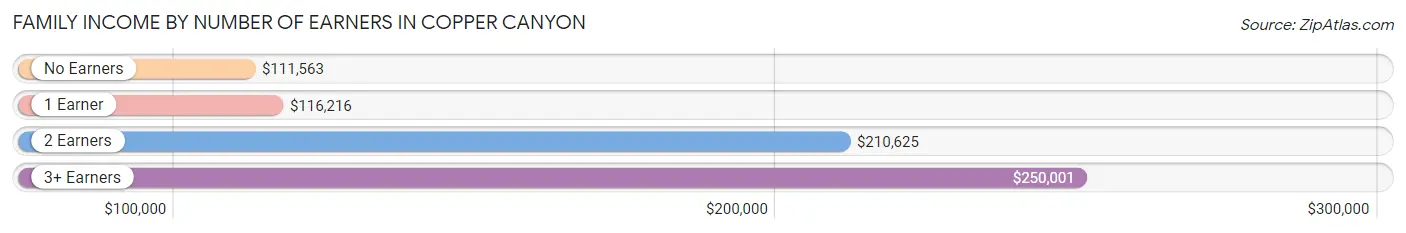
| Number of Earners | # Families | Median Income |
| No Earners | 87 (11.7%) | $111,563 |
| 1 Earner | 298 (40.1%) | $116,216 |
| 2 Earners | 300 (40.4%) | $210,625 |
| 3+ Earners | 58 (7.8%) | $250,001 |
| Total | 743 (100.0%) | $139,213 |
Household Income in Copper Canyon
Household Income Brackets in Copper Canyon
With 256 households falling in the category, the $200,000+ income range is the most frequent in Copper Canyon, accounting for 31.8% of all households.
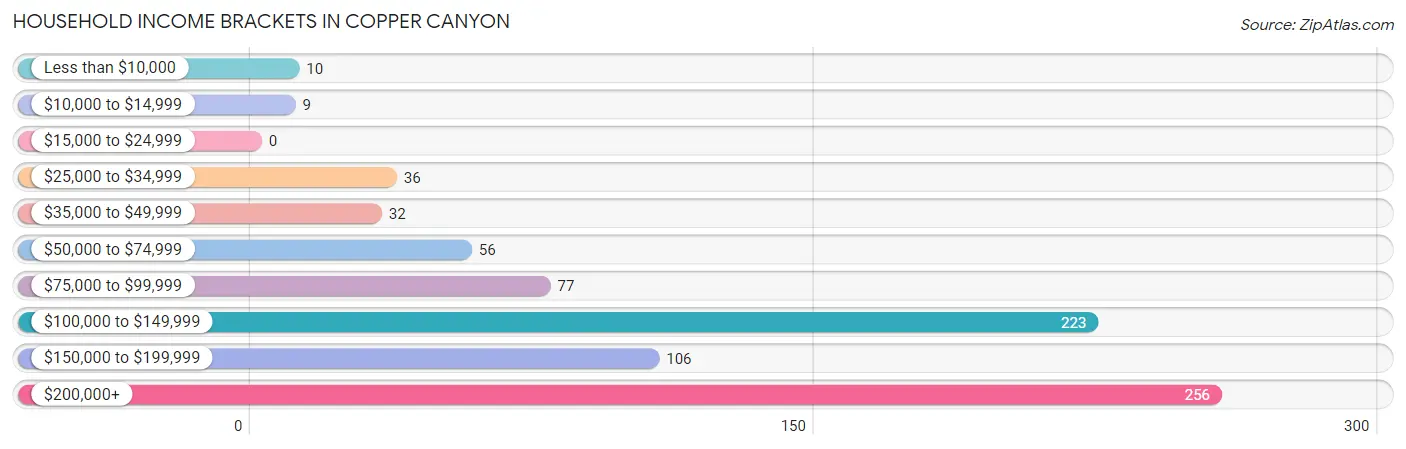
| Income Bracket | # Households | % Households |
| Less than $10,000 | 10 | 1.2% |
| $10,000 to $14,999 | 9 | 1.1% |
| $15,000 to $24,999 | 0 | 0.0% |
| $25,000 to $34,999 | 36 | 4.5% |
| $35,000 to $49,999 | 32 | 4.0% |
| $50,000 to $74,999 | 56 | 7.0% |
| $75,000 to $99,999 | 77 | 9.6% |
| $100,000 to $149,999 | 223 | 27.7% |
| $150,000 to $199,999 | 106 | 13.2% |
| $200,000+ | 256 | 31.8% |
Household Income by Householder Age in Copper Canyon
The median household income in Copper Canyon is $135,938, with the highest median household income of $210,156 found in the 25 to 44 years age bracket for the primary householder. A total of 125 households (15.5%) fall into this category.
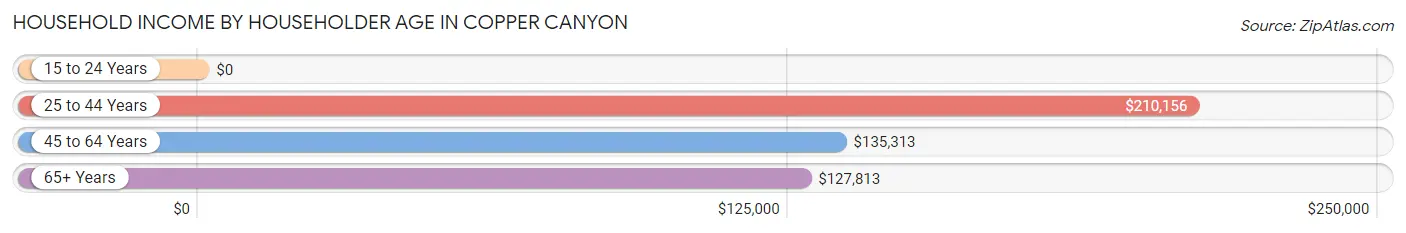
| Income Bracket | # Households | Median Income |
| 15 to 24 Years | 0 (0.0%) | $0 |
| 25 to 44 Years | 125 (15.5%) | $210,156 |
| 45 to 64 Years | 439 (54.5%) | $135,313 |
| 65+ Years | 241 (29.9%) | $127,813 |
| Total | 805 (100.0%) | $135,938 |
Poverty in Copper Canyon
Income Below Poverty by Sex and Age in Copper Canyon
With 1.2% poverty level for males and 0.9% for females among the residents of Copper Canyon, 35 to 44 year old males and 55 to 64 year old females are the most vulnerable to poverty, with 8 males (5.3%) and 6 females (3.4%) in their respective age groups living below the poverty level.
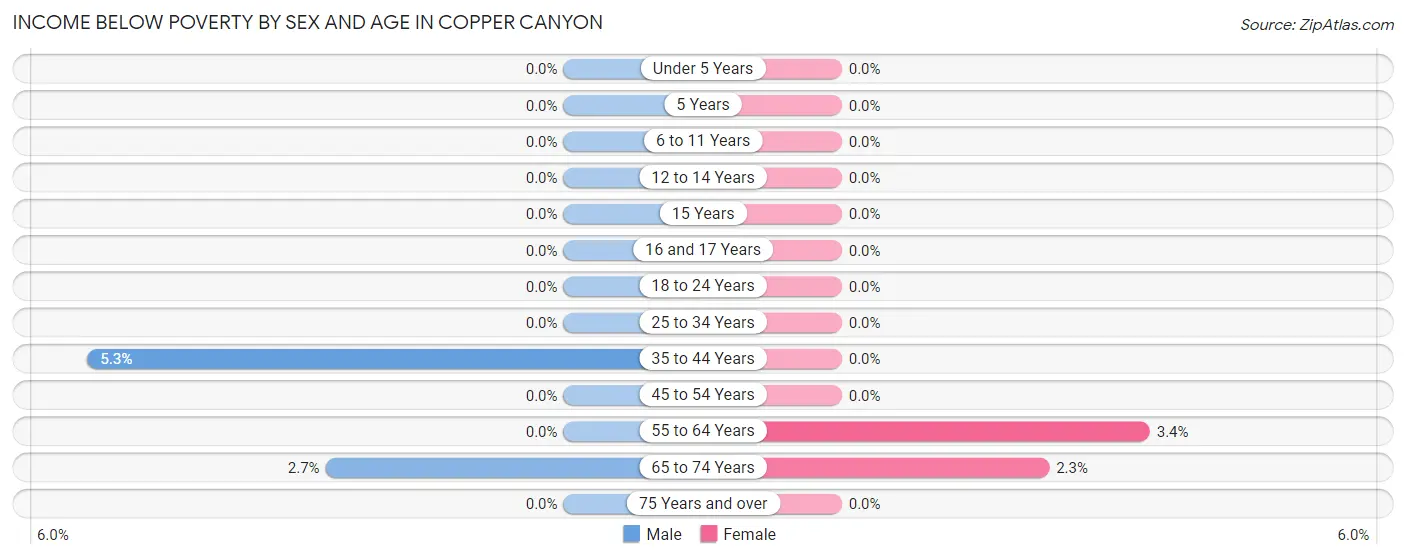
| Age Bracket | Male | Female |
| Under 5 Years | 0 (0.0%) | 0 (0.0%) |
| 5 Years | 0 (0.0%) | 0 (0.0%) |
| 6 to 11 Years | 0 (0.0%) | 0 (0.0%) |
| 12 to 14 Years | 0 (0.0%) | 0 (0.0%) |
| 15 Years | 0 (0.0%) | 0 (0.0%) |
| 16 and 17 Years | 0 (0.0%) | 0 (0.0%) |
| 18 to 24 Years | 0 (0.0%) | 0 (0.0%) |
| 25 to 34 Years | 0 (0.0%) | 0 (0.0%) |
| 35 to 44 Years | 8 (5.3%) | 0 (0.0%) |
| 45 to 54 Years | 0 (0.0%) | 0 (0.0%) |
| 55 to 64 Years | 0 (0.0%) | 6 (3.4%) |
| 65 to 74 Years | 4 (2.6%) | 4 (2.3%) |
| 75 Years and over | 0 (0.0%) | 0 (0.0%) |
| Total | 12 (1.2%) | 10 (0.9%) |
Income Above Poverty by Sex and Age in Copper Canyon
According to the poverty statistics in Copper Canyon, males aged under 5 years and females aged under 5 years are the age groups that are most secure financially, with 100.0% of males and 100.0% of females in these age groups living above the poverty line.
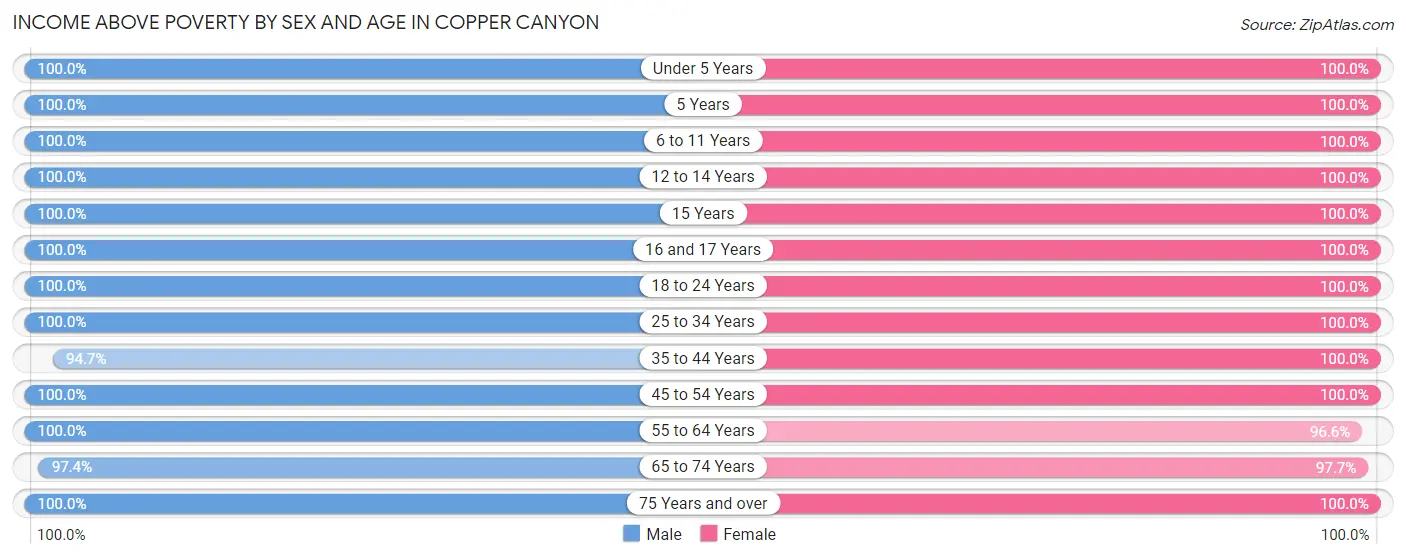
| Age Bracket | Male | Female |
| Under 5 Years | 19 (100.0%) | 28 (100.0%) |
| 5 Years | 8 (100.0%) | 20 (100.0%) |
| 6 to 11 Years | 68 (100.0%) | 30 (100.0%) |
| 12 to 14 Years | 28 (100.0%) | 30 (100.0%) |
| 15 Years | 5 (100.0%) | 71 (100.0%) |
| 16 and 17 Years | 73 (100.0%) | 21 (100.0%) |
| 18 to 24 Years | 31 (100.0%) | 58 (100.0%) |
| 25 to 34 Years | 24 (100.0%) | 42 (100.0%) |
| 35 to 44 Years | 143 (94.7%) | 102 (100.0%) |
| 45 to 54 Years | 124 (100.0%) | 252 (100.0%) |
| 55 to 64 Years | 302 (100.0%) | 169 (96.6%) |
| 65 to 74 Years | 147 (97.4%) | 169 (97.7%) |
| 75 Years and over | 45 (100.0%) | 94 (100.0%) |
| Total | 1,017 (98.8%) | 1,086 (99.1%) |
Income Below Poverty Among Married-Couple Families in Copper Canyon
The poverty statistics for married-couple families in Copper Canyon show that 0.6% or 4 of the total 690 families live below the poverty line. Families with no children have the highest poverty rate of 0.9%, comprising of 4 families. On the other hand, families with 1 or 2 children have the lowest poverty rate of 0.0%, which includes 0 families.
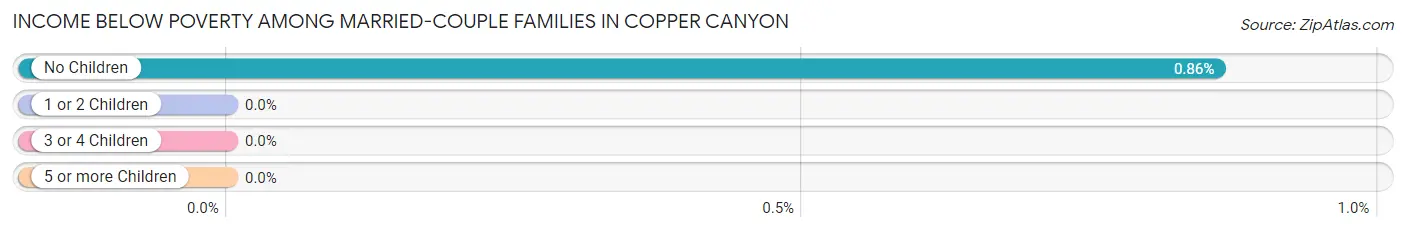
| Children | Above Poverty | Below Poverty |
| No Children | 462 (99.1%) | 4 (0.9%) |
| 1 or 2 Children | 207 (100.0%) | 0 (0.0%) |
| 3 or 4 Children | 17 (100.0%) | 0 (0.0%) |
| 5 or more Children | 0 (0.0%) | 0 (0.0%) |
| Total | 686 (99.4%) | 4 (0.6%) |
Income Below Poverty Among Single-Parent Households in Copper Canyon
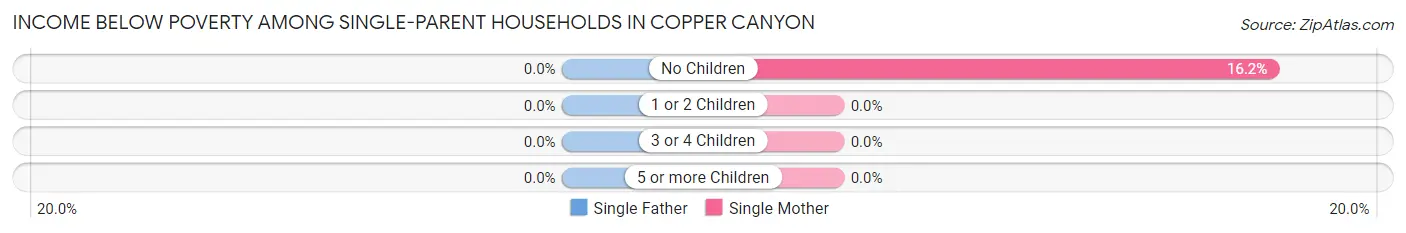
| Children | Single Father | Single Mother |
| No Children | 0 (0.0%) | 6 (16.2%) |
| 1 or 2 Children | 0 (0.0%) | 0 (0.0%) |
| 3 or 4 Children | 0 (0.0%) | 0 (0.0%) |
| 5 or more Children | 0 (0.0%) | 0 (0.0%) |
| Total | 0 (0.0%) | 6 (12.2%) |
Income Below Poverty Among Married-Couple vs Single-Parent Households in Copper Canyon
The poverty data for Copper Canyon shows that 4 of the married-couple family households (0.6%) and 6 of the single-parent households (11.3%) are living below the poverty level. Within the married-couple family households, those with no children have the highest poverty rate, with 4 households (0.9%) falling below the poverty line. Among the single-parent households, those with no children have the highest poverty rate, with 6 household (14.6%) living below poverty.
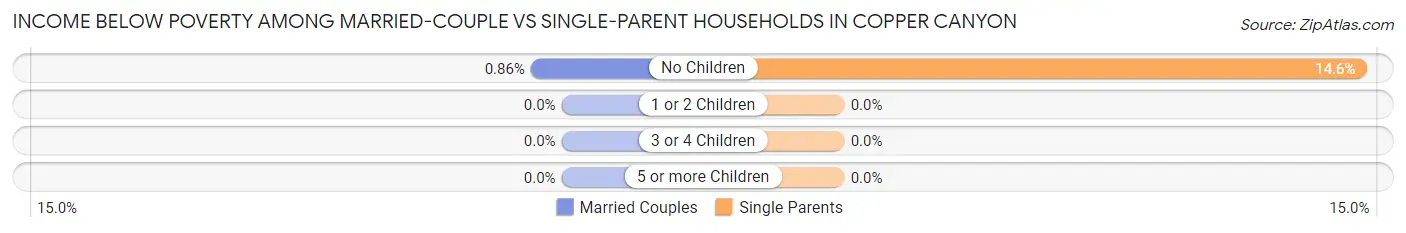
| Children | Married-Couple Families | Single-Parent Households |
| No Children | 4 (0.9%) | 6 (14.6%) |
| 1 or 2 Children | 0 (0.0%) | 0 (0.0%) |
| 3 or 4 Children | 0 (0.0%) | 0 (0.0%) |
| 5 or more Children | 0 (0.0%) | 0 (0.0%) |
| Total | 4 (0.6%) | 6 (11.3%) |
Employment Characteristics in Copper Canyon
Employment by Class of Employer in Copper Canyon
Among the 1,007 employed individuals in Copper Canyon, private company employees (657 | 65.2%), self-employed (incorporated) (211 | 20.9%), and self-employed (not incorporated) (64 | 6.4%) make up the most common classes of employment.
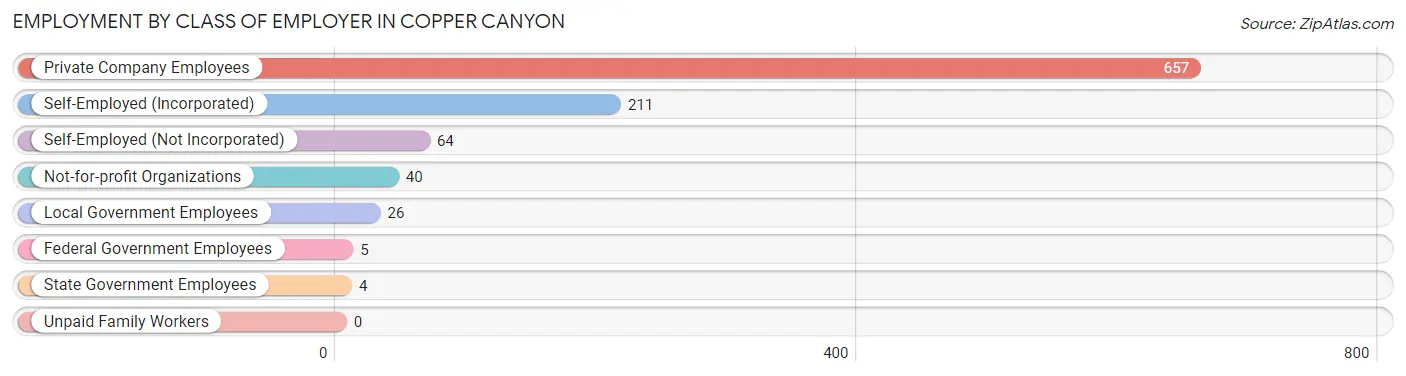
| Employer Class | # Employees | % Employees |
| Private Company Employees | 657 | 65.2% |
| Self-Employed (Incorporated) | 211 | 20.9% |
| Self-Employed (Not Incorporated) | 64 | 6.4% |
| Not-for-profit Organizations | 40 | 4.0% |
| Local Government Employees | 26 | 2.6% |
| State Government Employees | 4 | 0.4% |
| Federal Government Employees | 5 | 0.5% |
| Unpaid Family Workers | 0 | 0.0% |
| Total | 1,007 | 100.0% |
Employment Status by Age in Copper Canyon
According to the labor force statistics for Copper Canyon, out of the total population over 16 years of age (1,818), 61.2% or 1,113 individuals are in the labor force, with 6.3% or 70 of them unemployed. The age group with the highest labor force participation rate is 20 to 24 years, with 100.0% or 63 individuals in the labor force. Within the labor force, the 30 to 34 years age range has the highest percentage of unemployed individuals, with 20.0% or 9 of them being unemployed.
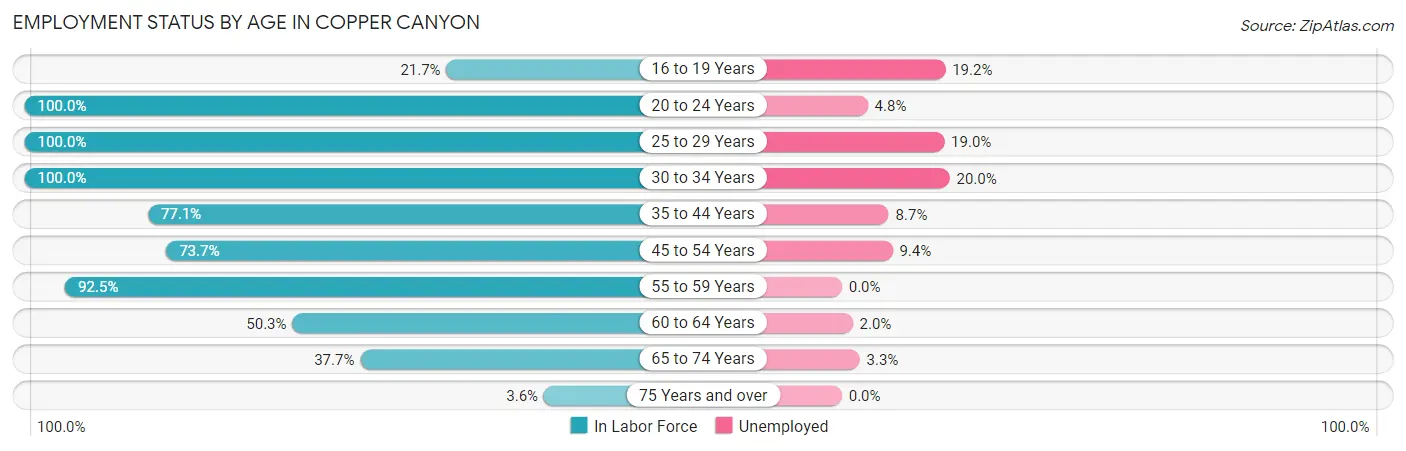
| Age Bracket | In Labor Force | Unemployed |
| 16 to 19 Years | 26 (21.7%) | 5 (19.2%) |
| 20 to 24 Years | 63 (100.0%) | 3 (4.8%) |
| 25 to 29 Years | 21 (100.0%) | 4 (19.0%) |
| 30 to 34 Years | 45 (100.0%) | 9 (20.0%) |
| 35 to 44 Years | 195 (77.1%) | 17 (8.7%) |
| 45 to 54 Years | 277 (73.7%) | 26 (9.4%) |
| 55 to 59 Years | 259 (92.5%) | 0 (0.0%) |
| 60 to 64 Years | 99 (50.3%) | 2 (2.0%) |
| 65 to 74 Years | 122 (37.7%) | 4 (3.3%) |
| 75 Years and over | 5 (3.6%) | 0 (0.0%) |
| Total | 1,113 (61.2%) | 70 (6.3%) |
Employment Status by Educational Attainment in Copper Canyon
According to labor force statistics for Copper Canyon, 76.5% of individuals (897) out of the total population between 25 and 64 years of age (1,172) are in the labor force, with 6.5% or 58 of them being unemployed. The group with the highest labor force participation rate are those with the educational attainment of college / associate degree, with 81.1% or 215 individuals in the labor force. Within the labor force, individuals with high school diploma education have the highest percentage of unemployment, with 12.9% or 17 of them being unemployed.
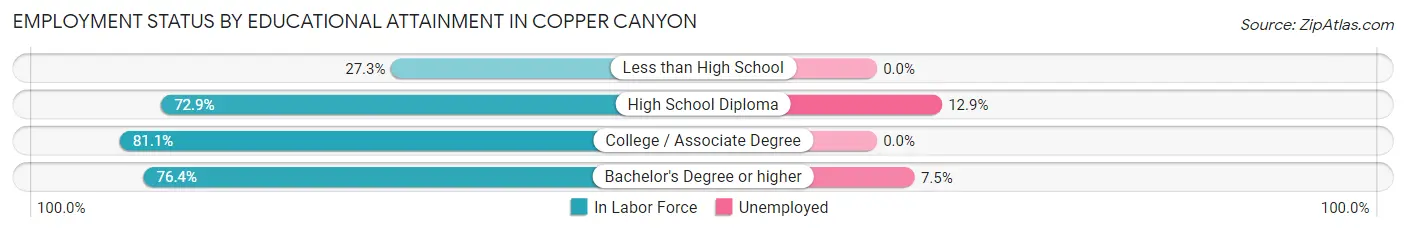
| Educational Attainment | In Labor Force | Unemployed |
| Less than High School | 3 (27.3%) | 0 (0.0%) |
| High School Diploma | 132 (72.9%) | 23 (12.9%) |
| College / Associate Degree | 215 (81.1%) | 0 (0.0%) |
| Bachelor's Degree or higher | 546 (76.4%) | 54 (7.5%) |
| Total | 897 (76.5%) | 76 (6.5%) |
Employment Occupations by Sex in Copper Canyon
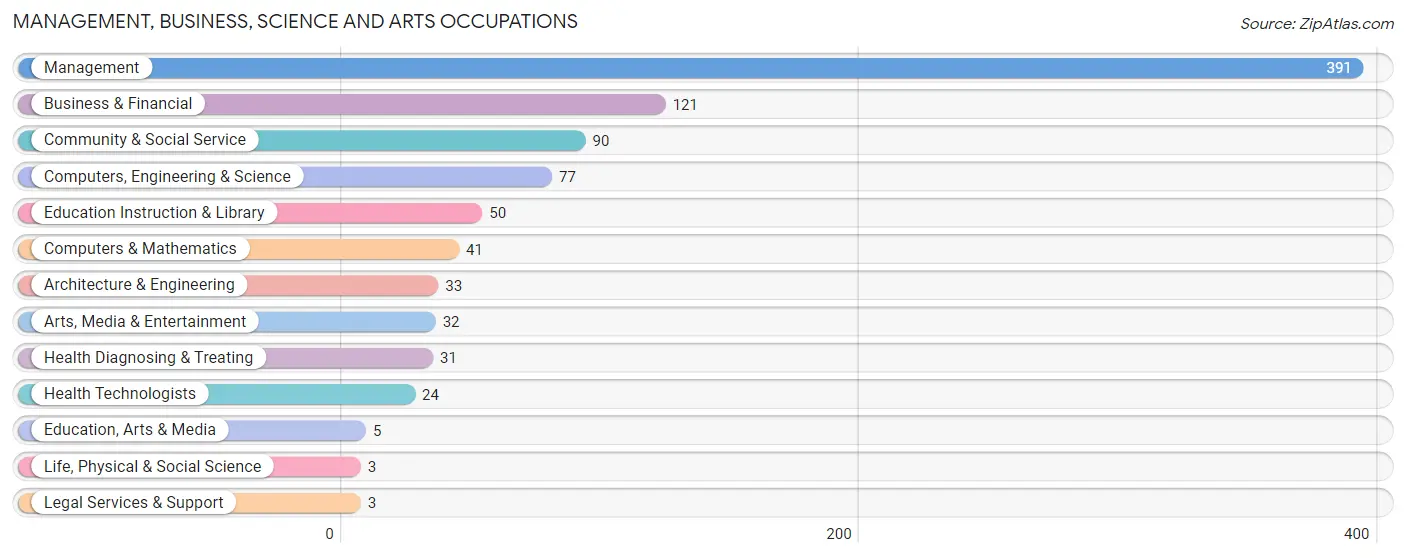
Management, Business, Science and Arts Occupations
The most common Management, Business, Science and Arts occupations in Copper Canyon are Management (391 | 37.5%), Business & Financial (121 | 11.6%), Community & Social Service (90 | 8.6%), Computers, Engineering & Science (77 | 7.4%), and Education Instruction & Library (50 | 4.8%).
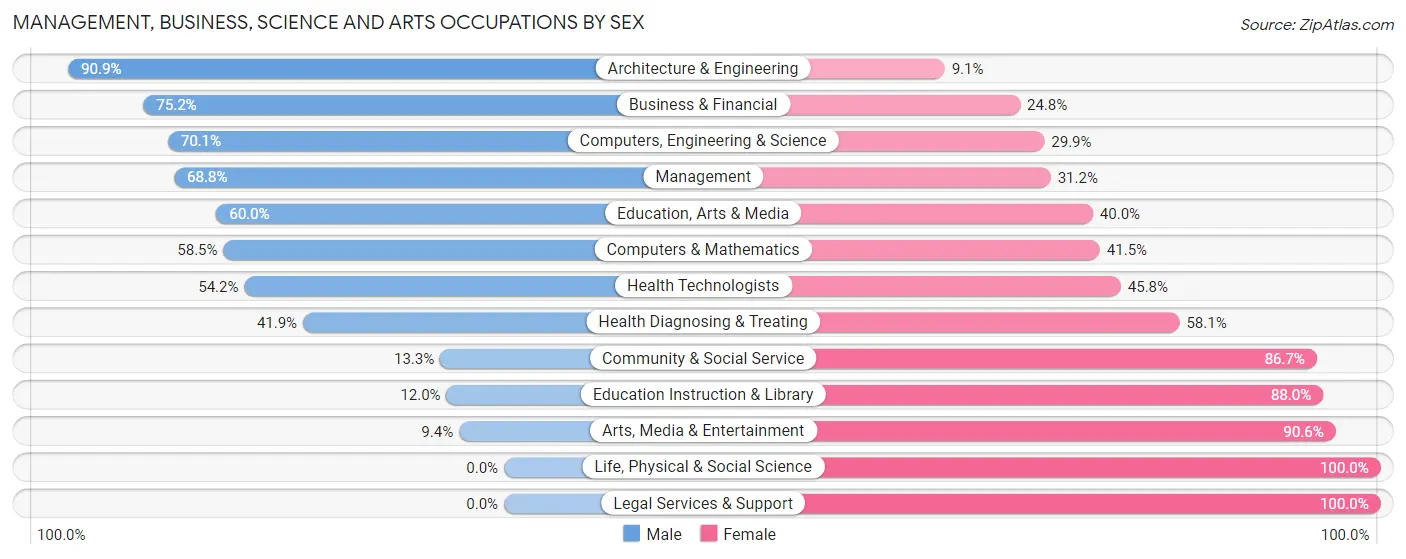
Management, Business, Science and Arts Occupations by Sex
Within the Management, Business, Science and Arts occupations in Copper Canyon, the most male-oriented occupations are Architecture & Engineering (90.9%), Business & Financial (75.2%), and Computers, Engineering & Science (70.1%), while the most female-oriented occupations are Life, Physical & Social Science (100.0%), Legal Services & Support (100.0%), and Arts, Media & Entertainment (90.6%).
| Occupation | Male | Female |
| Management | 269 (68.8%) | 122 (31.2%) |
| Business & Financial | 91 (75.2%) | 30 (24.8%) |
| Computers, Engineering & Science | 54 (70.1%) | 23 (29.9%) |
| Computers & Mathematics | 24 (58.5%) | 17 (41.5%) |
| Architecture & Engineering | 30 (90.9%) | 3 (9.1%) |
| Life, Physical & Social Science | 0 (0.0%) | 3 (100.0%) |
| Community & Social Service | 12 (13.3%) | 78 (86.7%) |
| Education, Arts & Media | 3 (60.0%) | 2 (40.0%) |
| Legal Services & Support | 0 (0.0%) | 3 (100.0%) |
| Education Instruction & Library | 6 (12.0%) | 44 (88.0%) |
| Arts, Media & Entertainment | 3 (9.4%) | 29 (90.6%) |
| Health Diagnosing & Treating | 13 (41.9%) | 18 (58.1%) |
| Health Technologists | 13 (54.2%) | 11 (45.8%) |
| Total (Category) | 439 (61.8%) | 271 (38.2%) |
| Total (Overall) | 610 (58.5%) | 432 (41.5%) |
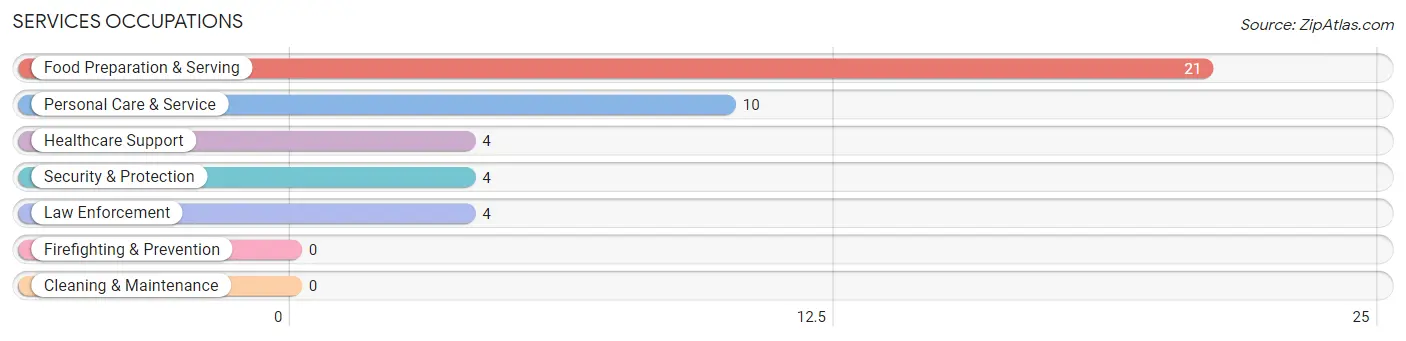
Services Occupations
The most common Services occupations in Copper Canyon are Food Preparation & Serving (21 | 2.0%), Personal Care & Service (10 | 1.0%), Healthcare Support (4 | 0.4%), Security & Protection (4 | 0.4%), and Law Enforcement (4 | 0.4%).
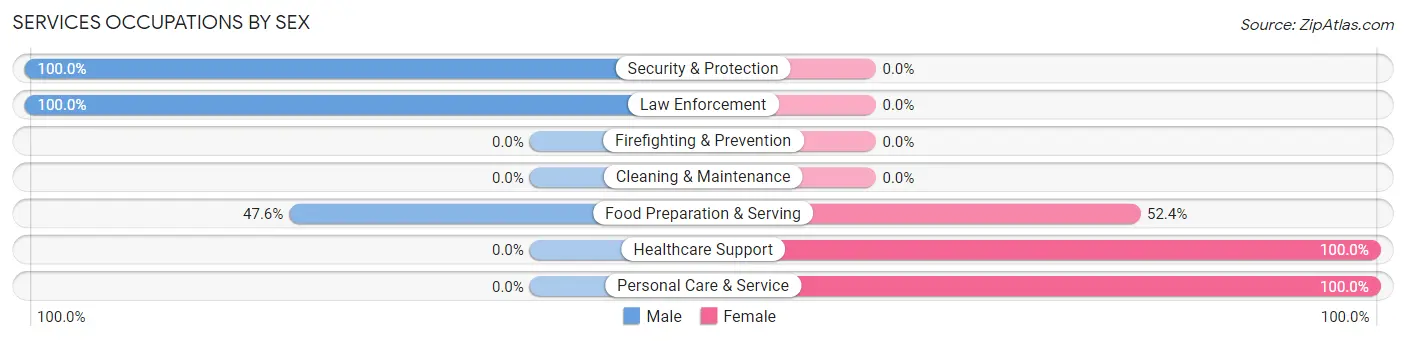
Services Occupations by Sex
Within the Services occupations in Copper Canyon, the most male-oriented occupations are Security & Protection (100.0%), Law Enforcement (100.0%), and Food Preparation & Serving (47.6%), while the most female-oriented occupations are Healthcare Support (100.0%), Personal Care & Service (100.0%), and Food Preparation & Serving (52.4%).
| Occupation | Male | Female |
| Healthcare Support | 0 (0.0%) | 4 (100.0%) |
| Security & Protection | 4 (100.0%) | 0 (0.0%) |
| Firefighting & Prevention | 0 (0.0%) | 0 (0.0%) |
| Law Enforcement | 4 (100.0%) | 0 (0.0%) |
| Food Preparation & Serving | 10 (47.6%) | 11 (52.4%) |
| Cleaning & Maintenance | 0 (0.0%) | 0 (0.0%) |
| Personal Care & Service | 0 (0.0%) | 10 (100.0%) |
| Total (Category) | 14 (35.9%) | 25 (64.1%) |
| Total (Overall) | 610 (58.5%) | 432 (41.5%) |
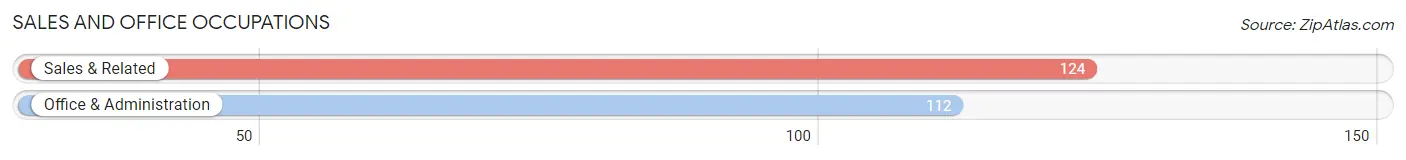
Sales and Office Occupations
The most common Sales and Office occupations in Copper Canyon are Sales & Related (124 | 11.9%), and Office & Administration (112 | 10.7%).
Sales and Office Occupations by Sex
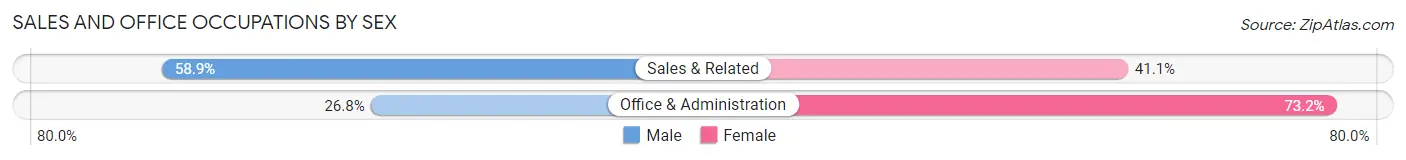
| Occupation | Male | Female |
| Sales & Related | 73 (58.9%) | 51 (41.1%) |
| Office & Administration | 30 (26.8%) | 82 (73.2%) |
| Total (Category) | 103 (43.6%) | 133 (56.4%) |
| Total (Overall) | 610 (58.5%) | 432 (41.5%) |
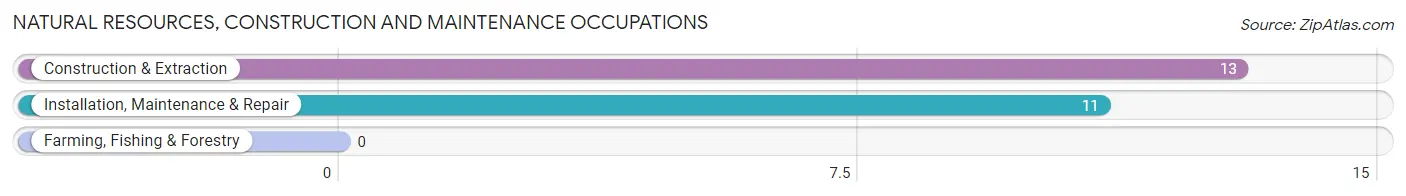
Natural Resources, Construction and Maintenance Occupations
The most common Natural Resources, Construction and Maintenance occupations in Copper Canyon are Construction & Extraction (13 | 1.3%), and Installation, Maintenance & Repair (11 | 1.1%).
Natural Resources, Construction and Maintenance Occupations by Sex
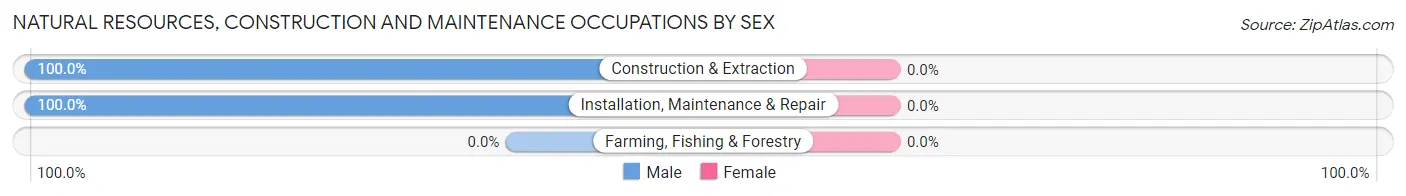
| Occupation | Male | Female |
| Farming, Fishing & Forestry | 0 (0.0%) | 0 (0.0%) |
| Construction & Extraction | 13 (100.0%) | 0 (0.0%) |
| Installation, Maintenance & Repair | 11 (100.0%) | 0 (0.0%) |
| Total (Category) | 24 (100.0%) | 0 (0.0%) |
| Total (Overall) | 610 (58.5%) | 432 (41.5%) |
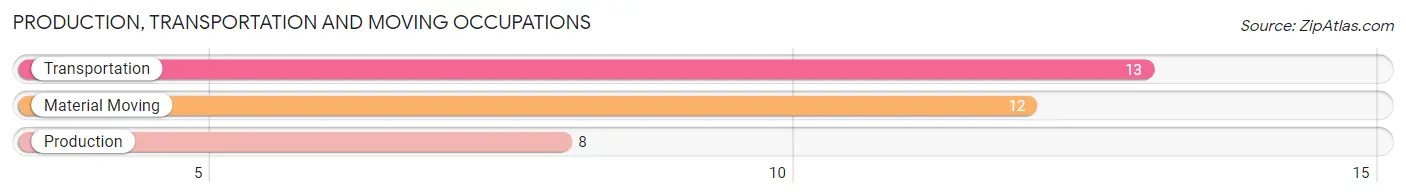
Production, Transportation and Moving Occupations
The most common Production, Transportation and Moving occupations in Copper Canyon are Transportation (13 | 1.3%), Material Moving (12 | 1.1%), and Production (8 | 0.8%).
Production, Transportation and Moving Occupations by Sex
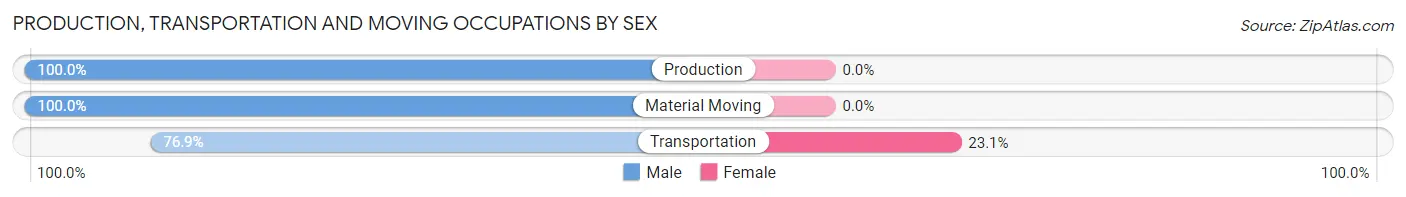
| Occupation | Male | Female |
| Production | 8 (100.0%) | 0 (0.0%) |
| Transportation | 10 (76.9%) | 3 (23.1%) |
| Material Moving | 12 (100.0%) | 0 (0.0%) |
| Total (Category) | 30 (90.9%) | 3 (9.1%) |
| Total (Overall) | 610 (58.5%) | 432 (41.5%) |
Employment Industries by Sex in Copper Canyon
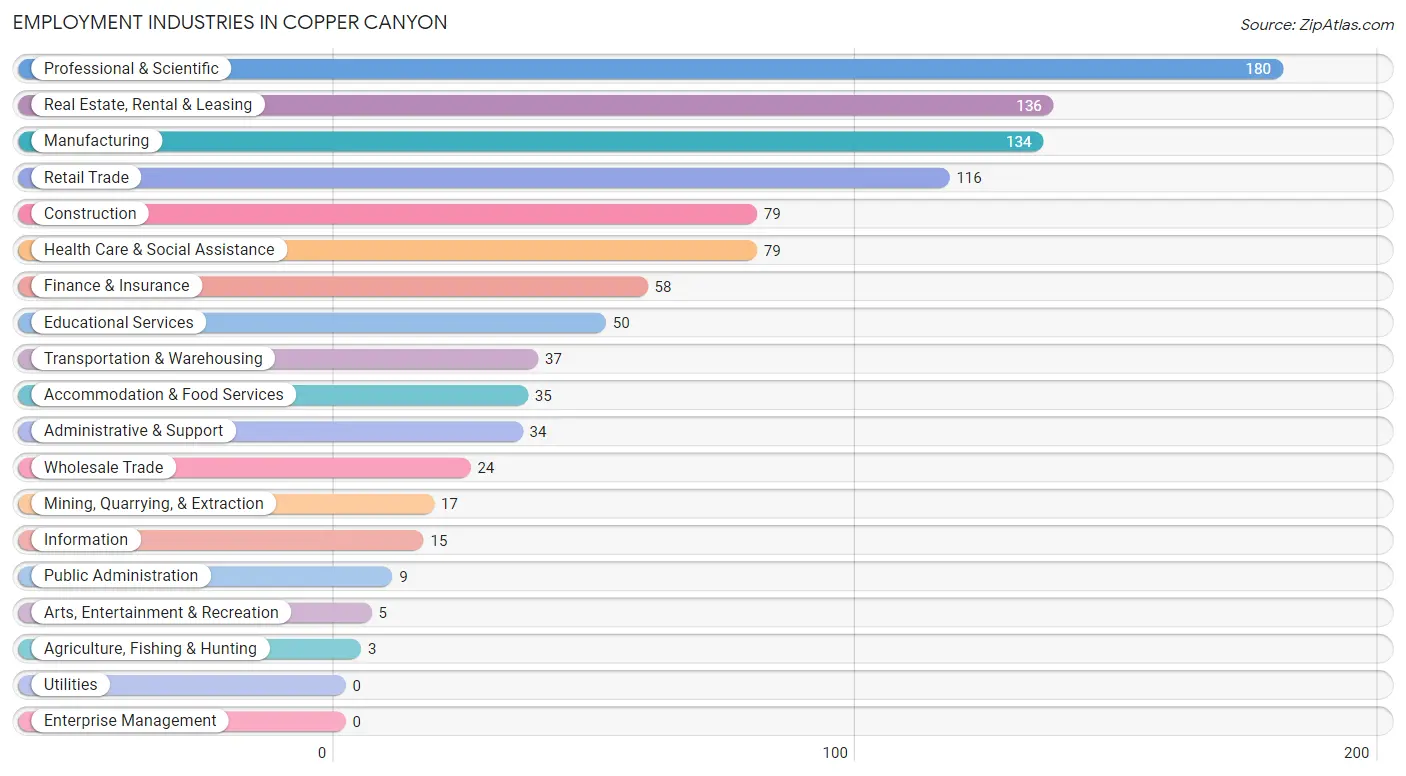
Employment Industries in Copper Canyon
The major employment industries in Copper Canyon include Professional & Scientific (180 | 17.3%), Real Estate, Rental & Leasing (136 | 13.1%), Manufacturing (134 | 12.9%), Retail Trade (116 | 11.1%), and Construction (79 | 7.6%).
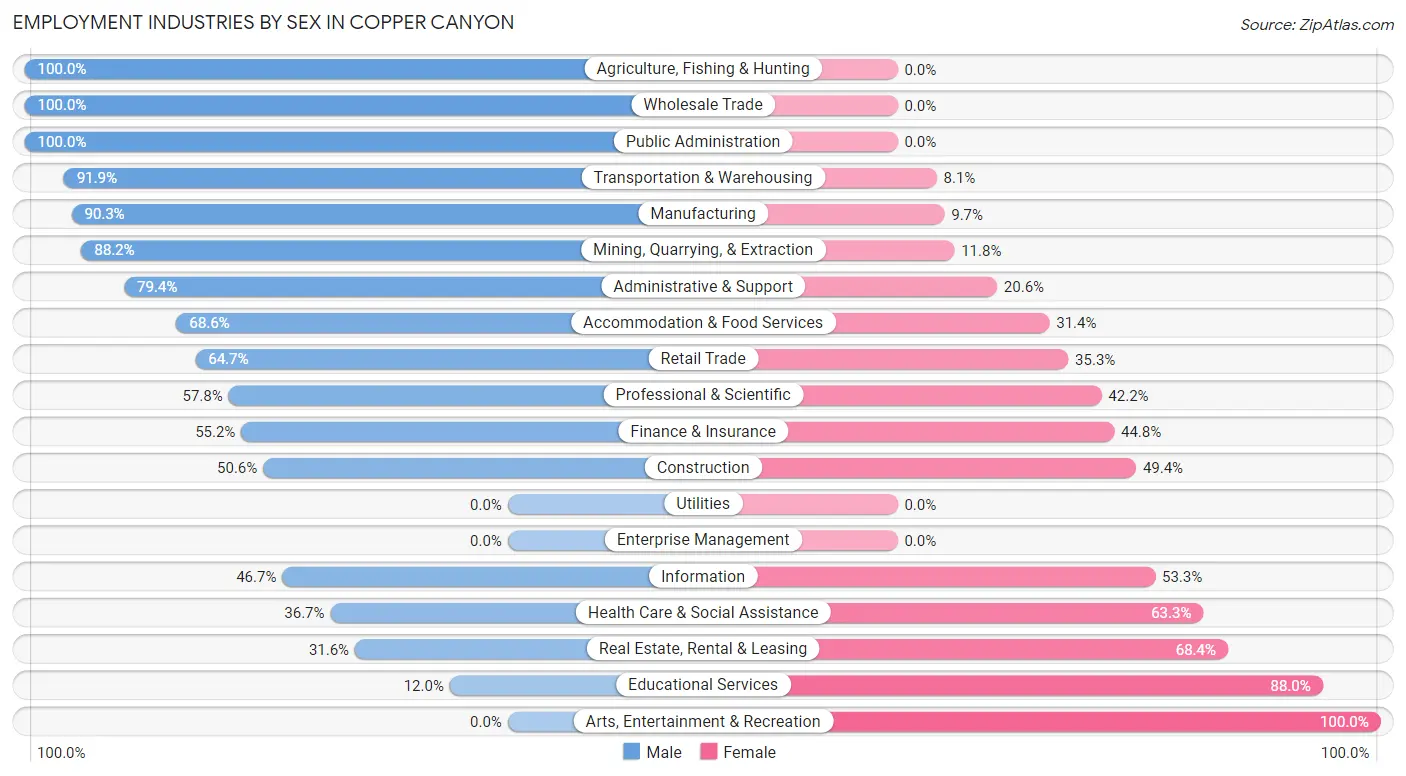
Employment Industries by Sex in Copper Canyon
The Copper Canyon industries that see more men than women are Agriculture, Fishing & Hunting (100.0%), Wholesale Trade (100.0%), and Public Administration (100.0%), whereas the industries that tend to have a higher number of women are Arts, Entertainment & Recreation (100.0%), Educational Services (88.0%), and Real Estate, Rental & Leasing (68.4%).
| Industry | Male | Female |
| Agriculture, Fishing & Hunting | 3 (100.0%) | 0 (0.0%) |
| Mining, Quarrying, & Extraction | 15 (88.2%) | 2 (11.8%) |
| Construction | 40 (50.6%) | 39 (49.4%) |
| Manufacturing | 121 (90.3%) | 13 (9.7%) |
| Wholesale Trade | 24 (100.0%) | 0 (0.0%) |
| Retail Trade | 75 (64.7%) | 41 (35.3%) |
| Transportation & Warehousing | 34 (91.9%) | 3 (8.1%) |
| Utilities | 0 (0.0%) | 0 (0.0%) |
| Information | 7 (46.7%) | 8 (53.3%) |
| Finance & Insurance | 32 (55.2%) | 26 (44.8%) |
| Real Estate, Rental & Leasing | 43 (31.6%) | 93 (68.4%) |
| Professional & Scientific | 104 (57.8%) | 76 (42.2%) |
| Enterprise Management | 0 (0.0%) | 0 (0.0%) |
| Administrative & Support | 27 (79.4%) | 7 (20.6%) |
| Educational Services | 6 (12.0%) | 44 (88.0%) |
| Health Care & Social Assistance | 29 (36.7%) | 50 (63.3%) |
| Arts, Entertainment & Recreation | 0 (0.0%) | 5 (100.0%) |
| Accommodation & Food Services | 24 (68.6%) | 11 (31.4%) |
| Public Administration | 9 (100.0%) | 0 (0.0%) |
| Total | 610 (58.5%) | 432 (41.5%) |
Education in Copper Canyon
School Enrollment in Copper Canyon
The most common levels of schooling among the 415 students in Copper Canyon are high school (177 | 42.6%), middle school (90 | 21.7%), and elementary school (60 | 14.5%).
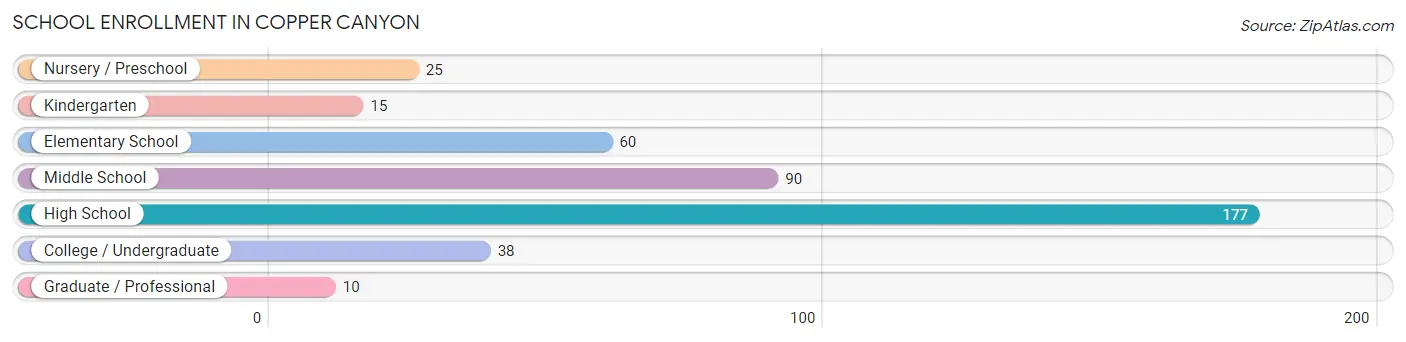
| School Level | # Students | % Students |
| Nursery / Preschool | 25 | 6.0% |
| Kindergarten | 15 | 3.6% |
| Elementary School | 60 | 14.5% |
| Middle School | 90 | 21.7% |
| High School | 177 | 42.6% |
| College / Undergraduate | 38 | 9.2% |
| Graduate / Professional | 10 | 2.4% |
| Total | 415 | 100.0% |
School Enrollment by Age by Funding Source in Copper Canyon
Out of a total of 415 students who are enrolled in schools in Copper Canyon, 153 (36.9%) attend a private institution, while the remaining 262 (63.1%) are enrolled in public schools. The age group of 3 to 4 year olds has the highest likelihood of being enrolled in private schools, with 12 (100.0% in the age bracket) enrolled. Conversely, the age group of 18 to 19 year olds has the lowest likelihood of being enrolled in a private school, with 22 (100.0% in the age bracket) attending a public institution.
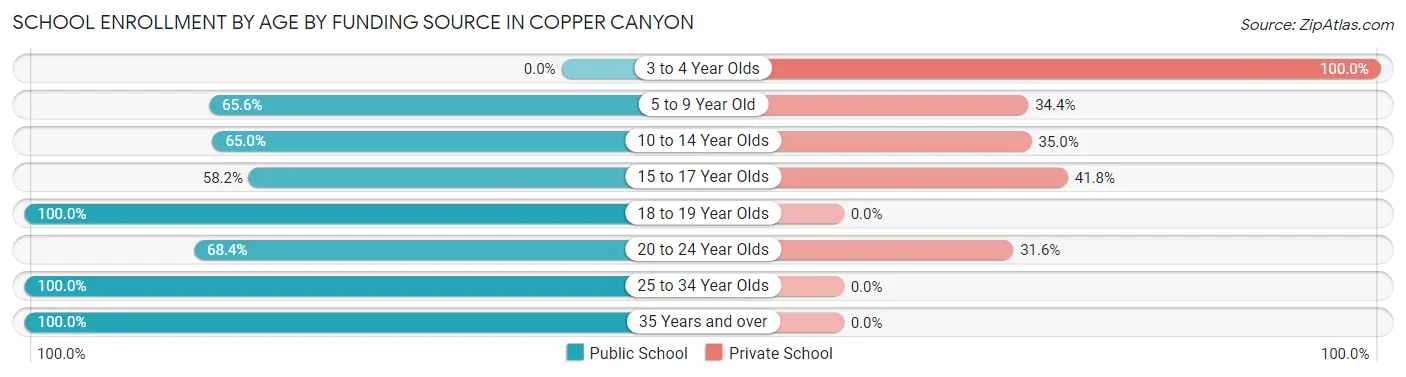
| Age Bracket | Public School | Private School |
| 3 to 4 Year Olds | 0 (0.0%) | 12 (100.0%) |
| 5 to 9 Year Old | 42 (65.6%) | 22 (34.4%) |
| 10 to 14 Year Olds | 78 (65.0%) | 42 (35.0%) |
| 15 to 17 Year Olds | 99 (58.2%) | 71 (41.8%) |
| 18 to 19 Year Olds | 22 (100.0%) | 0 (0.0%) |
| 20 to 24 Year Olds | 13 (68.4%) | 6 (31.6%) |
| 25 to 34 Year Olds | 4 (100.0%) | 0 (0.0%) |
| 35 Years and over | 4 (100.0%) | 0 (0.0%) |
| Total | 262 (63.1%) | 153 (36.9%) |
Educational Attainment by Field of Study in Copper Canyon
Business (406 | 39.1%), engineering (146 | 14.1%), communications (73 | 7.0%), psychology (69 | 6.6%), and science & technology (63 | 6.1%) are the most common fields of study among 1,039 individuals in Copper Canyon who have obtained a bachelor's degree or higher.
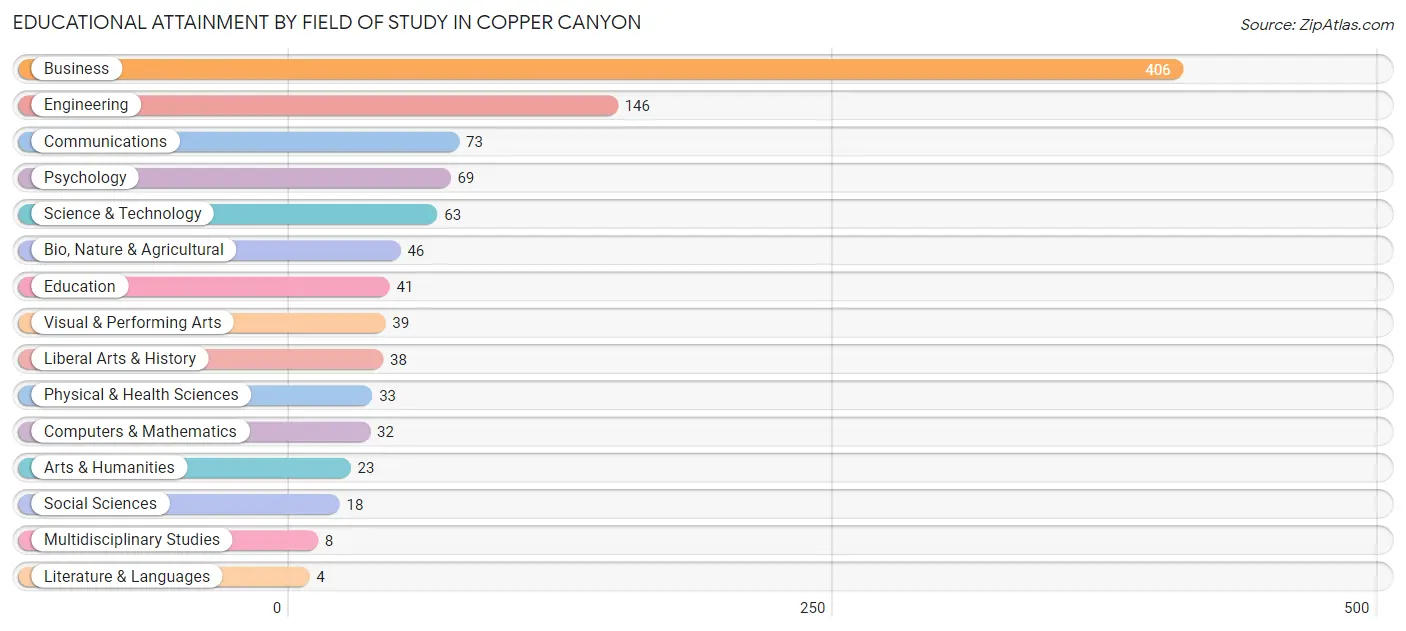
| Field of Study | # Graduates | % Graduates |
| Computers & Mathematics | 32 | 3.1% |
| Bio, Nature & Agricultural | 46 | 4.4% |
| Physical & Health Sciences | 33 | 3.2% |
| Psychology | 69 | 6.6% |
| Social Sciences | 18 | 1.7% |
| Engineering | 146 | 14.1% |
| Multidisciplinary Studies | 8 | 0.8% |
| Science & Technology | 63 | 6.1% |
| Business | 406 | 39.1% |
| Education | 41 | 4.0% |
| Literature & Languages | 4 | 0.4% |
| Liberal Arts & History | 38 | 3.7% |
| Visual & Performing Arts | 39 | 3.7% |
| Communications | 73 | 7.0% |
| Arts & Humanities | 23 | 2.2% |
| Total | 1,039 | 100.0% |
Transportation & Commute in Copper Canyon
Vehicle Availability by Sex in Copper Canyon
The most prevalent vehicle ownership categories in Copper Canyon are males with 2 vehicles (263, accounting for 43.1%) and females with 2 vehicles (138, making up 66.2%).
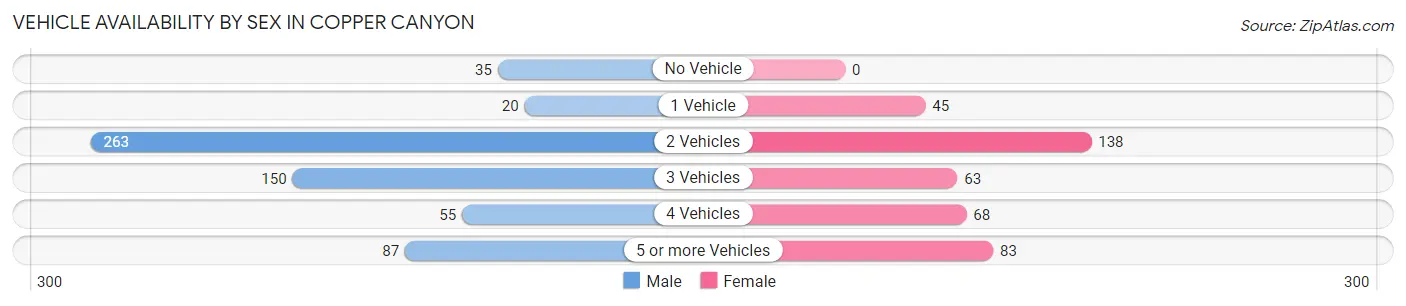
| Vehicles Available | Male | Female |
| No Vehicle | 35 (5.7%) | 0 (0.0%) |
| 1 Vehicle | 20 (3.3%) | 45 (11.3%) |
| 2 Vehicles | 263 (43.1%) | 138 (34.8%) |
| 3 Vehicles | 150 (24.6%) | 63 (15.9%) |
| 4 Vehicles | 55 (9.0%) | 68 (17.1%) |
| 5 or more Vehicles | 87 (14.3%) | 83 (20.9%) |
| Total | 610 (100.0%) | 397 (100.0%) |
Commute Time in Copper Canyon
The most frequently occuring commute durations in Copper Canyon are 20 to 24 minutes (233 commuters, 34.0%), 25 to 29 minutes (92 commuters, 13.4%), and 45 to 59 minutes (74 commuters, 10.8%).
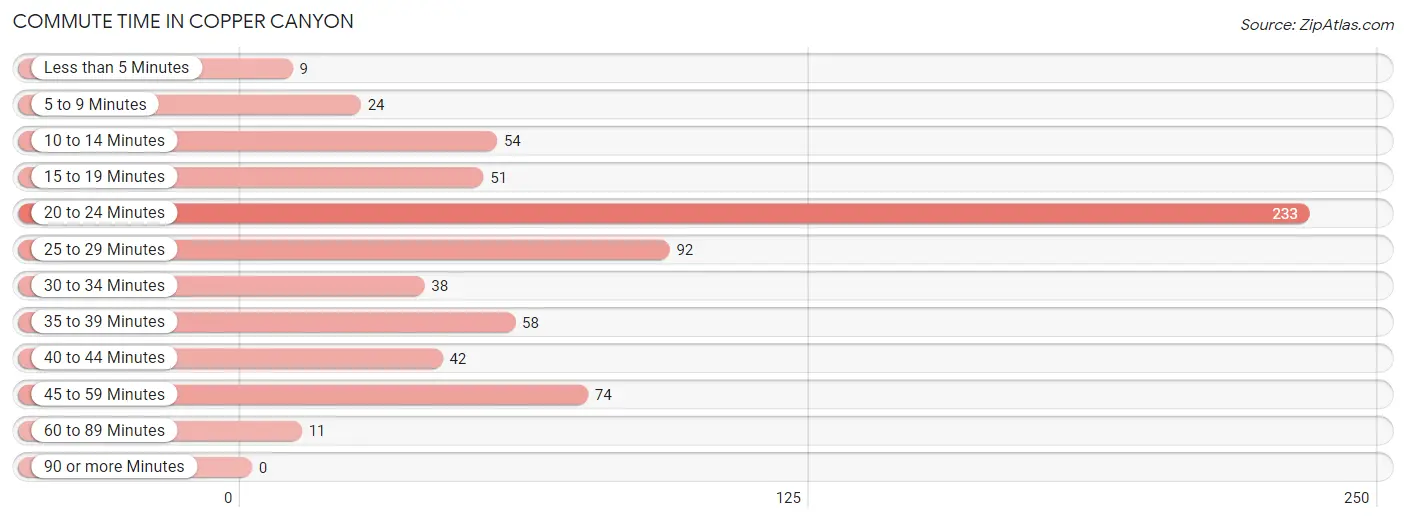
| Commute Time | # Commuters | % Commuters |
| Less than 5 Minutes | 9 | 1.3% |
| 5 to 9 Minutes | 24 | 3.5% |
| 10 to 14 Minutes | 54 | 7.9% |
| 15 to 19 Minutes | 51 | 7.4% |
| 20 to 24 Minutes | 233 | 34.0% |
| 25 to 29 Minutes | 92 | 13.4% |
| 30 to 34 Minutes | 38 | 5.5% |
| 35 to 39 Minutes | 58 | 8.5% |
| 40 to 44 Minutes | 42 | 6.1% |
| 45 to 59 Minutes | 74 | 10.8% |
| 60 to 89 Minutes | 11 | 1.6% |
| 90 or more Minutes | 0 | 0.0% |
Commute Time by Sex in Copper Canyon
The most common commute times in Copper Canyon are 20 to 24 minutes (202 commuters, 44.0%) for males and 25 to 29 minutes (57 commuters, 25.1%) for females.
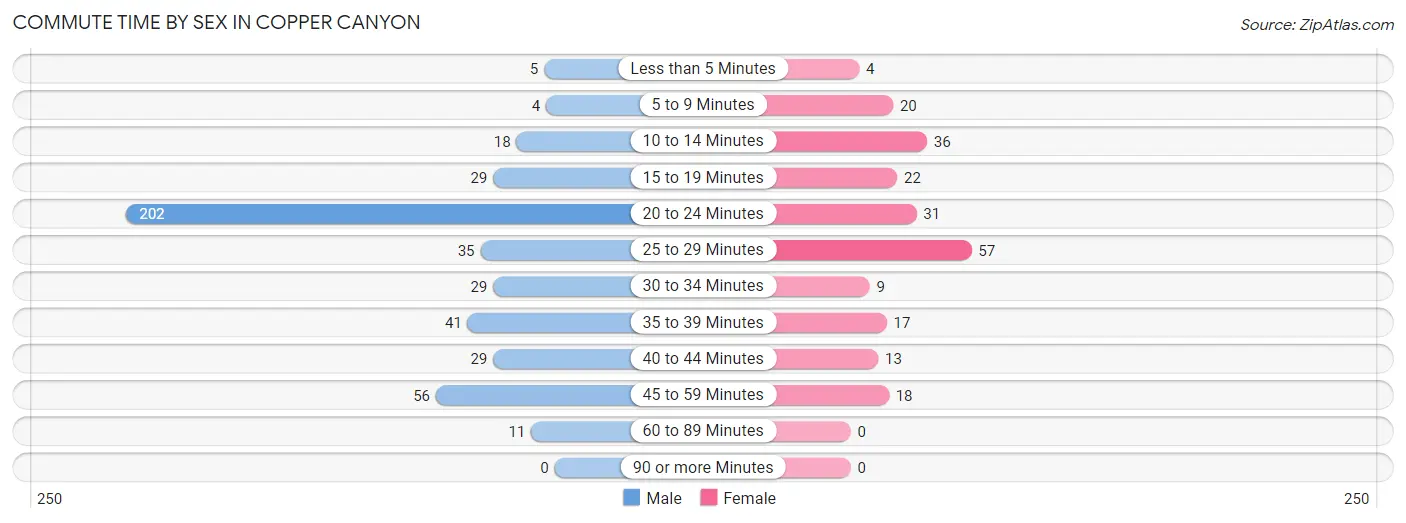
| Commute Time | Male | Female |
| Less than 5 Minutes | 5 (1.1%) | 4 (1.8%) |
| 5 to 9 Minutes | 4 (0.9%) | 20 (8.8%) |
| 10 to 14 Minutes | 18 (3.9%) | 36 (15.9%) |
| 15 to 19 Minutes | 29 (6.3%) | 22 (9.7%) |
| 20 to 24 Minutes | 202 (44.0%) | 31 (13.7%) |
| 25 to 29 Minutes | 35 (7.6%) | 57 (25.1%) |
| 30 to 34 Minutes | 29 (6.3%) | 9 (4.0%) |
| 35 to 39 Minutes | 41 (8.9%) | 17 (7.5%) |
| 40 to 44 Minutes | 29 (6.3%) | 13 (5.7%) |
| 45 to 59 Minutes | 56 (12.2%) | 18 (7.9%) |
| 60 to 89 Minutes | 11 (2.4%) | 0 (0.0%) |
| 90 or more Minutes | 0 (0.0%) | 0 (0.0%) |
Time of Departure to Work by Sex in Copper Canyon
The most frequent times of departure to work in Copper Canyon are 7:30 AM to 7:59 AM (129, 28.1%) for males and 9:00 AM to 9:59 AM (62, 27.3%) for females.
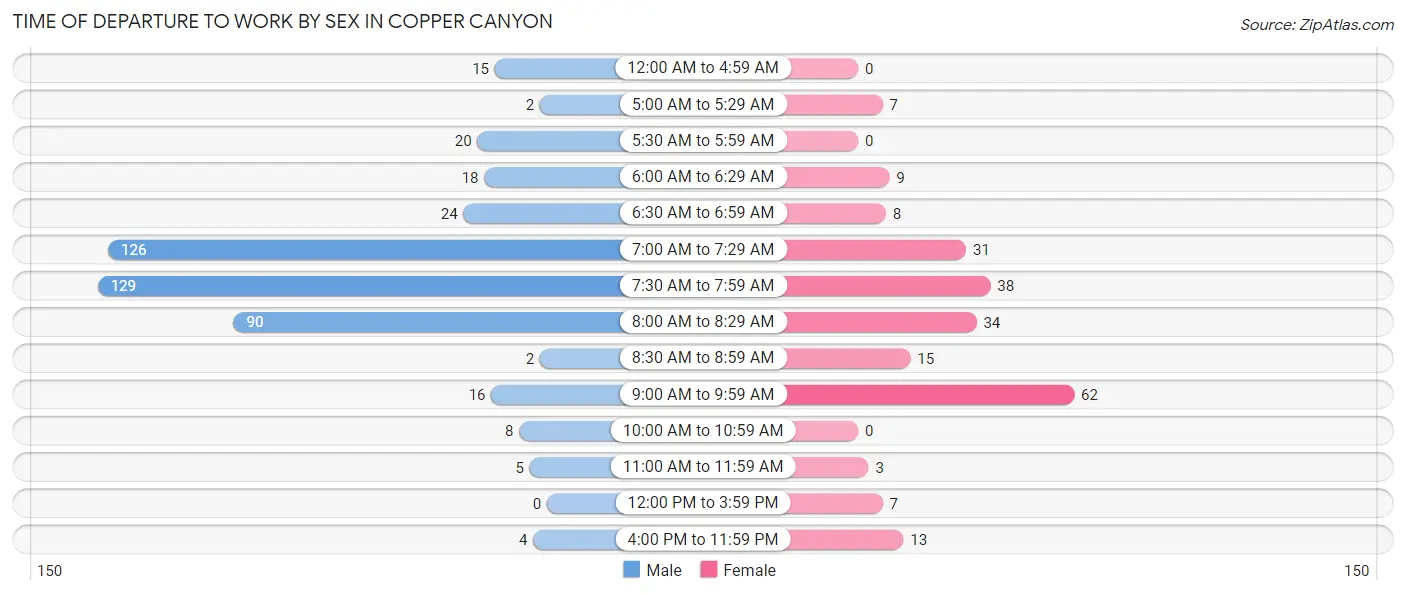
| Time of Departure | Male | Female |
| 12:00 AM to 4:59 AM | 15 (3.3%) | 0 (0.0%) |
| 5:00 AM to 5:29 AM | 2 (0.4%) | 7 (3.1%) |
| 5:30 AM to 5:59 AM | 20 (4.4%) | 0 (0.0%) |
| 6:00 AM to 6:29 AM | 18 (3.9%) | 9 (4.0%) |
| 6:30 AM to 6:59 AM | 24 (5.2%) | 8 (3.5%) |
| 7:00 AM to 7:29 AM | 126 (27.5%) | 31 (13.7%) |
| 7:30 AM to 7:59 AM | 129 (28.1%) | 38 (16.7%) |
| 8:00 AM to 8:29 AM | 90 (19.6%) | 34 (15.0%) |
| 8:30 AM to 8:59 AM | 2 (0.4%) | 15 (6.6%) |
| 9:00 AM to 9:59 AM | 16 (3.5%) | 62 (27.3%) |
| 10:00 AM to 10:59 AM | 8 (1.7%) | 0 (0.0%) |
| 11:00 AM to 11:59 AM | 5 (1.1%) | 3 (1.3%) |
| 12:00 PM to 3:59 PM | 0 (0.0%) | 7 (3.1%) |
| 4:00 PM to 11:59 PM | 4 (0.9%) | 13 (5.7%) |
| Total | 459 (100.0%) | 227 (100.0%) |
Housing Occupancy in Copper Canyon
Occupancy by Ownership in Copper Canyon
Of the total 805 dwellings in Copper Canyon, owner-occupied units account for 773 (96.0%), while renter-occupied units make up 32 (4.0%).
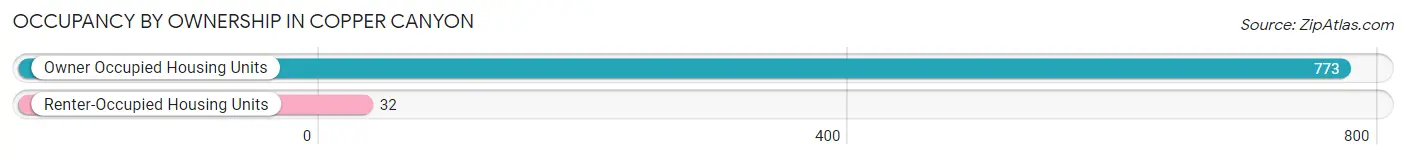
| Occupancy | # Housing Units | % Housing Units |
| Owner Occupied Housing Units | 773 | 96.0% |
| Renter-Occupied Housing Units | 32 | 4.0% |
| Total Occupied Housing Units | 805 | 100.0% |
Occupancy by Household Size in Copper Canyon
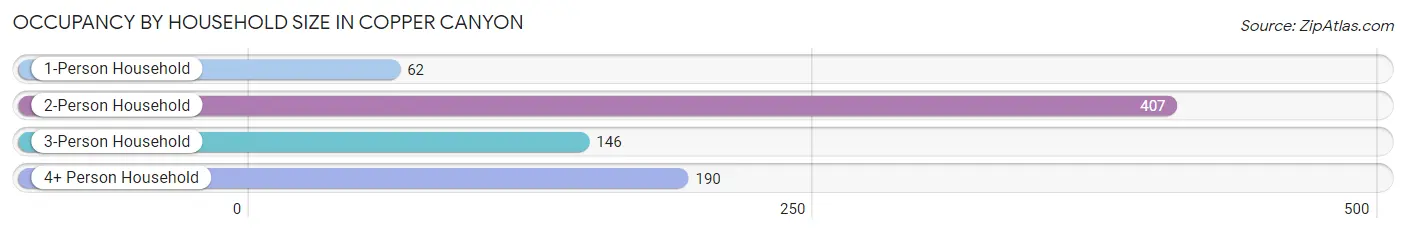
| Household Size | # Housing Units | % Housing Units |
| 1-Person Household | 62 | 7.7% |
| 2-Person Household | 407 | 50.6% |
| 3-Person Household | 146 | 18.1% |
| 4+ Person Household | 190 | 23.6% |
| Total Housing Units | 805 | 100.0% |
Occupancy by Ownership by Household Size in Copper Canyon
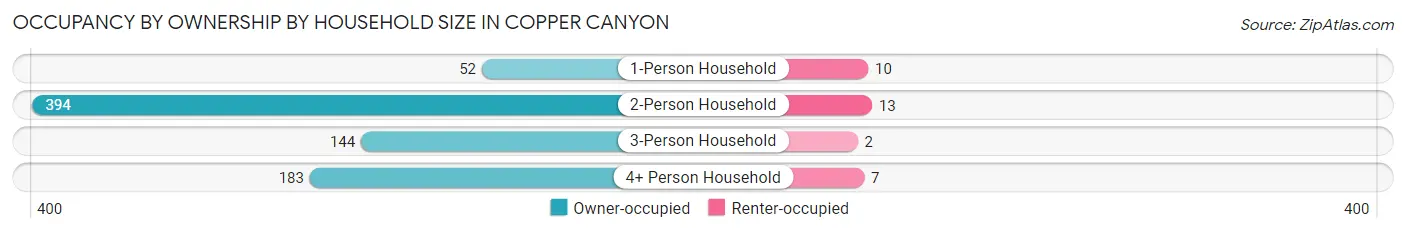
| Household Size | Owner-occupied | Renter-occupied |
| 1-Person Household | 52 (83.9%) | 10 (16.1%) |
| 2-Person Household | 394 (96.8%) | 13 (3.2%) |
| 3-Person Household | 144 (98.6%) | 2 (1.4%) |
| 4+ Person Household | 183 (96.3%) | 7 (3.7%) |
| Total Housing Units | 773 (96.0%) | 32 (4.0%) |
Occupancy by Educational Attainment in Copper Canyon
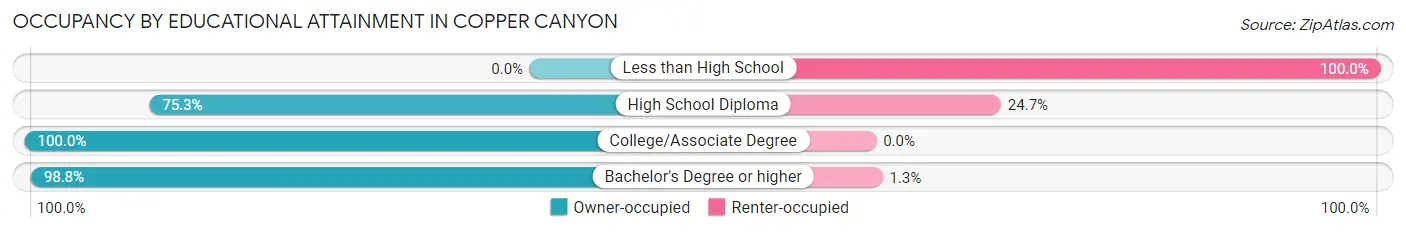
| Household Size | Owner-occupied | Renter-occupied |
| Less than High School | 0 (0.0%) | 3 (100.0%) |
| High School Diploma | 70 (75.3%) | 23 (24.7%) |
| College/Associate Degree | 229 (100.0%) | 0 (0.0%) |
| Bachelor's Degree or higher | 474 (98.8%) | 6 (1.3%) |
Occupancy by Age of Householder in Copper Canyon
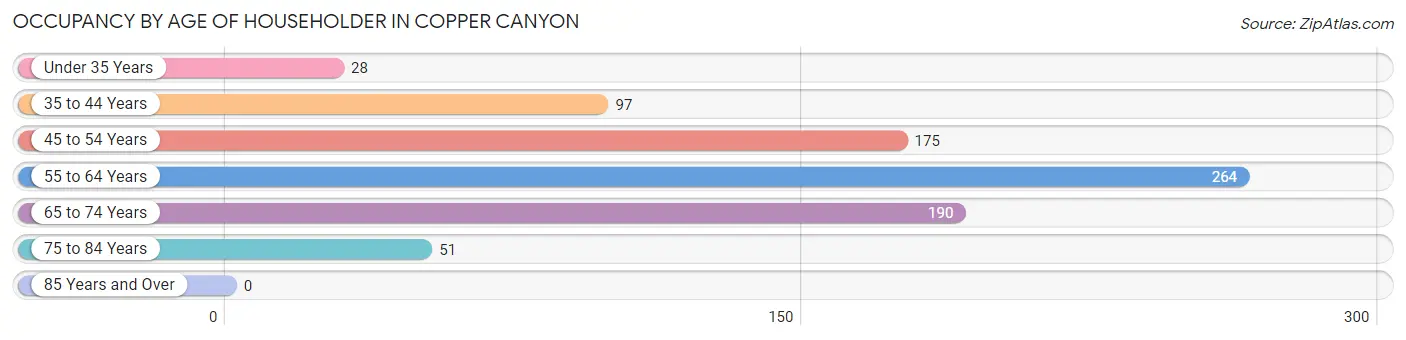
| Age Bracket | # Households | % Households |
| Under 35 Years | 28 | 3.5% |
| 35 to 44 Years | 97 | 12.0% |
| 45 to 54 Years | 175 | 21.7% |
| 55 to 64 Years | 264 | 32.8% |
| 65 to 74 Years | 190 | 23.6% |
| 75 to 84 Years | 51 | 6.3% |
| 85 Years and Over | 0 | 0.0% |
| Total | 805 | 100.0% |
Housing Finances in Copper Canyon
Median Income by Occupancy in Copper Canyon
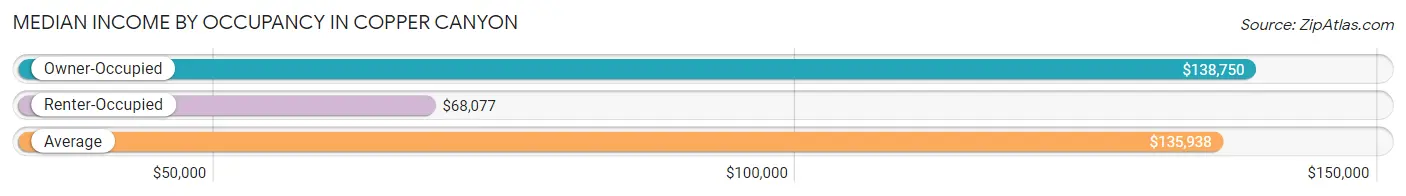
| Occupancy Type | # Households | Median Income |
| Owner-Occupied | 773 (96.0%) | $138,750 |
| Renter-Occupied | 32 (4.0%) | $68,077 |
| Average | 805 (100.0%) | $135,938 |
Occupancy by Householder Income Bracket in Copper Canyon
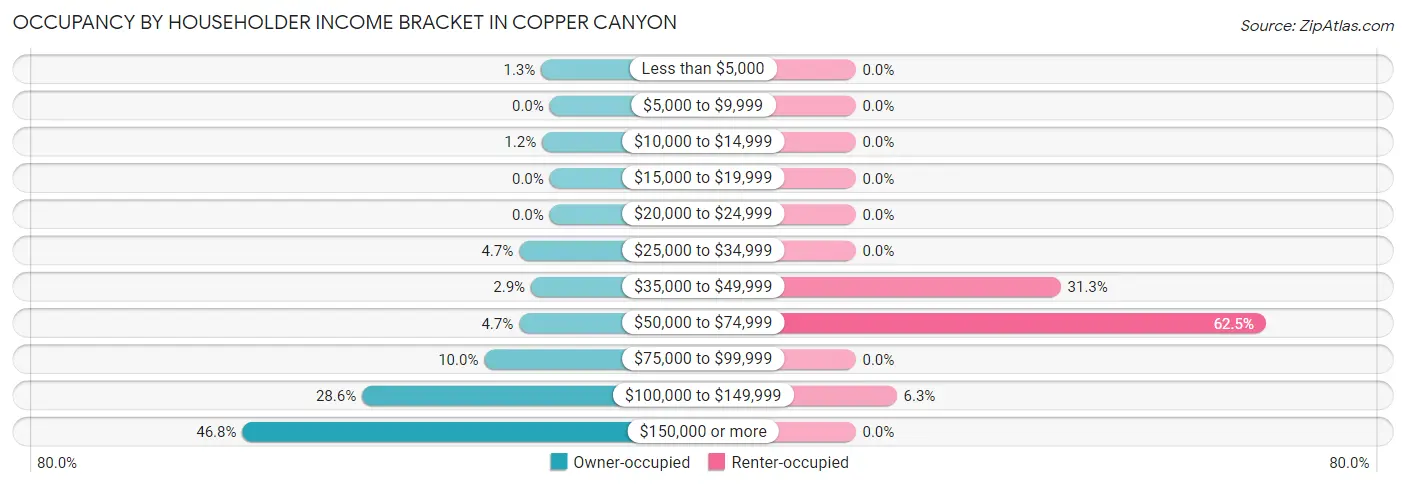
| Income Bracket | Owner-occupied | Renter-occupied |
| Less than $5,000 | 10 (1.3%) | 0 (0.0%) |
| $5,000 to $9,999 | 0 (0.0%) | 0 (0.0%) |
| $10,000 to $14,999 | 9 (1.2%) | 0 (0.0%) |
| $15,000 to $19,999 | 0 (0.0%) | 0 (0.0%) |
| $20,000 to $24,999 | 0 (0.0%) | 0 (0.0%) |
| $25,000 to $34,999 | 36 (4.7%) | 0 (0.0%) |
| $35,000 to $49,999 | 22 (2.9%) | 10 (31.2%) |
| $50,000 to $74,999 | 36 (4.7%) | 20 (62.5%) |
| $75,000 to $99,999 | 77 (10.0%) | 0 (0.0%) |
| $100,000 to $149,999 | 221 (28.6%) | 2 (6.2%) |
| $150,000 or more | 362 (46.8%) | 0 (0.0%) |
| Total | 773 (100.0%) | 32 (100.0%) |
Monthly Housing Cost Tiers in Copper Canyon
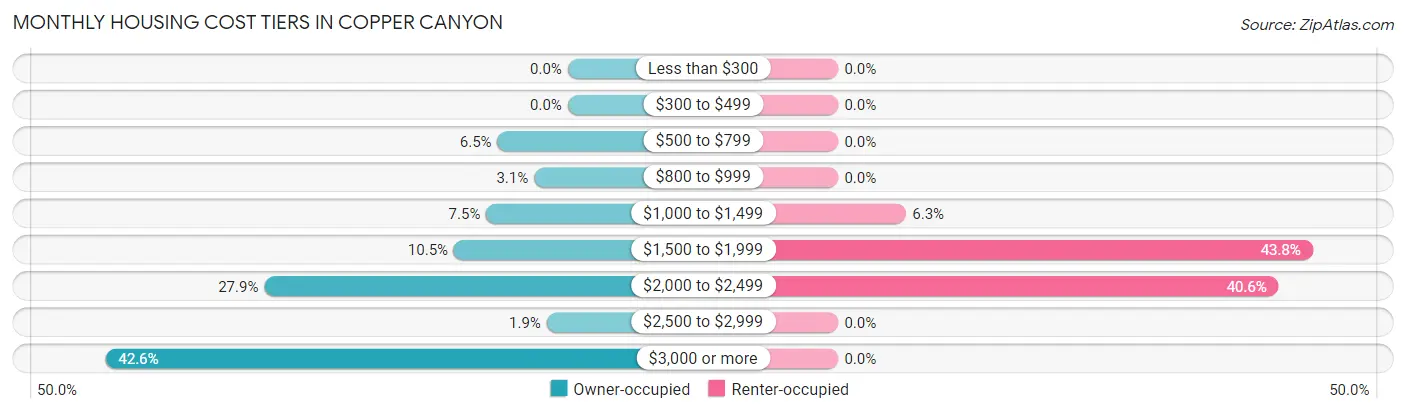
| Monthly Cost | Owner-occupied | Renter-occupied |
| Less than $300 | 0 (0.0%) | 0 (0.0%) |
| $300 to $499 | 0 (0.0%) | 0 (0.0%) |
| $500 to $799 | 50 (6.5%) | 0 (0.0%) |
| $800 to $999 | 24 (3.1%) | 0 (0.0%) |
| $1,000 to $1,499 | 58 (7.5%) | 2 (6.2%) |
| $1,500 to $1,999 | 81 (10.5%) | 14 (43.8%) |
| $2,000 to $2,499 | 216 (27.9%) | 13 (40.6%) |
| $2,500 to $2,999 | 15 (1.9%) | 0 (0.0%) |
| $3,000 or more | 329 (42.6%) | 0 (0.0%) |
| Total | 773 (100.0%) | 32 (100.0%) |
Physical Housing Characteristics in Copper Canyon
Housing Structures in Copper Canyon
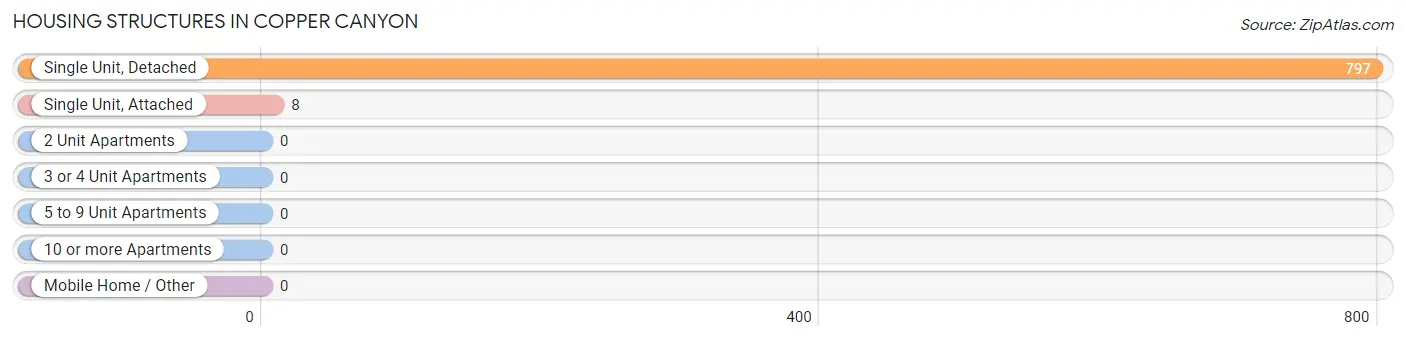
| Structure Type | # Housing Units | % Housing Units |
| Single Unit, Detached | 797 | 99.0% |
| Single Unit, Attached | 8 | 1.0% |
| 2 Unit Apartments | 0 | 0.0% |
| 3 or 4 Unit Apartments | 0 | 0.0% |
| 5 to 9 Unit Apartments | 0 | 0.0% |
| 10 or more Apartments | 0 | 0.0% |
| Mobile Home / Other | 0 | 0.0% |
| Total | 805 | 100.0% |
Housing Structures by Occupancy in Copper Canyon
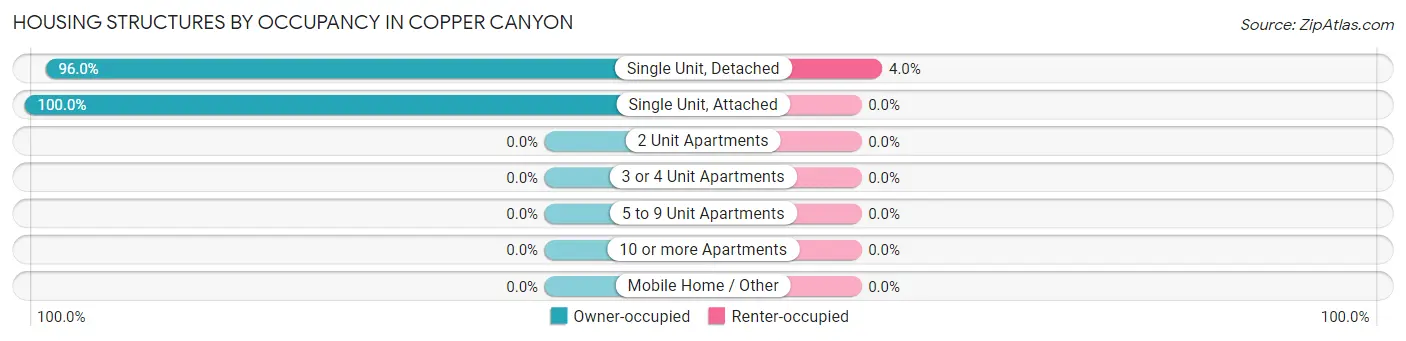
| Structure Type | Owner-occupied | Renter-occupied |
| Single Unit, Detached | 765 (96.0%) | 32 (4.0%) |
| Single Unit, Attached | 8 (100.0%) | 0 (0.0%) |
| 2 Unit Apartments | 0 (0.0%) | 0 (0.0%) |
| 3 or 4 Unit Apartments | 0 (0.0%) | 0 (0.0%) |
| 5 to 9 Unit Apartments | 0 (0.0%) | 0 (0.0%) |
| 10 or more Apartments | 0 (0.0%) | 0 (0.0%) |
| Mobile Home / Other | 0 (0.0%) | 0 (0.0%) |
| Total | 773 (96.0%) | 32 (4.0%) |
Housing Structures by Number of Rooms in Copper Canyon
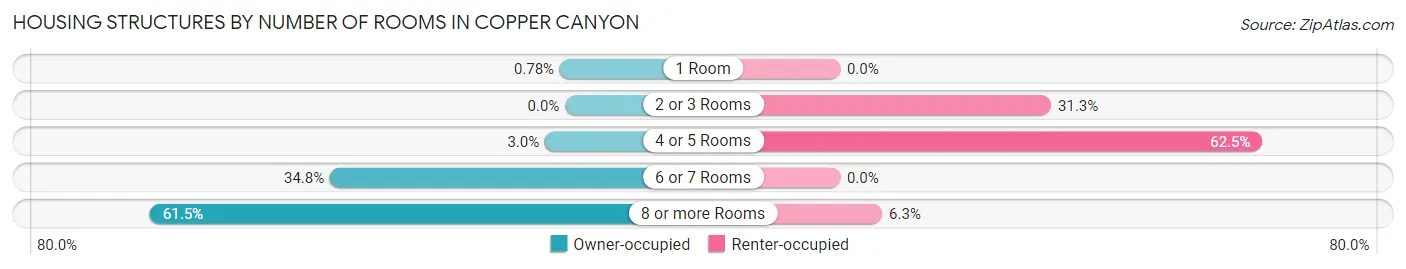
| Number of Rooms | Owner-occupied | Renter-occupied |
| 1 Room | 6 (0.8%) | 0 (0.0%) |
| 2 or 3 Rooms | 0 (0.0%) | 10 (31.2%) |
| 4 or 5 Rooms | 23 (3.0%) | 20 (62.5%) |
| 6 or 7 Rooms | 269 (34.8%) | 0 (0.0%) |
| 8 or more Rooms | 475 (61.5%) | 2 (6.2%) |
| Total | 773 (100.0%) | 32 (100.0%) |
Housing Structure by Heating Type in Copper Canyon
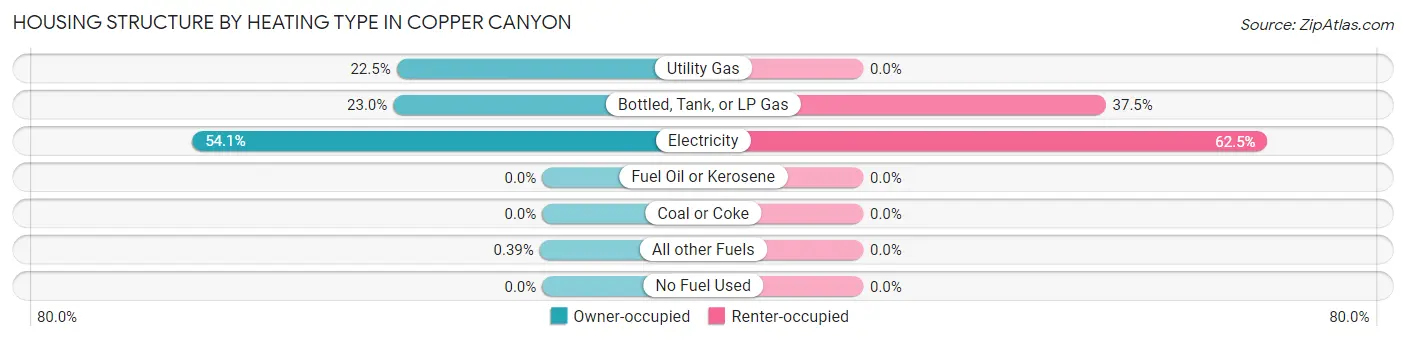
| Heating Type | Owner-occupied | Renter-occupied |
| Utility Gas | 174 (22.5%) | 0 (0.0%) |
| Bottled, Tank, or LP Gas | 178 (23.0%) | 12 (37.5%) |
| Electricity | 418 (54.1%) | 20 (62.5%) |
| Fuel Oil or Kerosene | 0 (0.0%) | 0 (0.0%) |
| Coal or Coke | 0 (0.0%) | 0 (0.0%) |
| All other Fuels | 3 (0.4%) | 0 (0.0%) |
| No Fuel Used | 0 (0.0%) | 0 (0.0%) |
| Total | 773 (100.0%) | 32 (100.0%) |
Household Vehicle Usage in Copper Canyon
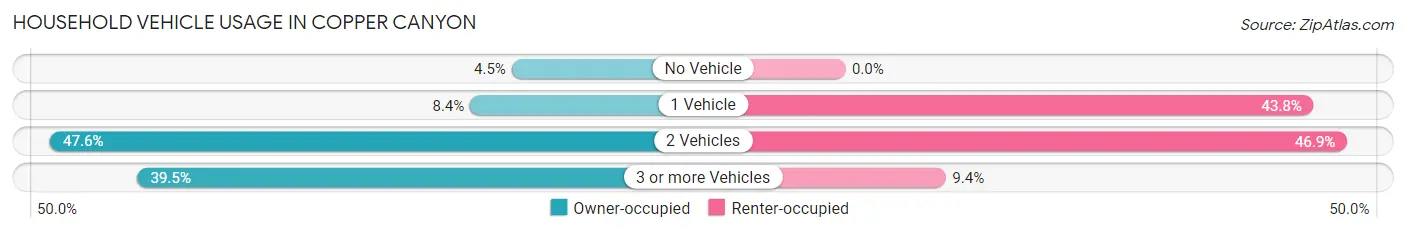
| Vehicles per Household | Owner-occupied | Renter-occupied |
| No Vehicle | 35 (4.5%) | 0 (0.0%) |
| 1 Vehicle | 65 (8.4%) | 14 (43.8%) |
| 2 Vehicles | 368 (47.6%) | 15 (46.9%) |
| 3 or more Vehicles | 305 (39.5%) | 3 (9.4%) |
| Total | 773 (100.0%) | 32 (100.0%) |
Real Estate & Mortgages in Copper Canyon
Real Estate and Mortgage Overview in Copper Canyon
| Characteristic | Without Mortgage | With Mortgage |
| Housing Units | 325 | 448 |
| Median Property Value | $639,100 | $747,400 |
| Median Household Income | $116,841 | $257 |
| Monthly Housing Costs | $1,501 | $324 |
| Real Estate Taxes | $10,001 | $3 |
Property Value by Mortgage Status in Copper Canyon
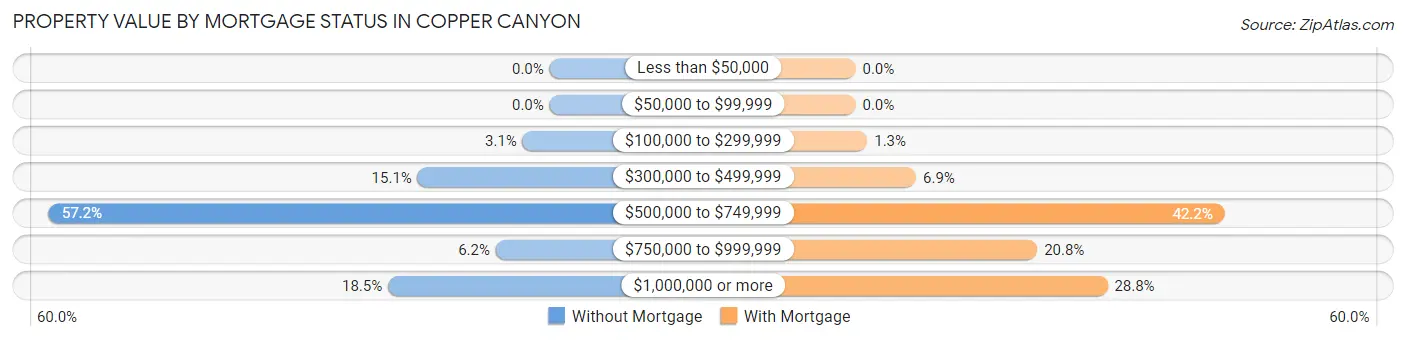
| Property Value | Without Mortgage | With Mortgage |
| Less than $50,000 | 0 (0.0%) | 0 (0.0%) |
| $50,000 to $99,999 | 0 (0.0%) | 0 (0.0%) |
| $100,000 to $299,999 | 10 (3.1%) | 6 (1.3%) |
| $300,000 to $499,999 | 49 (15.1%) | 31 (6.9%) |
| $500,000 to $749,999 | 186 (57.2%) | 189 (42.2%) |
| $750,000 to $999,999 | 20 (6.1%) | 93 (20.8%) |
| $1,000,000 or more | 60 (18.5%) | 129 (28.8%) |
| Total | 325 (100.0%) | 448 (100.0%) |
Household Income by Mortgage Status in Copper Canyon
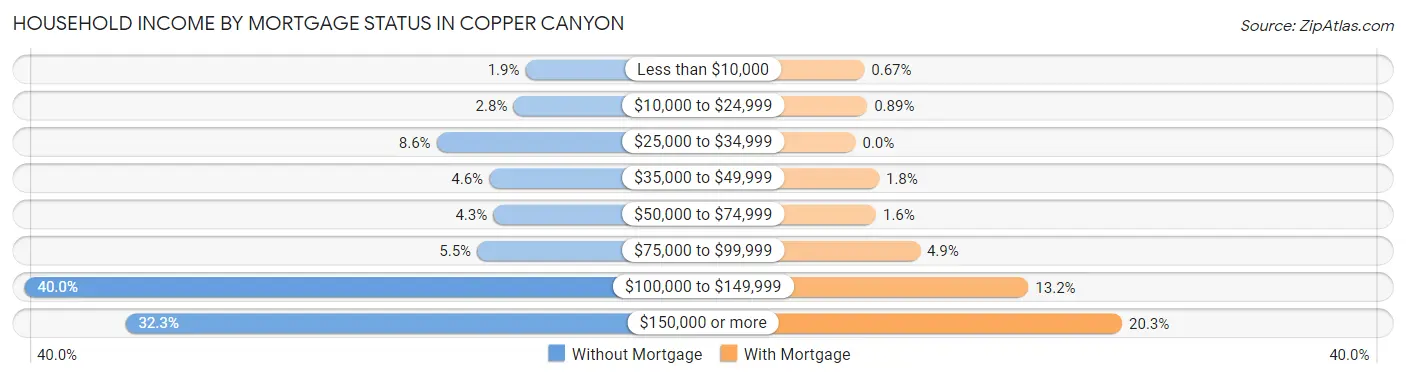
| Household Income | Without Mortgage | With Mortgage |
| Less than $10,000 | 6 (1.8%) | 3 (0.7%) |
| $10,000 to $24,999 | 9 (2.8%) | 4 (0.9%) |
| $25,000 to $34,999 | 28 (8.6%) | 0 (0.0%) |
| $35,000 to $49,999 | 15 (4.6%) | 8 (1.8%) |
| $50,000 to $74,999 | 14 (4.3%) | 7 (1.6%) |
| $75,000 to $99,999 | 18 (5.5%) | 22 (4.9%) |
| $100,000 to $149,999 | 130 (40.0%) | 59 (13.2%) |
| $150,000 or more | 105 (32.3%) | 91 (20.3%) |
| Total | 325 (100.0%) | 448 (100.0%) |
Property Value to Household Income Ratio in Copper Canyon
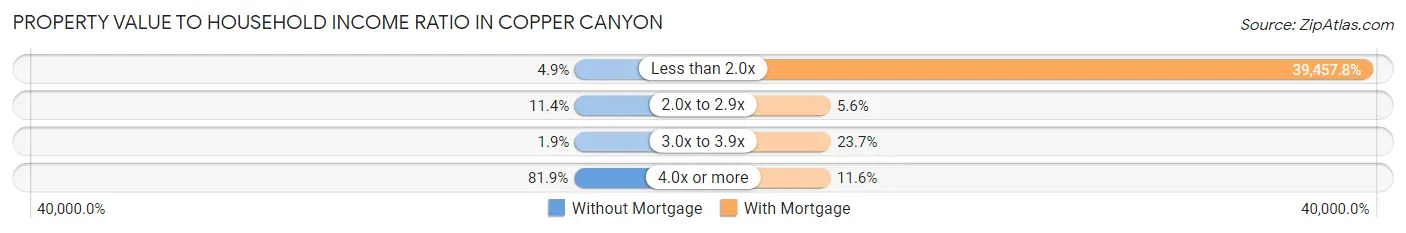
| Value-to-Income Ratio | Without Mortgage | With Mortgage |
| Less than 2.0x | 16 (4.9%) | 176,771 (39,457.8%) |
| 2.0x to 2.9x | 37 (11.4%) | 25 (5.6%) |
| 3.0x to 3.9x | 6 (1.8%) | 106 (23.7%) |
| 4.0x or more | 266 (81.9%) | 52 (11.6%) |
| Total | 325 (100.0%) | 448 (100.0%) |
Real Estate Taxes by Mortgage Status in Copper Canyon
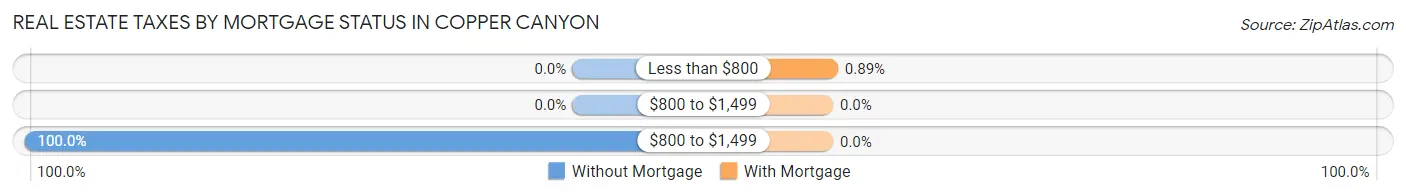
| Property Taxes | Without Mortgage | With Mortgage |
| Less than $800 | 0 (0.0%) | 4 (0.9%) |
| $800 to $1,499 | 0 (0.0%) | 0 (0.0%) |
| $800 to $1,499 | 325 (100.0%) | 0 (0.0%) |
| Total | 325 (100.0%) | 448 (100.0%) |
Health & Disability in Copper Canyon
Health Insurance Coverage by Age in Copper Canyon
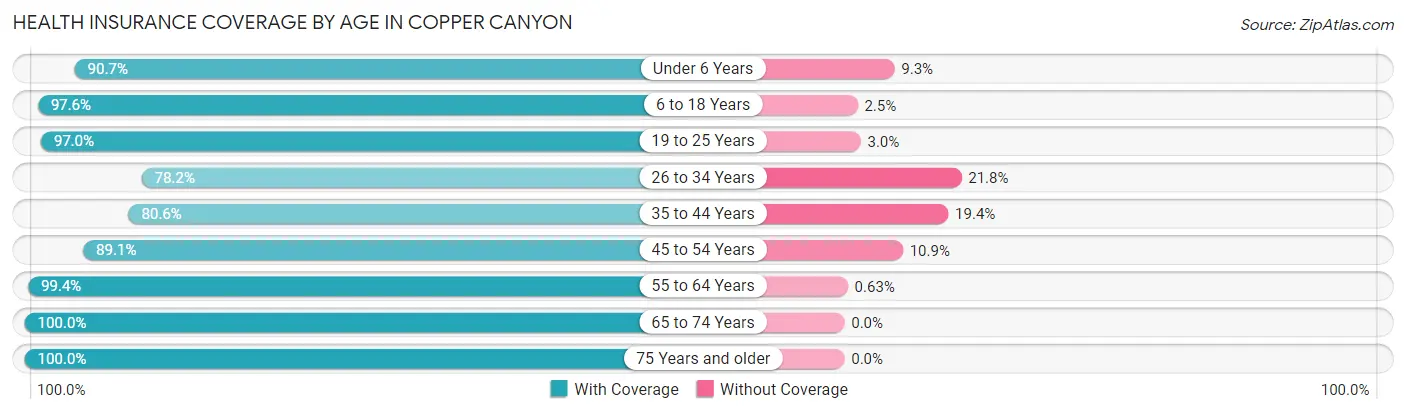
| Age Bracket | With Coverage | Without Coverage |
| Under 6 Years | 68 (90.7%) | 7 (9.3%) |
| 6 to 18 Years | 319 (97.6%) | 8 (2.5%) |
| 19 to 25 Years | 96 (97.0%) | 3 (3.0%) |
| 26 to 34 Years | 43 (78.2%) | 12 (21.8%) |
| 35 to 44 Years | 204 (80.6%) | 49 (19.4%) |
| 45 to 54 Years | 335 (89.1%) | 41 (10.9%) |
| 55 to 64 Years | 474 (99.4%) | 3 (0.6%) |
| 65 to 74 Years | 324 (100.0%) | 0 (0.0%) |
| 75 Years and older | 139 (100.0%) | 0 (0.0%) |
| Total | 2,002 (94.2%) | 123 (5.8%) |
Health Insurance Coverage by Citizenship Status in Copper Canyon
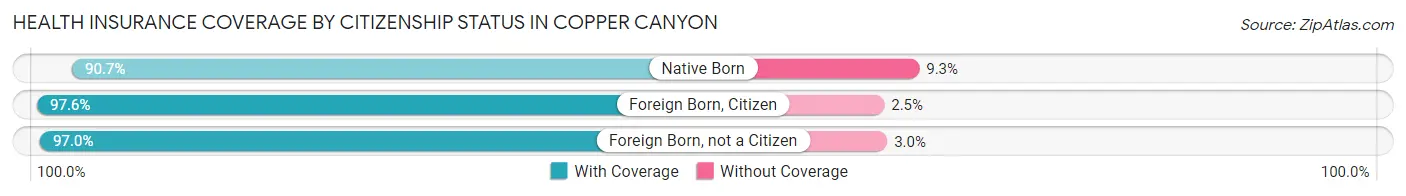
| Citizenship Status | With Coverage | Without Coverage |
| Native Born | 68 (90.7%) | 7 (9.3%) |
| Foreign Born, Citizen | 319 (97.6%) | 8 (2.5%) |
| Foreign Born, not a Citizen | 96 (97.0%) | 3 (3.0%) |
Health Insurance Coverage by Household Income in Copper Canyon
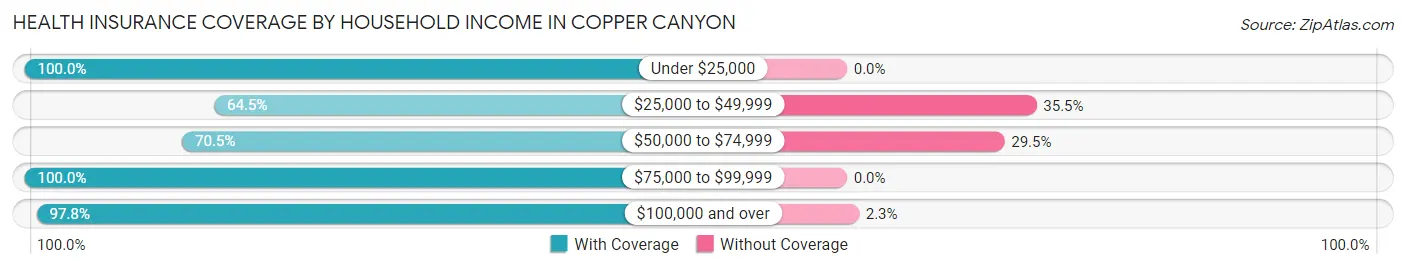
| Household Income | With Coverage | Without Coverage |
| Under $25,000 | 31 (100.0%) | 0 (0.0%) |
| $25,000 to $49,999 | 89 (64.5%) | 49 (35.5%) |
| $50,000 to $74,999 | 86 (70.5%) | 36 (29.5%) |
| $75,000 to $99,999 | 148 (100.0%) | 0 (0.0%) |
| $100,000 and over | 1,648 (97.8%) | 38 (2.2%) |
Public vs Private Health Insurance Coverage by Age in Copper Canyon
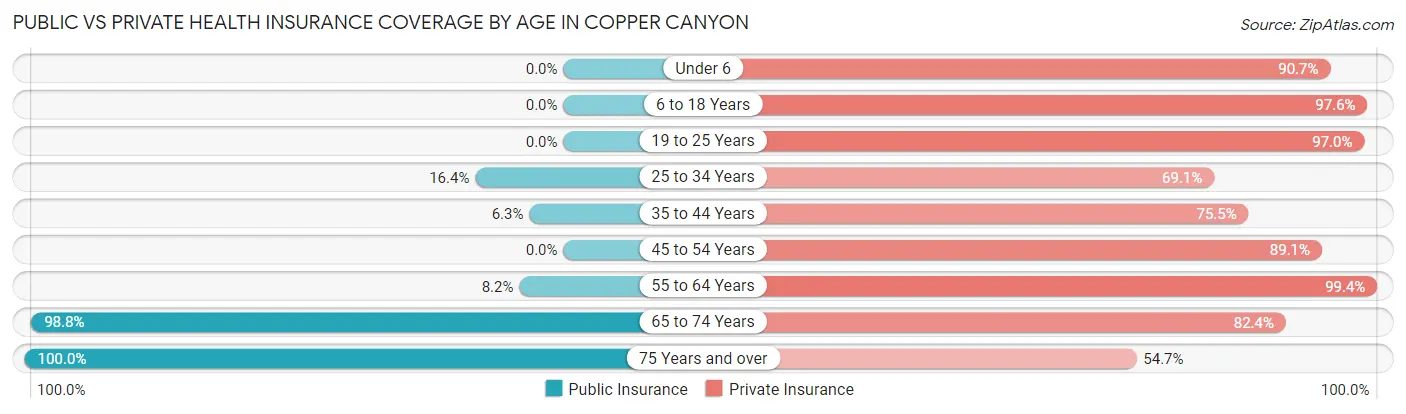
| Age Bracket | Public Insurance | Private Insurance |
| Under 6 | 0 (0.0%) | 68 (90.7%) |
| 6 to 18 Years | 0 (0.0%) | 319 (97.6%) |
| 19 to 25 Years | 0 (0.0%) | 96 (97.0%) |
| 25 to 34 Years | 9 (16.4%) | 38 (69.1%) |
| 35 to 44 Years | 16 (6.3%) | 191 (75.5%) |
| 45 to 54 Years | 0 (0.0%) | 335 (89.1%) |
| 55 to 64 Years | 39 (8.2%) | 474 (99.4%) |
| 65 to 74 Years | 320 (98.8%) | 267 (82.4%) |
| 75 Years and over | 139 (100.0%) | 76 (54.7%) |
| Total | 523 (24.6%) | 1,864 (87.7%) |
Disability Status by Sex by Age in Copper Canyon
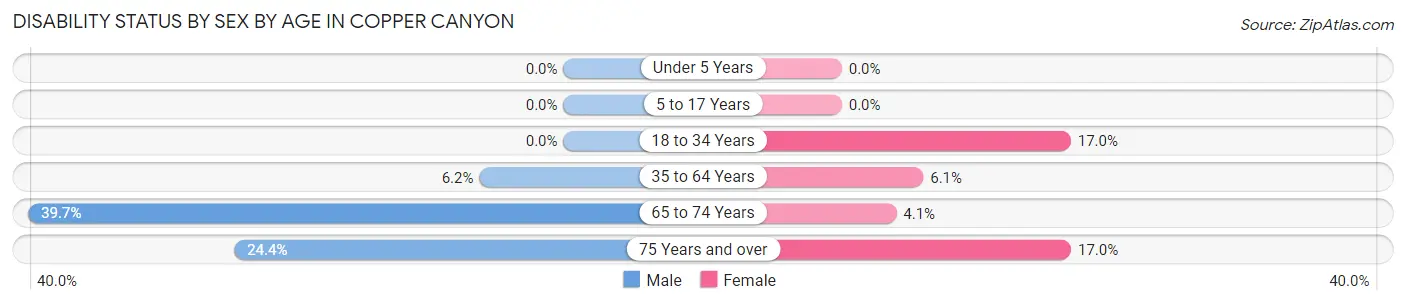
| Age Bracket | Male | Female |
| Under 5 Years | 0 (0.0%) | 0 (0.0%) |
| 5 to 17 Years | 0 (0.0%) | 0 (0.0%) |
| 18 to 34 Years | 0 (0.0%) | 17 (17.0%) |
| 35 to 64 Years | 36 (6.2%) | 32 (6.0%) |
| 65 to 74 Years | 60 (39.7%) | 7 (4.1%) |
| 75 Years and over | 11 (24.4%) | 16 (17.0%) |
Disability Class by Sex by Age in Copper Canyon
Disability Class: Hearing Difficulty
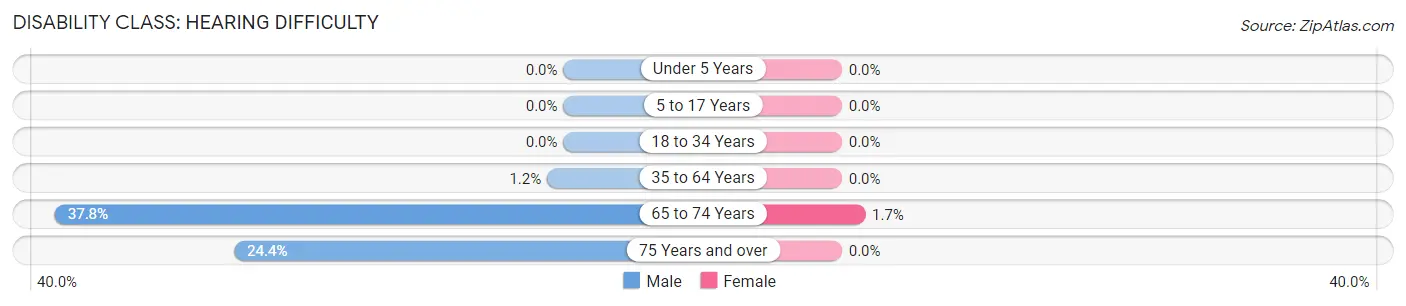
| Age Bracket | Male | Female |
| Under 5 Years | 0 (0.0%) | 0 (0.0%) |
| 5 to 17 Years | 0 (0.0%) | 0 (0.0%) |
| 18 to 34 Years | 0 (0.0%) | 0 (0.0%) |
| 35 to 64 Years | 7 (1.2%) | 0 (0.0%) |
| 65 to 74 Years | 57 (37.8%) | 3 (1.7%) |
| 75 Years and over | 11 (24.4%) | 0 (0.0%) |
Disability Class: Vision Difficulty
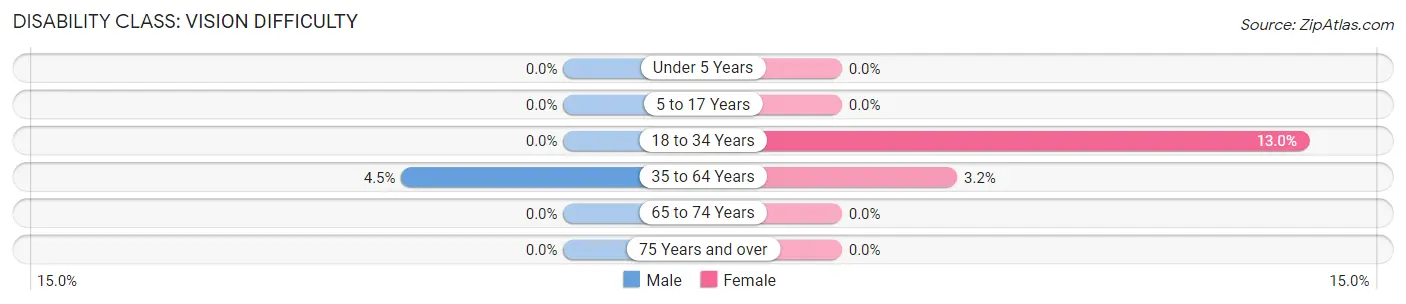
| Age Bracket | Male | Female |
| Under 5 Years | 0 (0.0%) | 0 (0.0%) |
| 5 to 17 Years | 0 (0.0%) | 0 (0.0%) |
| 18 to 34 Years | 0 (0.0%) | 13 (13.0%) |
| 35 to 64 Years | 26 (4.5%) | 17 (3.2%) |
| 65 to 74 Years | 0 (0.0%) | 0 (0.0%) |
| 75 Years and over | 0 (0.0%) | 0 (0.0%) |
Disability Class: Cognitive Difficulty
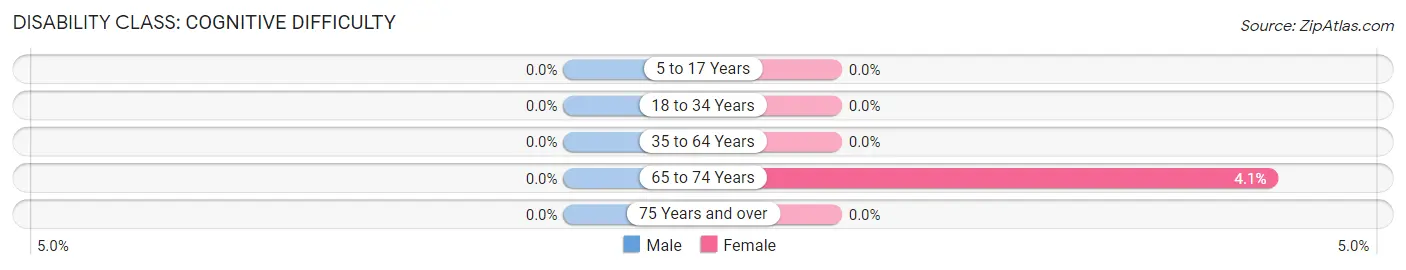
| Age Bracket | Male | Female |
| 5 to 17 Years | 0 (0.0%) | 0 (0.0%) |
| 18 to 34 Years | 0 (0.0%) | 0 (0.0%) |
| 35 to 64 Years | 0 (0.0%) | 0 (0.0%) |
| 65 to 74 Years | 0 (0.0%) | 7 (4.1%) |
| 75 Years and over | 0 (0.0%) | 0 (0.0%) |
Disability Class: Ambulatory Difficulty
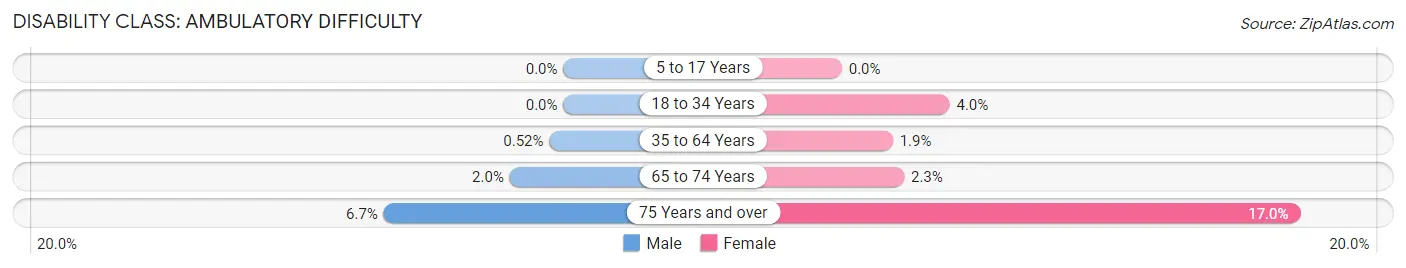
| Age Bracket | Male | Female |
| 5 to 17 Years | 0 (0.0%) | 0 (0.0%) |
| 18 to 34 Years | 0 (0.0%) | 4 (4.0%) |
| 35 to 64 Years | 3 (0.5%) | 10 (1.9%) |
| 65 to 74 Years | 3 (2.0%) | 4 (2.3%) |
| 75 Years and over | 3 (6.7%) | 16 (17.0%) |
Disability Class: Self-Care Difficulty
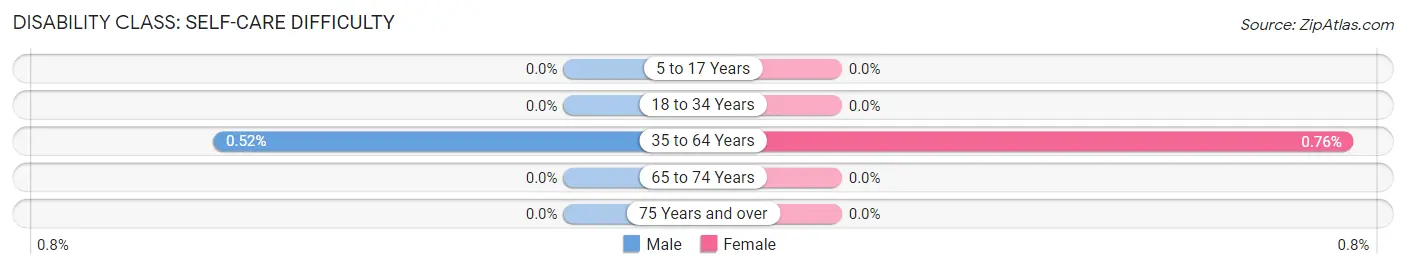
| Age Bracket | Male | Female |
| 5 to 17 Years | 0 (0.0%) | 0 (0.0%) |
| 18 to 34 Years | 0 (0.0%) | 0 (0.0%) |
| 35 to 64 Years | 3 (0.5%) | 4 (0.8%) |
| 65 to 74 Years | 0 (0.0%) | 0 (0.0%) |
| 75 Years and over | 0 (0.0%) | 0 (0.0%) |
Technology Access in Copper Canyon
Computing Device Access in Copper Canyon
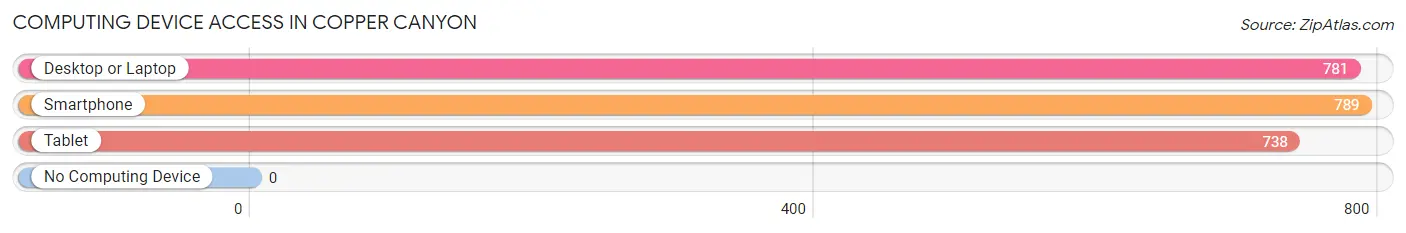
| Device Type | # Households | % Households |
| Desktop or Laptop | 781 | 97.0% |
| Smartphone | 789 | 98.0% |
| Tablet | 738 | 91.7% |
| No Computing Device | 0 | 0.0% |
| Total | 805 | 100.0% |
Internet Access in Copper Canyon
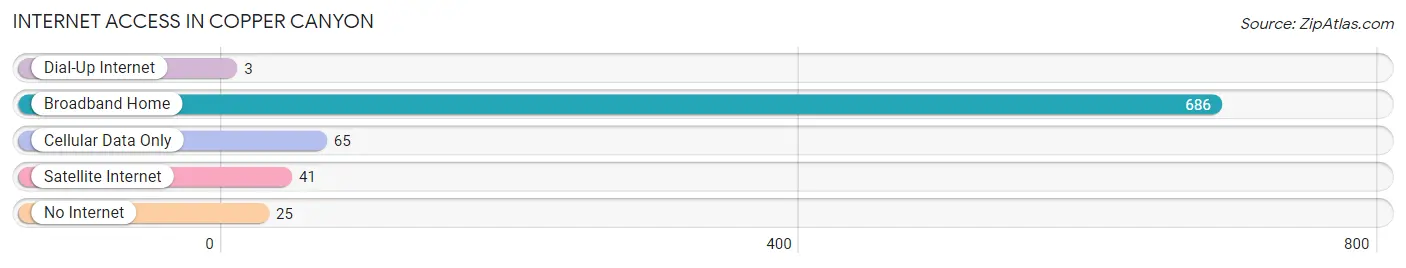
| Internet Type | # Households | % Households |
| Dial-Up Internet | 3 | 0.4% |
| Broadband Home | 686 | 85.2% |
| Cellular Data Only | 65 | 8.1% |
| Satellite Internet | 41 | 5.1% |
| No Internet | 25 | 3.1% |
| Total | 805 | 100.0% |
Copper Canyon Summary
Copper Canyon, Texas is a small unincorporated community located in Denton County, Texas. It is situated in the northwest corner of the county, approximately 25 miles northwest of the city of Denton. The community is located along the banks of the Trinity River, and is surrounded by rolling hills and lush vegetation.
History
The area that is now Copper Canyon was first settled in the late 1800s by a group of settlers from the nearby town of Pilot Point. The settlers were attracted to the area due to its abundance of natural resources, including copper ore. The settlers named the area Copper Canyon, and began to mine the ore for use in the production of tools and other items.
The area remained largely rural until the mid-1900s, when the population began to grow. The population growth was largely due to the influx of people from the nearby cities of Denton and Fort Worth. The population of Copper Canyon continued to grow throughout the 20th century, and by the year 2000, the population was estimated to be around 1,000 people.
Geography
Copper Canyon is located in the northwest corner of Denton County, Texas. It is situated along the banks of the Trinity River, and is surrounded by rolling hills and lush vegetation. The area is known for its scenic beauty, and is home to a variety of wildlife, including deer, wild turkeys, and other animals.
The climate in Copper Canyon is generally mild, with temperatures ranging from the low 40s in the winter to the mid-90s in the summer. The area receives an average of 35 inches of rain per year, and is prone to occasional flooding due to its proximity to the Trinity River.
Economy
The economy of Copper Canyon is largely based on agriculture and tourism. The area is home to several farms, which produce a variety of crops, including corn, wheat, and hay. The area is also home to several wineries, which produce a variety of wines.
In addition to agriculture, Copper Canyon is home to several businesses, including restaurants, retail stores, and other services. The area is also home to several bed and breakfasts, which attract tourists from all over the country.
Demographics
As of the 2000 census, the population of Copper Canyon was estimated to be 1,000 people. The population is largely white, with a small percentage of African Americans, Hispanics, and other ethnicities. The median household income in Copper Canyon is $50,000, and the median home value is $150,000.
The area is served by the Denton County School District, which provides public education to the students of Copper Canyon. The area is also home to several churches, including the Copper Canyon Baptist Church and the Copper Canyon United Methodist Church.
Conclusion
Copper Canyon, Texas is a small unincorporated community located in Denton County, Texas. It is situated in the northwest corner of the county, approximately 25 miles northwest of the city of Denton. The area is known for its scenic beauty, and is home to a variety of wildlife. The economy of Copper Canyon is largely based on agriculture and tourism, and the population is estimated to be around 1,000 people. The area is served by the Denton County School District, and is home to several churches. Copper Canyon is a beautiful and peaceful community, and is a great place to live and visit.
Common Questions
What is the Total Population of Copper Canyon?
Total Population of Copper Canyon is 2,125.
What is the Total Male Population of Copper Canyon?
Total Male Population of Copper Canyon is 1,029.
What is the Total Female Population of Copper Canyon?
Total Female Population of Copper Canyon is 1,096.
What is the Ratio of Males per 100 Females in Copper Canyon?
There are 93.89 Males per 100 Females in Copper Canyon.
What is the Ratio of Females per 100 Males in Copper Canyon?
There are 106.51 Females per 100 Males in Copper Canyon.
What is the Median Population Age in Copper Canyon?
Median Population Age in Copper Canyon is 53.5 Years.
What is the Average Family Size in Copper Canyon
Average Family Size in Copper Canyon is 2.8 People.
What is the Average Household Size in Copper Canyon
Average Household Size in Copper Canyon is 2.6 People.
What is Per Capita Income in Copper Canyon?
Per Capita income in Copper Canyon is $74,669.
What is the Median Family Income in Copper Canyon?
Median Family Income in Copper Canyon is $139,213.
What is the Median Household income in Copper Canyon?
Median Household Income in Copper Canyon is $135,938.
What is Income or Wage Gap in Copper Canyon?
Income or Wage Gap in Copper Canyon is 34.6%.
Women in Copper Canyon earn 65.4 cents for every dollar earned by a man.
What is Inequality or Gini Index in Copper Canyon?
Inequality or Gini Index in Copper Canyon is 0.42.
How Large is the Labor Force in Copper Canyon?
There are 1,113 People in the Labor Forcein in Copper Canyon.
What is the Percentage of People in the Labor Force in Copper Canyon?
61.2% of People are in the Labor Force in Copper Canyon.
What is the Unemployment Rate in Copper Canyon?
Unemployment Rate in Copper Canyon is 6.3%.