Cities with the Lowest Poverty Level Among Families in South Carolina
RELATED REPORTS & OPTIONS
Lowest Family Poverty
South Carolina
Compare Cities
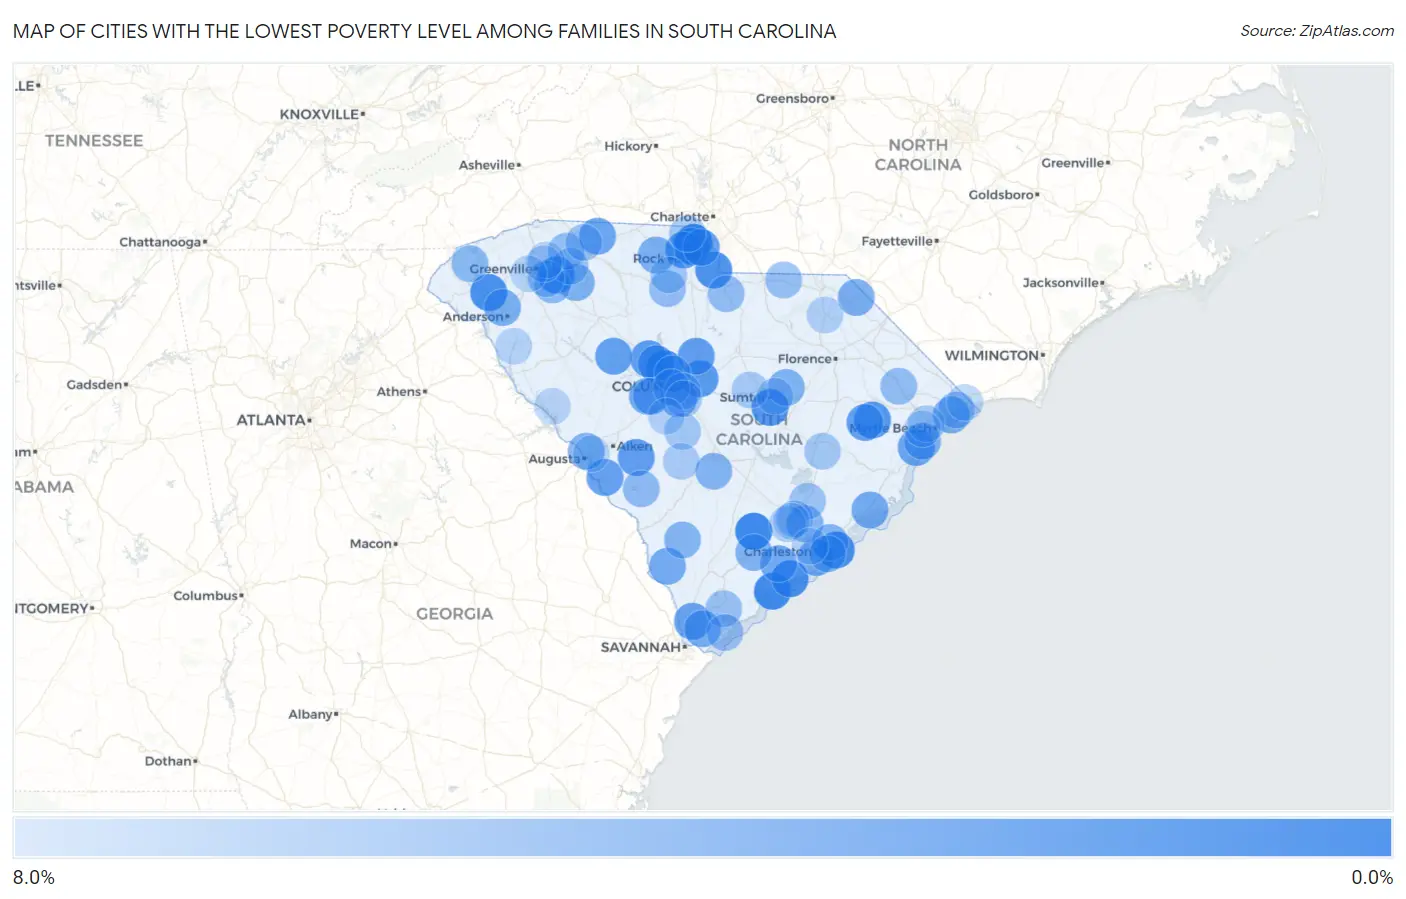
Map of Cities with the Lowest Poverty Level Among Families in South Carolina
8.0%
0.0%
Cities with the Lowest Poverty Level Among Families in South Carolina
| City | Family Poverty | vs State | vs National | |
| 1. | Tega Cay | 0.38% | 10.2%(-9.81)#1 | 8.8%(-8.40)#44 |
| 2. | Lake Murray Of Richland | 0.58% | 10.2%(-9.61)#2 | 8.8%(-8.20)#141 |
| 3. | Cottageville | 0.67% | 10.2%(-9.51)#3 | 8.8%(-8.11)#205 |
| 4. | Fripp Island | 0.77% | 10.2%(-9.42)#4 | 8.8%(-8.01)#291 |
| 5. | Edisto Beach | 0.98% | 10.2%(-9.21)#5 | 8.8%(-7.80)#509 |
| 6. | India Hook | 0.98% | 10.2%(-9.20)#6 | 8.8%(-7.80)#519 |
| 7. | Isle Of Palms | 1.2% | 10.2%(-9.01)#7 | 8.8%(-7.60)#734 |
| 8. | Seabrook Island | 1.3% | 10.2%(-8.88)#8 | 8.8%(-7.47)#894 |
| 9. | Five Forks | 1.3% | 10.2%(-8.86)#9 | 8.8%(-7.46)#915 |
| 10. | Clemson | 1.4% | 10.2%(-8.74)#10 | 8.8%(-7.33)#1,069 |
| 11. | Van Wyck | 1.5% | 10.2%(-8.68)#11 | 8.8%(-7.27)#1,155 |
| 12. | Daufuskie Island | 1.8% | 10.2%(-8.36)#12 | 8.8%(-6.96)#1,622 |
| 13. | Lakewood | 1.9% | 10.2%(-8.25)#13 | 8.8%(-6.85)#1,799 |
| 14. | The Cliffs Valley | 2.1% | 10.2%(-8.10)#14 | 8.8%(-6.69)#2,017 |
| 15. | Hemingway | 2.1% | 10.2%(-8.08)#15 | 8.8%(-6.68)#2,039 |
| 16. | Arcadia Lakes | 2.2% | 10.2%(-8.00)#16 | 8.8%(-6.59)#2,165 |
| 17. | Newport | 2.3% | 10.2%(-7.92)#17 | 8.8%(-6.51)#2,292 |
| 18. | Little Mountain | 2.3% | 10.2%(-7.86)#18 | 8.8%(-6.46)#2,392 |
| 19. | Blythewood | 2.5% | 10.2%(-7.71)#19 | 8.8%(-6.30)#2,648 |
| 20. | Keowee Key | 2.5% | 10.2%(-7.70)#20 | 8.8%(-6.29)#2,660 |
| 21. | Windsor | 2.5% | 10.2%(-7.66)#21 | 8.8%(-6.25)#2,734 |
| 22. | Cateechee | 2.6% | 10.2%(-7.60)#22 | 8.8%(-6.19)#2,836 |
| 23. | Silverstreet | 2.6% | 10.2%(-7.56)#23 | 8.8%(-6.15)#2,904 |
| 24. | Fairview Crossroads | 2.6% | 10.2%(-7.54)#24 | 8.8%(-6.14)#2,927 |
| 25. | Chapin | 2.7% | 10.2%(-7.49)#25 | 8.8%(-6.09)#3,018 |
| 26. | Stuckey | 2.7% | 10.2%(-7.45)#26 | 8.8%(-6.04)#3,095 |
| 27. | Jackson | 2.9% | 10.2%(-7.33)#27 | 8.8%(-5.92)#3,297 |
| 28. | Fort Mill | 2.9% | 10.2%(-7.32)#28 | 8.8%(-5.91)#3,328 |
| 29. | Hardeeville | 3.0% | 10.2%(-7.23)#29 | 8.8%(-5.82)#3,490 |
| 30. | Murrells Inlet | 3.1% | 10.2%(-7.05)#30 | 8.8%(-5.65)#3,786 |
| 31. | Mayo | 3.2% | 10.2%(-6.99)#31 | 8.8%(-5.58)#3,886 |
| 32. | Summit | 3.3% | 10.2%(-6.93)#32 | 8.8%(-5.52)#3,981 |
| 33. | South Congaree | 3.3% | 10.2%(-6.90)#33 | 8.8%(-5.49)#4,028 |
| 34. | Beech Island | 3.3% | 10.2%(-6.87)#34 | 8.8%(-5.47)#4,069 |
| 35. | Meggett | 3.6% | 10.2%(-6.63)#35 | 8.8%(-5.22)#4,461 |
| 36. | Mcclellanville | 3.6% | 10.2%(-6.60)#36 | 8.8%(-5.19)#4,539 |
| 37. | James Island | 3.6% | 10.2%(-6.58)#37 | 8.8%(-5.17)#4,569 |
| 38. | Bluffton | 3.7% | 10.2%(-6.53)#38 | 8.8%(-5.13)#4,645 |
| 39. | Scotia | 3.7% | 10.2%(-6.48)#39 | 8.8%(-5.08)#4,733 |
| 40. | Briarcliffe Acres | 3.8% | 10.2%(-6.39)#40 | 8.8%(-4.98)#4,876 |
| 41. | Tatum | 3.8% | 10.2%(-6.34)#41 | 8.8%(-4.94)#4,965 |
| 42. | Garden City | 4.0% | 10.2%(-6.23)#42 | 8.8%(-4.83)#5,113 |
| 43. | Northlake | 4.0% | 10.2%(-6.23)#43 | 8.8%(-4.82)#5,123 |
| 44. | Sharon | 4.0% | 10.2%(-6.19)#44 | 8.8%(-4.78)#5,182 |
| 45. | Sandy Springs | 4.1% | 10.2%(-6.13)#45 | 8.8%(-4.72)#5,280 |
| 46. | Woodruff | 4.1% | 10.2%(-6.04)#46 | 8.8%(-4.63)#5,422 |
| 47. | North Augusta | 4.2% | 10.2%(-6.03)#47 | 8.8%(-4.62)#5,435 |
| 48. | Gilbert | 4.2% | 10.2%(-6.00)#48 | 8.8%(-4.59)#5,479 |
| 49. | Mayesville | 4.3% | 10.2%(-5.93)#49 | 8.8%(-4.53)#5,588 |
| 50. | Jacksonboro | 4.3% | 10.2%(-5.90)#50 | 8.8%(-4.50)#5,642 |
| 51. | Goose Creek | 4.4% | 10.2%(-5.76)#51 | 8.8%(-4.35)#5,863 |
| 52. | Mount Pleasant | 4.5% | 10.2%(-5.73)#52 | 8.8%(-4.33)#5,902 |
| 53. | Rowesville | 4.5% | 10.2%(-5.69)#53 | 8.8%(-4.29)#5,967 |
| 54. | Sullivan S Island | 4.5% | 10.2%(-5.68)#54 | 8.8%(-4.27)#5,983 |
| 55. | Hampton | 4.5% | 10.2%(-5.65)#55 | 8.8%(-4.25)#6,015 |
| 56. | Dacusville | 4.7% | 10.2%(-5.48)#56 | 8.8%(-4.08)#6,315 |
| 57. | Salem | 4.9% | 10.2%(-5.31)#57 | 8.8%(-3.90)#6,559 |
| 58. | Baxter | 4.9% | 10.2%(-5.28)#58 | 8.8%(-3.88)#6,601 |
| 59. | Simpsonville | 4.9% | 10.2%(-5.25)#59 | 8.8%(-3.85)#6,642 |
| 60. | Irmo | 4.9% | 10.2%(-5.24)#60 | 8.8%(-3.84)#6,657 |
| 61. | Snelling | 5.0% | 10.2%(-5.19)#61 | 8.8%(-3.78)#6,760 |
| 62. | Aynor | 5.2% | 10.2%(-5.00)#62 | 8.8%(-3.60)#7,048 |
| 63. | Ben Avon | 5.2% | 10.2%(-4.97)#63 | 8.8%(-3.56)#7,093 |
| 64. | Elgin | 5.2% | 10.2%(-4.97)#64 | 8.8%(-3.56)#7,097 |
| 65. | Lyman | 5.2% | 10.2%(-4.94)#65 | 8.8%(-3.54)#7,130 |
| 66. | Gayle Mill | 5.3% | 10.2%(-4.90)#66 | 8.8%(-3.50)#7,232 |
| 67. | Mount Croghan | 5.5% | 10.2%(-4.73)#67 | 8.8%(-3.33)#7,477 |
| 68. | North Myrtle Beach | 5.5% | 10.2%(-4.72)#68 | 8.8%(-3.32)#7,496 |
| 69. | Springdale | 5.5% | 10.2%(-4.66)#69 | 8.8%(-3.25)#7,580 |
| 70. | Port Royal | 5.5% | 10.2%(-4.64)#70 | 8.8%(-3.24)#7,602 |
| 71. | Hilton Head Island | 5.6% | 10.2%(-4.58)#71 | 8.8%(-3.18)#7,692 |
| 72. | Reidville | 5.7% | 10.2%(-4.54)#72 | 8.8%(-3.13)#7,757 |
| 73. | Mauldin | 5.7% | 10.2%(-4.53)#73 | 8.8%(-3.13)#7,764 |
| 74. | Moncks Corner | 5.7% | 10.2%(-4.44)#74 | 8.8%(-3.03)#7,922 |
| 75. | Boiling Springs | 5.8% | 10.2%(-4.42)#75 | 8.8%(-3.02)#7,941 |
| 76. | Lexington | 5.9% | 10.2%(-4.29)#76 | 8.8%(-2.88)#8,161 |
| 77. | Woodford | 6.1% | 10.2%(-4.13)#77 | 8.8%(-2.72)#8,401 |
| 78. | Lane | 6.1% | 10.2%(-4.10)#78 | 8.8%(-2.69)#8,435 |
| 79. | Sangaree | 6.2% | 10.2%(-4.04)#79 | 8.8%(-2.63)#8,518 |
| 80. | Lowrys | 6.2% | 10.2%(-4.02)#80 | 8.8%(-2.61)#8,556 |
| 81. | Lake Wylie | 6.2% | 10.2%(-3.97)#81 | 8.8%(-2.56)#8,611 |
| 82. | Forestbrook | 6.3% | 10.2%(-3.86)#82 | 8.8%(-2.45)#8,826 |
| 83. | Stateburg | 6.4% | 10.2%(-3.81)#83 | 8.8%(-2.40)#8,888 |
| 84. | East Sumter | 6.4% | 10.2%(-3.75)#84 | 8.8%(-2.35)#8,971 |
| 85. | Pine Ridge | 6.5% | 10.2%(-3.71)#85 | 8.8%(-2.30)#9,033 |
| 86. | Norway | 6.5% | 10.2%(-3.69)#86 | 8.8%(-2.29)#9,054 |
| 87. | Summerville | 6.7% | 10.2%(-3.46)#87 | 8.8%(-2.06)#9,375 |
| 88. | Lincolnville | 6.8% | 10.2%(-3.42)#88 | 8.8%(-2.01)#9,418 |
| 89. | Society Hill | 6.8% | 10.2%(-3.39)#89 | 8.8%(-1.99)#9,463 |
| 90. | Taylors | 6.8% | 10.2%(-3.36)#90 | 8.8%(-1.95)#9,500 |
| 91. | Pelion | 6.9% | 10.2%(-3.33)#91 | 8.8%(-1.92)#9,541 |
| 92. | Wade Hampton | 6.9% | 10.2%(-3.32)#92 | 8.8%(-1.92)#9,547 |
| 93. | Socastee | 6.9% | 10.2%(-3.28)#93 | 8.8%(-1.88)#9,601 |
| 94. | Drayton | 7.0% | 10.2%(-3.22)#94 | 8.8%(-1.82)#9,669 |
| 95. | Lake Secession | 7.0% | 10.2%(-3.19)#95 | 8.8%(-1.78)#9,725 |
| 96. | Charleston | 7.0% | 10.2%(-3.17)#96 | 8.8%(-1.77)#9,738 |
| 97. | Little River | 7.1% | 10.2%(-3.13)#97 | 8.8%(-1.72)#9,792 |
| 98. | Clearwater | 7.1% | 10.2%(-3.12)#98 | 8.8%(-1.71)#9,803 |
| 99. | Welcome | 7.1% | 10.2%(-3.11)#99 | 8.8%(-1.70)#9,821 |
| 100. | Plum Branch | 7.1% | 10.2%(-3.05)#100 | 8.8%(-1.64)#9,935 |
Common Questions
What are the Top 10 Cities with the Lowest Poverty Level Among Families in South Carolina?
Top 10 Cities with the Lowest Poverty Level Among Families in South Carolina are:
#1
0.38%
#2
0.58%
#3
0.67%
#4
0.98%
#5
0.98%
#6
1.2%
#7
1.3%
#8
1.3%
#9
1.4%
#10
1.5%
What city has the Lowest Poverty Level Among Families in South Carolina?
Tega Cay has the Lowest Poverty Level Among Families in South Carolina with 0.38%.
What is the Poverty Level Among Families in the State of South Carolina?
Poverty Level Among Families in South Carolina is 10.2%.
What is the Poverty Level Among Families in the United States?
Poverty Level Among Families in the United States is 8.8%.