Subsaharan African vs Senegalese Receiving Food Stamps

COMPARE

Subsaharan African
Race
Ancestry
AfghanAfricanAlaska NativeAlaskan AthabascanAlbanianAleutAlsatianAmericanApacheArabArapahoArgentineanArmenianAssyrian/Chaldean/SyriacAustralianAustrianBahamianBangladeshiBarbadianBasqueBelgianBelizeanBermudanBhutaneseBlackfeetBolivianBrazilianBritishBritish West IndianBulgarianBurmeseCajunCambodianCanadianCape VerdeanCarpatho RusynCelticCentral AmericanCentral American IndianCherokeeCheyenneChickasawChileanChineseChippewaChoctawColombianColvilleComancheCosta RicanCreeCreekCroatianCrowCubanCypriotCzechCzechoslovakianDanishDelawareDominicanDutchDutch West IndianEastern EuropeanEcuadorianEgyptianEnglishEstonianEthiopianEuropeanFijianFilipinoFinnishFrenchFrench American IndianFrench CanadianGermanGerman RussianGhanaianGreekGuamanian/ChamorroGuatemalanGuyaneseHaitianHmongHonduranHopiHoumaHungarianIcelanderIndian (Asian)IndonesianInupiatIranianIraqiIrishIroquoisIsraeliItalianJamaicanJapaneseJordanianKenyanKiowaKoreanLaotianLatvianLebaneseLiberianLithuanianLumbeeLuxembourgerMacedonianMalaysianMalteseMarshalleseMenomineeMexicanMexican American IndianMongolianMoroccanNative HawaiianNavajoNepaleseNew ZealanderNicaraguanNigerianNorthern EuropeanNorwegianOkinawanOsageOttawaPaiutePakistaniPalestinianPanamanianParaguayanPennsylvania GermanPeruvianPimaPolishPortuguesePotawatomiPuebloPuerto RicanPuget Sound SalishRomanianRussianSalvadoranSamoanScandinavianScotch-IrishScottishSeminoleSerbianShoshoneSierra LeoneanSiouxSlavicSlovakSloveneSomaliSouth AfricanSouth AmericanSouth American IndianSoviet UnionSpaniardSpanishSpanish AmericanSpanish American IndianSri LankanSubsaharan AfricanSudaneseSwedishSwissSyrianTaiwaneseThaiTlingit-HaidaTohono O'OdhamTonganTrinidadian and TobagonianTsimshianTurkishU.S. Virgin IslanderUgandanUkrainianUruguayanUteVenezuelanVietnameseWelshWest IndianYakamaYaquiYugoslavianYumanYup'ikZimbabwean
Immigration
NonimmigrantsImmigrantsAfghanistanAfricaAlbaniaArgentinaArmeniaAsiaAustraliaAustriaBahamasBangladeshBarbadosBelarusBelgiumBelizeBoliviaBosnia and HerzegovinaBrazilBulgariaBurma/MyanmarCabo VerdeCambodiaCameroonCanadaCaribbeanCentral AmericaChileChinaColombiaCongoCosta RicaCroatiaCubaCzechoslovakiaDenmarkDominicaDominican RepublicEastern AfricaEastern AsiaEastern EuropeEcuadorEgyptEl SalvadorEnglandEritreaEthiopiaEuropeFijiFranceGermanyGhanaGreeceGrenadaGuatemalaGuyanaHaitiHondurasHong KongHungaryIndiaIndonesiaIranIraqIrelandIsraelItalyJamaicaJapanJordanKazakhstanKenyaKoreaKuwaitLaosLatin AmericaLatviaLebanonLiberiaLithuaniaMalaysiaMexicoMicronesiaMiddle AfricaMoldovaMoroccoNepalNetherlandsNicaraguaNigeriaNorth AmericaNorth MacedoniaNorthern AfricaNorthern EuropeNorwayOceaniaPakistanPanamaPeruPhilippinesPolandPortugalRomaniaRussiaSaudi ArabiaScotlandSenegalSerbiaSierra LeoneSingaporeSomaliaSouth AfricaSouth AmericaSouth Central AsiaSouth Eastern AsiaSouthern EuropeSpainSri LankaSt. Vincent and the GrenadinesSudanSwedenSwitzerlandSyriaTaiwanThailandTrinidad and TobagoTurkeyUgandaUkraineUruguayUzbekistanVenezuelaVietnamWest IndiesWestern AfricaWestern AsiaWestern EuropeYemenZaireZimbabweAzores
Senegalese
Race
Ancestry
AfghanAfricanAlaska NativeAlaskan AthabascanAlbanianAleutAlsatianAmericanApacheArabArapahoArgentineanArmenianAssyrian/Chaldean/SyriacAustralianAustrianBahamianBangladeshiBarbadianBasqueBelgianBelizeanBermudanBhutaneseBlackfeetBolivianBrazilianBritishBritish West IndianBulgarianBurmeseCajunCambodianCanadianCape VerdeanCarpatho RusynCelticCentral AmericanCentral American IndianCherokeeCheyenneChickasawChileanChineseChippewaChoctawColombianColvilleComancheCosta RicanCreeCreekCroatianCrowCubanCypriotCzechCzechoslovakianDanishDelawareDominicanDutchDutch West IndianEastern EuropeanEcuadorianEgyptianEnglishEstonianEthiopianEuropeanFijianFilipinoFinnishFrenchFrench American IndianFrench CanadianGermanGerman RussianGhanaianGreekGuamanian/ChamorroGuatemalanGuyaneseHaitianHmongHonduranHopiHoumaHungarianIcelanderIndian (Asian)IndonesianInupiatIranianIraqiIrishIroquoisIsraeliItalianJamaicanJapaneseJordanianKenyanKiowaKoreanLaotianLatvianLebaneseLiberianLithuanianLumbeeLuxembourgerMacedonianMalaysianMalteseMarshalleseMenomineeMexicanMexican American IndianMongolianMoroccanNative HawaiianNavajoNepaleseNew ZealanderNicaraguanNigerianNorthern EuropeanNorwegianOkinawanOsageOttawaPaiutePakistaniPalestinianPanamanianParaguayanPennsylvania GermanPeruvianPimaPolishPortuguesePotawatomiPuebloPuerto RicanPuget Sound SalishRomanianRussianSalvadoranSamoanScandinavianScotch-IrishScottishSeminoleSenegaleseSerbianShoshoneSierra LeoneanSiouxSlavicSlovakSloveneSomaliSouth AfricanSouth AmericanSouth American IndianSoviet UnionSpaniardSpanishSpanish AmericanSpanish American IndianSri LankanSudaneseSwedishSwissSyrianTaiwaneseThaiTlingit-HaidaTohono O'OdhamTonganTrinidadian and TobagonianTsimshianTurkishU.S. Virgin IslanderUgandanUkrainianUruguayanUteVenezuelanVietnameseWelshWest IndianYakamaYaquiYugoslavianYumanYup'ikZimbabwean
Immigration
NonimmigrantsImmigrantsAfghanistanAfricaAlbaniaArgentinaArmeniaAsiaAustraliaAustriaBahamasBangladeshBarbadosBelarusBelgiumBelizeBoliviaBosnia and HerzegovinaBrazilBulgariaBurma/MyanmarCabo VerdeCambodiaCameroonCanadaCaribbeanCentral AmericaChileChinaColombiaCongoCosta RicaCroatiaCubaCzechoslovakiaDenmarkDominicaDominican RepublicEastern AfricaEastern AsiaEastern EuropeEcuadorEgyptEl SalvadorEnglandEritreaEthiopiaEuropeFijiFranceGermanyGhanaGreeceGrenadaGuatemalaGuyanaHaitiHondurasHong KongHungaryIndiaIndonesiaIranIraqIrelandIsraelItalyJamaicaJapanJordanKazakhstanKenyaKoreaKuwaitLaosLatin AmericaLatviaLebanonLiberiaLithuaniaMalaysiaMexicoMicronesiaMiddle AfricaMoldovaMoroccoNepalNetherlandsNicaraguaNigeriaNorth AmericaNorth MacedoniaNorthern AfricaNorthern EuropeNorwayOceaniaPakistanPanamaPeruPhilippinesPolandPortugalRomaniaRussiaSaudi ArabiaScotlandSenegalSerbiaSierra LeoneSingaporeSomaliaSouth AfricaSouth AmericaSouth Central AsiaSouth Eastern AsiaSouthern EuropeSpainSri LankaSt. Vincent and the GrenadinesSudanSwedenSwitzerlandSyriaTaiwanThailandTrinidad and TobagoTurkeyUgandaUkraineUruguayUzbekistanVenezuelaVietnamWest IndiesWestern AfricaWestern AsiaWestern EuropeYemenZaireZimbabweAzores
Receiving Food Stamps
Income
Poverty
Unemployment
Labor Participation
Family Structure
Vehicle Availability
Education Level
Disability

Receiving Food Stamps Comparison

Sub-Saharan Africans

Senegalese

Tragic
Tragic
14.1%
RECEIVING FOOD STAMPS
0.3/ 100
METRIC RATING
255th/ 347
METRIC RANK
15.4%
RECEIVING FOOD STAMPS
0.0/ 100
METRIC RATING
290th/ 347
METRIC RANK

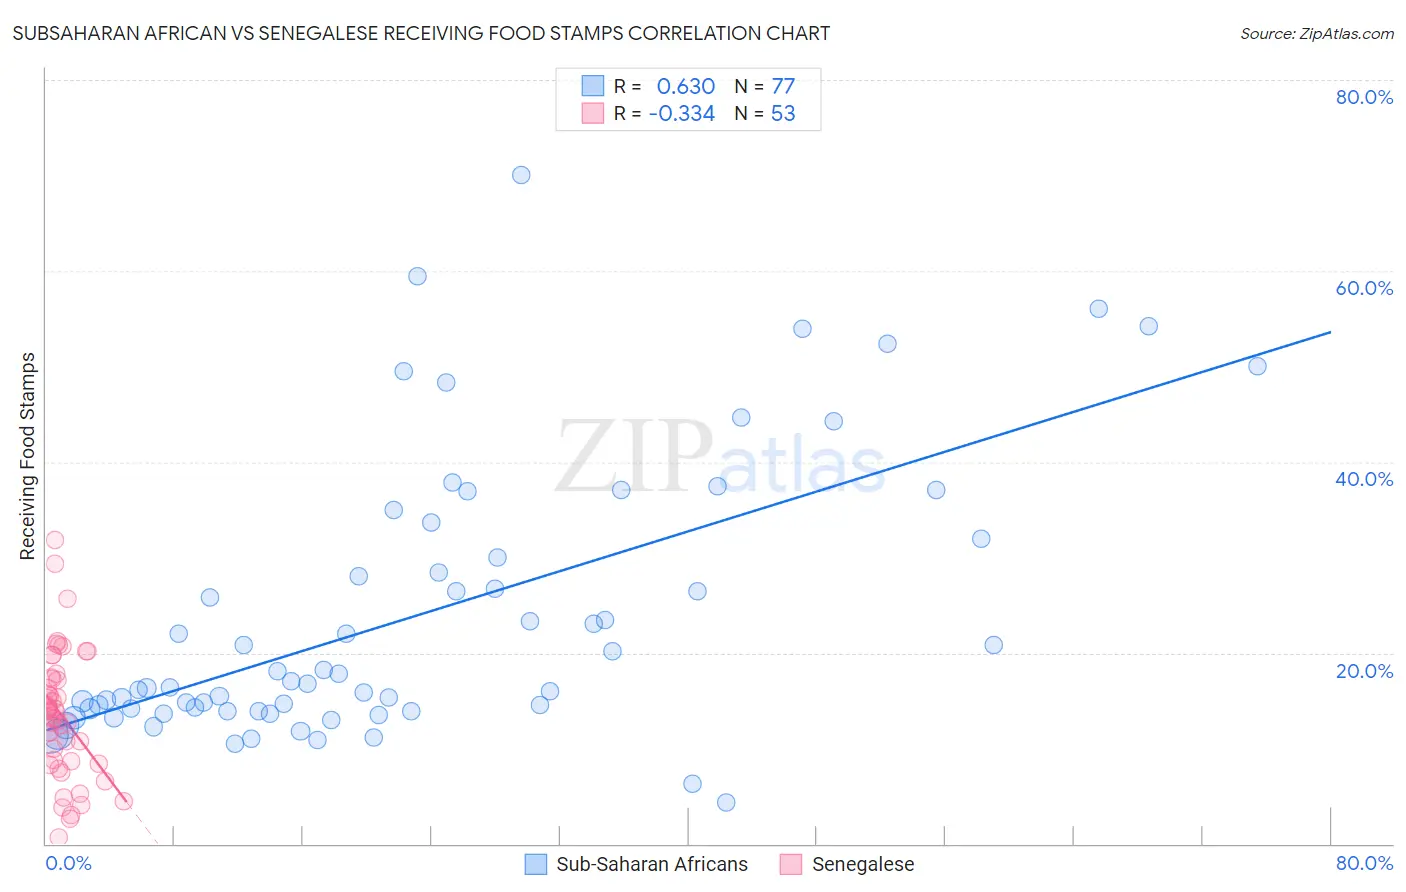
Subsaharan African vs Senegalese Receiving Food Stamps Correlation Chart

The statistical analysis conducted on geographies consisting of 506,389,803 people shows a significant positive correlation between the proportion of Sub-Saharan Africans and percentage of population receiving government assistance and/or food stamps in the United States with a correlation coefficient (R) of 0.630 and weighted average of 14.1%. Similarly, the statistical analysis conducted on geographies consisting of 78,101,043 people shows a mild negative correlation between the proportion of Senegalese and percentage of population receiving government assistance and/or food stamps in the United States with a correlation coefficient (R) of -0.334 and weighted average of 15.4%, a difference of 9.2%.
Subsaharan African vs Senegalese Receiving Food Stamps

Receiving Food Stamps Correlation Summary

MeasurementSubsaharan AfricanSenegalese
Minimum4.3%0.60%
Maximum70.0%31.8%
Range65.7%31.2%
Mean23.8%13.5%
Median16.8%13.7%
Interquartile 25% (IQ1)13.9%8.6%
Interquartile 75% (IQ3)31.0%17.4%
Interquartile Range (IQR)17.1%8.8%
Standard Deviation (Sample)14.4%6.6%
Standard Deviation (Population)14.3%6.5%

Similar Demographics by Receiving Food Stamps

Demographics Similar to Sub-Saharan Africans by Receiving Food Stamps

In terms of receiving food stamps, the demographic groups most similar to Sub-Saharan Africans are Marshallese (14.1%, a difference of 0.010%), Japanese (14.1%, a difference of 0.020%), Arapaho (14.1%, a difference of 0.12%), Immigrants from Ghana (14.1%, a difference of 0.20%), and Creek (14.1%, a difference of 0.33%).
DemographicsRating | RankReceiving Food Stamps
Immigrants | Laos
0.7
/100
|
#248
Tragic
13.8%
Indonesians
0.6
/100
|
#249
Tragic
13.9%
Immigrants | Cambodia
0.5
/100
|
#250
Tragic
13.9%
Yaqui
0.5
/100
|
#251
Tragic
13.9%
Ghanaians
0.5
/100
|
#252
Tragic
14.0%
Spanish Americans
0.4
/100
|
#253
Tragic
14.0%
Marshallese
0.3
/100
|
#254
Tragic
14.1%
Sub-Saharan Africans
0.3
/100
|
#255
Tragic
14.1%
Japanese
0.3
/100
|
#256
Tragic
14.1%
Arapaho
0.3
/100
|
#257
Tragic
14.1%
Immigrants | Ghana
0.3
/100
|
#258
Tragic
14.1%
Creek
0.3
/100
|
#259
Tragic
14.1%
Central Americans
0.3
/100
|
#260
Tragic
14.1%
Immigrants | Congo
0.3
/100
|
#261
Tragic
14.1%
Paiute
0.2
/100
|
#262
Tragic
14.3%

Demographics Similar to Senegalese by Receiving Food Stamps

In terms of receiving food stamps, the demographic groups most similar to Senegalese are Immigrants from Senegal (15.3%, a difference of 0.27%), Honduran (15.5%, a difference of 1.0%), Immigrants from Belize (15.2%, a difference of 1.0%), Alaska Native (15.6%, a difference of 1.5%), and Immigrants from Mexico (15.2%, a difference of 1.5%).
DemographicsRating | RankReceiving Food Stamps
Bangladeshis
0.0
/100
|
#283
Tragic
15.0%
Immigrants | Ecuador
0.0
/100
|
#284
Tragic
15.0%
Immigrants | Liberia
0.0
/100
|
#285
Tragic
15.1%
Africans
0.0
/100
|
#286
Tragic
15.1%
Immigrants | Mexico
0.0
/100
|
#287
Tragic
15.2%
Immigrants | Belize
0.0
/100
|
#288
Tragic
15.2%
Immigrants | Senegal
0.0
/100
|
#289
Tragic
15.3%
Senegalese
0.0
/100
|
#290
Tragic
15.4%
Hondurans
0.0
/100
|
#291
Tragic
15.5%
Alaska Natives
0.0
/100
|
#292
Tragic
15.6%
Vietnamese
0.0
/100
|
#293
Tragic
15.7%
Immigrants | Latin America
0.0
/100
|
#294
Tragic
15.7%
Immigrants | Honduras
0.0
/100
|
#295
Tragic
15.7%
Tsimshian
0.0
/100
|
#296
Tragic
15.7%
Immigrants | Bahamas
0.0
/100
|
#297
Tragic
15.8%