Cities with the Most Immigrants from Peru in Minnesota
RELATED REPORTS & OPTIONS
Peru
Minnesota
Compare Cities
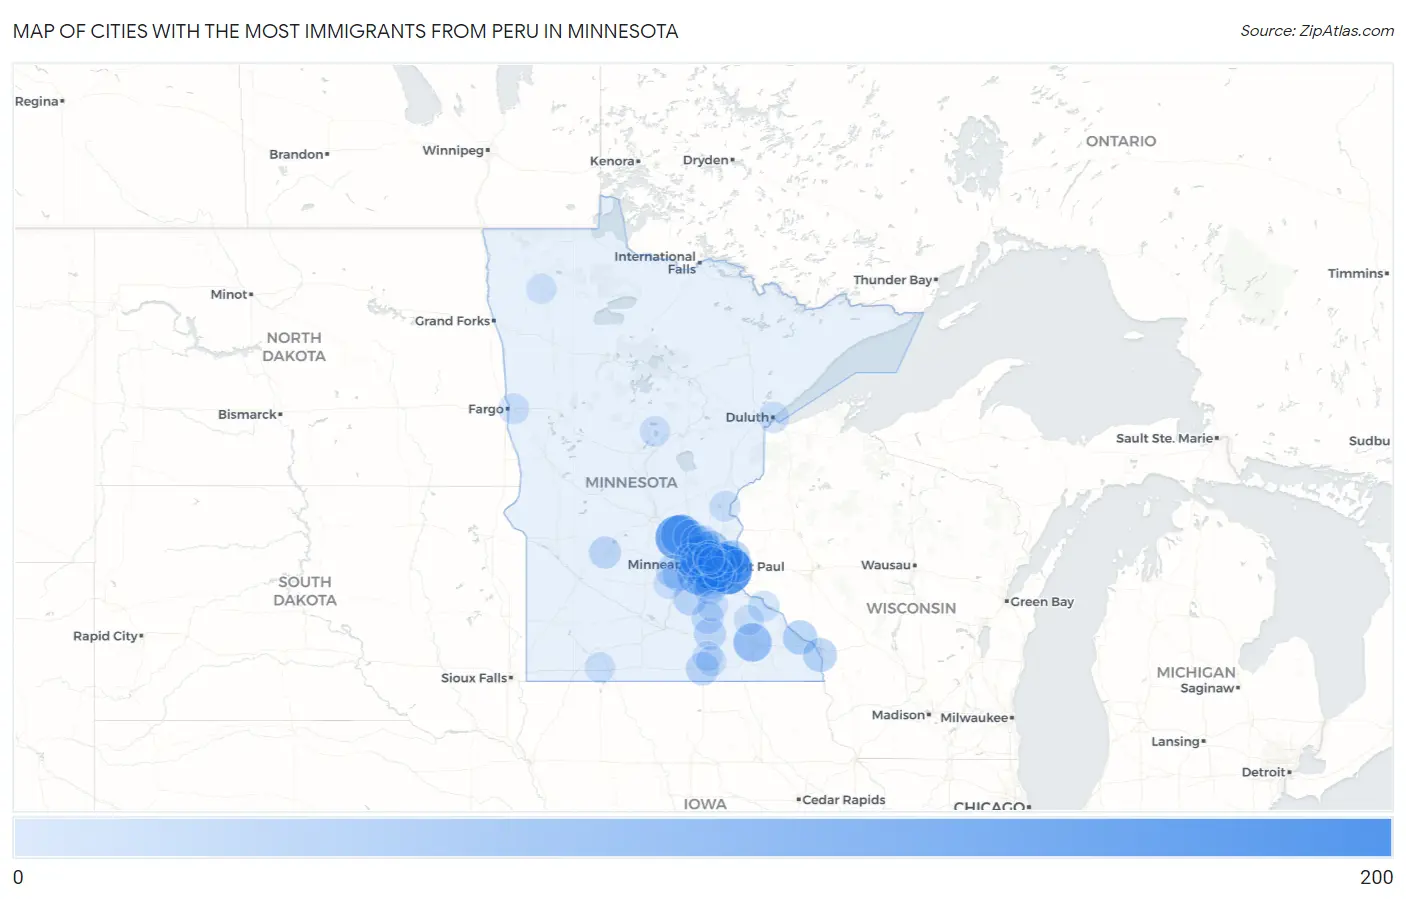
Map of Cities with the Most Immigrants from Peru in Minnesota
0
200
Cities with the Most Immigrants from Peru in Minnesota
| City | Peru | vs State | vs National | |
| 1. | St Paul | 185 | 1,963(9.42%)#1 | 461,322(0.04%)#454 |
| 2. | Minneapolis | 184 | 1,963(9.37%)#2 | 461,322(0.04%)#457 |
| 3. | Woodbury | 176 | 1,963(8.97%)#3 | 461,322(0.04%)#480 |
| 4. | Monticello | 132 | 1,963(6.72%)#4 | 461,322(0.03%)#619 |
| 5. | Big Lake | 101 | 1,963(5.15%)#5 | 461,322(0.02%)#758 |
| 6. | Eden Prairie | 84 | 1,963(4.28%)#6 | 461,322(0.02%)#870 |
| 7. | Rochester | 75 | 1,963(3.82%)#7 | 461,322(0.02%)#938 |
| 8. | Brooklyn Park | 65 | 1,963(3.31%)#8 | 461,322(0.01%)#1,036 |
| 9. | Maple Grove | 56 | 1,963(2.85%)#9 | 461,322(0.01%)#1,149 |
| 10. | West St Paul | 56 | 1,963(2.85%)#10 | 461,322(0.01%)#1,155 |
| 11. | Blaine | 51 | 1,963(2.60%)#11 | 461,322(0.01%)#1,226 |
| 12. | Eagan | 45 | 1,963(2.29%)#12 | 461,322(0.01%)#1,330 |
| 13. | Coon Rapids | 40 | 1,963(2.04%)#13 | 461,322(0.01%)#1,408 |
| 14. | Stillwater | 40 | 1,963(2.04%)#14 | 461,322(0.01%)#1,415 |
| 15. | Winona | 39 | 1,963(1.99%)#15 | 461,322(0.01%)#1,431 |
| 16. | Bloomington | 36 | 1,963(1.83%)#16 | 461,322(0.01%)#1,492 |
| 17. | Minnetonka | 35 | 1,963(1.78%)#17 | 461,322(0.01%)#1,512 |
| 18. | La Crescent | 34 | 1,963(1.73%)#18 | 461,322(0.01%)#1,547 |
| 19. | Elk River | 28 | 1,963(1.43%)#19 | 461,322(0.01%)#1,720 |
| 20. | New Prague | 28 | 1,963(1.43%)#20 | 461,322(0.01%)#1,736 |
| 21. | Albert Lea | 27 | 1,963(1.38%)#21 | 461,322(0.01%)#1,755 |
| 22. | Mayer | 26 | 1,963(1.32%)#22 | 461,322(0.01%)#1,796 |
| 23. | Lakeland | 24 | 1,963(1.22%)#23 | 461,322(0.01%)#1,857 |
| 24. | St Louis Park | 22 | 1,963(1.12%)#24 | 461,322(0.00%)#1,900 |
| 25. | Ramsey | 21 | 1,963(1.07%)#25 | 461,322(0.00%)#1,941 |
| 26. | Waconia | 21 | 1,963(1.07%)#26 | 461,322(0.00%)#1,949 |
| 27. | Faribault | 20 | 1,963(1.02%)#27 | 461,322(0.00%)#1,974 |
| 28. | Apple Valley | 19 | 1,963(0.97%)#28 | 461,322(0.00%)#2,002 |
| 29. | Owatonna | 19 | 1,963(0.97%)#29 | 461,322(0.00%)#2,007 |
| 30. | Willmar | 19 | 1,963(0.97%)#30 | 461,322(0.00%)#2,012 |
| 31. | Medina | 19 | 1,963(0.97%)#31 | 461,322(0.00%)#2,024 |
| 32. | Plymouth | 18 | 1,963(0.92%)#32 | 461,322(0.00%)#2,035 |
| 33. | Richfield | 18 | 1,963(0.92%)#33 | 461,322(0.00%)#2,040 |
| 34. | Lakeville | 17 | 1,963(0.87%)#34 | 461,322(0.00%)#2,088 |
| 35. | Inver Grove Heights | 14 | 1,963(0.71%)#35 | 461,322(0.00%)#2,233 |
| 36. | Crystal | 13 | 1,963(0.66%)#36 | 461,322(0.00%)#2,298 |
| 37. | Roseville | 12 | 1,963(0.61%)#37 | 461,322(0.00%)#2,344 |
| 38. | Andover | 11 | 1,963(0.56%)#38 | 461,322(0.00%)#2,416 |
| 39. | Maplewood | 9 | 1,963(0.46%)#39 | 461,322(0.00%)#2,542 |
| 40. | Savage | 9 | 1,963(0.46%)#40 | 461,322(0.00%)#2,543 |
| 41. | Lake City | 8 | 1,963(0.41%)#41 | 461,322(0.00%)#2,624 |
| 42. | Grant | 8 | 1,963(0.41%)#42 | 461,322(0.00%)#2,633 |
| 43. | Duluth | 7 | 1,963(0.36%)#43 | 461,322(0.00%)#2,655 |
| 44. | Fridley | 7 | 1,963(0.36%)#44 | 461,322(0.00%)#2,671 |
| 45. | Dilworth | 6 | 1,963(0.31%)#45 | 461,322(0.00%)#2,785 |
| 46. | Rush City | 6 | 1,963(0.31%)#46 | 461,322(0.00%)#2,788 |
| 47. | Sunfish Lake | 5 | 1,963(0.25%)#47 | 461,322(0.00%)#2,882 |
| 48. | Northfield | 4 | 1,963(0.20%)#48 | 461,322(0.00%)#2,894 |
| 49. | Breezy Point | 4 | 1,963(0.20%)#49 | 461,322(0.00%)#2,926 |
| 50. | Lakefield | 4 | 1,963(0.20%)#50 | 461,322(0.00%)#2,940 |
| 51. | Falcon Heights | 3 | 1,963(0.15%)#51 | 461,322(0.00%)#2,974 |
| 52. | Mazeppa | 3 | 1,963(0.15%)#52 | 461,322(0.00%)#3,013 |
| 53. | Columbia Heights | 2 | 1,963(0.10%)#53 | 461,322(0.00%)#3,033 |
| 54. | Hamburg | 2 | 1,963(0.10%)#54 | 461,322(0.00%)#3,083 |
| 55. | Geneva | 2 | 1,963(0.10%)#55 | 461,322(0.00%)#3,090 |
| 56. | Hollandale | 2 | 1,963(0.10%)#56 | 461,322(0.00%)#3,092 |
| 57. | Holt | 1 | 1,963(0.05%)#57 | 461,322(0.00%)#3,133 |
Common Questions
What are the Top 10 Cities with the Most Immigrants from Peru in Minnesota?
Top 10 Cities with the Most Immigrants from Peru in Minnesota are:
#1
185
#2
184
#3
176
#4
132
#5
101
#6
84
#7
75
#8
65
#9
56
#10
56
What city has the Most Immigrants from Peru in Minnesota?
St Paul has the Most Immigrants from Peru in Minnesota with 185.
What is the Total Immigrants from Peru in the State of Minnesota?
Total Immigrants from Peru in Minnesota is 1,963.
What is the Total Immigrants from Peru in the United States?
Total Immigrants from Peru in the United States is 461,322.