Cities with the Most Immigrants from Peru in Georgia
RELATED REPORTS & OPTIONS
Peru
Georgia
Compare Cities
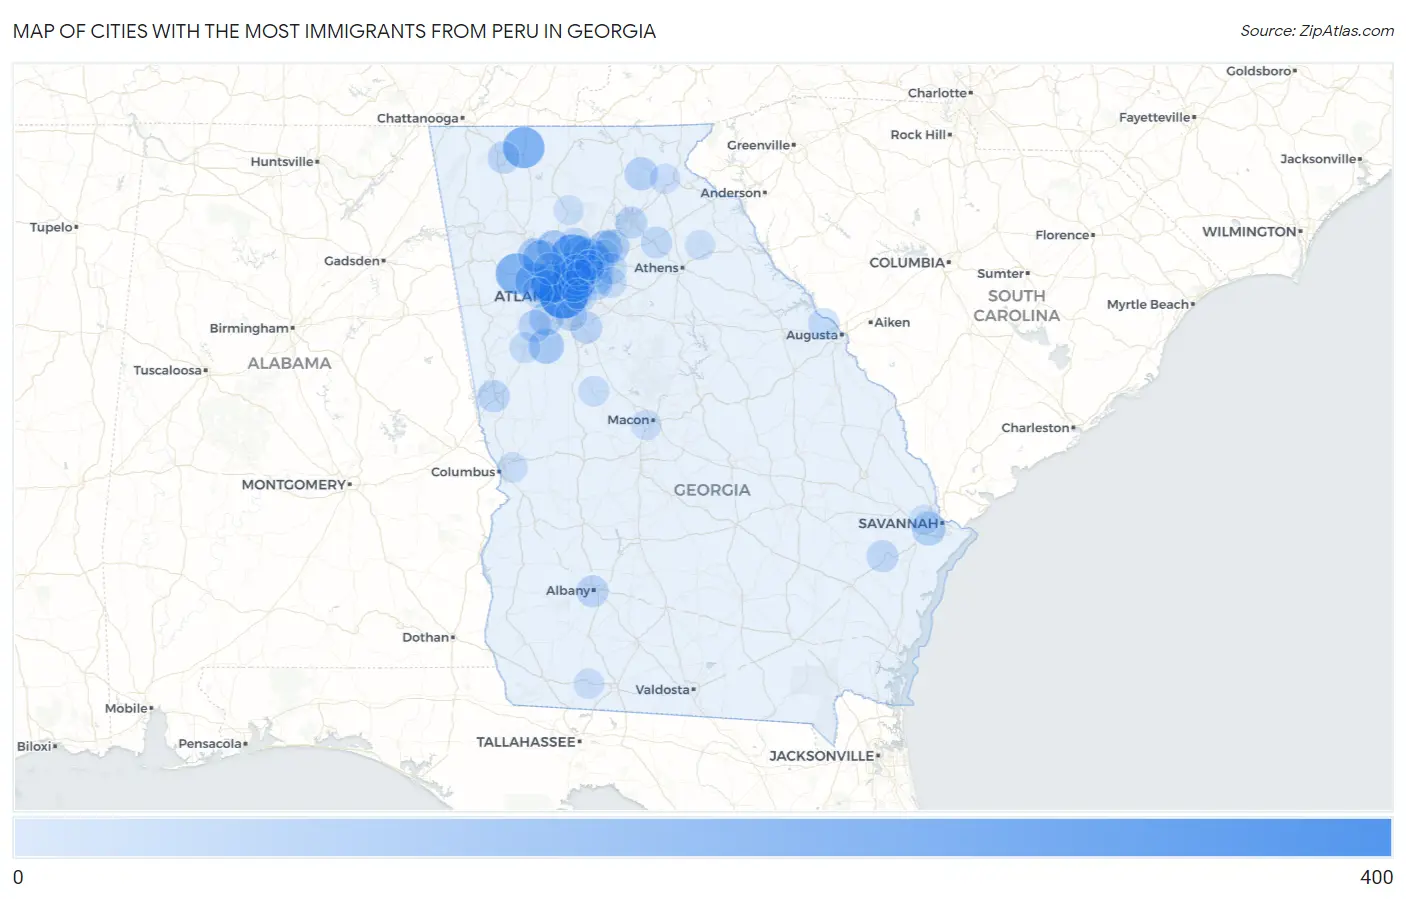
Map of Cities with the Most Immigrants from Peru in Georgia
0
400
Cities with the Most Immigrants from Peru in Georgia
| City | Peru | vs State | vs National | |
| 1. | Atlanta | 342 | 8,613(3.97%)#1 | 461,322(0.07%)#242 |
| 2. | Athens-Clarke County Unified Government (Balance) | 278 | 8,613(3.23%)#2 | 461,322(0.06%)#304 |
| 3. | Brookhaven | 244 | 8,613(2.83%)#3 | 461,322(0.05%)#345 |
| 4. | Roswell | 237 | 8,613(2.75%)#4 | 461,322(0.05%)#354 |
| 5. | Smyrna | 195 | 8,613(2.26%)#5 | 461,322(0.04%)#431 |
| 6. | Eton | 195 | 8,613(2.26%)#6 | 461,322(0.04%)#432 |
| 7. | Dallas | 187 | 8,613(2.17%)#7 | 461,322(0.04%)#449 |
| 8. | Augusta-Richmond County Consolidated Government (Balance) | 145 | 8,613(1.68%)#8 | 461,322(0.03%)#571 |
| 9. | Johns Creek | 129 | 8,613(1.50%)#9 | 461,322(0.03%)#628 |
| 10. | Powder Springs | 124 | 8,613(1.44%)#10 | 461,322(0.03%)#647 |
| 11. | Kennesaw | 120 | 8,613(1.39%)#11 | 461,322(0.03%)#661 |
| 12. | Sandy Springs | 98 | 8,613(1.14%)#12 | 461,322(0.02%)#777 |
| 13. | Peachtree City | 85 | 8,613(0.99%)#13 | 461,322(0.02%)#860 |
| 14. | Mableton | 82 | 8,613(0.95%)#14 | 461,322(0.02%)#887 |
| 15. | Duluth | 76 | 8,613(0.88%)#15 | 461,322(0.02%)#935 |
| 16. | Woodstock | 75 | 8,613(0.87%)#16 | 461,322(0.02%)#940 |
| 17. | Peachtree Corners | 73 | 8,613(0.85%)#17 | 461,322(0.02%)#963 |
| 18. | Sugar Hill | 73 | 8,613(0.85%)#18 | 461,322(0.02%)#966 |
| 19. | Acworth | 68 | 8,613(0.79%)#19 | 461,322(0.01%)#1,015 |
| 20. | Alpharetta | 66 | 8,613(0.77%)#20 | 461,322(0.01%)#1,029 |
| 21. | Savannah | 60 | 8,613(0.70%)#21 | 461,322(0.01%)#1,092 |
| 22. | Buford | 60 | 8,613(0.70%)#22 | 461,322(0.01%)#1,101 |
| 23. | Union City | 59 | 8,613(0.69%)#23 | 461,322(0.01%)#1,115 |
| 24. | Lilburn | 54 | 8,613(0.63%)#24 | 461,322(0.01%)#1,186 |
| 25. | Yonah | 54 | 8,613(0.63%)#25 | 461,322(0.01%)#1,192 |
| 26. | Chamblee | 49 | 8,613(0.57%)#26 | 461,322(0.01%)#1,268 |
| 27. | Palmetto | 45 | 8,613(0.52%)#27 | 461,322(0.01%)#1,347 |
| 28. | Dalton | 39 | 8,613(0.45%)#28 | 461,322(0.01%)#1,430 |
| 29. | Mountain Park | 39 | 8,613(0.45%)#29 | 461,322(0.01%)#1,434 |
| 30. | Stockbridge | 37 | 8,613(0.43%)#30 | 461,322(0.01%)#1,474 |
| 31. | Marietta | 35 | 8,613(0.41%)#31 | 461,322(0.01%)#1,510 |
| 32. | Milton | 34 | 8,613(0.39%)#32 | 461,322(0.01%)#1,538 |
| 33. | Forest Park | 34 | 8,613(0.39%)#33 | 461,322(0.01%)#1,543 |
| 34. | Lagrange | 33 | 8,613(0.38%)#34 | 461,322(0.01%)#1,555 |
| 35. | Albany | 32 | 8,613(0.37%)#35 | 461,322(0.01%)#1,583 |
| 36. | Gainesville | 32 | 8,613(0.37%)#36 | 461,322(0.01%)#1,591 |
| 37. | Hinesville | 30 | 8,613(0.35%)#37 | 461,322(0.01%)#1,654 |
| 38. | Jefferson | 30 | 8,613(0.35%)#38 | 461,322(0.01%)#1,667 |
| 39. | Evans | 25 | 8,613(0.29%)#39 | 461,322(0.01%)#1,805 |
| 40. | North Druid Hills | 21 | 8,613(0.24%)#40 | 461,322(0.00%)#1,945 |
| 41. | Newnan | 18 | 8,613(0.21%)#41 | 461,322(0.00%)#2,039 |
| 42. | Lawrenceville | 18 | 8,613(0.21%)#42 | 461,322(0.00%)#2,044 |
| 43. | Bemiss | 17 | 8,613(0.20%)#43 | 461,322(0.00%)#2,118 |
| 44. | Belvedere Park | 14 | 8,613(0.16%)#44 | 461,322(0.00%)#2,251 |
| 45. | Suwanee | 13 | 8,613(0.15%)#45 | 461,322(0.00%)#2,303 |
| 46. | Norcross | 12 | 8,613(0.14%)#46 | 461,322(0.00%)#2,361 |
| 47. | Snellville | 11 | 8,613(0.13%)#47 | 461,322(0.00%)#2,423 |
| 48. | Lithia Springs | 11 | 8,613(0.13%)#48 | 461,322(0.00%)#2,430 |
| 49. | Doraville | 11 | 8,613(0.13%)#49 | 461,322(0.00%)#2,438 |
| 50. | Barnesville | 10 | 8,613(0.12%)#50 | 461,322(0.00%)#2,515 |
| 51. | Macon Bibb County | 8 | 8,613(0.09%)#51 | 461,322(0.00%)#2,588 |
| 52. | Dunwoody | 8 | 8,613(0.09%)#52 | 461,322(0.00%)#2,592 |
| 53. | Cairo | 7 | 8,613(0.08%)#53 | 461,322(0.00%)#2,690 |
| 54. | Columbus | 6 | 8,613(0.07%)#54 | 461,322(0.00%)#2,736 |
| 55. | Decatur | 6 | 8,613(0.07%)#55 | 461,322(0.00%)#2,756 |
| 56. | Cusseta Chattahoochee County Unified Government | 4 | 8,613(0.05%)#56 | 461,322(0.00%)#2,910 |
| 57. | Clarkesville | 4 | 8,613(0.05%)#57 | 461,322(0.00%)#2,936 |
| 58. | Berkeley Lake | 3 | 8,613(0.03%)#58 | 461,322(0.00%)#2,989 |
| 59. | Danielsville | 2 | 8,613(0.02%)#59 | 461,322(0.00%)#3,070 |
| 60. | Nelson | 2 | 8,613(0.02%)#60 | 461,322(0.00%)#3,072 |
| 61. | Pooler | 1 | 8,613(0.01%)#61 | 461,322(0.00%)#3,103 |
Common Questions
What are the Top 10 Cities with the Most Immigrants from Peru in Georgia?
Top 10 Cities with the Most Immigrants from Peru in Georgia are:
#1
342
#2
244
#3
237
#4
195
#5
195
#6
187
#7
129
#8
124
#9
120
#10
98
What city has the Most Immigrants from Peru in Georgia?
Atlanta has the Most Immigrants from Peru in Georgia with 342.
What is the Total Immigrants from Peru in the State of Georgia?
Total Immigrants from Peru in Georgia is 8,613.
What is the Total Immigrants from Peru in the United States?
Total Immigrants from Peru in the United States is 461,322.