Cities with the Most Immigrants from Peru in Ohio
RELATED REPORTS & OPTIONS
Peru
Ohio
Compare Cities
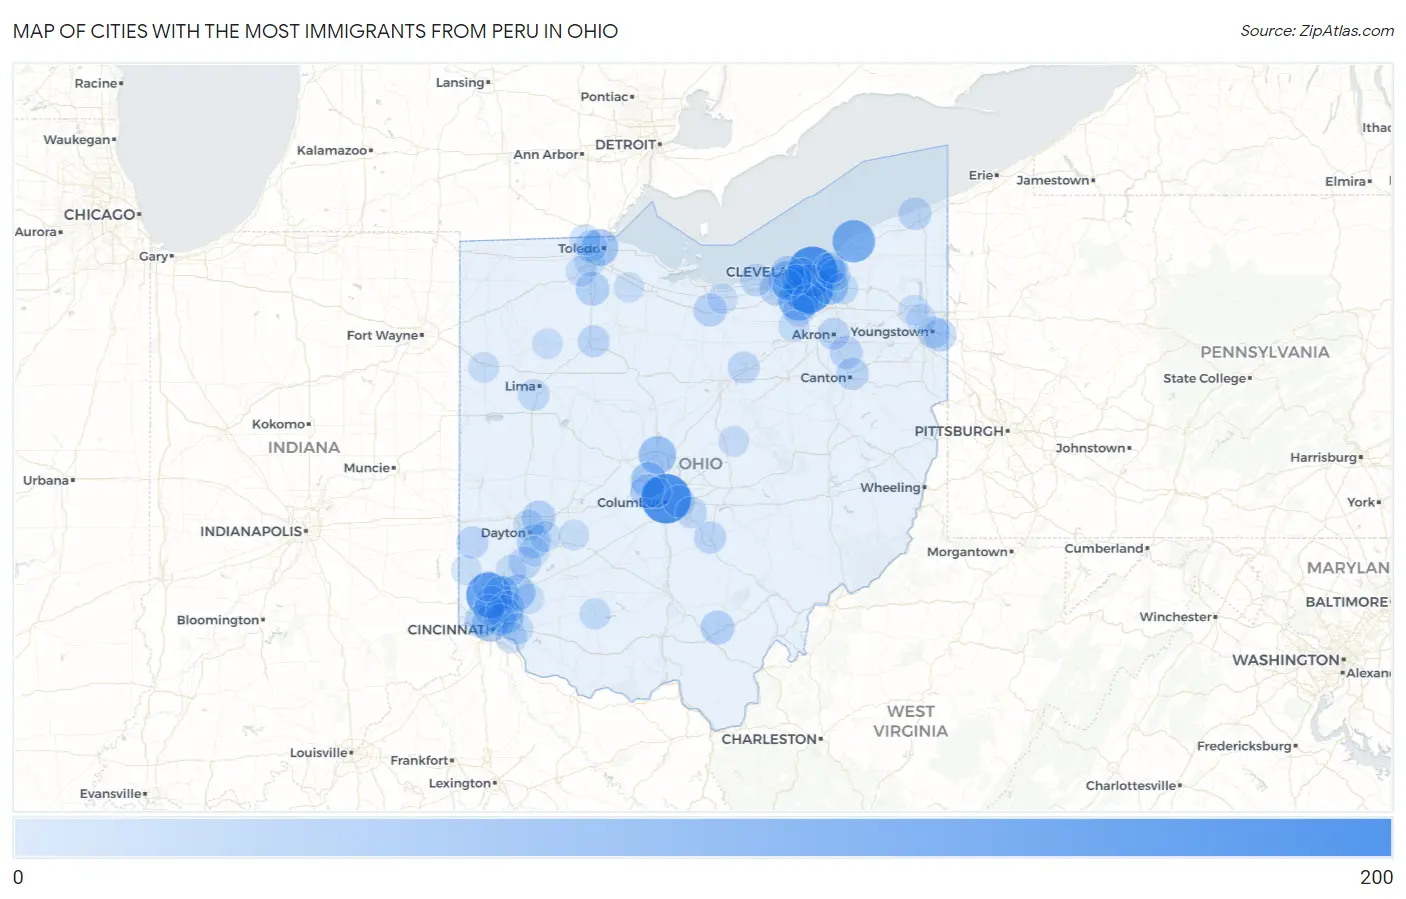
Map of Cities with the Most Immigrants from Peru in Ohio
0
200
Cities with the Most Immigrants from Peru in Ohio
| City | Peru | vs State | vs National | |
| 1. | Columbus | 185 | 3,210(5.76%)#1 | 461,322(0.04%)#453 |
| 2. | Cleveland | 184 | 3,210(5.73%)#2 | 461,322(0.04%)#458 |
| 3. | Parma | 177 | 3,210(5.51%)#3 | 461,322(0.04%)#479 |
| 4. | Fairfield | 142 | 3,210(4.42%)#4 | 461,322(0.03%)#588 |
| 5. | Mentor | 116 | 3,210(3.61%)#5 | 461,322(0.03%)#675 |
| 6. | Strongsville | 102 | 3,210(3.18%)#6 | 461,322(0.02%)#749 |
| 7. | Westlake | 70 | 3,210(2.18%)#7 | 461,322(0.02%)#995 |
| 8. | Delaware | 69 | 3,210(2.15%)#8 | 461,322(0.01%)#1,003 |
| 9. | Toledo | 59 | 3,210(1.84%)#9 | 461,322(0.01%)#1,109 |
| 10. | Maple Heights | 59 | 3,210(1.84%)#10 | 461,322(0.01%)#1,116 |
| 11. | Cincinnati | 54 | 3,210(1.68%)#11 | 461,322(0.01%)#1,179 |
| 12. | Dublin | 52 | 3,210(1.62%)#12 | 461,322(0.01%)#1,209 |
| 13. | Mason | 51 | 3,210(1.59%)#13 | 461,322(0.01%)#1,233 |
| 14. | Beckett Ridge | 51 | 3,210(1.59%)#14 | 461,322(0.01%)#1,239 |
| 15. | Silverton | 46 | 3,210(1.43%)#15 | 461,322(0.01%)#1,322 |
| 16. | Hilliard | 39 | 3,210(1.21%)#16 | 461,322(0.01%)#1,428 |
| 17. | Huber Heights | 35 | 3,210(1.09%)#17 | 461,322(0.01%)#1,514 |
| 18. | Wellston | 35 | 3,210(1.09%)#18 | 461,322(0.01%)#1,527 |
| 19. | Kettering | 33 | 3,210(1.03%)#19 | 461,322(0.01%)#1,552 |
| 20. | Bowling Green | 33 | 3,210(1.03%)#20 | 461,322(0.01%)#1,556 |
| 21. | Blue Ash | 33 | 3,210(1.03%)#21 | 461,322(0.01%)#1,566 |
| 22. | North Ridgeville | 32 | 3,210(1.00%)#22 | 461,322(0.01%)#1,592 |
| 23. | Cheviot | 31 | 3,210(0.97%)#23 | 461,322(0.01%)#1,639 |
| 24. | Bay Village | 30 | 3,210(0.93%)#24 | 461,322(0.01%)#1,665 |
| 25. | Norwalk | 29 | 3,210(0.90%)#25 | 461,322(0.01%)#1,689 |
| 26. | Forest Park | 28 | 3,210(0.87%)#26 | 461,322(0.01%)#1,723 |
| 27. | Reading | 28 | 3,210(0.87%)#27 | 461,322(0.01%)#1,732 |
| 28. | Uniontown | 26 | 3,210(0.81%)#28 | 461,322(0.01%)#1,790 |
| 29. | Campbell | 25 | 3,210(0.78%)#29 | 461,322(0.01%)#1,824 |
| 30. | Ashtabula | 24 | 3,210(0.75%)#30 | 461,322(0.01%)#1,845 |
| 31. | Canton | 23 | 3,210(0.72%)#31 | 461,322(0.00%)#1,866 |
| 32. | Lorain | 23 | 3,210(0.72%)#32 | 461,322(0.00%)#1,867 |
| 33. | Lancaster | 21 | 3,210(0.65%)#33 | 461,322(0.00%)#1,937 |
| 34. | Norwood | 20 | 3,210(0.62%)#34 | 461,322(0.00%)#1,979 |
| 35. | Whitehall | 19 | 3,210(0.59%)#35 | 461,322(0.00%)#2,014 |
| 36. | Springboro | 19 | 3,210(0.59%)#36 | 461,322(0.00%)#2,015 |
| 37. | Lake Lakengren | 19 | 3,210(0.59%)#37 | 461,322(0.00%)#2,028 |
| 38. | Ashland | 18 | 3,210(0.56%)#38 | 461,322(0.00%)#2,052 |
| 39. | University Heights | 18 | 3,210(0.56%)#39 | 461,322(0.00%)#2,060 |
| 40. | Akron | 17 | 3,210(0.53%)#40 | 461,322(0.00%)#2,085 |
| 41. | Youngstown | 17 | 3,210(0.53%)#41 | 461,322(0.00%)#2,089 |
| 42. | Findlay | 17 | 3,210(0.53%)#42 | 461,322(0.00%)#2,094 |
| 43. | Cleveland Heights | 16 | 3,210(0.50%)#43 | 461,322(0.00%)#2,137 |
| 44. | Brunswick | 16 | 3,210(0.50%)#44 | 461,322(0.00%)#2,139 |
| 45. | Ottawa Hills | 16 | 3,210(0.50%)#45 | 461,322(0.00%)#2,165 |
| 46. | Lakewood | 15 | 3,210(0.47%)#46 | 461,322(0.00%)#2,173 |
| 47. | Pickerington | 14 | 3,210(0.44%)#47 | 461,322(0.00%)#2,246 |
| 48. | Fort Shawnee | 14 | 3,210(0.44%)#48 | 461,322(0.00%)#2,264 |
| 49. | Solon | 13 | 3,210(0.40%)#49 | 461,322(0.00%)#2,297 |
| 50. | Sylvania | 13 | 3,210(0.40%)#50 | 461,322(0.00%)#2,307 |
| 51. | Beachwood | 12 | 3,210(0.37%)#51 | 461,322(0.00%)#2,366 |
| 52. | Coldstream | 12 | 3,210(0.37%)#52 | 461,322(0.00%)#2,400 |
| 53. | North Olmsted | 11 | 3,210(0.34%)#53 | 461,322(0.00%)#2,417 |
| 54. | Hillsboro | 11 | 3,210(0.34%)#54 | 461,322(0.00%)#2,447 |
| 55. | Mount Carmel | 11 | 3,210(0.34%)#55 | 461,322(0.00%)#2,451 |
| 56. | Dayton | 10 | 3,210(0.31%)#56 | 461,322(0.00%)#2,465 |
| 57. | Middletown | 10 | 3,210(0.31%)#57 | 461,322(0.00%)#2,473 |
| 58. | North Royalton | 9 | 3,210(0.28%)#58 | 461,322(0.00%)#2,545 |
| 59. | Medina | 9 | 3,210(0.28%)#59 | 461,322(0.00%)#2,547 |
| 60. | Beavercreek | 8 | 3,210(0.25%)#60 | 461,322(0.00%)#2,593 |
| 61. | South Euclid | 7 | 3,210(0.22%)#61 | 461,322(0.00%)#2,677 |
| 62. | Maumee | 7 | 3,210(0.22%)#62 | 461,322(0.00%)#2,686 |
| 63. | Van Wert | 7 | 3,210(0.22%)#63 | 461,322(0.00%)#2,689 |
| 64. | Mount Healthy | 7 | 3,210(0.22%)#64 | 461,322(0.00%)#2,697 |
| 65. | Waterville | 7 | 3,210(0.22%)#65 | 461,322(0.00%)#2,704 |
| 66. | Maineville | 7 | 3,210(0.22%)#66 | 461,322(0.00%)#2,723 |
| 67. | Ottawa | 6 | 3,210(0.19%)#67 | 461,322(0.00%)#2,786 |
| 68. | Gambier | 6 | 3,210(0.19%)#68 | 461,322(0.00%)#2,799 |
| 69. | Hamilton | 5 | 3,210(0.16%)#69 | 461,322(0.00%)#2,818 |
| 70. | Warren | 5 | 3,210(0.16%)#70 | 461,322(0.00%)#2,821 |
| 71. | Upper Arlington | 5 | 3,210(0.16%)#71 | 461,322(0.00%)#2,823 |
| 72. | Cedarville | 5 | 3,210(0.16%)#72 | 461,322(0.00%)#2,855 |
| 73. | Centerville | 4 | 3,210(0.12%)#73 | 461,322(0.00%)#2,893 |
| 74. | Fairview Park | 4 | 3,210(0.12%)#74 | 461,322(0.00%)#2,901 |
| 75. | Gibsonburg | 4 | 3,210(0.12%)#75 | 461,322(0.00%)#2,927 |
| 76. | Berlin Heights | 4 | 3,210(0.12%)#76 | 461,322(0.00%)#2,949 |
| 77. | Oxford | 2 | 3,210(0.06%)#77 | 461,322(0.00%)#3,032 |
| 78. | Niles | 2 | 3,210(0.06%)#78 | 461,322(0.00%)#3,036 |
Common Questions
What are the Top 10 Cities with the Most Immigrants from Peru in Ohio?
Top 10 Cities with the Most Immigrants from Peru in Ohio are:
#1
185
#2
184
#3
177
#4
142
#5
116
#6
102
#7
70
#8
69
#9
59
#10
59
What city has the Most Immigrants from Peru in Ohio?
Columbus has the Most Immigrants from Peru in Ohio with 185.
What is the Total Immigrants from Peru in the State of Ohio?
Total Immigrants from Peru in Ohio is 3,210.
What is the Total Immigrants from Peru in the United States?
Total Immigrants from Peru in the United States is 461,322.