Cities with the Most Immigrants from Peru in Florida
RELATED REPORTS & OPTIONS
Peru
Florida
Compare Cities
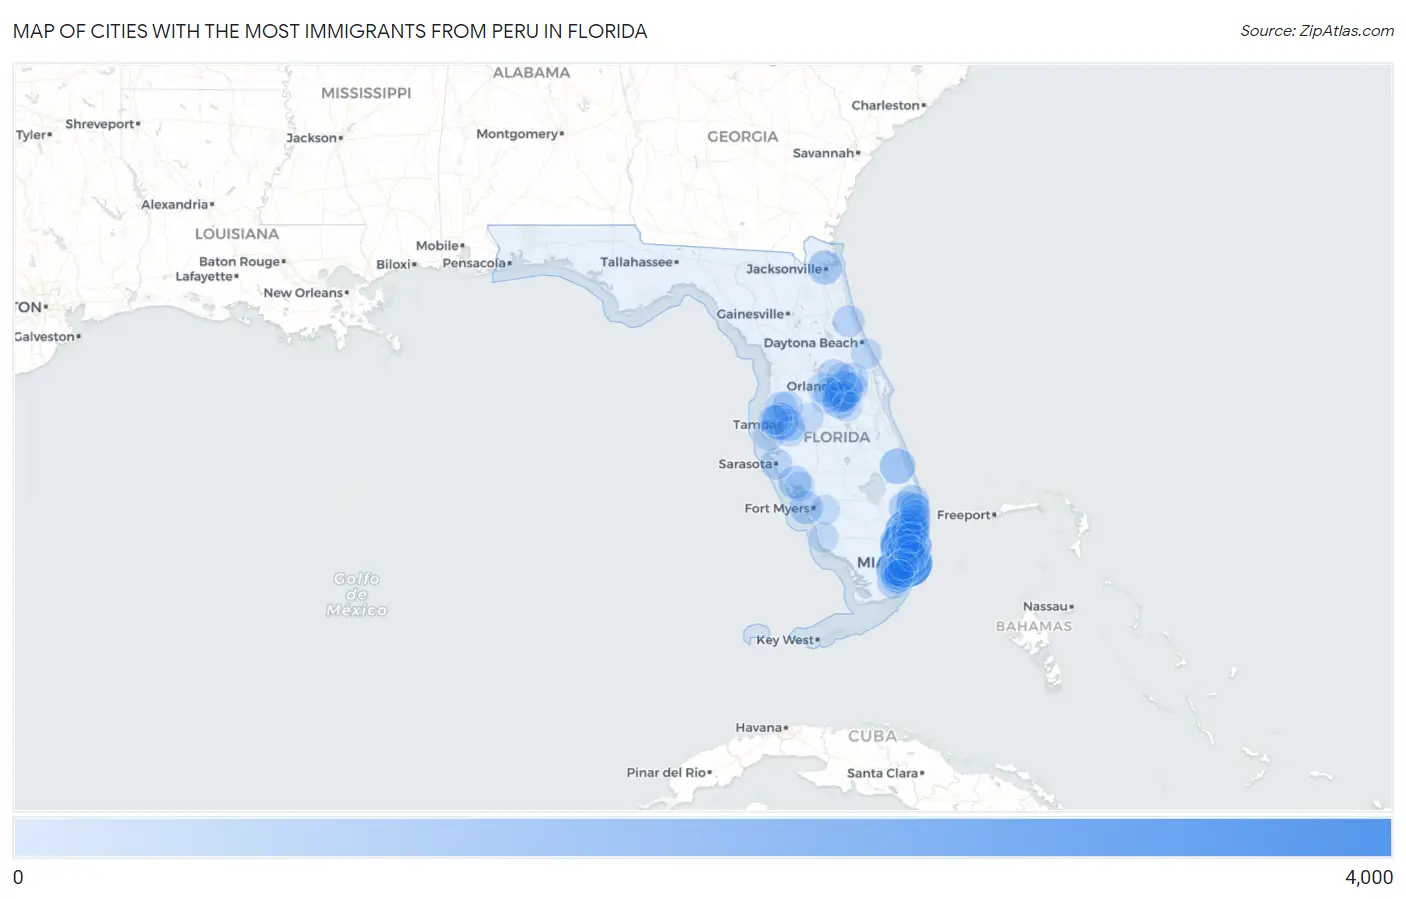
Map of Cities with the Most Immigrants from Peru in Florida
0
4,000
Cities with the Most Immigrants from Peru in Florida
| City | Peru | vs State | vs National | |
| 1. | Miami | 3,900 | 96,693(4.03%)#1 | 461,322(0.85%)#5 |
| 2. | Hollywood | 2,597 | 96,693(2.69%)#2 | 461,322(0.56%)#10 |
| 3. | Coral Springs | 2,415 | 96,693(2.50%)#3 | 461,322(0.52%)#13 |
| 4. | Pembroke Pines | 2,336 | 96,693(2.42%)#4 | 461,322(0.51%)#14 |
| 5. | North Miami Beach | 2,029 | 96,693(2.10%)#5 | 461,322(0.44%)#16 |
| 6. | Coconut Creek | 1,747 | 96,693(1.81%)#6 | 461,322(0.38%)#20 |
| 7. | Sunrise | 1,683 | 96,693(1.74%)#7 | 461,322(0.36%)#22 |
| 8. | The Hammocks | 1,639 | 96,693(1.70%)#8 | 461,322(0.36%)#24 |
| 9. | Orlando | 1,576 | 96,693(1.63%)#9 | 461,322(0.34%)#25 |
| 10. | Kendall | 1,552 | 96,693(1.61%)#10 | 461,322(0.34%)#26 |
| 11. | Tamarac | 1,542 | 96,693(1.59%)#11 | 461,322(0.33%)#29 |
| 12. | Tampa | 1,463 | 96,693(1.51%)#12 | 461,322(0.32%)#33 |
| 13. | Hialeah | 1,401 | 96,693(1.45%)#13 | 461,322(0.30%)#36 |
| 14. | Miami Beach | 1,339 | 96,693(1.38%)#14 | 461,322(0.29%)#39 |
| 15. | Doral | 1,260 | 96,693(1.30%)#15 | 461,322(0.27%)#41 |
| 16. | Port St Lucie | 1,197 | 96,693(1.24%)#16 | 461,322(0.26%)#43 |
| 17. | Kendall West | 1,143 | 96,693(1.18%)#17 | 461,322(0.25%)#49 |
| 18. | Weston | 1,048 | 96,693(1.08%)#18 | 461,322(0.23%)#54 |
| 19. | Davie | 1,047 | 96,693(1.08%)#19 | 461,322(0.23%)#55 |
| 20. | Fort Lauderdale | 1,038 | 96,693(1.07%)#20 | 461,322(0.23%)#57 |
| 21. | Kissimmee | 986 | 96,693(1.02%)#21 | 461,322(0.21%)#63 |
| 22. | Kendale Lakes | 969 | 96,693(1.00%)#22 | 461,322(0.21%)#64 |
| 23. | Jacksonville | 935 | 96,693(0.97%)#23 | 461,322(0.20%)#66 |
| 24. | Aventura | 902 | 96,693(0.93%)#24 | 461,322(0.20%)#69 |
| 25. | Hallandale Beach | 854 | 96,693(0.88%)#25 | 461,322(0.19%)#72 |
| 26. | Greenacres | 825 | 96,693(0.85%)#26 | 461,322(0.18%)#74 |
| 27. | Miramar | 815 | 96,693(0.84%)#27 | 461,322(0.18%)#76 |
| 28. | Country Club | 803 | 96,693(0.83%)#28 | 461,322(0.17%)#78 |
| 29. | Cape Coral | 771 | 96,693(0.80%)#29 | 461,322(0.17%)#83 |
| 30. | Three Lakes | 751 | 96,693(0.78%)#30 | 461,322(0.16%)#84 |
| 31. | North Port | 734 | 96,693(0.76%)#31 | 461,322(0.16%)#87 |
| 32. | Margate | 692 | 96,693(0.72%)#32 | 461,322(0.15%)#93 |
| 33. | Wellington | 673 | 96,693(0.70%)#33 | 461,322(0.15%)#96 |
| 34. | Fountainebleau | 656 | 96,693(0.68%)#34 | 461,322(0.14%)#98 |
| 35. | Homestead | 645 | 96,693(0.67%)#35 | 461,322(0.14%)#101 |
| 36. | West Palm Beach | 639 | 96,693(0.66%)#36 | 461,322(0.14%)#105 |
| 37. | Southchase | 637 | 96,693(0.66%)#37 | 461,322(0.14%)#108 |
| 38. | Tamiami | 634 | 96,693(0.66%)#38 | 461,322(0.14%)#109 |
| 39. | Westchester | 624 | 96,693(0.65%)#39 | 461,322(0.14%)#112 |
| 40. | Deerfield Beach | 599 | 96,693(0.62%)#40 | 461,322(0.13%)#121 |
| 41. | Sunny Isles Beach | 571 | 96,693(0.59%)#41 | 461,322(0.12%)#128 |
| 42. | Brandon | 568 | 96,693(0.59%)#42 | 461,322(0.12%)#131 |
| 43. | North Lauderdale | 555 | 96,693(0.57%)#43 | 461,322(0.12%)#133 |
| 44. | Land O Lakes | 536 | 96,693(0.55%)#44 | 461,322(0.12%)#136 |
| 45. | Boca Raton | 534 | 96,693(0.55%)#45 | 461,322(0.12%)#137 |
| 46. | Palm Coast | 534 | 96,693(0.55%)#46 | 461,322(0.12%)#138 |
| 47. | Oviedo | 516 | 96,693(0.53%)#47 | 461,322(0.11%)#144 |
| 48. | Cutler Bay | 508 | 96,693(0.53%)#48 | 461,322(0.11%)#150 |
| 49. | Apopka | 492 | 96,693(0.51%)#49 | 461,322(0.11%)#152 |
| 50. | Lauderhill | 488 | 96,693(0.50%)#50 | 461,322(0.11%)#154 |
| 51. | Miami Lakes | 468 | 96,693(0.48%)#51 | 461,322(0.10%)#159 |
| 52. | Sarasota | 461 | 96,693(0.48%)#52 | 461,322(0.10%)#163 |
| 53. | Richmond West | 461 | 96,693(0.48%)#53 | 461,322(0.10%)#165 |
| 54. | St Petersburg | 456 | 96,693(0.47%)#54 | 461,322(0.10%)#169 |
| 55. | Pompano Beach | 449 | 96,693(0.46%)#55 | 461,322(0.10%)#172 |
| 56. | Hunters Creek | 446 | 96,693(0.46%)#56 | 461,322(0.10%)#173 |
| 57. | Naranja | 428 | 96,693(0.44%)#57 | 461,322(0.09%)#184 |
| 58. | The Crossings | 422 | 96,693(0.44%)#58 | 461,322(0.09%)#193 |
| 59. | Miami Gardens | 415 | 96,693(0.43%)#59 | 461,322(0.09%)#195 |
| 60. | Ojus | 404 | 96,693(0.42%)#60 | 461,322(0.09%)#201 |
| 61. | North Miami | 389 | 96,693(0.40%)#61 | 461,322(0.08%)#213 |
| 62. | Delray Beach | 382 | 96,693(0.40%)#62 | 461,322(0.08%)#214 |
| 63. | Palmetto Estates | 360 | 96,693(0.37%)#63 | 461,322(0.08%)#231 |
| 64. | Princeton | 359 | 96,693(0.37%)#64 | 461,322(0.08%)#233 |
| 65. | Meadow Woods | 334 | 96,693(0.35%)#65 | 461,322(0.07%)#248 |
| 66. | Coral Gables | 324 | 96,693(0.34%)#66 | 461,322(0.07%)#253 |
| 67. | New Smyrna Beach | 320 | 96,693(0.33%)#67 | 461,322(0.07%)#256 |
| 68. | Ives Estates | 318 | 96,693(0.33%)#68 | 461,322(0.07%)#259 |
| 69. | Sunset | 318 | 96,693(0.33%)#69 | 461,322(0.07%)#260 |
| 70. | Riverview | 315 | 96,693(0.33%)#70 | 461,322(0.07%)#262 |
| 71. | Country Walk | 313 | 96,693(0.32%)#71 | 461,322(0.07%)#263 |
| 72. | Wesley Chapel | 300 | 96,693(0.31%)#72 | 461,322(0.07%)#282 |
| 73. | Alafaya | 296 | 96,693(0.31%)#73 | 461,322(0.06%)#287 |
| 74. | Dania Beach | 289 | 96,693(0.30%)#74 | 461,322(0.06%)#292 |
| 75. | Parkland | 284 | 96,693(0.29%)#75 | 461,322(0.06%)#297 |
| 76. | University Cdp Hillsborough County | 282 | 96,693(0.29%)#76 | 461,322(0.06%)#298 |
| 77. | Palm Springs | 282 | 96,693(0.29%)#77 | 461,322(0.06%)#299 |
| 78. | Key Biscayne | 276 | 96,693(0.29%)#78 | 461,322(0.06%)#309 |
| 79. | Richmond Heights | 273 | 96,693(0.28%)#79 | 461,322(0.06%)#312 |
| 80. | Boynton Beach | 270 | 96,693(0.28%)#80 | 461,322(0.06%)#315 |
| 81. | West Miami | 248 | 96,693(0.26%)#81 | 461,322(0.05%)#340 |
| 82. | West Park | 243 | 96,693(0.25%)#82 | 461,322(0.05%)#347 |
| 83. | Clermont | 239 | 96,693(0.25%)#83 | 461,322(0.05%)#351 |
| 84. | Palmetto Bay | 235 | 96,693(0.24%)#84 | 461,322(0.05%)#358 |
| 85. | St Cloud | 227 | 96,693(0.23%)#85 | 461,322(0.05%)#368 |
| 86. | Egypt Lake Leto | 227 | 96,693(0.23%)#86 | 461,322(0.05%)#369 |
| 87. | Cooper City | 223 | 96,693(0.23%)#87 | 461,322(0.05%)#374 |
| 88. | Town N Country | 219 | 96,693(0.23%)#88 | 461,322(0.05%)#381 |
| 89. | Golden Gate | 217 | 96,693(0.22%)#89 | 461,322(0.05%)#385 |
| 90. | Surfside | 217 | 96,693(0.22%)#90 | 461,322(0.05%)#387 |
| 91. | Lehigh Acres | 208 | 96,693(0.22%)#91 | 461,322(0.05%)#398 |
| 92. | Four Corners | 205 | 96,693(0.21%)#92 | 461,322(0.04%)#407 |
| 93. | Altamonte Springs | 202 | 96,693(0.21%)#93 | 461,322(0.04%)#416 |
| 94. | Lakewood Ranch | 201 | 96,693(0.21%)#94 | 461,322(0.04%)#418 |
| 95. | Lakeland | 198 | 96,693(0.20%)#95 | 461,322(0.04%)#425 |
| 96. | Horizon West | 189 | 96,693(0.20%)#96 | 461,322(0.04%)#445 |
| 97. | Port Charlotte | 187 | 96,693(0.19%)#97 | 461,322(0.04%)#448 |
| 98. | Oakland Park | 185 | 96,693(0.19%)#98 | 461,322(0.04%)#455 |
| 99. | Coral Terrace | 185 | 96,693(0.19%)#99 | 461,322(0.04%)#456 |
| 100. | South Miami Heights | 183 | 96,693(0.19%)#100 | 461,322(0.04%)#463 |
Common Questions
What are the Top 10 Cities with the Most Immigrants from Peru in Florida?
Top 10 Cities with the Most Immigrants from Peru in Florida are:
#1
3,900
#2
2,597
#3
2,415
#4
2,336
#5
2,029
#6
1,747
#7
1,683
#8
1,639
#9
1,576
#10
1,552
What city has the Most Immigrants from Peru in Florida?
Miami has the Most Immigrants from Peru in Florida with 3,900.
What is the Total Immigrants from Peru in the State of Florida?
Total Immigrants from Peru in Florida is 96,693.
What is the Total Immigrants from Peru in the United States?
Total Immigrants from Peru in the United States is 461,322.