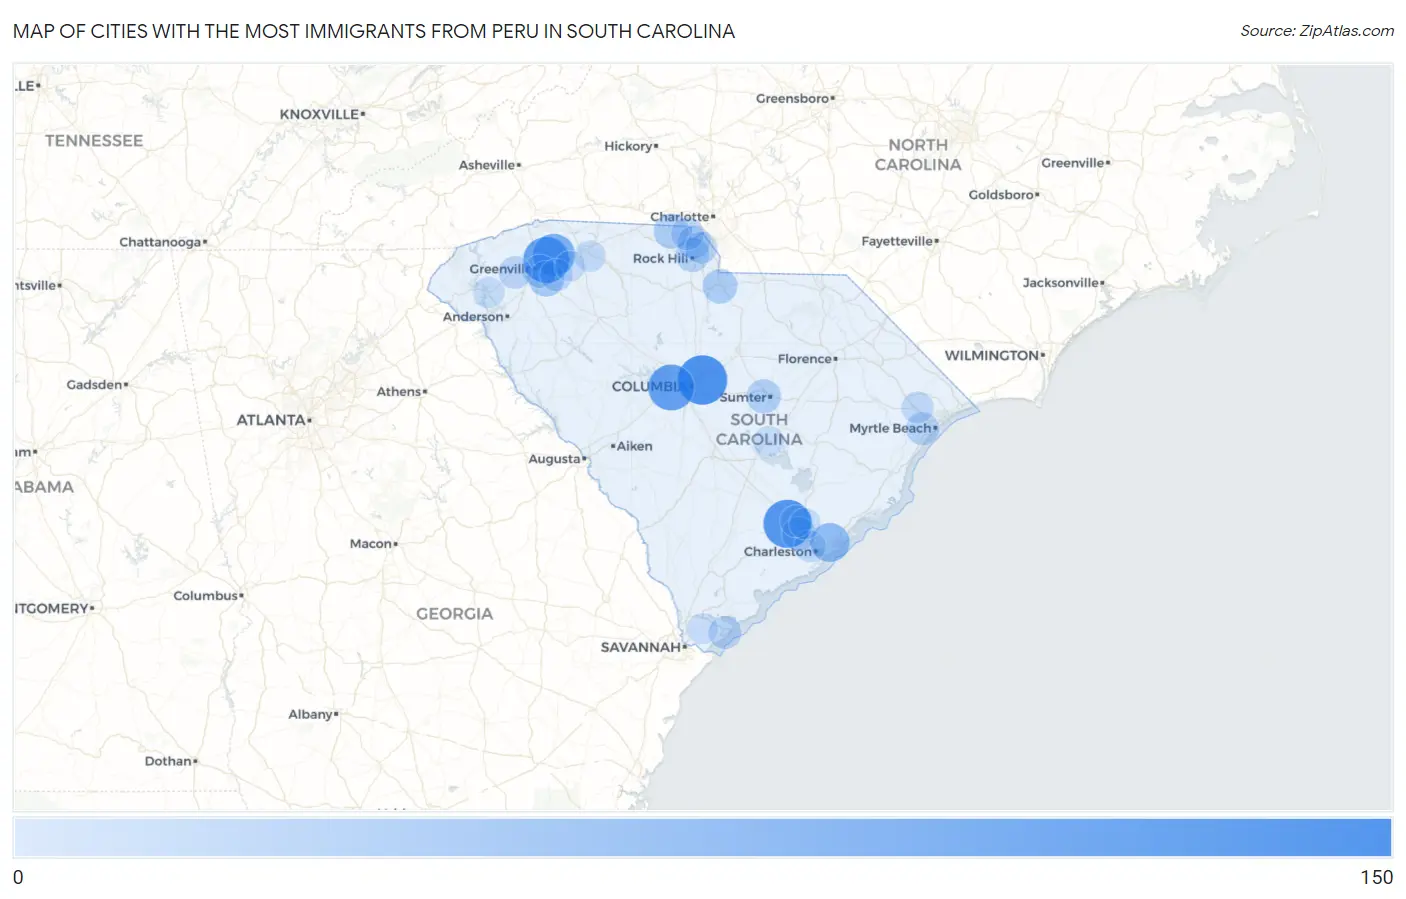
Cities with the Most Immigrants from Peru in South Carolina
RELATED REPORTS & OPTIONS
Peru
South Carolina
Compare Cities
Map of Cities with the Most Immigrants from Peru in South Carolina
0
150
Cities with the Most Immigrants from Peru in South Carolina
| City | Peru | vs State | vs National | |
| 1. | Columbia | 110 | 1,273(8.64%)#1 | 461,322(0.02%)#707 |
| 2. | Summerville | 102 | 1,273(8.01%)#2 | 461,322(0.02%)#748 |
| 3. | Taylors | 90 | 1,273(7.07%)#3 | 461,322(0.02%)#832 |
| 4. | Lexington | 89 | 1,273(6.99%)#4 | 461,322(0.02%)#838 |
| 5. | Greer | 69 | 1,273(5.42%)#5 | 461,322(0.01%)#1,004 |
| 6. | Baxter | 51 | 1,273(4.01%)#6 | 461,322(0.01%)#1,240 |
| 7. | Mount Pleasant | 50 | 1,273(3.93%)#7 | 461,322(0.01%)#1,243 |
| 8. | Mauldin | 31 | 1,273(2.44%)#8 | 461,322(0.01%)#1,626 |
| 9. | Clover | 26 | 1,273(2.04%)#9 | 461,322(0.01%)#1,791 |
| 10. | Lancaster | 25 | 1,273(1.96%)#10 | 461,322(0.01%)#1,822 |
| 11. | Sumter | 22 | 1,273(1.73%)#11 | 461,322(0.00%)#1,902 |
| 12. | Rock Hill | 21 | 1,273(1.65%)#12 | 461,322(0.00%)#1,935 |
| 13. | North Charleston | 19 | 1,273(1.49%)#13 | 461,322(0.00%)#1,999 |
| 14. | Greenville | 17 | 1,273(1.34%)#14 | 461,322(0.00%)#2,087 |
| 15. | Tega Cay | 17 | 1,273(1.34%)#15 | 461,322(0.00%)#2,114 |
| 16. | Socastee | 16 | 1,273(1.26%)#16 | 461,322(0.00%)#2,142 |
| 17. | Lake Wylie | 15 | 1,273(1.18%)#17 | 461,322(0.00%)#2,196 |
| 18. | Hilton Head Island | 14 | 1,273(1.10%)#18 | 461,322(0.00%)#2,232 |
| 19. | Easley | 14 | 1,273(1.10%)#19 | 461,322(0.00%)#2,247 |
| 20. | Five Forks | 12 | 1,273(0.94%)#20 | 461,322(0.00%)#2,360 |
| 21. | Fort Mill | 11 | 1,273(0.86%)#21 | 461,322(0.00%)#2,421 |
| 22. | Charleston | 10 | 1,273(0.79%)#22 | 461,322(0.00%)#2,464 |
| 23. | Conway | 10 | 1,273(0.79%)#23 | 461,322(0.00%)#2,489 |
| 24. | Ladson | 10 | 1,273(0.79%)#24 | 461,322(0.00%)#2,496 |
| 25. | Spartanburg | 7 | 1,273(0.55%)#25 | 461,322(0.00%)#2,665 |
| 26. | Goose Creek | 6 | 1,273(0.47%)#26 | 461,322(0.00%)#2,740 |
| 27. | Clemson | 6 | 1,273(0.47%)#27 | 461,322(0.00%)#2,765 |
| 28. | Bluffton | 4 | 1,273(0.31%)#28 | 461,322(0.00%)#2,892 |
| 29. | Chickasaw Point | 4 | 1,273(0.31%)#29 | 461,322(0.00%)#2,950 |
| 30. | Summerton | 3 | 1,273(0.24%)#30 | 461,322(0.00%)#3,017 |
| 31. | Reidville | 2 | 1,273(0.16%)#31 | 461,322(0.00%)#3,060 |
| 32. | Fripp Island | 1 | 1,273(0.08%)#32 | 461,322(0.00%)#3,124 |
Common Questions
What are the Top 10 Cities with the Most Immigrants from Peru in South Carolina?
Top 10 Cities with the Most Immigrants from Peru in South Carolina are:
#1
110
#2
102
#3
90
#4
89
#5
69
#6
50
#7
31
#8
26
#9
25
#10
22
What city has the Most Immigrants from Peru in South Carolina?
Columbia has the Most Immigrants from Peru in South Carolina with 110.
What is the Total Immigrants from Peru in the State of South Carolina?
Total Immigrants from Peru in South Carolina is 1,273.
What is the Total Immigrants from Peru in the United States?
Total Immigrants from Peru in the United States is 461,322.