Cities with the Most Immigrants from Northern Europe in New York
RELATED REPORTS & OPTIONS
Northern Europe
New York
Compare Cities
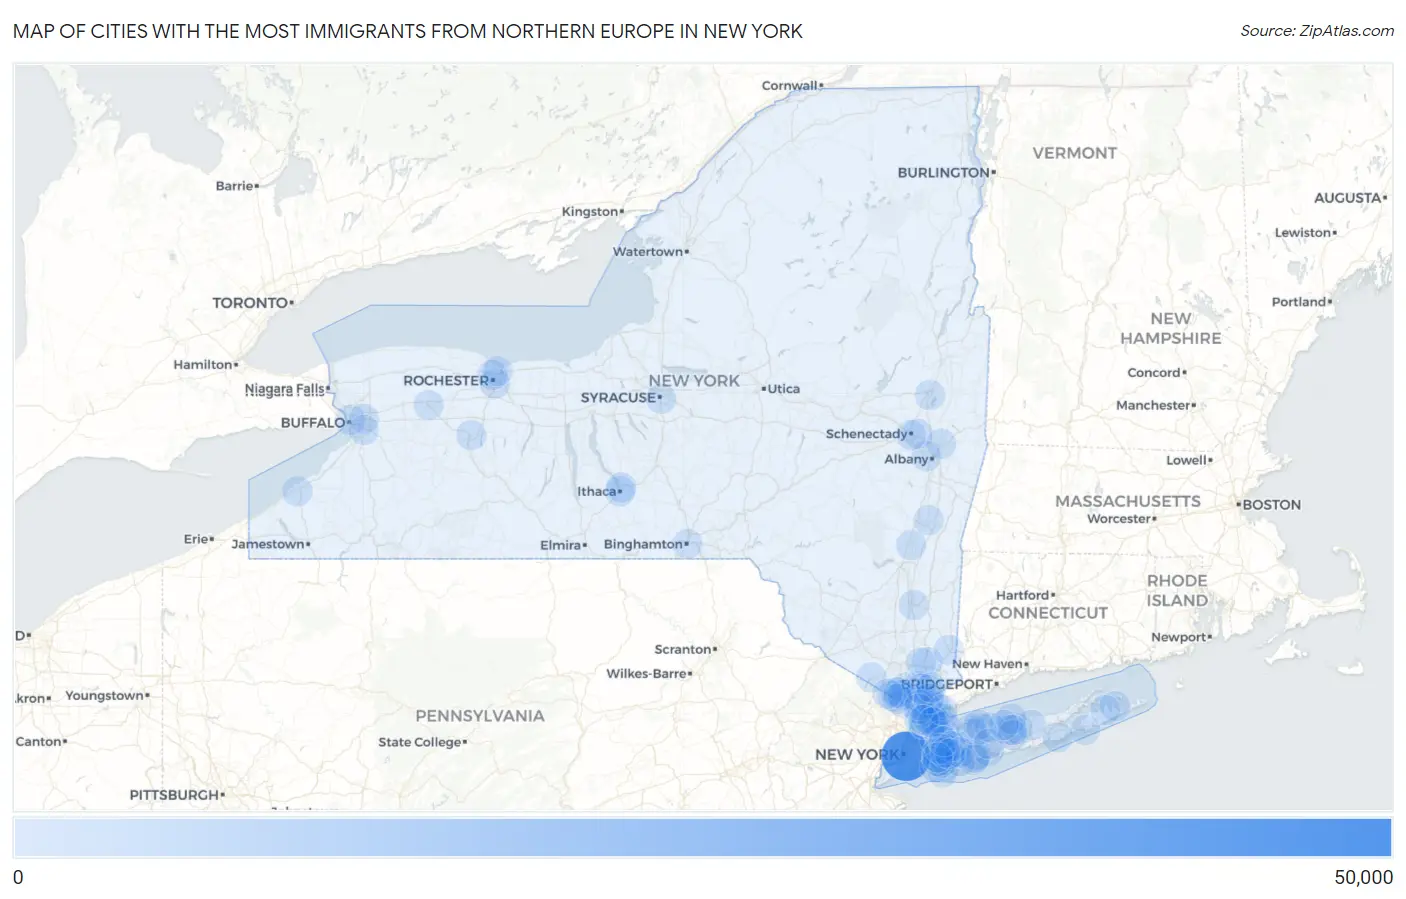
Map of Cities with the Most Immigrants from Northern Europe in New York
0
50,000
Cities with the Most Immigrants from Northern Europe in New York
| City | Northern Europe | vs State | vs National | |
| 1. | New York | 49,604 | 98,958(50.13%)#1 | 944,917(5.25%)#1 |
| 2. | Yonkers | 3,394 | 98,958(3.43%)#2 | 944,917(0.36%)#15 |
| 3. | Pearl River | 704 | 98,958(0.71%)#3 | 944,917(0.07%)#137 |
| 4. | Scarsdale | 692 | 98,958(0.70%)#4 | 944,917(0.07%)#145 |
| 5. | New Rochelle | 625 | 98,958(0.63%)#5 | 944,917(0.07%)#162 |
| 6. | Rye | 583 | 98,958(0.59%)#6 | 944,917(0.06%)#175 |
| 7. | Ithaca | 478 | 98,958(0.48%)#7 | 944,917(0.05%)#208 |
| 8. | Airmont | 442 | 98,958(0.45%)#8 | 944,917(0.05%)#237 |
| 9. | White Plains | 424 | 98,958(0.43%)#9 | 944,917(0.04%)#257 |
| 10. | Floral Park | 422 | 98,958(0.43%)#10 | 944,917(0.04%)#263 |
| 11. | Jefferson Valley Yorktown | 398 | 98,958(0.40%)#11 | 944,917(0.04%)#286 |
| 12. | Albany | 373 | 98,958(0.38%)#12 | 944,917(0.04%)#316 |
| 13. | Ossining | 370 | 98,958(0.37%)#13 | 944,917(0.04%)#320 |
| 14. | Tarrytown | 331 | 98,958(0.33%)#14 | 944,917(0.04%)#358 |
| 15. | Brighton | 330 | 98,958(0.33%)#15 | 944,917(0.03%)#360 |
| 16. | New City | 323 | 98,958(0.33%)#16 | 944,917(0.03%)#367 |
| 17. | Rochester | 322 | 98,958(0.33%)#17 | 944,917(0.03%)#370 |
| 18. | Mount Vernon | 311 | 98,958(0.31%)#18 | 944,917(0.03%)#382 |
| 19. | Buffalo | 304 | 98,958(0.31%)#19 | 944,917(0.03%)#390 |
| 20. | Oceanside | 304 | 98,958(0.31%)#20 | 944,917(0.03%)#392 |
| 21. | Long Beach | 288 | 98,958(0.29%)#21 | 944,917(0.03%)#418 |
| 22. | Saratoga Springs | 285 | 98,958(0.29%)#22 | 944,917(0.03%)#424 |
| 23. | Bay Shore | 282 | 98,958(0.28%)#23 | 944,917(0.03%)#435 |
| 24. | Harrison | 277 | 98,958(0.28%)#24 | 944,917(0.03%)#451 |
| 25. | Eastchester | 271 | 98,958(0.27%)#25 | 944,917(0.03%)#466 |
| 26. | Syracuse | 256 | 98,958(0.26%)#26 | 944,917(0.03%)#504 |
| 27. | Monsey | 254 | 98,958(0.26%)#27 | 944,917(0.03%)#507 |
| 28. | Lake Mohegan | 245 | 98,958(0.25%)#28 | 944,917(0.03%)#545 |
| 29. | East Meadow | 235 | 98,958(0.24%)#29 | 944,917(0.02%)#581 |
| 30. | Spring Valley | 219 | 98,958(0.22%)#30 | 944,917(0.02%)#636 |
| 31. | Nanuet | 214 | 98,958(0.22%)#31 | 944,917(0.02%)#651 |
| 32. | Pleasantville | 204 | 98,958(0.21%)#32 | 944,917(0.02%)#688 |
| 33. | Cedarhurst | 200 | 98,958(0.20%)#33 | 944,917(0.02%)#703 |
| 34. | Huntington Station | 198 | 98,958(0.20%)#34 | 944,917(0.02%)#711 |
| 35. | Niskayuna | 198 | 98,958(0.20%)#35 | 944,917(0.02%)#712 |
| 36. | Sea Cliff | 190 | 98,958(0.19%)#36 | 944,917(0.02%)#737 |
| 37. | Great Neck | 187 | 98,958(0.19%)#37 | 944,917(0.02%)#753 |
| 38. | Rockville Centre | 186 | 98,958(0.19%)#38 | 944,917(0.02%)#757 |
| 39. | Port Washington | 184 | 98,958(0.19%)#39 | 944,917(0.02%)#764 |
| 40. | Hicksville | 182 | 98,958(0.18%)#40 | 944,917(0.02%)#770 |
| 41. | Southampton | 182 | 98,958(0.18%)#41 | 944,917(0.02%)#771 |
| 42. | Irvington | 181 | 98,958(0.18%)#42 | 944,917(0.02%)#776 |
| 43. | Malden On Hudson | 181 | 98,958(0.18%)#43 | 944,917(0.02%)#778 |
| 44. | West Babylon | 177 | 98,958(0.18%)#44 | 944,917(0.02%)#783 |
| 45. | East Northport | 171 | 98,958(0.17%)#45 | 944,917(0.02%)#817 |
| 46. | Schenectady | 168 | 98,958(0.17%)#46 | 944,917(0.02%)#831 |
| 47. | Centereach | 162 | 98,958(0.16%)#47 | 944,917(0.02%)#874 |
| 48. | Kings Park | 160 | 98,958(0.16%)#48 | 944,917(0.02%)#889 |
| 49. | Glen Cove | 159 | 98,958(0.16%)#49 | 944,917(0.02%)#895 |
| 50. | Greenwood Lake | 159 | 98,958(0.16%)#50 | 944,917(0.02%)#897 |
| 51. | Huntington | 156 | 98,958(0.16%)#51 | 944,917(0.02%)#919 |
| 52. | Carmel | 153 | 98,958(0.15%)#52 | 944,917(0.02%)#944 |
| 53. | Copiague | 152 | 98,958(0.15%)#53 | 944,917(0.02%)#949 |
| 54. | Briarcliff Manor | 152 | 98,958(0.15%)#54 | 944,917(0.02%)#950 |
| 55. | Coram | 142 | 98,958(0.14%)#55 | 944,917(0.02%)#1,013 |
| 56. | Ridge | 142 | 98,958(0.14%)#56 | 944,917(0.02%)#1,018 |
| 57. | Port Jefferson | 139 | 98,958(0.14%)#57 | 944,917(0.01%)#1,043 |
| 58. | Cheektowaga | 137 | 98,958(0.14%)#58 | 944,917(0.01%)#1,049 |
| 59. | Dobbs Ferry | 135 | 98,958(0.14%)#59 | 944,917(0.01%)#1,074 |
| 60. | Mineola | 134 | 98,958(0.14%)#60 | 944,917(0.01%)#1,081 |
| 61. | Mamaroneck | 133 | 98,958(0.13%)#61 | 944,917(0.01%)#1,085 |
| 62. | West Seneca | 132 | 98,958(0.13%)#62 | 944,917(0.01%)#1,092 |
| 63. | Wantagh | 132 | 98,958(0.13%)#63 | 944,917(0.01%)#1,094 |
| 64. | Chestnut Ridge | 132 | 98,958(0.13%)#64 | 944,917(0.01%)#1,097 |
| 65. | Lynbrook | 131 | 98,958(0.13%)#65 | 944,917(0.01%)#1,107 |
| 66. | Levittown | 130 | 98,958(0.13%)#66 | 944,917(0.01%)#1,110 |
| 67. | Port Chester | 128 | 98,958(0.13%)#67 | 944,917(0.01%)#1,126 |
| 68. | Troy | 127 | 98,958(0.13%)#68 | 944,917(0.01%)#1,133 |
| 69. | Batavia | 124 | 98,958(0.13%)#69 | 944,917(0.01%)#1,167 |
| 70. | Valhalla | 123 | 98,958(0.12%)#70 | 944,917(0.01%)#1,175 |
| 71. | Greenville Cdp Westchester County | 121 | 98,958(0.12%)#71 | 944,917(0.01%)#1,186 |
| 72. | Bronxville | 120 | 98,958(0.12%)#72 | 944,917(0.01%)#1,202 |
| 73. | Hudson | 119 | 98,958(0.12%)#73 | 944,917(0.01%)#1,215 |
| 74. | Lindenhurst | 116 | 98,958(0.12%)#74 | 944,917(0.01%)#1,233 |
| 75. | Valley Stream | 115 | 98,958(0.12%)#75 | 944,917(0.01%)#1,248 |
| 76. | Westbury | 115 | 98,958(0.12%)#76 | 944,917(0.01%)#1,252 |
| 77. | North New Hyde Park | 115 | 98,958(0.12%)#77 | 944,917(0.01%)#1,253 |
| 78. | Irondequoit | 113 | 98,958(0.11%)#78 | 944,917(0.01%)#1,268 |
| 79. | Tuxedo | 110 | 98,958(0.11%)#79 | 944,917(0.01%)#1,314 |
| 80. | Chappaqua | 110 | 98,958(0.11%)#80 | 944,917(0.01%)#1,315 |
| 81. | Poughkeepsie | 108 | 98,958(0.11%)#81 | 944,917(0.01%)#1,325 |
| 82. | Fredonia | 108 | 98,958(0.11%)#82 | 944,917(0.01%)#1,330 |
| 83. | Binghamton | 106 | 98,958(0.11%)#83 | 944,917(0.01%)#1,348 |
| 84. | Northport | 106 | 98,958(0.11%)#84 | 944,917(0.01%)#1,358 |
| 85. | Garden City | 105 | 98,958(0.11%)#85 | 944,917(0.01%)#1,367 |
| 86. | Farmingville | 104 | 98,958(0.11%)#86 | 944,917(0.01%)#1,379 |
| 87. | Larchmont | 104 | 98,958(0.11%)#87 | 944,917(0.01%)#1,382 |
| 88. | Cayuga Heights | 104 | 98,958(0.11%)#88 | 944,917(0.01%)#1,384 |
| 89. | Springs | 103 | 98,958(0.10%)#89 | 944,917(0.01%)#1,394 |
| 90. | Westhampton | 103 | 98,958(0.10%)#90 | 944,917(0.01%)#1,397 |
| 91. | Brentwood | 102 | 98,958(0.10%)#91 | 944,917(0.01%)#1,400 |
| 92. | Roslyn | 102 | 98,958(0.10%)#92 | 944,917(0.01%)#1,418 |
| 93. | Geneseo | 99 | 98,958(0.10%)#93 | 944,917(0.01%)#1,459 |
| 94. | Northwest Harbor | 99 | 98,958(0.10%)#94 | 944,917(0.01%)#1,461 |
| 95. | Uniondale | 98 | 98,958(0.10%)#95 | 944,917(0.01%)#1,466 |
| 96. | Suffern | 96 | 98,958(0.10%)#96 | 944,917(0.01%)#1,510 |
| 97. | Brewster | 95 | 98,958(0.10%)#97 | 944,917(0.01%)#1,538 |
| 98. | Selden | 94 | 98,958(0.09%)#98 | 944,917(0.01%)#1,543 |
| 99. | North Valley Stream | 93 | 98,958(0.09%)#99 | 944,917(0.01%)#1,553 |
| 100. | Stony Brook | 93 | 98,958(0.09%)#100 | 944,917(0.01%)#1,555 |
Common Questions
What are the Top 10 Cities with the Most Immigrants from Northern Europe in New York?
Top 10 Cities with the Most Immigrants from Northern Europe in New York are:
#1
49,604
#2
3,394
#3
704
#4
692
#5
625
#6
583
#7
478
#8
442
#9
424
#10
422
What city has the Most Immigrants from Northern Europe in New York?
New York has the Most Immigrants from Northern Europe in New York with 49,604.
What is the Total Immigrants from Northern Europe in the State of New York?
Total Immigrants from Northern Europe in New York is 98,958.
What is the Total Immigrants from Northern Europe in the United States?
Total Immigrants from Northern Europe in the United States is 944,917.