Cities with the Most Immigrants from Northern Europe in Utah
RELATED REPORTS & OPTIONS
Northern Europe
Utah
Compare Cities
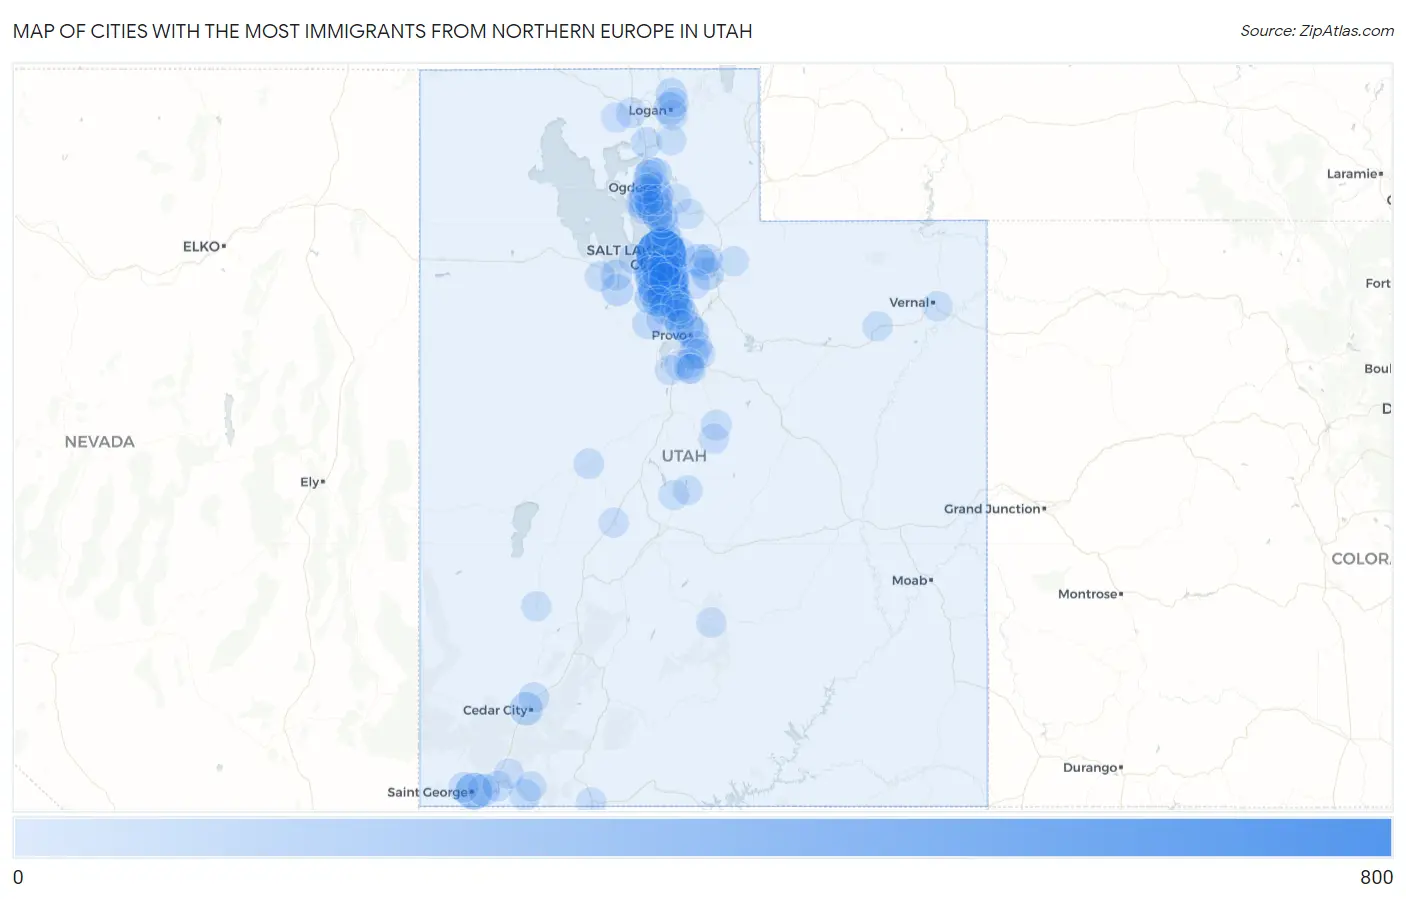
Map of Cities with the Most Immigrants from Northern Europe in Utah
0
800
Cities with the Most Immigrants from Northern Europe in Utah
| City | Northern Europe | vs State | vs National | |
| 1. | Salt Lake City | 778 | 7,056(11.03%)#1 | 944,917(0.08%)#118 |
| 2. | Draper | 457 | 7,056(6.48%)#2 | 944,917(0.05%)#222 |
| 3. | Sandy | 330 | 7,056(4.68%)#3 | 944,917(0.03%)#359 |
| 4. | St George | 263 | 7,056(3.73%)#4 | 944,917(0.03%)#490 |
| 5. | Millcreek | 251 | 7,056(3.56%)#5 | 944,917(0.03%)#518 |
| 6. | Layton | 217 | 7,056(3.08%)#6 | 944,917(0.02%)#644 |
| 7. | Orem | 166 | 7,056(2.35%)#7 | 944,917(0.02%)#842 |
| 8. | West Jordan | 158 | 7,056(2.24%)#8 | 944,917(0.02%)#898 |
| 9. | Cottonwood Heights | 147 | 7,056(2.08%)#9 | 944,917(0.02%)#979 |
| 10. | Herriman | 143 | 7,056(2.03%)#10 | 944,917(0.02%)#1,000 |
| 11. | Riverton | 139 | 7,056(1.97%)#11 | 944,917(0.01%)#1,038 |
| 12. | North Salt Lake | 138 | 7,056(1.96%)#12 | 944,917(0.01%)#1,048 |
| 13. | Cedar City | 125 | 7,056(1.77%)#13 | 944,917(0.01%)#1,154 |
| 14. | West Valley City | 122 | 7,056(1.73%)#14 | 944,917(0.01%)#1,176 |
| 15. | Logan | 116 | 7,056(1.64%)#15 | 944,917(0.01%)#1,231 |
| 16. | Roy | 114 | 7,056(1.62%)#16 | 944,917(0.01%)#1,260 |
| 17. | Provo | 111 | 7,056(1.57%)#17 | 944,917(0.01%)#1,283 |
| 18. | Kearns | 111 | 7,056(1.57%)#18 | 944,917(0.01%)#1,288 |
| 19. | Murray | 104 | 7,056(1.47%)#19 | 944,917(0.01%)#1,375 |
| 20. | Holladay | 101 | 7,056(1.43%)#20 | 944,917(0.01%)#1,425 |
| 21. | South Jordan | 99 | 7,056(1.40%)#21 | 944,917(0.01%)#1,451 |
| 22. | Washington | 95 | 7,056(1.35%)#22 | 944,917(0.01%)#1,526 |
| 23. | South Ogden | 91 | 7,056(1.29%)#23 | 944,917(0.01%)#1,590 |
| 24. | Park City | 90 | 7,056(1.28%)#24 | 944,917(0.01%)#1,612 |
| 25. | Summit Park | 88 | 7,056(1.25%)#25 | 944,917(0.01%)#1,644 |
| 26. | Tooele | 78 | 7,056(1.11%)#26 | 944,917(0.01%)#1,781 |
| 27. | Lehi | 68 | 7,056(0.96%)#27 | 944,917(0.01%)#1,984 |
| 28. | South Salt Lake | 66 | 7,056(0.94%)#28 | 944,917(0.01%)#2,030 |
| 29. | Spanish Fork | 62 | 7,056(0.88%)#29 | 944,917(0.01%)#2,130 |
| 30. | North Ogden | 61 | 7,056(0.86%)#30 | 944,917(0.01%)#2,173 |
| 31. | Springville | 60 | 7,056(0.85%)#31 | 944,917(0.01%)#2,197 |
| 32. | West Point | 59 | 7,056(0.84%)#32 | 944,917(0.01%)#2,238 |
| 33. | Taylorsville | 58 | 7,056(0.82%)#33 | 944,917(0.01%)#2,251 |
| 34. | Midvale | 58 | 7,056(0.82%)#34 | 944,917(0.01%)#2,256 |
| 35. | Apple Valley | 58 | 7,056(0.82%)#35 | 944,917(0.01%)#2,282 |
| 36. | Bountiful | 57 | 7,056(0.81%)#36 | 944,917(0.01%)#2,289 |
| 37. | Clinton | 56 | 7,056(0.79%)#37 | 944,917(0.01%)#2,329 |
| 38. | Smithfield | 53 | 7,056(0.75%)#38 | 944,917(0.01%)#2,434 |
| 39. | Snyderville | 52 | 7,056(0.74%)#39 | 944,917(0.01%)#2,481 |
| 40. | Pleasant View | 51 | 7,056(0.72%)#40 | 944,917(0.01%)#2,516 |
| 41. | Stansbury Park | 51 | 7,056(0.72%)#41 | 944,917(0.01%)#2,518 |
| 42. | Alpine | 50 | 7,056(0.71%)#42 | 944,917(0.01%)#2,551 |
| 43. | Pleasant Grove | 49 | 7,056(0.69%)#43 | 944,917(0.01%)#2,572 |
| 44. | American Fork | 44 | 7,056(0.62%)#44 | 944,917(0.00%)#2,763 |
| 45. | Highland | 42 | 7,056(0.60%)#45 | 944,917(0.00%)#2,852 |
| 46. | Ogden | 41 | 7,056(0.58%)#46 | 944,917(0.00%)#2,880 |
| 47. | Centerville | 38 | 7,056(0.54%)#47 | 944,917(0.00%)#3,029 |
| 48. | Eagle Mountain | 36 | 7,056(0.51%)#48 | 944,917(0.00%)#3,123 |
| 49. | Bluffdale | 36 | 7,056(0.51%)#49 | 944,917(0.00%)#3,137 |
| 50. | Brigham City | 34 | 7,056(0.48%)#50 | 944,917(0.00%)#3,227 |
| 51. | Mapleton | 31 | 7,056(0.44%)#51 | 944,917(0.00%)#3,435 |
| 52. | Farmington | 30 | 7,056(0.43%)#52 | 944,917(0.00%)#3,486 |
| 53. | Fairview | 30 | 7,056(0.43%)#53 | 944,917(0.00%)#3,528 |
| 54. | Hurricane | 28 | 7,056(0.40%)#54 | 944,917(0.00%)#3,620 |
| 55. | Syracuse | 27 | 7,056(0.38%)#55 | 944,917(0.00%)#3,670 |
| 56. | Fruit Heights | 27 | 7,056(0.38%)#56 | 944,917(0.00%)#3,712 |
| 57. | Tremonton | 25 | 7,056(0.35%)#57 | 944,917(0.00%)#3,843 |
| 58. | Enoch | 23 | 7,056(0.33%)#58 | 944,917(0.00%)#4,027 |
| 59. | Payson | 22 | 7,056(0.31%)#59 | 944,917(0.00%)#4,095 |
| 60. | Grantsville | 22 | 7,056(0.31%)#60 | 944,917(0.00%)#4,105 |
| 61. | Salem | 22 | 7,056(0.31%)#61 | 944,917(0.00%)#4,115 |
| 62. | Santa Clara | 22 | 7,056(0.31%)#62 | 944,917(0.00%)#4,122 |
| 63. | Delta | 20 | 7,056(0.28%)#63 | 944,917(0.00%)#4,342 |
| 64. | Kaysville | 19 | 7,056(0.27%)#64 | 944,917(0.00%)#4,385 |
| 65. | White | 19 | 7,056(0.27%)#65 | 944,917(0.00%)#4,443 |
| 66. | Saratoga Springs | 18 | 7,056(0.26%)#66 | 944,917(0.00%)#4,482 |
| 67. | Kanab | 18 | 7,056(0.26%)#67 | 944,917(0.00%)#4,548 |
| 68. | Mount Pleasant | 18 | 7,056(0.26%)#68 | 944,917(0.00%)#4,563 |
| 69. | Providence | 17 | 7,056(0.24%)#69 | 944,917(0.00%)#4,658 |
| 70. | La Verkin | 17 | 7,056(0.24%)#70 | 944,917(0.00%)#4,684 |
| 71. | Mountain Green | 17 | 7,056(0.24%)#71 | 944,917(0.00%)#4,691 |
| 72. | Silver Summit | 17 | 7,056(0.24%)#72 | 944,917(0.00%)#4,718 |
| 73. | Thatcher | 17 | 7,056(0.24%)#73 | 944,917(0.00%)#4,728 |
| 74. | Gunnison | 16 | 7,056(0.23%)#74 | 944,917(0.00%)#4,808 |
| 75. | Naples | 16 | 7,056(0.23%)#75 | 944,917(0.00%)#4,819 |
| 76. | Magna | 15 | 7,056(0.21%)#76 | 944,917(0.00%)#4,869 |
| 77. | Marriott Slaterville | 15 | 7,056(0.21%)#77 | 944,917(0.00%)#4,983 |
| 78. | Morgan | 14 | 7,056(0.20%)#78 | 944,917(0.00%)#5,104 |
| 79. | Farr West | 13 | 7,056(0.18%)#79 | 944,917(0.00%)#5,232 |
| 80. | Oakley | 13 | 7,056(0.18%)#80 | 944,917(0.00%)#5,297 |
| 81. | Genola | 12 | 7,056(0.17%)#81 | 944,917(0.00%)#5,478 |
| 82. | Clearfield | 11 | 7,056(0.16%)#82 | 944,917(0.00%)#5,531 |
| 83. | Milford | 11 | 7,056(0.16%)#83 | 944,917(0.00%)#5,678 |
| 84. | West Haven | 10 | 7,056(0.14%)#84 | 944,917(0.00%)#5,737 |
| 85. | Avon | 10 | 7,056(0.14%)#85 | 944,917(0.00%)#5,912 |
| 86. | Alta | 10 | 7,056(0.14%)#86 | 944,917(0.00%)#5,919 |
| 87. | South Weber | 9 | 7,056(0.13%)#87 | 944,917(0.00%)#5,989 |
| 88. | Emigration Canyon | 9 | 7,056(0.13%)#88 | 944,917(0.00%)#6,096 |
| 89. | Vineyard | 8 | 7,056(0.11%)#89 | 944,917(0.00%)#6,189 |
| 90. | North Logan | 8 | 7,056(0.11%)#90 | 944,917(0.00%)#6,195 |
| 91. | Elk Ridge | 8 | 7,056(0.11%)#91 | 944,917(0.00%)#6,248 |
| 92. | Woodland Hills | 8 | 7,056(0.11%)#92 | 944,917(0.00%)#6,331 |
| 93. | Teasdale | 8 | 7,056(0.11%)#93 | 944,917(0.00%)#6,380 |
| 94. | Cedar Hills | 7 | 7,056(0.10%)#94 | 944,917(0.00%)#6,422 |
| 95. | Roosevelt | 7 | 7,056(0.10%)#95 | 944,917(0.00%)#6,443 |
| 96. | Sunset | 7 | 7,056(0.10%)#96 | 944,917(0.00%)#6,454 |
| 97. | Fillmore | 7 | 7,056(0.10%)#97 | 944,917(0.00%)#6,508 |
| 98. | Sterling | 7 | 7,056(0.10%)#98 | 944,917(0.00%)#6,604 |
| 99. | Rockville | 7 | 7,056(0.10%)#99 | 944,917(0.00%)#6,613 |
| 100. | East Basin | 6 | 7,056(0.09%)#100 | 944,917(0.00%)#6,698 |
Common Questions
What are the Top 10 Cities with the Most Immigrants from Northern Europe in Utah?
Top 10 Cities with the Most Immigrants from Northern Europe in Utah are:
#1
778
#2
457
#3
330
#4
263
#5
251
#6
217
#7
166
#8
158
#9
147
#10
143
What city has the Most Immigrants from Northern Europe in Utah?
Salt Lake City has the Most Immigrants from Northern Europe in Utah with 778.
What is the Total Immigrants from Northern Europe in the State of Utah?
Total Immigrants from Northern Europe in Utah is 7,056.
What is the Total Immigrants from Northern Europe in the United States?
Total Immigrants from Northern Europe in the United States is 944,917.