Cities with the Most Immigrants from Northern Europe in Missouri
RELATED REPORTS & OPTIONS
Northern Europe
Missouri
Compare Cities
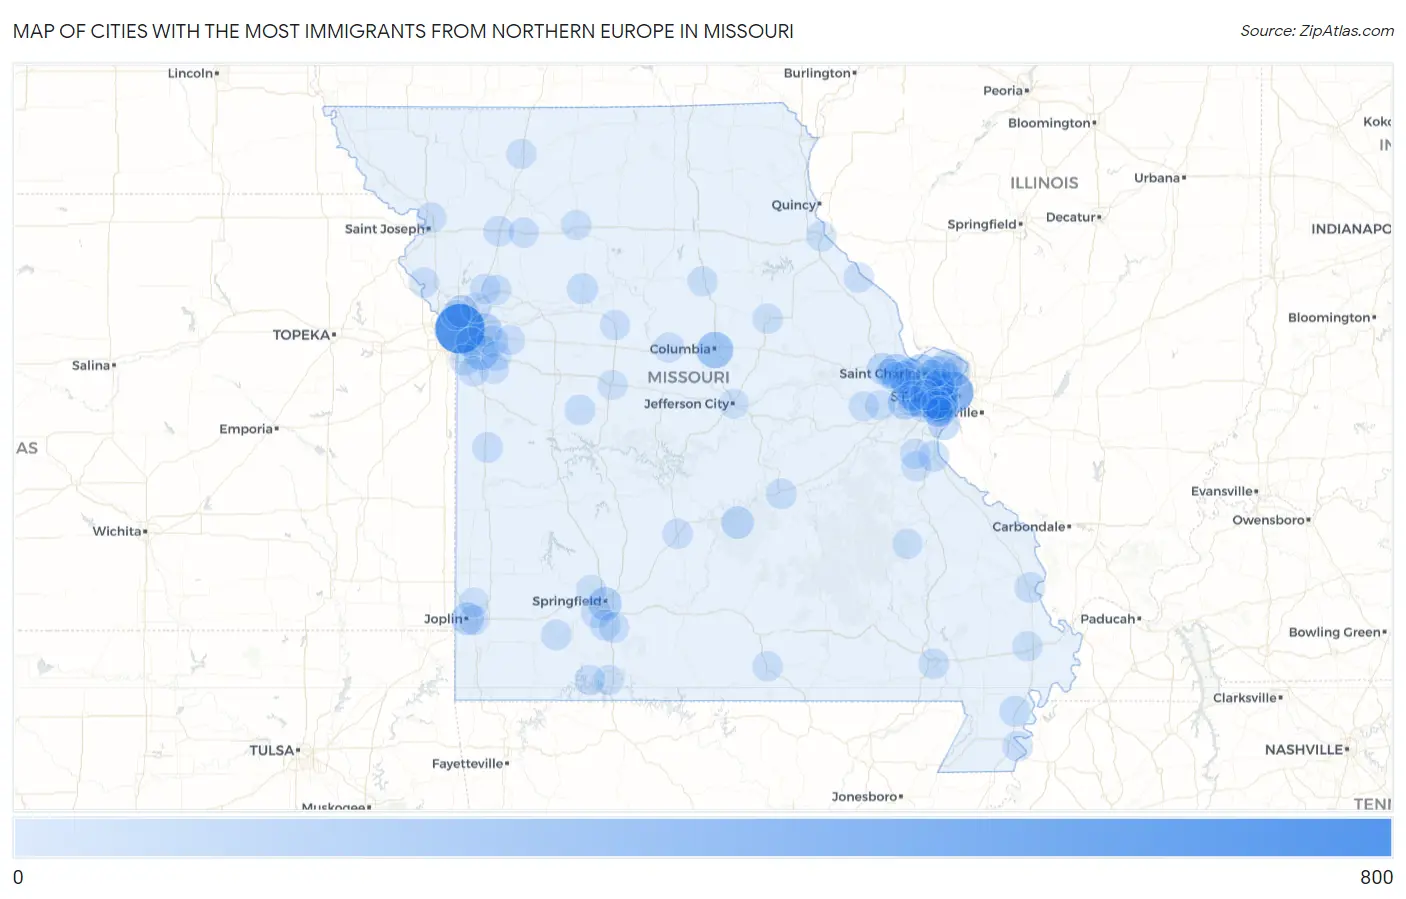
Map of Cities with the Most Immigrants from Northern Europe in Missouri
0
800
Cities with the Most Immigrants from Northern Europe in Missouri
| City | Northern Europe | vs State | vs National | |
| 1. | Kansas City | 711 | 6,498(10.94%)#1 | 944,917(0.08%)#133 |
| 2. | St Louis | 431 | 6,498(6.63%)#2 | 944,917(0.05%)#248 |
| 3. | Webster Groves | 270 | 6,498(4.16%)#3 | 944,917(0.03%)#469 |
| 4. | Columbia | 224 | 6,498(3.45%)#4 | 944,917(0.02%)#612 |
| 5. | Lee S Summit | 165 | 6,498(2.54%)#5 | 944,917(0.02%)#846 |
| 6. | St Charles | 158 | 6,498(2.43%)#6 | 944,917(0.02%)#901 |
| 7. | O Fallon | 157 | 6,498(2.42%)#7 | 944,917(0.02%)#908 |
| 8. | Chesterfield | 146 | 6,498(2.25%)#8 | 944,917(0.02%)#982 |
| 9. | Wildwood | 138 | 6,498(2.12%)#9 | 944,917(0.01%)#1,047 |
| 10. | Independence | 123 | 6,498(1.89%)#10 | 944,917(0.01%)#1,169 |
| 11. | Springfield | 116 | 6,498(1.79%)#11 | 944,917(0.01%)#1,230 |
| 12. | Cottleville | 107 | 6,498(1.65%)#12 | 944,917(0.01%)#1,343 |
| 13. | Clayton | 97 | 6,498(1.49%)#13 | 944,917(0.01%)#1,488 |
| 14. | Joplin | 89 | 6,498(1.37%)#14 | 944,917(0.01%)#1,618 |
| 15. | Fort Leonard Wood | 88 | 6,498(1.35%)#15 | 944,917(0.01%)#1,639 |
| 16. | Gladstone | 75 | 6,498(1.15%)#16 | 944,917(0.01%)#1,835 |
| 17. | Oakville | 74 | 6,498(1.14%)#17 | 944,917(0.01%)#1,847 |
| 18. | University City | 69 | 6,498(1.06%)#18 | 944,917(0.01%)#1,960 |
| 19. | Affton | 69 | 6,498(1.06%)#19 | 944,917(0.01%)#1,967 |
| 20. | St Peters | 67 | 6,498(1.03%)#20 | 944,917(0.01%)#2,004 |
| 21. | Florissant | 62 | 6,498(0.95%)#21 | 944,917(0.01%)#2,128 |
| 22. | Kirkwood | 61 | 6,498(0.94%)#22 | 944,917(0.01%)#2,165 |
| 23. | Ferguson | 59 | 6,498(0.91%)#23 | 944,917(0.01%)#2,232 |
| 24. | Wentzville | 58 | 6,498(0.89%)#24 | 944,917(0.01%)#2,254 |
| 25. | Maryland Heights | 49 | 6,498(0.75%)#25 | 944,917(0.01%)#2,575 |
| 26. | Creve Coeur | 47 | 6,498(0.72%)#26 | 944,917(0.00%)#2,648 |
| 27. | Blue Springs | 46 | 6,498(0.71%)#27 | 944,917(0.00%)#2,673 |
| 28. | Grandview | 43 | 6,498(0.66%)#28 | 944,917(0.00%)#2,802 |
| 29. | Old Jamestown | 42 | 6,498(0.65%)#29 | 944,917(0.00%)#2,851 |
| 30. | Dardenne Prairie | 42 | 6,498(0.65%)#30 | 944,917(0.00%)#2,858 |
| 31. | Overland | 40 | 6,498(0.62%)#31 | 944,917(0.00%)#2,931 |
| 32. | Manchester | 38 | 6,498(0.58%)#32 | 944,917(0.00%)#3,027 |
| 33. | Carrollton | 37 | 6,498(0.57%)#33 | 944,917(0.00%)#3,102 |
| 34. | Portageville | 34 | 6,498(0.52%)#34 | 944,917(0.00%)#3,274 |
| 35. | Festus | 30 | 6,498(0.46%)#35 | 944,917(0.00%)#3,493 |
| 36. | Richmond Heights | 29 | 6,498(0.45%)#36 | 944,917(0.00%)#3,562 |
| 37. | Shrewsbury | 29 | 6,498(0.45%)#37 | 944,917(0.00%)#3,575 |
| 38. | Ballwin | 27 | 6,498(0.42%)#38 | 944,917(0.00%)#3,671 |
| 39. | Crestwood | 27 | 6,498(0.42%)#39 | 944,917(0.00%)#3,686 |
| 40. | Aurora | 27 | 6,498(0.42%)#40 | 944,917(0.00%)#3,707 |
| 41. | Battlefield | 26 | 6,498(0.40%)#41 | 944,917(0.00%)#3,774 |
| 42. | Windsor | 26 | 6,498(0.40%)#42 | 944,917(0.00%)#3,789 |
| 43. | Cape Girardeau | 24 | 6,498(0.37%)#43 | 944,917(0.00%)#3,898 |
| 44. | Raytown | 24 | 6,498(0.37%)#44 | 944,917(0.00%)#3,900 |
| 45. | Nixa | 24 | 6,498(0.37%)#45 | 944,917(0.00%)#3,904 |
| 46. | Rolla | 23 | 6,498(0.35%)#46 | 944,917(0.00%)#3,997 |
| 47. | Bridgeton | 22 | 6,498(0.34%)#47 | 944,917(0.00%)#4,107 |
| 48. | Butler | 22 | 6,498(0.34%)#48 | 944,917(0.00%)#4,142 |
| 49. | Ozark | 21 | 6,498(0.32%)#49 | 944,917(0.00%)#4,183 |
| 50. | St John | 21 | 6,498(0.32%)#50 | 944,917(0.00%)#4,210 |
| 51. | Ellisville | 19 | 6,498(0.29%)#51 | 944,917(0.00%)#4,422 |
| 52. | Clarkson Valley | 19 | 6,498(0.29%)#52 | 944,917(0.00%)#4,457 |
| 53. | Hazelwood | 18 | 6,498(0.28%)#53 | 944,917(0.00%)#4,487 |
| 54. | Poplar Bluff | 18 | 6,498(0.28%)#54 | 944,917(0.00%)#4,504 |
| 55. | Cameron | 18 | 6,498(0.28%)#55 | 944,917(0.00%)#4,523 |
| 56. | Sappington | 18 | 6,498(0.28%)#56 | 944,917(0.00%)#4,533 |
| 57. | Lebanon | 17 | 6,498(0.26%)#57 | 944,917(0.00%)#4,630 |
| 58. | Pleasant Hill | 17 | 6,498(0.26%)#58 | 944,917(0.00%)#4,655 |
| 59. | Raymore | 16 | 6,498(0.25%)#59 | 944,917(0.00%)#4,745 |
| 60. | Weldon Spring | 16 | 6,498(0.25%)#60 | 944,917(0.00%)#4,787 |
| 61. | Green Park | 16 | 6,498(0.25%)#61 | 944,917(0.00%)#4,822 |
| 62. | Lake Timberline | 15 | 6,498(0.23%)#62 | 944,917(0.00%)#5,005 |
| 63. | Caruthersville | 14 | 6,498(0.22%)#63 | 944,917(0.00%)#5,088 |
| 64. | Weston | 14 | 6,498(0.22%)#64 | 944,917(0.00%)#5,154 |
| 65. | West Plains | 13 | 6,498(0.20%)#65 | 944,917(0.00%)#5,206 |
| 66. | Mexico | 13 | 6,498(0.20%)#66 | 944,917(0.00%)#5,208 |
| 67. | Chillicothe | 13 | 6,498(0.20%)#67 | 944,917(0.00%)#5,217 |
| 68. | De Soto | 13 | 6,498(0.20%)#68 | 944,917(0.00%)#5,242 |
| 69. | Moberly | 12 | 6,498(0.18%)#69 | 944,917(0.00%)#5,364 |
| 70. | Willard | 12 | 6,498(0.18%)#70 | 944,917(0.00%)#5,405 |
| 71. | Washington | 11 | 6,498(0.17%)#71 | 944,917(0.00%)#5,553 |
| 72. | Boonville | 11 | 6,498(0.17%)#72 | 944,917(0.00%)#5,591 |
| 73. | Hillsboro | 11 | 6,498(0.17%)#73 | 944,917(0.00%)#5,632 |
| 74. | Lake Lotawana | 11 | 6,498(0.17%)#74 | 944,917(0.00%)#5,639 |
| 75. | Lake St Louis | 10 | 6,498(0.15%)#75 | 944,917(0.00%)#5,742 |
| 76. | Hannibal | 10 | 6,498(0.15%)#76 | 944,917(0.00%)#5,743 |
| 77. | Marshall | 9 | 6,498(0.14%)#77 | 944,917(0.00%)#5,952 |
| 78. | Valley Park | 9 | 6,498(0.14%)#78 | 944,917(0.00%)#5,994 |
| 79. | Louisiana | 9 | 6,498(0.14%)#79 | 944,917(0.00%)#6,054 |
| 80. | Hamilton | 9 | 6,498(0.14%)#80 | 944,917(0.00%)#6,088 |
| 81. | Ironton | 9 | 6,498(0.14%)#81 | 944,917(0.00%)#6,092 |
| 82. | Concord | 8 | 6,498(0.12%)#82 | 944,917(0.00%)#6,168 |
| 83. | Kearney | 8 | 6,498(0.12%)#83 | 944,917(0.00%)#6,198 |
| 84. | Sikeston | 7 | 6,498(0.11%)#84 | 944,917(0.00%)#6,406 |
| 85. | Branson | 7 | 6,498(0.11%)#85 | 944,917(0.00%)#6,410 |
| 86. | Town And Country | 7 | 6,498(0.11%)#86 | 944,917(0.00%)#6,419 |
| 87. | Kimberling City | 7 | 6,498(0.11%)#87 | 944,917(0.00%)#6,507 |
| 88. | Duquesne | 7 | 6,498(0.11%)#88 | 944,917(0.00%)#6,518 |
| 89. | Liberty | 6 | 6,498(0.09%)#89 | 944,917(0.00%)#6,622 |
| 90. | Spanish Lake | 6 | 6,498(0.09%)#90 | 944,917(0.00%)#6,635 |
| 91. | Excelsior Springs | 6 | 6,498(0.09%)#91 | 944,917(0.00%)#6,652 |
| 92. | Oak Grove | 6 | 6,498(0.09%)#92 | 944,917(0.00%)#6,664 |
| 93. | Country Club | 6 | 6,498(0.09%)#93 | 944,917(0.00%)#6,704 |
| 94. | Jefferson City | 5 | 6,498(0.08%)#94 | 944,917(0.00%)#6,874 |
| 95. | Bethany | 5 | 6,498(0.08%)#95 | 944,917(0.00%)#6,949 |
| 96. | Oronogo | 5 | 6,498(0.08%)#96 | 944,917(0.00%)#6,972 |
| 97. | Oakland | 5 | 6,498(0.08%)#97 | 944,917(0.00%)#7,016 |
| 98. | Northmoor | 5 | 6,498(0.08%)#98 | 944,917(0.00%)#7,094 |
| 99. | Augusta | 5 | 6,498(0.08%)#99 | 944,917(0.00%)#7,100 |
| 100. | Sedalia | 4 | 6,498(0.06%)#100 | 944,917(0.00%)#7,121 |
Common Questions
What are the Top 10 Cities with the Most Immigrants from Northern Europe in Missouri?
Top 10 Cities with the Most Immigrants from Northern Europe in Missouri are:
#1
711
#2
431
#3
270
#4
224
#5
165
#6
158
#7
157
#8
146
#9
138
#10
123
What city has the Most Immigrants from Northern Europe in Missouri?
Kansas City has the Most Immigrants from Northern Europe in Missouri with 711.
What is the Total Immigrants from Northern Europe in the State of Missouri?
Total Immigrants from Northern Europe in Missouri is 6,498.
What is the Total Immigrants from Northern Europe in the United States?
Total Immigrants from Northern Europe in the United States is 944,917.