Cities with the Most Immigrants from Northern Europe in Pennsylvania
RELATED REPORTS & OPTIONS
Northern Europe
Pennsylvania
Compare Cities
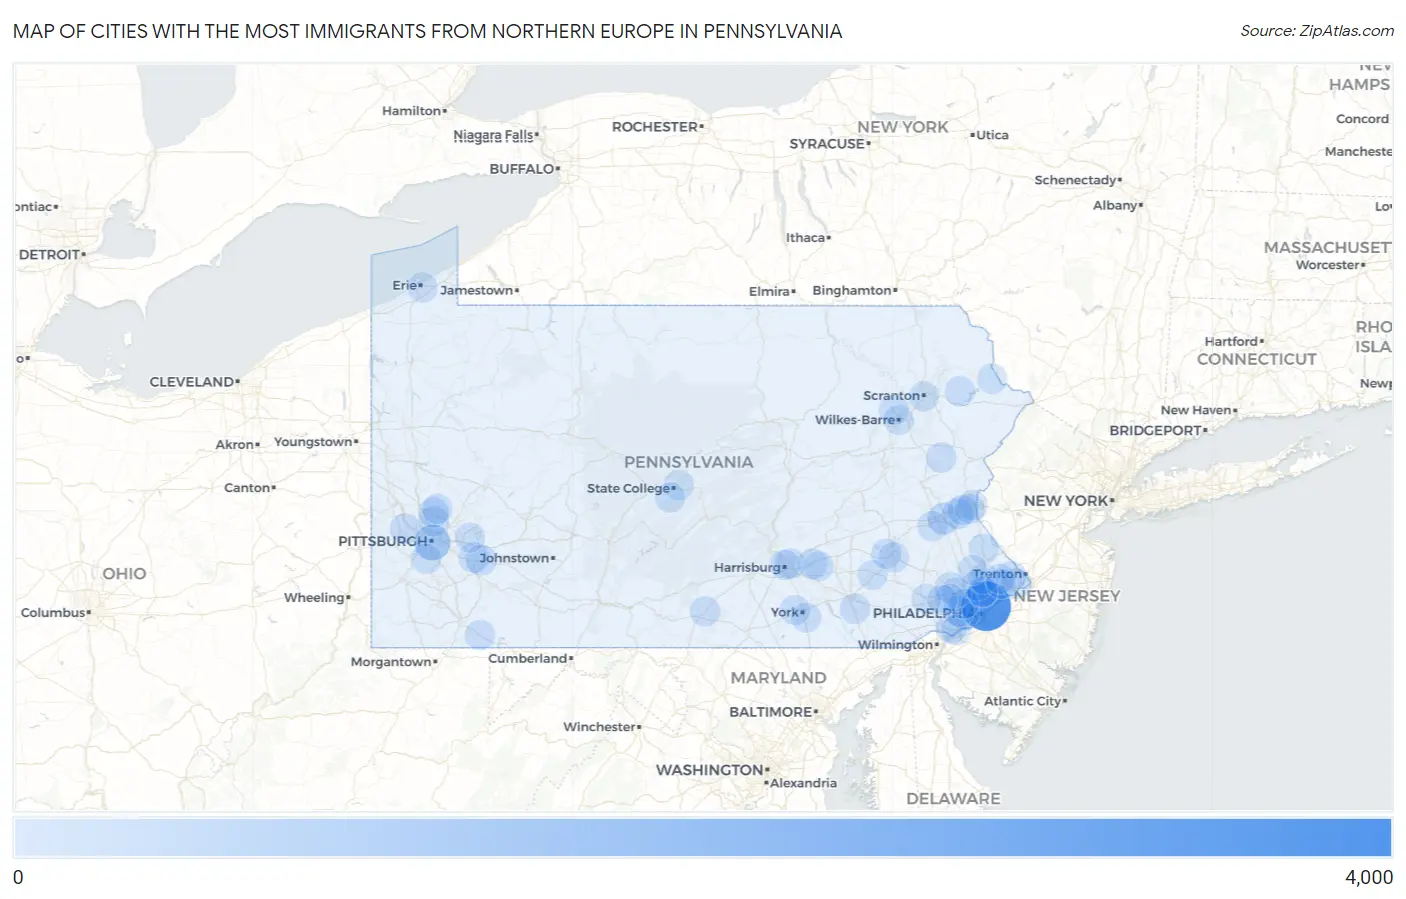
Map of Cities with the Most Immigrants from Northern Europe in Pennsylvania
0
4,000
Cities with the Most Immigrants from Northern Europe in Pennsylvania
| City | Northern Europe | vs State | vs National | |
| 1. | Philadelphia | 3,134 | 28,221(11.11%)#1 | 944,917(0.33%)#16 |
| 2. | Pittsburgh | 900 | 28,221(3.19%)#2 | 944,917(0.10%)#97 |
| 3. | State College Borough | 321 | 28,221(1.14%)#3 | 944,917(0.03%)#373 |
| 4. | Allentown | 314 | 28,221(1.11%)#4 | 944,917(0.03%)#379 |
| 5. | Doylestown Borough | 261 | 28,221(0.92%)#5 | 944,917(0.03%)#496 |
| 6. | Elizabethtown Borough | 208 | 28,221(0.74%)#6 | 944,917(0.02%)#669 |
| 7. | Drexel Hill | 200 | 28,221(0.71%)#7 | 944,917(0.02%)#701 |
| 8. | Bethlehem | 188 | 28,221(0.67%)#8 | 944,917(0.02%)#746 |
| 9. | Economy Borough | 157 | 28,221(0.56%)#9 | 944,917(0.02%)#911 |
| 10. | Emmaus Borough | 150 | 28,221(0.53%)#10 | 944,917(0.02%)#963 |
| 11. | Village Green Green Ridge | 143 | 28,221(0.51%)#11 | 944,917(0.02%)#1,011 |
| 12. | Jeannette | 139 | 28,221(0.49%)#12 | 944,917(0.01%)#1,042 |
| 13. | Wayne | 133 | 28,221(0.47%)#13 | 944,917(0.01%)#1,087 |
| 14. | Fort Washington | 131 | 28,221(0.46%)#14 | 944,917(0.01%)#1,109 |
| 15. | Conshohocken Borough | 121 | 28,221(0.43%)#15 | 944,917(0.01%)#1,187 |
| 16. | Allison Park | 119 | 28,221(0.42%)#16 | 944,917(0.01%)#1,207 |
| 17. | Greensburg | 111 | 28,221(0.39%)#17 | 944,917(0.01%)#1,291 |
| 18. | St. Davids | 101 | 28,221(0.36%)#18 | 944,917(0.01%)#1,437 |
| 19. | Willow Street | 98 | 28,221(0.35%)#19 | 944,917(0.01%)#1,474 |
| 20. | Glenside | 98 | 28,221(0.35%)#20 | 944,917(0.01%)#1,475 |
| 21. | Broomall | 97 | 28,221(0.34%)#21 | 944,917(0.01%)#1,492 |
| 22. | Audubon | 97 | 28,221(0.34%)#22 | 944,917(0.01%)#1,493 |
| 23. | Rosemont | 96 | 28,221(0.34%)#23 | 944,917(0.01%)#1,516 |
| 24. | Lititz Borough | 90 | 28,221(0.32%)#24 | 944,917(0.01%)#1,611 |
| 25. | Tarentum Borough | 90 | 28,221(0.32%)#25 | 944,917(0.01%)#1,615 |
| 26. | King Of Prussia | 89 | 28,221(0.32%)#26 | 944,917(0.01%)#1,622 |
| 27. | Carnot Moon | 89 | 28,221(0.32%)#27 | 944,917(0.01%)#1,629 |
| 28. | Levittown | 83 | 28,221(0.29%)#28 | 944,917(0.01%)#1,705 |
| 29. | Progress | 82 | 28,221(0.29%)#29 | 944,917(0.01%)#1,722 |
| 30. | Reading | 74 | 28,221(0.26%)#30 | 944,917(0.01%)#1,844 |
| 31. | Lansdale Borough | 72 | 28,221(0.26%)#31 | 944,917(0.01%)#1,897 |
| 32. | Indian Mountain Lake | 71 | 28,221(0.25%)#32 | 944,917(0.01%)#1,931 |
| 33. | Erie | 69 | 28,221(0.24%)#33 | 944,917(0.01%)#1,956 |
| 34. | Farmington | 68 | 28,221(0.24%)#34 | 944,917(0.01%)#2,001 |
| 35. | West Chester Borough | 64 | 28,221(0.23%)#35 | 944,917(0.01%)#2,080 |
| 36. | Chester | 63 | 28,221(0.22%)#36 | 944,917(0.01%)#2,098 |
| 37. | Hershey | 63 | 28,221(0.22%)#37 | 944,917(0.01%)#2,106 |
| 38. | Scranton | 60 | 28,221(0.21%)#38 | 944,917(0.01%)#2,195 |
| 39. | East Stroudsburg Borough | 58 | 28,221(0.21%)#39 | 944,917(0.01%)#2,271 |
| 40. | Woodbourne | 58 | 28,221(0.21%)#40 | 944,917(0.01%)#2,275 |
| 41. | The Hideout | 57 | 28,221(0.20%)#41 | 944,917(0.01%)#2,320 |
| 42. | Lemont | 55 | 28,221(0.19%)#42 | 944,917(0.01%)#2,376 |
| 43. | Ancient Oaks | 53 | 28,221(0.19%)#43 | 944,917(0.01%)#2,443 |
| 44. | Swarthmore Borough | 50 | 28,221(0.18%)#44 | 944,917(0.01%)#2,560 |
| 45. | Olyphant Borough | 50 | 28,221(0.18%)#45 | 944,917(0.01%)#2,562 |
| 46. | Kenhorst Borough | 50 | 28,221(0.18%)#46 | 944,917(0.01%)#2,565 |
| 47. | Easton | 49 | 28,221(0.17%)#47 | 944,917(0.01%)#2,574 |
| 48. | Horsham | 49 | 28,221(0.17%)#48 | 944,917(0.01%)#2,581 |
| 49. | Newtown Borough | 47 | 28,221(0.17%)#49 | 944,917(0.00%)#2,668 |
| 50. | Harveys Lake Borough | 46 | 28,221(0.16%)#50 | 944,917(0.00%)#2,700 |
| 51. | Norwood Borough | 45 | 28,221(0.16%)#51 | 944,917(0.00%)#2,736 |
| 52. | New Freedom Borough | 45 | 28,221(0.16%)#52 | 944,917(0.00%)#2,741 |
| 53. | Narberth Borough | 45 | 28,221(0.16%)#53 | 944,917(0.00%)#2,742 |
| 54. | Reamstown | 45 | 28,221(0.16%)#54 | 944,917(0.00%)#2,748 |
| 55. | Media Borough | 44 | 28,221(0.16%)#55 | 944,917(0.00%)#2,783 |
| 56. | Gibsonia | 44 | 28,221(0.16%)#56 | 944,917(0.00%)#2,791 |
| 57. | Scotland | 44 | 28,221(0.16%)#57 | 944,917(0.00%)#2,795 |
| 58. | Gettysburg Borough | 43 | 28,221(0.15%)#58 | 944,917(0.00%)#2,820 |
| 59. | Spring Ridge | 43 | 28,221(0.15%)#59 | 944,917(0.00%)#2,837 |
| 60. | Bethel Park | 42 | 28,221(0.15%)#60 | 944,917(0.00%)#2,843 |
| 61. | Oakmont Borough | 42 | 28,221(0.15%)#61 | 944,917(0.00%)#2,872 |
| 62. | Pleasant Hills Borough | 40 | 28,221(0.14%)#62 | 944,917(0.00%)#2,942 |
| 63. | Bakerstown | 40 | 28,221(0.14%)#63 | 944,917(0.00%)#2,953 |
| 64. | Denver Borough | 39 | 28,221(0.14%)#64 | 944,917(0.00%)#2,997 |
| 65. | Pine Grove Mills | 39 | 28,221(0.14%)#65 | 944,917(0.00%)#3,004 |
| 66. | Bryn Mawr | 38 | 28,221(0.13%)#66 | 944,917(0.00%)#3,047 |
| 67. | Chalfont Borough | 38 | 28,221(0.13%)#67 | 944,917(0.00%)#3,050 |
| 68. | Shiloh | 37 | 28,221(0.13%)#68 | 944,917(0.00%)#3,078 |
| 69. | Lansdowne Borough | 37 | 28,221(0.13%)#69 | 944,917(0.00%)#3,079 |
| 70. | Campbelltown | 37 | 28,221(0.13%)#70 | 944,917(0.00%)#3,093 |
| 71. | Wilkes Barre | 36 | 28,221(0.13%)#71 | 944,917(0.00%)#3,124 |
| 72. | West Mifflin Borough | 36 | 28,221(0.13%)#72 | 944,917(0.00%)#3,133 |
| 73. | Plumsteadville | 36 | 28,221(0.13%)#73 | 944,917(0.00%)#3,161 |
| 74. | Fawn Lake Forest | 36 | 28,221(0.13%)#74 | 944,917(0.00%)#3,167 |
| 75. | Harrisburg | 35 | 28,221(0.12%)#75 | 944,917(0.00%)#3,171 |
| 76. | Devon | 35 | 28,221(0.12%)#76 | 944,917(0.00%)#3,206 |
| 77. | Murrysville | 34 | 28,221(0.12%)#77 | 944,917(0.00%)#3,226 |
| 78. | Hanover Borough | 34 | 28,221(0.12%)#78 | 944,917(0.00%)#3,232 |
| 79. | Darby Borough | 34 | 28,221(0.12%)#79 | 944,917(0.00%)#3,241 |
| 80. | Middletown | 34 | 28,221(0.12%)#80 | 944,917(0.00%)#3,255 |
| 81. | Jenkintown Borough | 34 | 28,221(0.12%)#81 | 944,917(0.00%)#3,267 |
| 82. | Wyncote | 34 | 28,221(0.12%)#82 | 944,917(0.00%)#3,269 |
| 83. | Lionville | 33 | 28,221(0.12%)#83 | 944,917(0.00%)#3,328 |
| 84. | Dickson City Borough | 33 | 28,221(0.12%)#84 | 944,917(0.00%)#3,332 |
| 85. | Trevose | 33 | 28,221(0.12%)#85 | 944,917(0.00%)#3,336 |
| 86. | Morrisville Borough | 32 | 28,221(0.11%)#86 | 944,917(0.00%)#3,381 |
| 87. | Old Orchard | 32 | 28,221(0.11%)#87 | 944,917(0.00%)#3,403 |
| 88. | Pottstown Borough | 31 | 28,221(0.11%)#88 | 944,917(0.00%)#3,418 |
| 89. | Wilson Borough | 31 | 28,221(0.11%)#89 | 944,917(0.00%)#3,444 |
| 90. | Chestnut Hill | 31 | 28,221(0.11%)#90 | 944,917(0.00%)#3,452 |
| 91. | Paoli | 31 | 28,221(0.11%)#91 | 944,917(0.00%)#3,457 |
| 92. | Churchville | 31 | 28,221(0.11%)#92 | 944,917(0.00%)#3,458 |
| 93. | Merion Station | 31 | 28,221(0.11%)#93 | 944,917(0.00%)#3,462 |
| 94. | Throop Borough | 31 | 28,221(0.11%)#94 | 944,917(0.00%)#3,466 |
| 95. | Yardley Borough | 31 | 28,221(0.11%)#95 | 944,917(0.00%)#3,471 |
| 96. | Trucksville | 31 | 28,221(0.11%)#96 | 944,917(0.00%)#3,473 |
| 97. | Churchill Borough | 30 | 28,221(0.11%)#97 | 944,917(0.00%)#3,516 |
| 98. | Tyler Run | 30 | 28,221(0.11%)#98 | 944,917(0.00%)#3,525 |
| 99. | Montgomeryville | 29 | 28,221(0.10%)#99 | 944,917(0.00%)#3,550 |
| 100. | Perkasie Borough | 29 | 28,221(0.10%)#100 | 944,917(0.00%)#3,563 |
Common Questions
What are the Top 10 Cities with the Most Immigrants from Northern Europe in Pennsylvania?
Top 10 Cities with the Most Immigrants from Northern Europe in Pennsylvania are:
#1
3,134
#2
900
#3
314
#4
200
#5
188
#6
143
#7
139
#8
131
#9
119
#10
111
What city has the Most Immigrants from Northern Europe in Pennsylvania?
Philadelphia has the Most Immigrants from Northern Europe in Pennsylvania with 3,134.
What is the Total Immigrants from Northern Europe in the State of Pennsylvania?
Total Immigrants from Northern Europe in Pennsylvania is 28,221.
What is the Total Immigrants from Northern Europe in the United States?
Total Immigrants from Northern Europe in the United States is 944,917.